Esko, MN Map & Demographics
Esko Map
Esko Overview
$42,529
PER CAPITA INCOME
$106,875
AVG FAMILY INCOME
$100,227
AVG HOUSEHOLD INCOME
9.1%
WAGE / INCOME GAP [ % ]
90.9¢/ $1
WAGE / INCOME GAP [ $ ]
0.30
INEQUALITY / GINI INDEX
2,172
TOTAL POPULATION
1,182
MALE POPULATION
990
FEMALE POPULATION
119.39
MALES / 100 FEMALES
83.76
FEMALES / 100 MALES
46.3
MEDIAN AGE
2.7
AVG FAMILY SIZE
2.5
AVG HOUSEHOLD SIZE
1,250
LABOR FORCE [ PEOPLE ]
70.4%
PERCENT IN LABOR FORCE
1.0%
UNEMPLOYMENT RATE
Esko Zip Codes
Esko Area Codes
Income in Esko
Income Overview in Esko
Per Capita Income in Esko is $42,529, while median incomes of families and households are $106,875 and $100,227 respectively.
| Characteristic | Number | Measure |
| Per Capita Income | 2,172 | $42,529 |
| Median Family Income | 694 | $106,875 |
| Mean Family Income | 694 | $114,255 |
| Median Household Income | 876 | $100,227 |
| Mean Household Income | 876 | $110,636 |
| Income Deficit | 694 | $0 |
| Wage / Income Gap (%) | 2,172 | 9.11% |
| Wage / Income Gap ($) | 2,172 | 90.89¢ per $1 |
| Gini / Inequality Index | 2,172 | 0.30 |
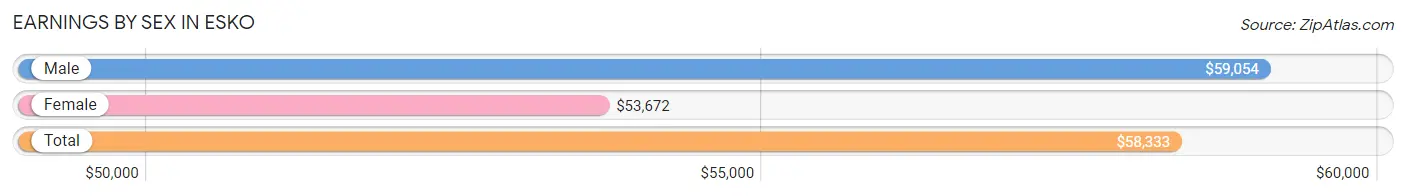
Earnings by Sex in Esko
Average Earnings in Esko are $58,333, $59,054 for men and $53,672 for women, a difference of 9.1%.
| Sex | Number | Average Earnings |
| Male | 706 (53.3%) | $59,054 |
| Female | 618 (46.7%) | $53,672 |
| Total | 1,324 (100.0%) | $58,333 |
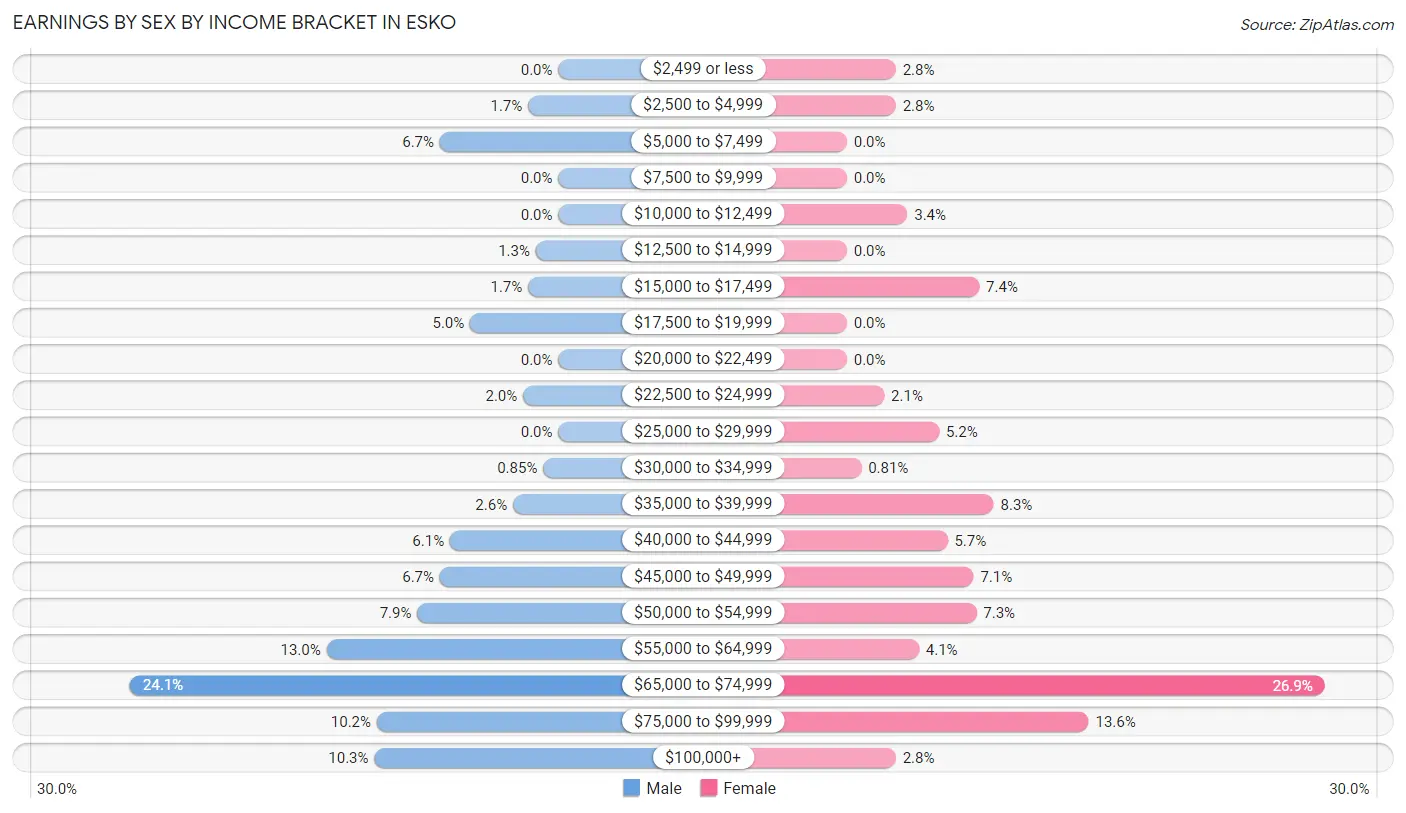
Earnings by Sex by Income Bracket in Esko
The most common earnings brackets in Esko are $65,000 to $74,999 for men (170 | 24.1%) and $65,000 to $74,999 for women (166 | 26.9%).
| Income | Male | Female |
| $2,499 or less | 0 (0.0%) | 17 (2.8%) |
| $2,500 to $4,999 | 12 (1.7%) | 17 (2.8%) |
| $5,000 to $7,499 | 47 (6.7%) | 0 (0.0%) |
| $7,500 to $9,999 | 0 (0.0%) | 0 (0.0%) |
| $10,000 to $12,499 | 0 (0.0%) | 21 (3.4%) |
| $12,500 to $14,999 | 9 (1.3%) | 0 (0.0%) |
| $15,000 to $17,499 | 12 (1.7%) | 46 (7.4%) |
| $17,500 to $19,999 | 35 (5.0%) | 0 (0.0%) |
| $20,000 to $22,499 | 0 (0.0%) | 0 (0.0%) |
| $22,500 to $24,999 | 14 (2.0%) | 13 (2.1%) |
| $25,000 to $29,999 | 0 (0.0%) | 32 (5.2%) |
| $30,000 to $34,999 | 6 (0.9%) | 5 (0.8%) |
| $35,000 to $39,999 | 18 (2.5%) | 51 (8.3%) |
| $40,000 to $44,999 | 43 (6.1%) | 35 (5.7%) |
| $45,000 to $49,999 | 47 (6.7%) | 44 (7.1%) |
| $50,000 to $54,999 | 56 (7.9%) | 45 (7.3%) |
| $55,000 to $64,999 | 92 (13.0%) | 25 (4.1%) |
| $65,000 to $74,999 | 170 (24.1%) | 166 (26.9%) |
| $75,000 to $99,999 | 72 (10.2%) | 84 (13.6%) |
| $100,000+ | 73 (10.3%) | 17 (2.8%) |
| Total | 706 (100.0%) | 618 (100.0%) |
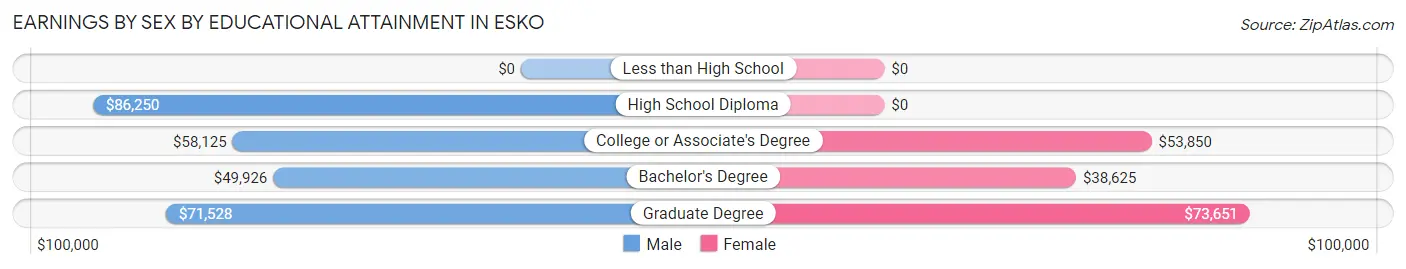
Earnings by Sex by Educational Attainment in Esko
Average earnings in Esko are $64,375 for men and $54,414 for women, a difference of 15.5%. Men with an educational attainment of high school diploma enjoy the highest average annual earnings of $86,250, while those with bachelor's degree education earn the least with $49,926. Women with an educational attainment of graduate degree earn the most with the average annual earnings of $73,651, while those with bachelor's degree education have the smallest earnings of $38,625.
| Educational Attainment | Male Income | Female Income |
| Less than High School | - | - |
| High School Diploma | $86,250 | $0 |
| College or Associate's Degree | $58,125 | $53,850 |
| Bachelor's Degree | $49,926 | $38,625 |
| Graduate Degree | $71,528 | $73,651 |
| Total | $64,375 | $54,414 |
Family Income in Esko
Family Income Brackets in Esko
According to the Esko family income data, there are 241 families falling into the $100,000 to $149,999 income range, which is the most common income bracket and makes up 34.7% of all families.
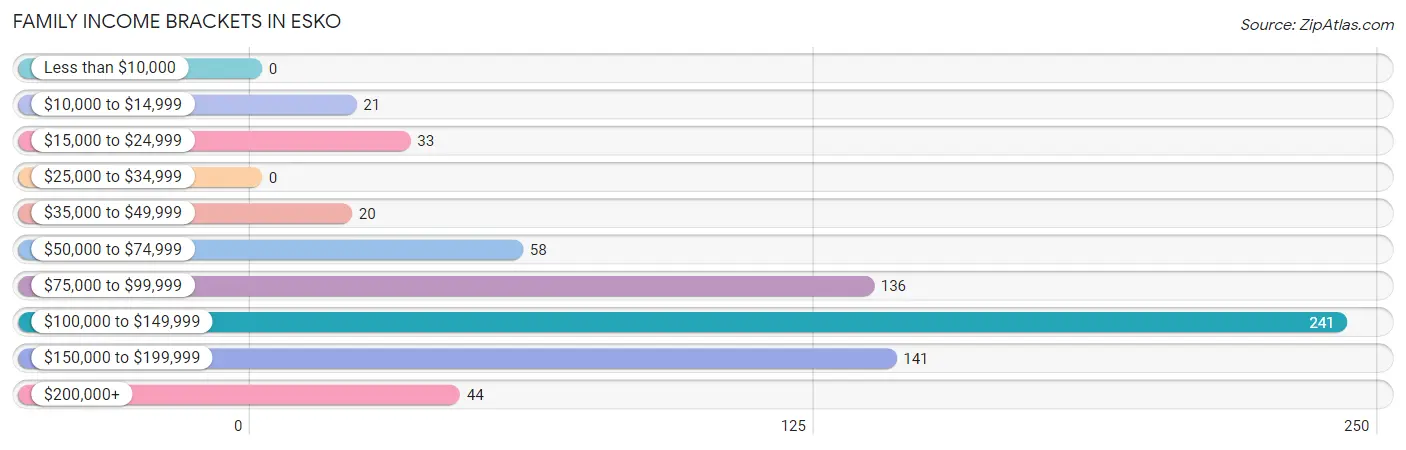
| Income Bracket | # Families | % Families |
| Less than $10,000 | 0 | 0.0% |
| $10,000 to $14,999 | 21 | 3.0% |
| $15,000 to $24,999 | 33 | 4.8% |
| $25,000 to $34,999 | 0 | 0.0% |
| $35,000 to $49,999 | 20 | 2.9% |
| $50,000 to $74,999 | 58 | 8.4% |
| $75,000 to $99,999 | 136 | 19.6% |
| $100,000 to $149,999 | 241 | 34.7% |
| $150,000 to $199,999 | 141 | 20.3% |
| $200,000+ | 44 | 6.3% |
Family Income by Famaliy Size in Esko
2-person families (250 | 36.0%) account for the highest median family income in Esko with $111,000 per family, while 2-person families (250 | 36.0%) have the highest median income of $55,500 per family member.
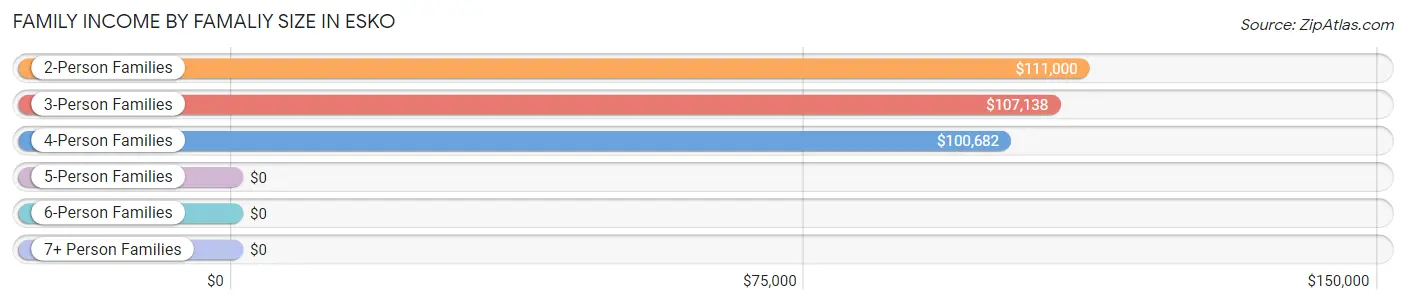
| Income Bracket | # Families | Median Income |
| 2-Person Families | 250 (36.0%) | $111,000 |
| 3-Person Families | 222 (32.0%) | $107,138 |
| 4-Person Families | 218 (31.4%) | $100,682 |
| 5-Person Families | 0 (0.0%) | $0 |
| 6-Person Families | 4 (0.6%) | $0 |
| 7+ Person Families | 0 (0.0%) | $0 |
| Total | 694 (100.0%) | $106,875 |
Family Income by Number of Earners in Esko
The median family income in Esko is $106,875, with families comprising 2 earners (323) having the highest median family income of $130,820, while families with 1 earner (138) have the lowest median family income of $58,300, accounting for 46.5% and 19.9% of families, respectively.

| Number of Earners | # Families | Median Income |
| No Earners | 96 (13.8%) | $111,833 |
| 1 Earner | 138 (19.9%) | $58,300 |
| 2 Earners | 323 (46.5%) | $130,820 |
| 3+ Earners | 137 (19.7%) | $106,793 |
| Total | 694 (100.0%) | $106,875 |
Household Income in Esko
Household Income Brackets in Esko
With 231 households falling in the category, the $150,000 to $199,999 income range is the most frequent in Esko, accounting for 26.4% of all households.
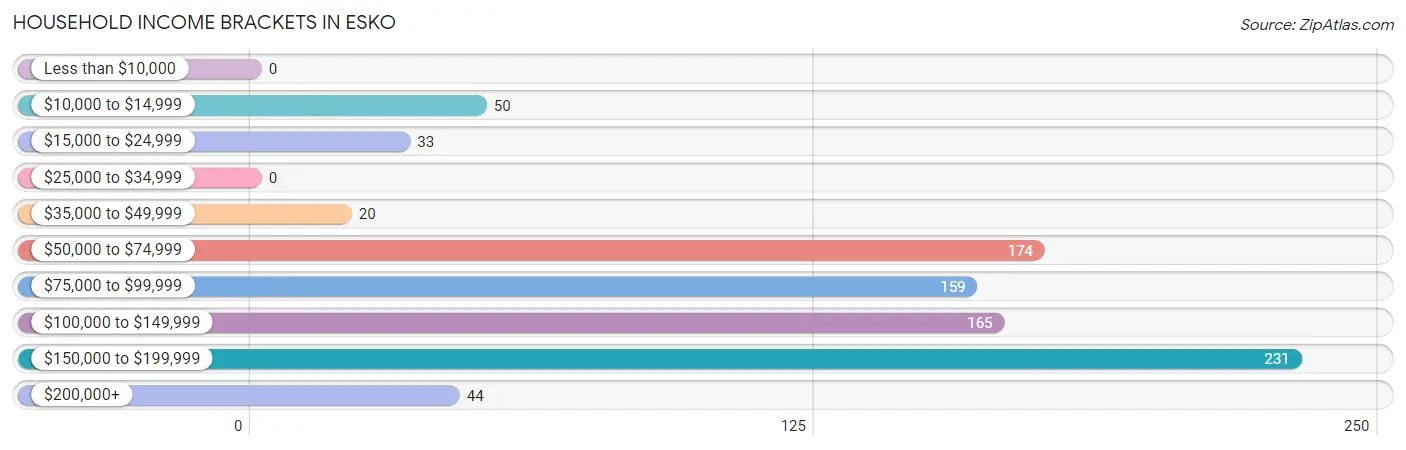
| Income Bracket | # Households | % Households |
| Less than $10,000 | 0 | 0.0% |
| $10,000 to $14,999 | 50 | 5.7% |
| $15,000 to $24,999 | 33 | 3.8% |
| $25,000 to $34,999 | 0 | 0.0% |
| $35,000 to $49,999 | 20 | 2.3% |
| $50,000 to $74,999 | 174 | 19.9% |
| $75,000 to $99,999 | 159 | 18.2% |
| $100,000 to $149,999 | 165 | 18.8% |
| $150,000 to $199,999 | 231 | 26.4% |
| $200,000+ | 44 | 5.0% |
Household Income by Householder Age in Esko
The median household income in Esko is $100,227, with the highest median household income of $132,404 found in the 45 to 64 years age bracket for the primary householder. A total of 469 households (53.5%) fall into this category. Meanwhile, the 15 to 24 years age bracket for the primary householder has the lowest median household income of $0, with 39 households (4.4%) in this group.
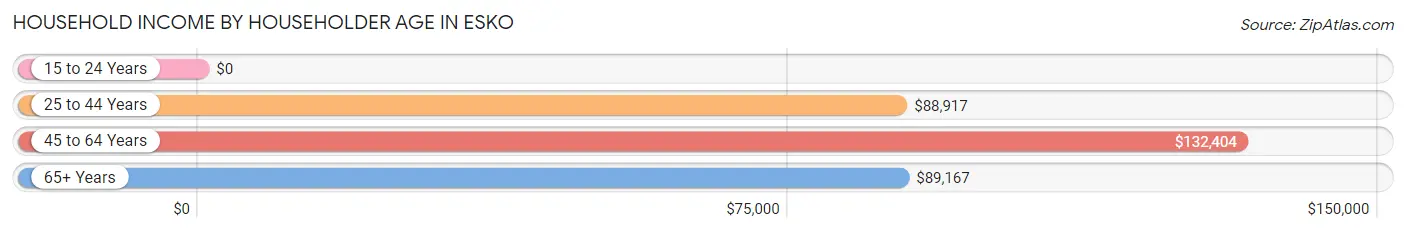
| Income Bracket | # Households | Median Income |
| 15 to 24 Years | 39 (4.4%) | $0 |
| 25 to 44 Years | 162 (18.5%) | $88,917 |
| 45 to 64 Years | 469 (53.5%) | $132,404 |
| 65+ Years | 206 (23.5%) | $89,167 |
| Total | 876 (100.0%) | $100,227 |
Poverty in Esko
Income Below Poverty by Sex and Age in Esko
With 3.4% poverty level for males and 3.2% for females among the residents of Esko, 6 to 11 year old males and 55 to 64 year old females are the most vulnerable to poverty, with 40 males (25.5%) and 11 females (13.3%) in their respective age groups living below the poverty level.
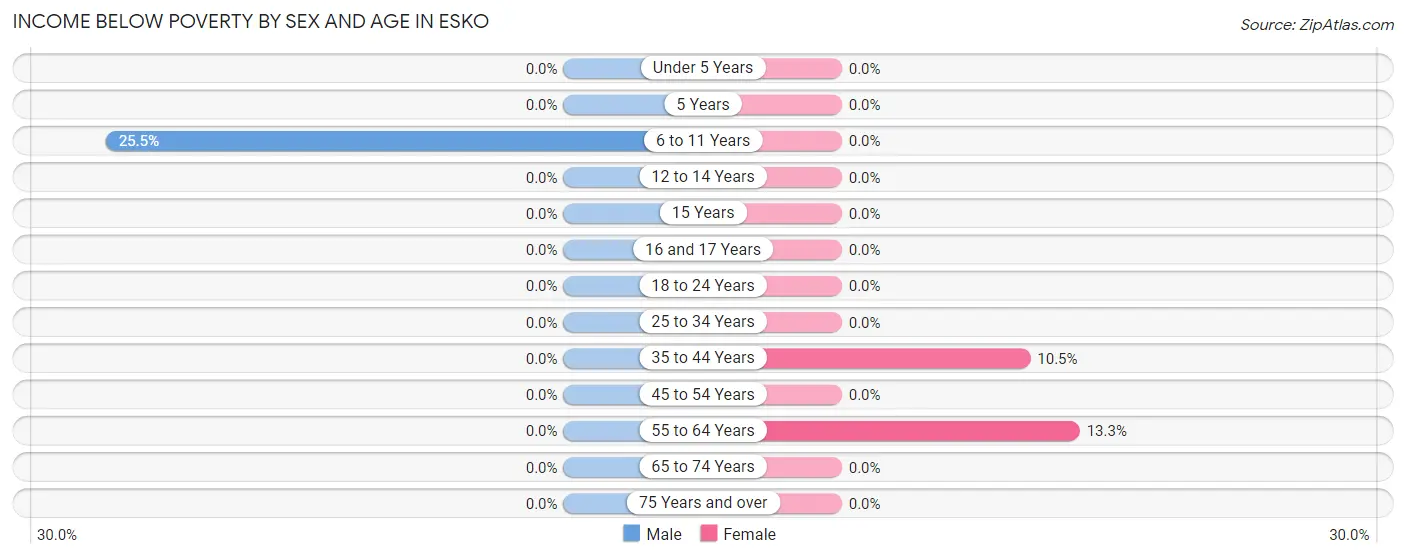
| Age Bracket | Male | Female |
| Under 5 Years | 0 (0.0%) | 0 (0.0%) |
| 5 Years | 0 (0.0%) | 0 (0.0%) |
| 6 to 11 Years | 40 (25.5%) | 0 (0.0%) |
| 12 to 14 Years | 0 (0.0%) | 0 (0.0%) |
| 15 Years | 0 (0.0%) | 0 (0.0%) |
| 16 and 17 Years | 0 (0.0%) | 0 (0.0%) |
| 18 to 24 Years | 0 (0.0%) | 0 (0.0%) |
| 25 to 34 Years | 0 (0.0%) | 0 (0.0%) |
| 35 to 44 Years | 0 (0.0%) | 21 (10.5%) |
| 45 to 54 Years | 0 (0.0%) | 0 (0.0%) |
| 55 to 64 Years | 0 (0.0%) | 11 (13.3%) |
| 65 to 74 Years | 0 (0.0%) | 0 (0.0%) |
| 75 Years and over | 0 (0.0%) | 0 (0.0%) |
| Total | 40 (3.4%) | 32 (3.2%) |
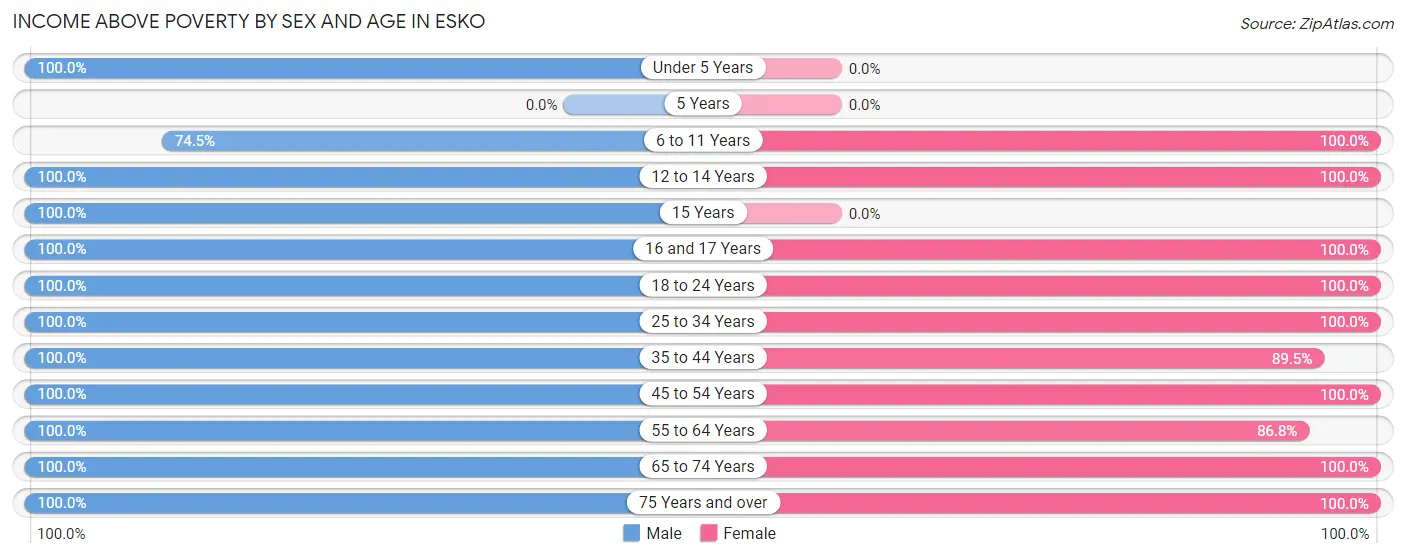
Income Above Poverty by Sex and Age in Esko
According to the poverty statistics in Esko, males aged under 5 years and females aged 6 to 11 years are the age groups that are most secure financially, with 100.0% of males and 100.0% of females in these age groups living above the poverty line.
| Age Bracket | Male | Female |
| Under 5 Years | 26 (100.0%) | 0 (0.0%) |
| 5 Years | 0 (0.0%) | 0 (0.0%) |
| 6 to 11 Years | 117 (74.5%) | 109 (100.0%) |
| 12 to 14 Years | 73 (100.0%) | 27 (100.0%) |
| 15 Years | 5 (100.0%) | 0 (0.0%) |
| 16 and 17 Years | 36 (100.0%) | 22 (100.0%) |
| 18 to 24 Years | 115 (100.0%) | 33 (100.0%) |
| 25 to 34 Years | 92 (100.0%) | 31 (100.0%) |
| 35 to 44 Years | 117 (100.0%) | 179 (89.5%) |
| 45 to 54 Years | 249 (100.0%) | 274 (100.0%) |
| 55 to 64 Years | 177 (100.0%) | 72 (86.8%) |
| 65 to 74 Years | 90 (100.0%) | 157 (100.0%) |
| 75 Years and over | 45 (100.0%) | 54 (100.0%) |
| Total | 1,142 (96.6%) | 958 (96.8%) |
Income Below Poverty Among Married-Couple Families in Esko
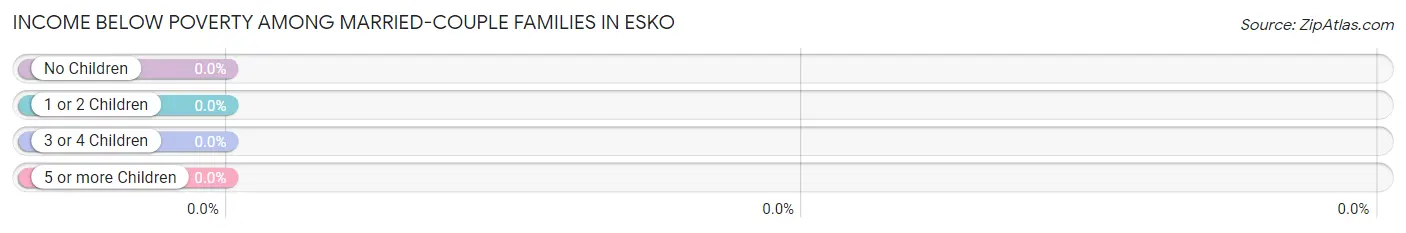
| Children | Above Poverty | Below Poverty |
| No Children | 288 (100.0%) | 0 (0.0%) |
| 1 or 2 Children | 253 (100.0%) | 0 (0.0%) |
| 3 or 4 Children | 0 (0.0%) | 0 (0.0%) |
| 5 or more Children | 0 (0.0%) | 0 (0.0%) |
| Total | 541 (100.0%) | 0 (0.0%) |
Income Below Poverty Among Single-Parent Households in Esko
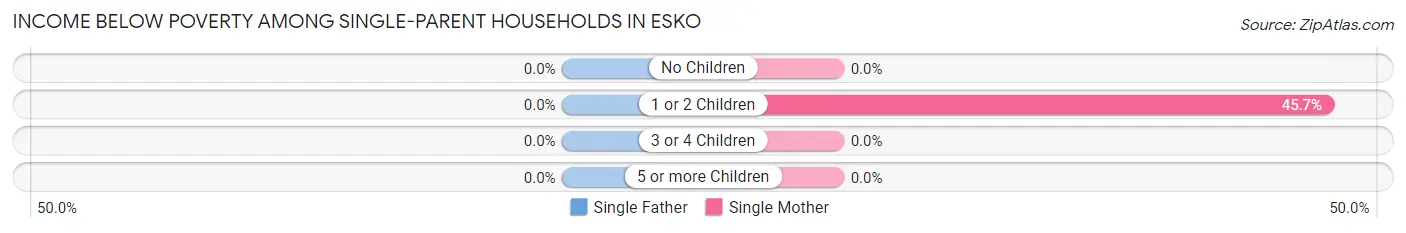
| Children | Single Father | Single Mother |
| No Children | 0 (0.0%) | 0 (0.0%) |
| 1 or 2 Children | 0 (0.0%) | 21 (45.7%) |
| 3 or 4 Children | 0 (0.0%) | 0 (0.0%) |
| 5 or more Children | 0 (0.0%) | 0 (0.0%) |
| Total | 0 (0.0%) | 21 (13.7%) |
Income Below Poverty Among Married-Couple vs Single-Parent Households in Esko
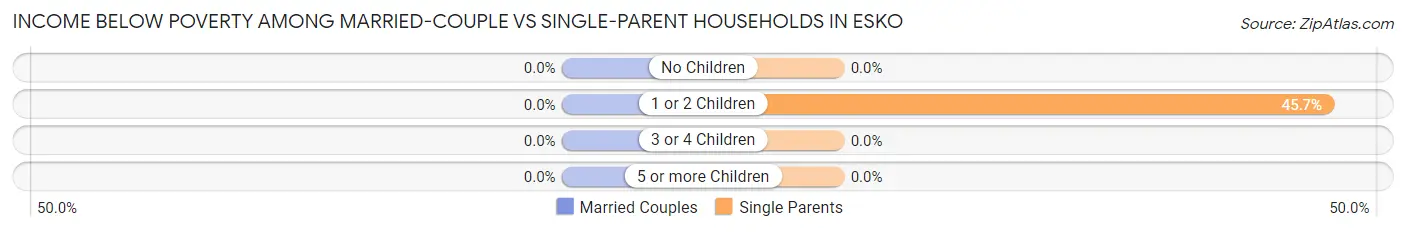
| Children | Married-Couple Families | Single-Parent Households |
| No Children | 0 (0.0%) | 0 (0.0%) |
| 1 or 2 Children | 0 (0.0%) | 21 (45.7%) |
| 3 or 4 Children | 0 (0.0%) | 0 (0.0%) |
| 5 or more Children | 0 (0.0%) | 0 (0.0%) |
| Total | 0 (0.0%) | 21 (13.7%) |
Race in Esko
The most populous races in Esko are White / Caucasian (2,090 | 96.2%), Two or more Races (44 | 2.0%), and Black / African American (36 | 1.7%).
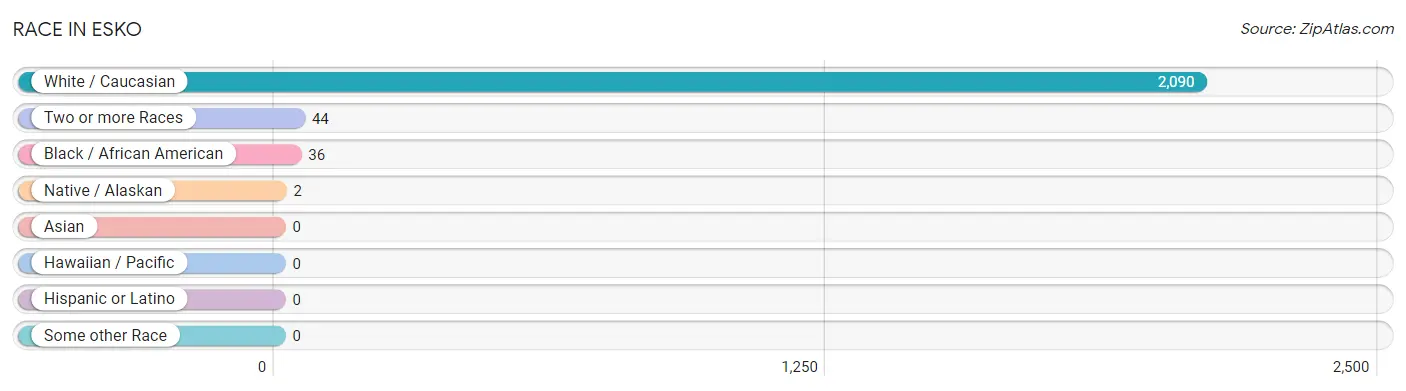
| Race | # Population | % Population |
| Asian | 0 | 0.0% |
| Black / African American | 36 | 1.7% |
| Hawaiian / Pacific | 0 | 0.0% |
| Hispanic or Latino | 0 | 0.0% |
| Native / Alaskan | 2 | 0.1% |
| White / Caucasian | 2,090 | 96.2% |
| Two or more Races | 44 | 2.0% |
| Some other Race | 0 | 0.0% |
| Total | 2,172 | 100.0% |
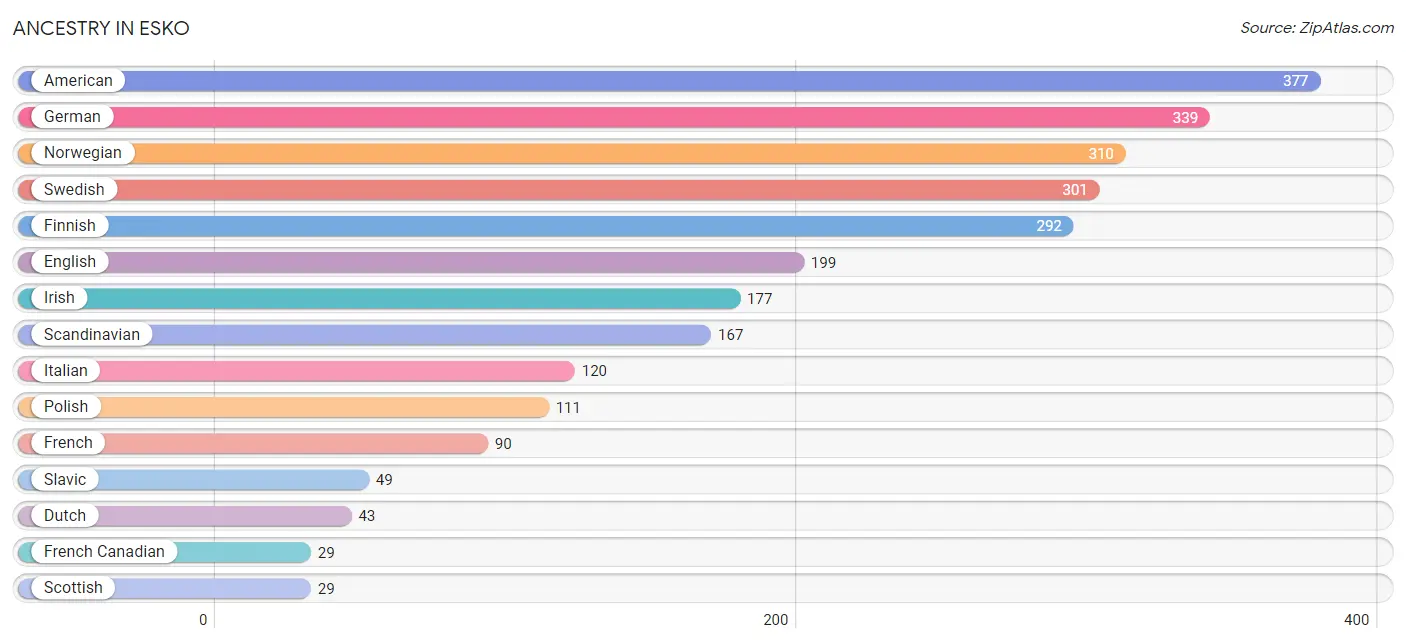
Ancestry in Esko
The most populous ancestries reported in Esko are American (377 | 17.4%), German (339 | 15.6%), Norwegian (310 | 14.3%), Swedish (301 | 13.9%), and Finnish (292 | 13.4%), together accounting for 74.5% of all Esko residents.
| Ancestry | # Population | % Population |
| American | 377 | 17.4% |
| Austrian | 8 | 0.4% |
| Chippewa | 12 | 0.5% |
| Czech | 14 | 0.6% |
| Dutch | 43 | 2.0% |
| English | 199 | 9.2% |
| Finnish | 292 | 13.4% |
| French | 90 | 4.1% |
| French Canadian | 29 | 1.3% |
| German | 339 | 15.6% |
| Irish | 177 | 8.2% |
| Italian | 120 | 5.5% |
| Norwegian | 310 | 14.3% |
| Polish | 111 | 5.1% |
| Scandinavian | 167 | 7.7% |
| Scotch-Irish | 10 | 0.5% |
| Scottish | 29 | 1.3% |
| Slavic | 49 | 2.3% |
| Slovene | 26 | 1.2% |
| Swedish | 301 | 13.9% |
| Welsh | 7 | 0.3% |
| Yugoslavian | 24 | 1.1% | View All 22 Rows |
Immigrants in Esko
The most numerous immigrant groups reported in Esko came from , and Canada (29 | 1.3%), together accounting for 1.3% of all Esko residents.

| Immigration Origin | # Population | % Population |
| Canada | 29 | 1.3% | View All 1 Rows |
Sex and Age in Esko
Sex and Age in Esko
The most populous age groups in Esko are 45 to 49 Years (148 | 12.5%) for men and 45 to 49 Years (152 | 15.3%) for women.
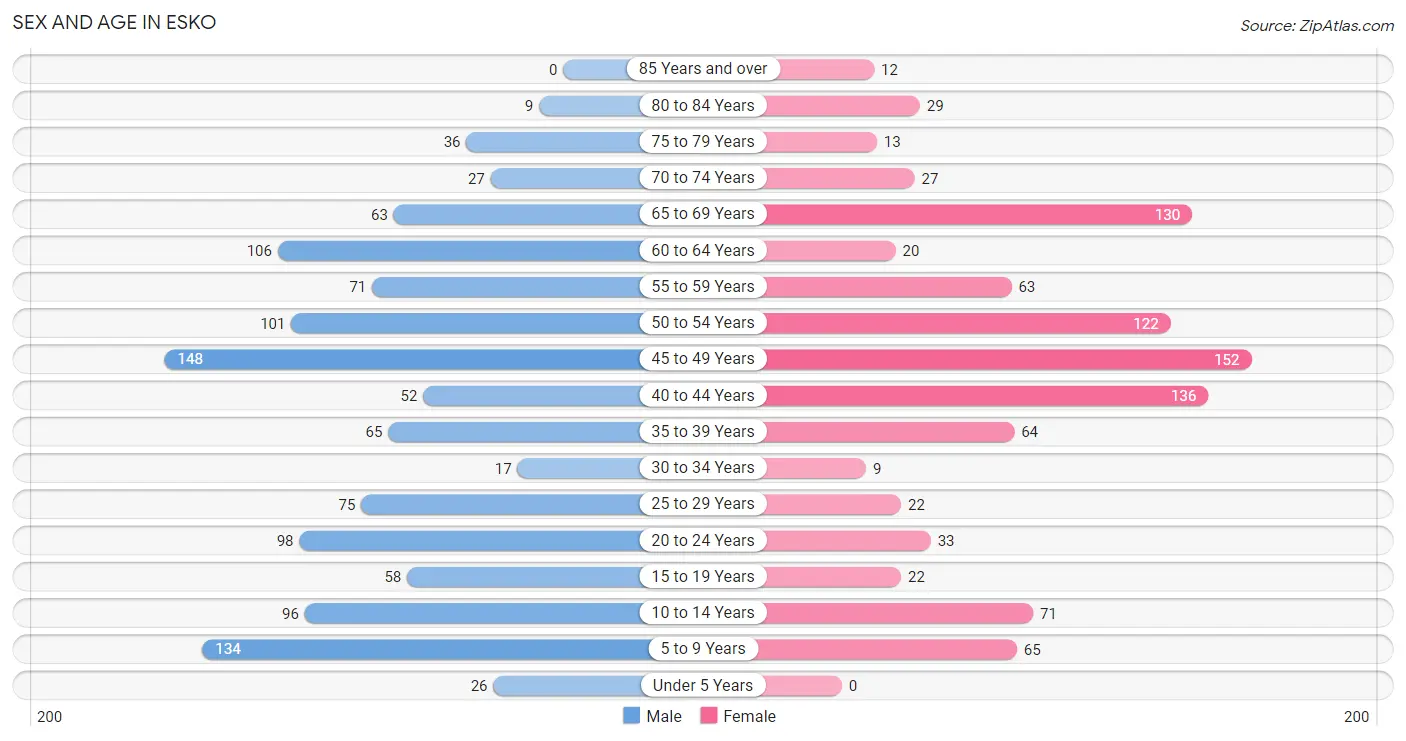
| Age Bracket | Male | Female |
| Under 5 Years | 26 (2.2%) | 0 (0.0%) |
| 5 to 9 Years | 134 (11.3%) | 65 (6.6%) |
| 10 to 14 Years | 96 (8.1%) | 71 (7.2%) |
| 15 to 19 Years | 58 (4.9%) | 22 (2.2%) |
| 20 to 24 Years | 98 (8.3%) | 33 (3.3%) |
| 25 to 29 Years | 75 (6.4%) | 22 (2.2%) |
| 30 to 34 Years | 17 (1.4%) | 9 (0.9%) |
| 35 to 39 Years | 65 (5.5%) | 64 (6.5%) |
| 40 to 44 Years | 52 (4.4%) | 136 (13.7%) |
| 45 to 49 Years | 148 (12.5%) | 152 (15.3%) |
| 50 to 54 Years | 101 (8.5%) | 122 (12.3%) |
| 55 to 59 Years | 71 (6.0%) | 63 (6.4%) |
| 60 to 64 Years | 106 (9.0%) | 20 (2.0%) |
| 65 to 69 Years | 63 (5.3%) | 130 (13.1%) |
| 70 to 74 Years | 27 (2.3%) | 27 (2.7%) |
| 75 to 79 Years | 36 (3.0%) | 13 (1.3%) |
| 80 to 84 Years | 9 (0.8%) | 29 (2.9%) |
| 85 Years and over | 0 (0.0%) | 12 (1.2%) |
| Total | 1,182 (100.0%) | 990 (100.0%) |
Families and Households in Esko
Median Family Size in Esko
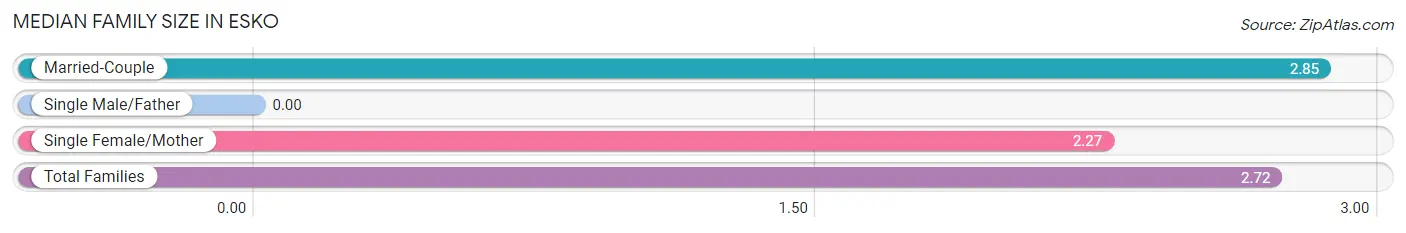
| Family Type | # Families | Family Size |
| Married-Couple | 541 (77.9%) | 2.85 |
| Single Male/Father | 0 (0.0%) | - |
| Single Female/Mother | 153 (22.1%) | 2.27 |
| Total Families | 694 (100.0%) | 2.72 |
Median Household Size in Esko
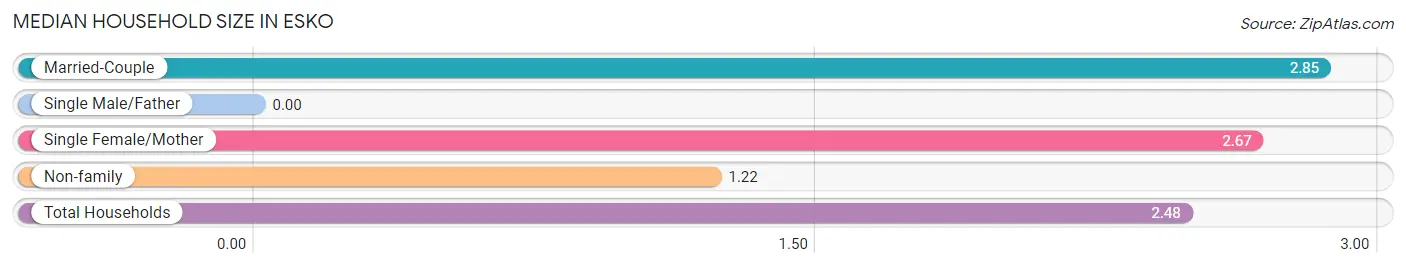
| Household Type | # Households | Household Size |
| Married-Couple | 541 (61.8%) | 2.85 |
| Single Male/Father | 0 (0.0%) | - |
| Single Female/Mother | 153 (17.5%) | 2.67 |
| Non-family | 182 (20.8%) | 1.22 |
| Total Households | 876 (100.0%) | 2.48 |
Household Size by Marriage Status in Esko
Out of a total of 876 households in Esko, 694 (79.2%) are family households, while 182 (20.8%) are nonfamily households. The most numerous type of family households are 4-person households, comprising 294, and the most common type of nonfamily households are 1-person households, comprising 138.
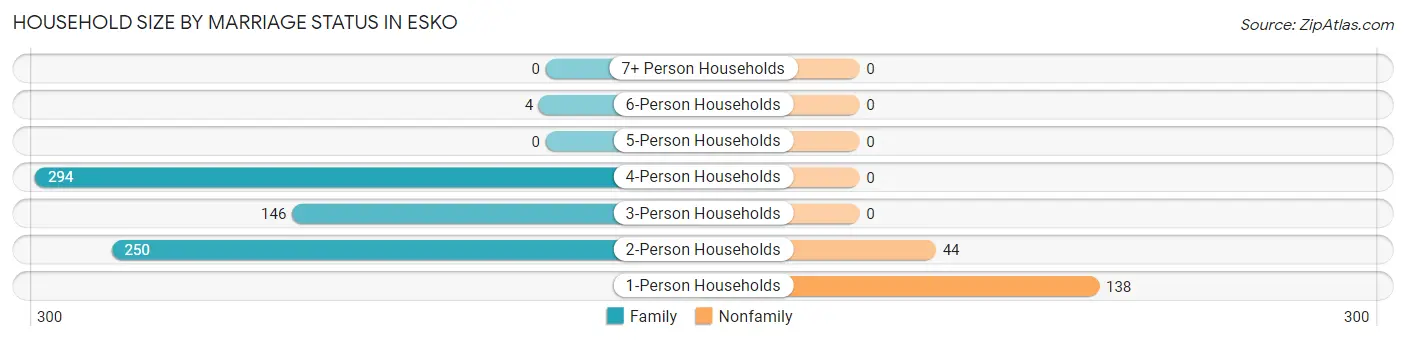
| Household Size | Family Households | Nonfamily Households |
| 1-Person Households | - | 138 (15.8%) |
| 2-Person Households | 250 (28.5%) | 44 (5.0%) |
| 3-Person Households | 146 (16.7%) | 0 (0.0%) |
| 4-Person Households | 294 (33.6%) | 0 (0.0%) |
| 5-Person Households | 0 (0.0%) | 0 (0.0%) |
| 6-Person Households | 4 (0.5%) | 0 (0.0%) |
| 7+ Person Households | 0 (0.0%) | 0 (0.0%) |
| Total | 694 (79.2%) | 182 (20.8%) |
Female Fertility in Esko
Fertility by Age in Esko
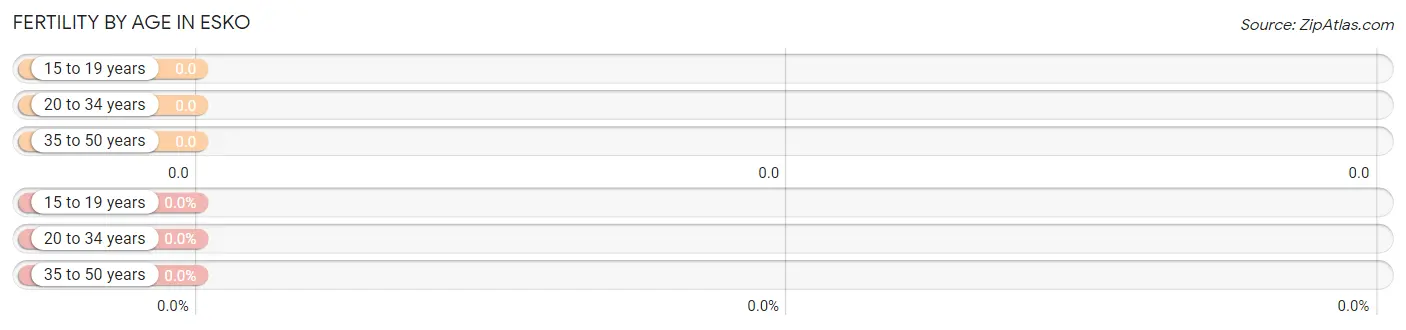
| Age Bracket | Women with Births | Births / 1,000 Women |
| 15 to 19 years | 0 (0.0%) | 0.0 |
| 20 to 34 years | 0 (0.0%) | 0.0 |
| 35 to 50 years | 0 (0.0%) | 0.0 |
| Total | 0 (0.0%) | 0.0 |
Fertility by Age by Marriage Status in Esko
| Age Bracket | Married | Unmarried |
| 15 to 19 years | 0 (0.0%) | 0 (0.0%) |
| 20 to 34 years | 0 (0.0%) | 0 (0.0%) |
| 35 to 50 years | 0 (0.0%) | 0 (0.0%) |
| Total | 0 (0.0%) | 0 (0.0%) |
Fertility by Education in Esko
| Educational Attainment | Women with Births | Births / 1,000 Women |
| Less than High School | 0 (0.0%) | 0.0 |
| High School Diploma | 0 (0.0%) | 0.0 |
| College or Associate's Degree | 0 (0.0%) | 0.0 |
| Bachelor's Degree | 0 (0.0%) | 0.0 |
| Graduate Degree | 0 (0.0%) | 0.0 |
| Total | 0 (0.0%) | 0.0 |
Fertility by Education by Marriage Status in Esko
| Educational Attainment | Married | Unmarried |
| Less than High School | 0 (0.0%) | 0 (0.0%) |
| High School Diploma | 0 (0.0%) | 0 (0.0%) |
| College or Associate's Degree | 0 (0.0%) | 0 (0.0%) |
| Bachelor's Degree | 0 (0.0%) | 0 (0.0%) |
| Graduate Degree | 0 (0.0%) | 0 (0.0%) |
| Total | 0 (0.0%) | 0 (0.0%) |
Employment Characteristics in Esko
Employment by Class of Employer in Esko
Among the 1,216 employed individuals in Esko, private company employees (536 | 44.1%), local government employees (298 | 24.5%), and state government employees (176 | 14.5%) make up the most common classes of employment.
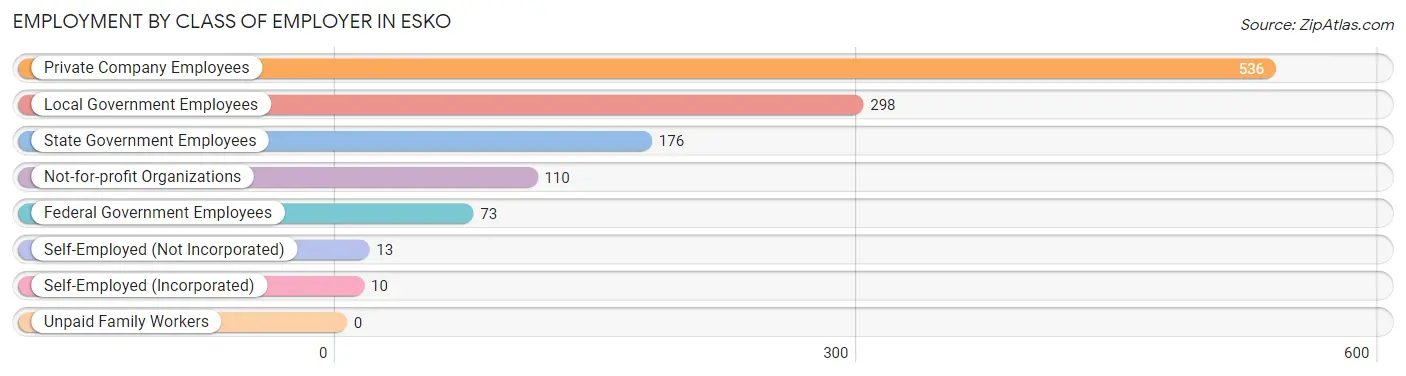
| Employer Class | # Employees | % Employees |
| Private Company Employees | 536 | 44.1% |
| Self-Employed (Incorporated) | 10 | 0.8% |
| Self-Employed (Not Incorporated) | 13 | 1.1% |
| Not-for-profit Organizations | 110 | 9.0% |
| Local Government Employees | 298 | 24.5% |
| State Government Employees | 176 | 14.5% |
| Federal Government Employees | 73 | 6.0% |
| Unpaid Family Workers | 0 | 0.0% |
| Total | 1,216 | 100.0% |
Employment Status by Age in Esko
According to the labor force statistics for Esko, out of the total population over 16 years of age (1,775), 70.4% or 1,250 individuals are in the labor force, with 1.0% or 12 of them unemployed. The age group with the highest labor force participation rate is 25 to 29 years, with 100.0% or 97 individuals in the labor force. Within the labor force, the 25 to 29 years age range has the highest percentage of unemployed individuals, with 12.4% or 12 of them being unemployed.
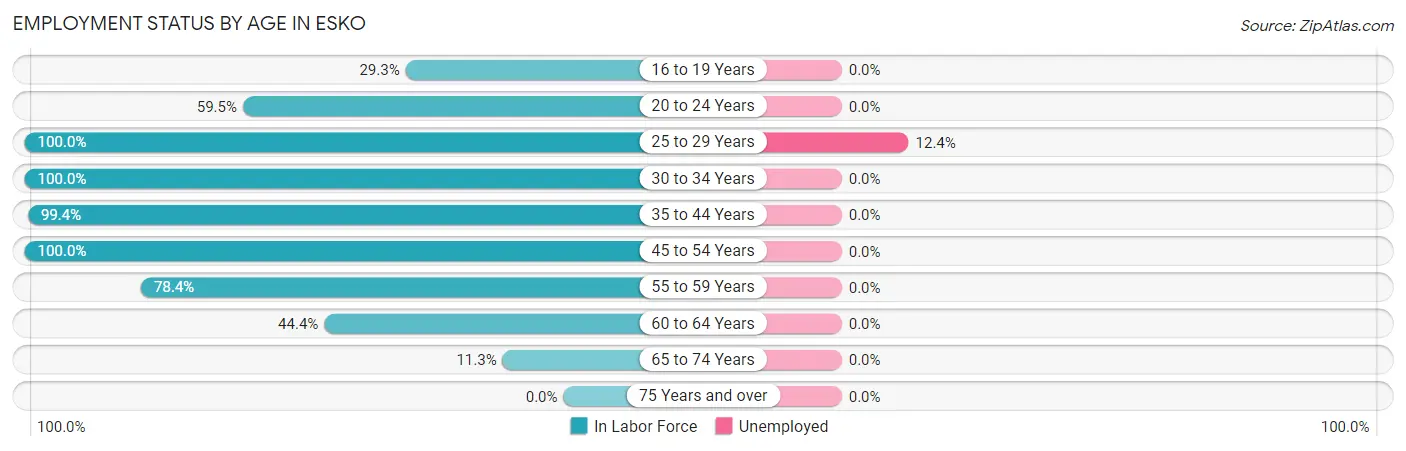
| Age Bracket | In Labor Force | Unemployed |
| 16 to 19 Years | 22 (29.3%) | 0 (0.0%) |
| 20 to 24 Years | 78 (59.5%) | 0 (0.0%) |
| 25 to 29 Years | 97 (100.0%) | 12 (12.4%) |
| 30 to 34 Years | 26 (100.0%) | 0 (0.0%) |
| 35 to 44 Years | 315 (99.4%) | 0 (0.0%) |
| 45 to 54 Years | 523 (100.0%) | 0 (0.0%) |
| 55 to 59 Years | 105 (78.4%) | 0 (0.0%) |
| 60 to 64 Years | 56 (44.4%) | 0 (0.0%) |
| 65 to 74 Years | 28 (11.3%) | 0 (0.0%) |
| 75 Years and over | 0 (0.0%) | 0 (0.0%) |
| Total | 1,250 (70.4%) | 12 (1.0%) |
Employment Status by Educational Attainment in Esko
According to labor force statistics for Esko, 91.7% of individuals (1,121) out of the total population between 25 and 64 years of age (1,223) are in the labor force, with 1.1% or 12 of them being unemployed. The group with the highest labor force participation rate are those with the educational attainment of bachelor's degree or higher, with 98.6% or 620 individuals in the labor force. Within the labor force, individuals with high school diploma education have the highest percentage of unemployment, with 11.8% or 12 of them being unemployed.
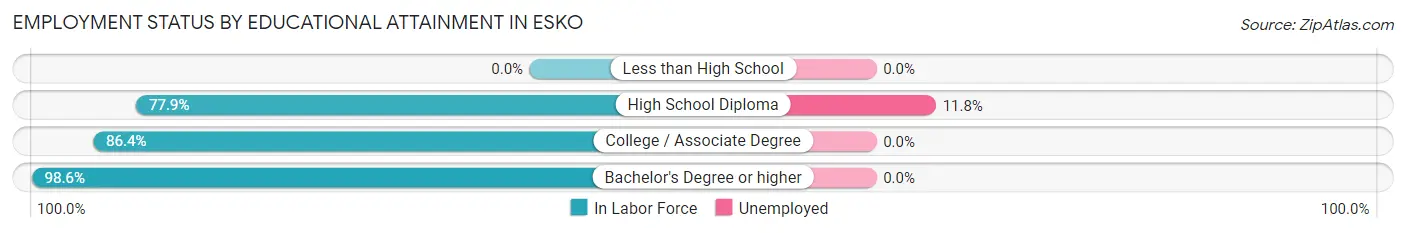
| Educational Attainment | In Labor Force | Unemployed |
| Less than High School | 0 (0.0%) | 0 (0.0%) |
| High School Diploma | 102 (77.9%) | 15 (11.8%) |
| College / Associate Degree | 400 (86.4%) | 0 (0.0%) |
| Bachelor's Degree or higher | 620 (98.6%) | 0 (0.0%) |
| Total | 1,121 (91.7%) | 13 (1.1%) |
Employment Occupations by Sex in Esko
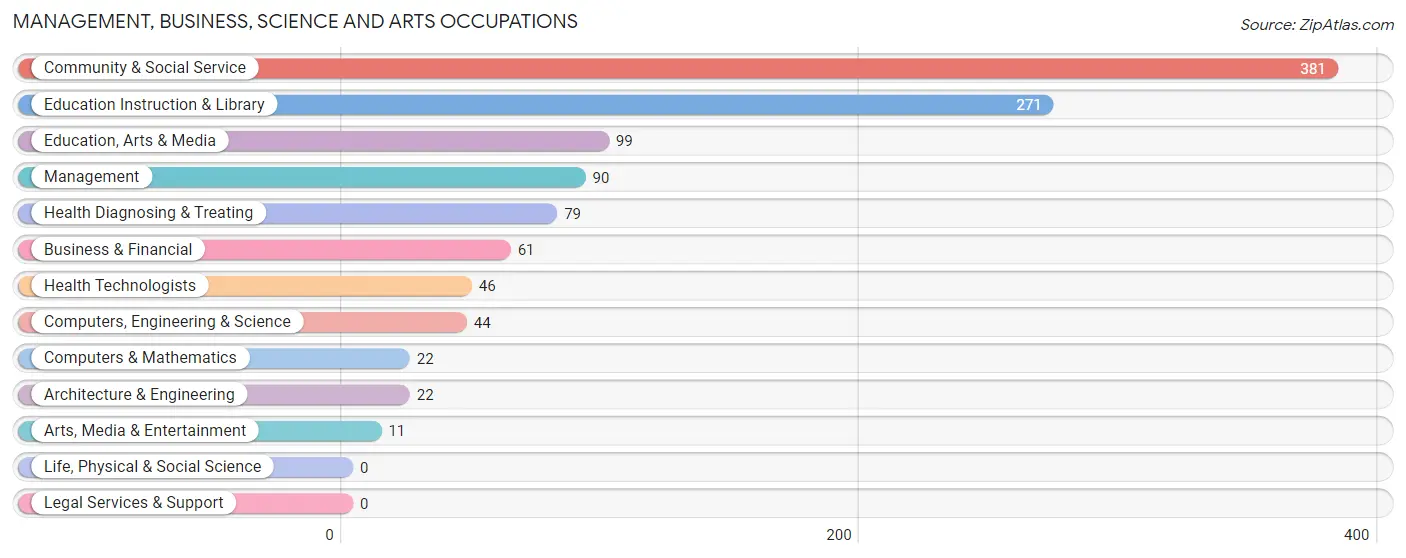
Management, Business, Science and Arts Occupations
The most common Management, Business, Science and Arts occupations in Esko are Community & Social Service (381 | 30.8%), Education Instruction & Library (271 | 21.9%), Education, Arts & Media (99 | 8.0%), Management (90 | 7.3%), and Health Diagnosing & Treating (79 | 6.4%).
Management, Business, Science and Arts Occupations by Sex
Within the Management, Business, Science and Arts occupations in Esko, the most male-oriented occupations are Management (100.0%), Computers, Engineering & Science (100.0%), and Computers & Mathematics (100.0%), while the most female-oriented occupations are Business & Financial (100.0%), Arts, Media & Entertainment (100.0%), and Health Diagnosing & Treating (63.3%).
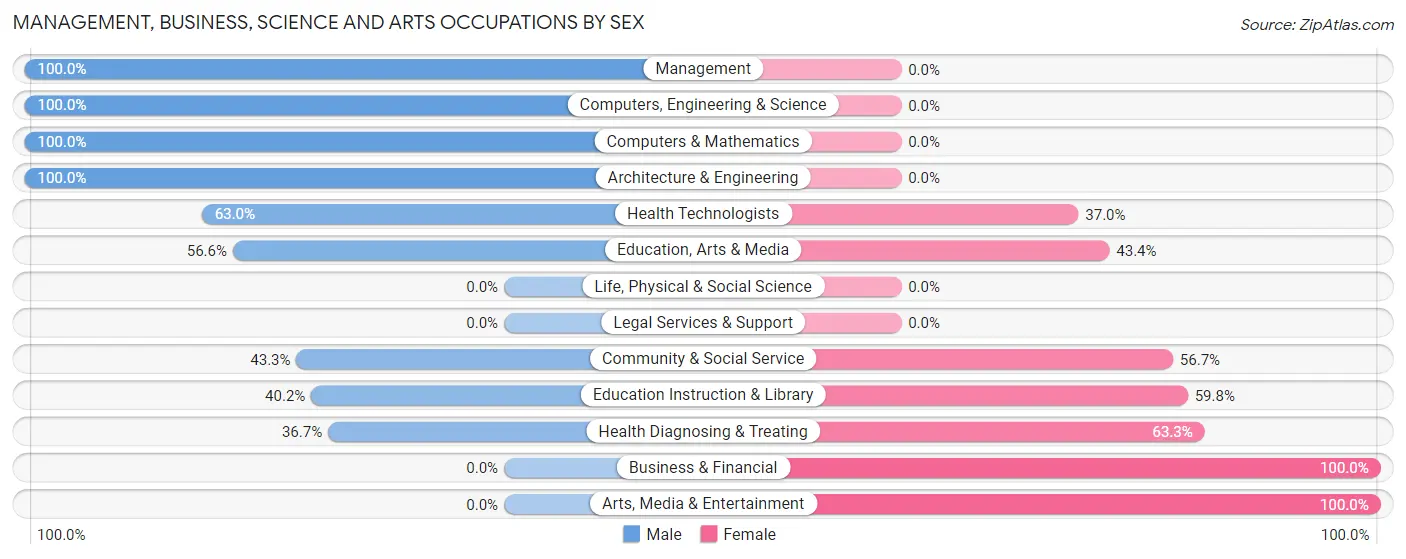
| Occupation | Male | Female |
| Management | 90 (100.0%) | 0 (0.0%) |
| Business & Financial | 0 (0.0%) | 61 (100.0%) |
| Computers, Engineering & Science | 44 (100.0%) | 0 (0.0%) |
| Computers & Mathematics | 22 (100.0%) | 0 (0.0%) |
| Architecture & Engineering | 22 (100.0%) | 0 (0.0%) |
| Life, Physical & Social Science | 0 (0.0%) | 0 (0.0%) |
| Community & Social Service | 165 (43.3%) | 216 (56.7%) |
| Education, Arts & Media | 56 (56.6%) | 43 (43.4%) |
| Legal Services & Support | 0 (0.0%) | 0 (0.0%) |
| Education Instruction & Library | 109 (40.2%) | 162 (59.8%) |
| Arts, Media & Entertainment | 0 (0.0%) | 11 (100.0%) |
| Health Diagnosing & Treating | 29 (36.7%) | 50 (63.3%) |
| Health Technologists | 29 (63.0%) | 17 (37.0%) |
| Total (Category) | 328 (50.1%) | 327 (49.9%) |
| Total (Overall) | 654 (52.8%) | 584 (47.2%) |
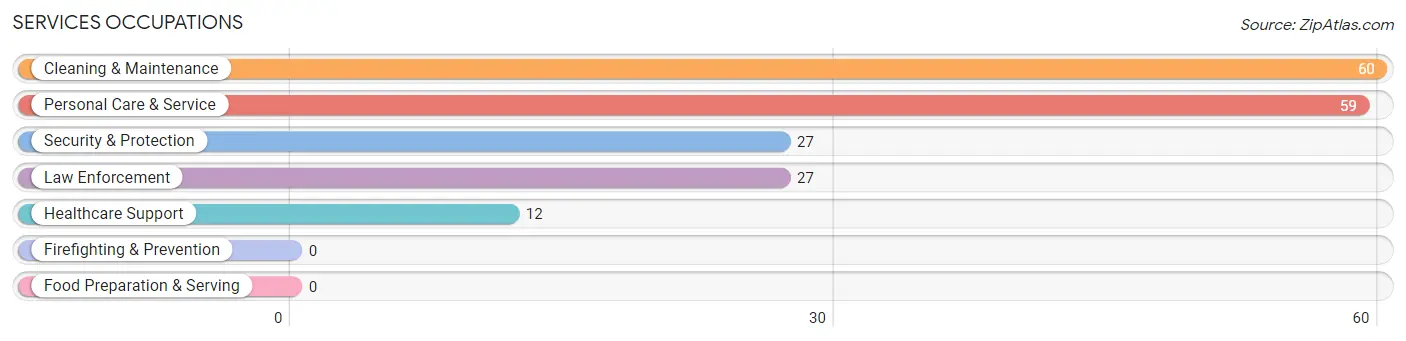
Services Occupations
The most common Services occupations in Esko are Cleaning & Maintenance (60 | 4.9%), Personal Care & Service (59 | 4.8%), Security & Protection (27 | 2.2%), Law Enforcement (27 | 2.2%), and Healthcare Support (12 | 1.0%).
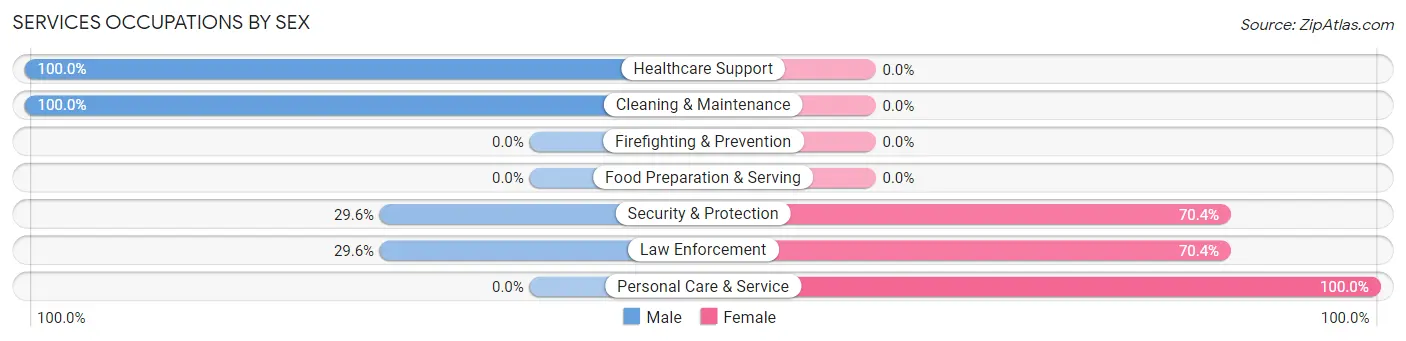
Services Occupations by Sex
Within the Services occupations in Esko, the most male-oriented occupations are Healthcare Support (100.0%), Cleaning & Maintenance (100.0%), and Security & Protection (29.6%), while the most female-oriented occupations are Personal Care & Service (100.0%), Security & Protection (70.4%), and Law Enforcement (70.4%).
| Occupation | Male | Female |
| Healthcare Support | 12 (100.0%) | 0 (0.0%) |
| Security & Protection | 8 (29.6%) | 19 (70.4%) |
| Firefighting & Prevention | 0 (0.0%) | 0 (0.0%) |
| Law Enforcement | 8 (29.6%) | 19 (70.4%) |
| Food Preparation & Serving | 0 (0.0%) | 0 (0.0%) |
| Cleaning & Maintenance | 60 (100.0%) | 0 (0.0%) |
| Personal Care & Service | 0 (0.0%) | 59 (100.0%) |
| Total (Category) | 80 (50.6%) | 78 (49.4%) |
| Total (Overall) | 654 (52.8%) | 584 (47.2%) |
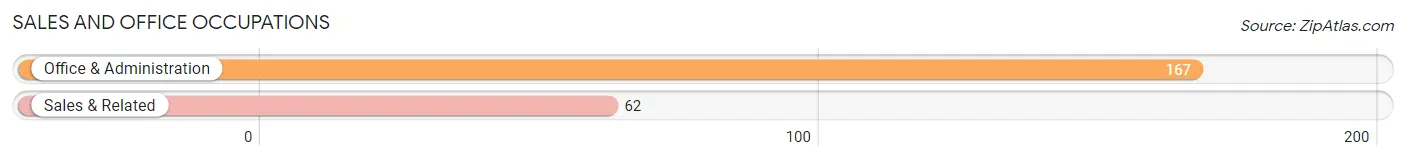
Sales and Office Occupations
The most common Sales and Office occupations in Esko are Office & Administration (167 | 13.5%), and Sales & Related (62 | 5.0%).
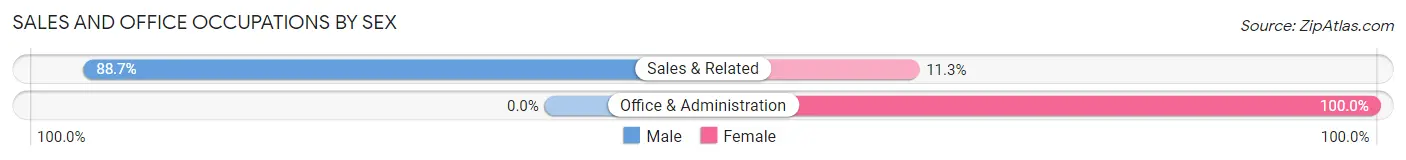
Sales and Office Occupations by Sex
| Occupation | Male | Female |
| Sales & Related | 55 (88.7%) | 7 (11.3%) |
| Office & Administration | 0 (0.0%) | 167 (100.0%) |
| Total (Category) | 55 (24.0%) | 174 (76.0%) |
| Total (Overall) | 654 (52.8%) | 584 (47.2%) |
Natural Resources, Construction and Maintenance Occupations
The most common Natural Resources, Construction and Maintenance occupations in Esko are , and Installation, Maintenance & Repair (43 | 3.5%).
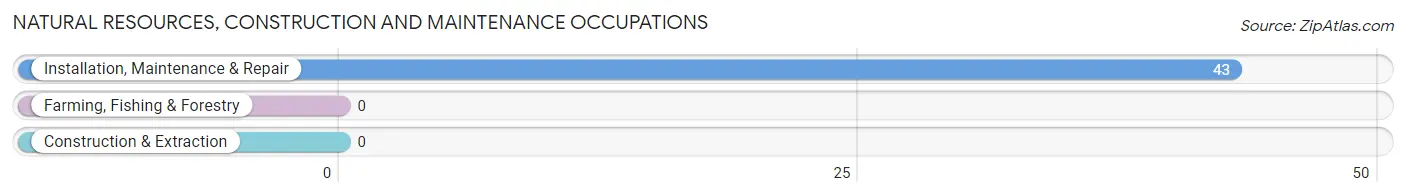
Natural Resources, Construction and Maintenance Occupations by Sex
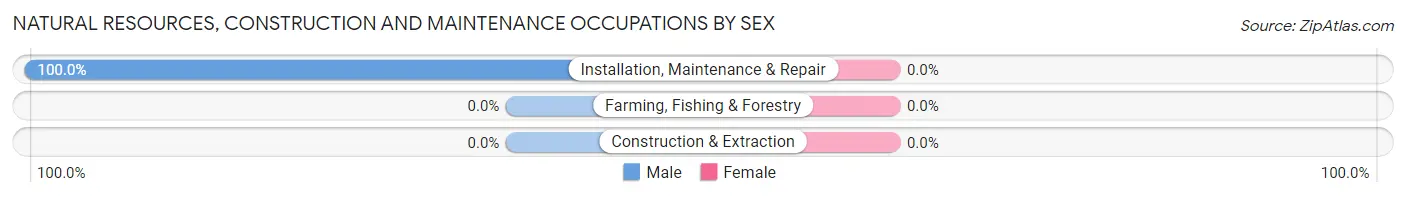
| Occupation | Male | Female |
| Farming, Fishing & Forestry | 0 (0.0%) | 0 (0.0%) |
| Construction & Extraction | 0 (0.0%) | 0 (0.0%) |
| Installation, Maintenance & Repair | 43 (100.0%) | 0 (0.0%) |
| Total (Category) | 43 (100.0%) | 0 (0.0%) |
| Total (Overall) | 654 (52.8%) | 584 (47.2%) |
Production, Transportation and Moving Occupations
The most common Production, Transportation and Moving occupations in Esko are Production (80 | 6.5%), Transportation (68 | 5.5%), and Material Moving (5 | 0.4%).
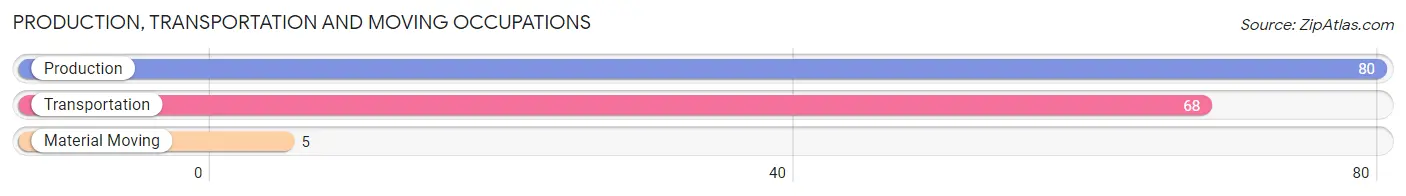
Production, Transportation and Moving Occupations by Sex
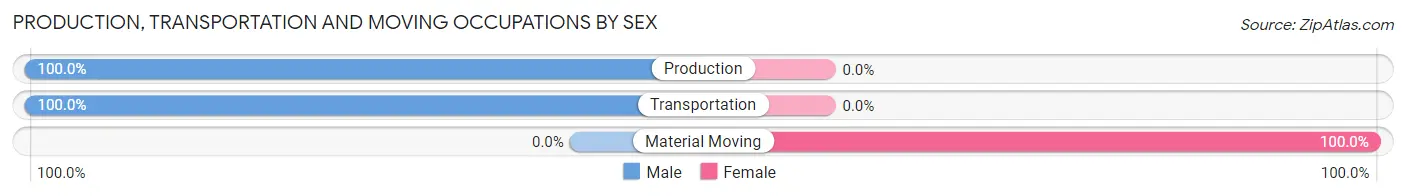
| Occupation | Male | Female |
| Production | 80 (100.0%) | 0 (0.0%) |
| Transportation | 68 (100.0%) | 0 (0.0%) |
| Material Moving | 0 (0.0%) | 5 (100.0%) |
| Total (Category) | 148 (96.7%) | 5 (3.3%) |
| Total (Overall) | 654 (52.8%) | 584 (47.2%) |
Employment Industries by Sex in Esko
Employment Industries in Esko
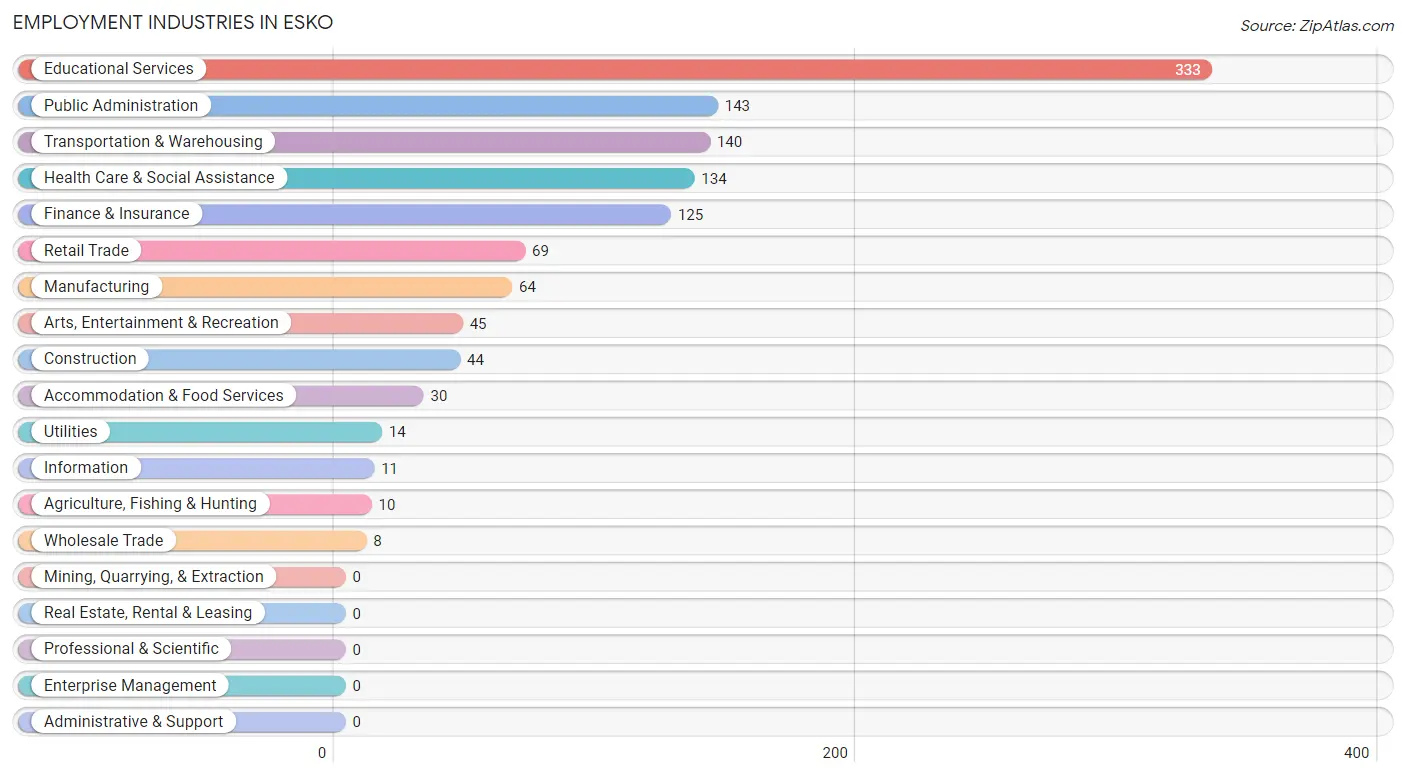
The major employment industries in Esko include Educational Services (333 | 26.9%), Public Administration (143 | 11.6%), Transportation & Warehousing (140 | 11.3%), Health Care & Social Assistance (134 | 10.8%), and Finance & Insurance (125 | 10.1%).
Employment Industries by Sex in Esko
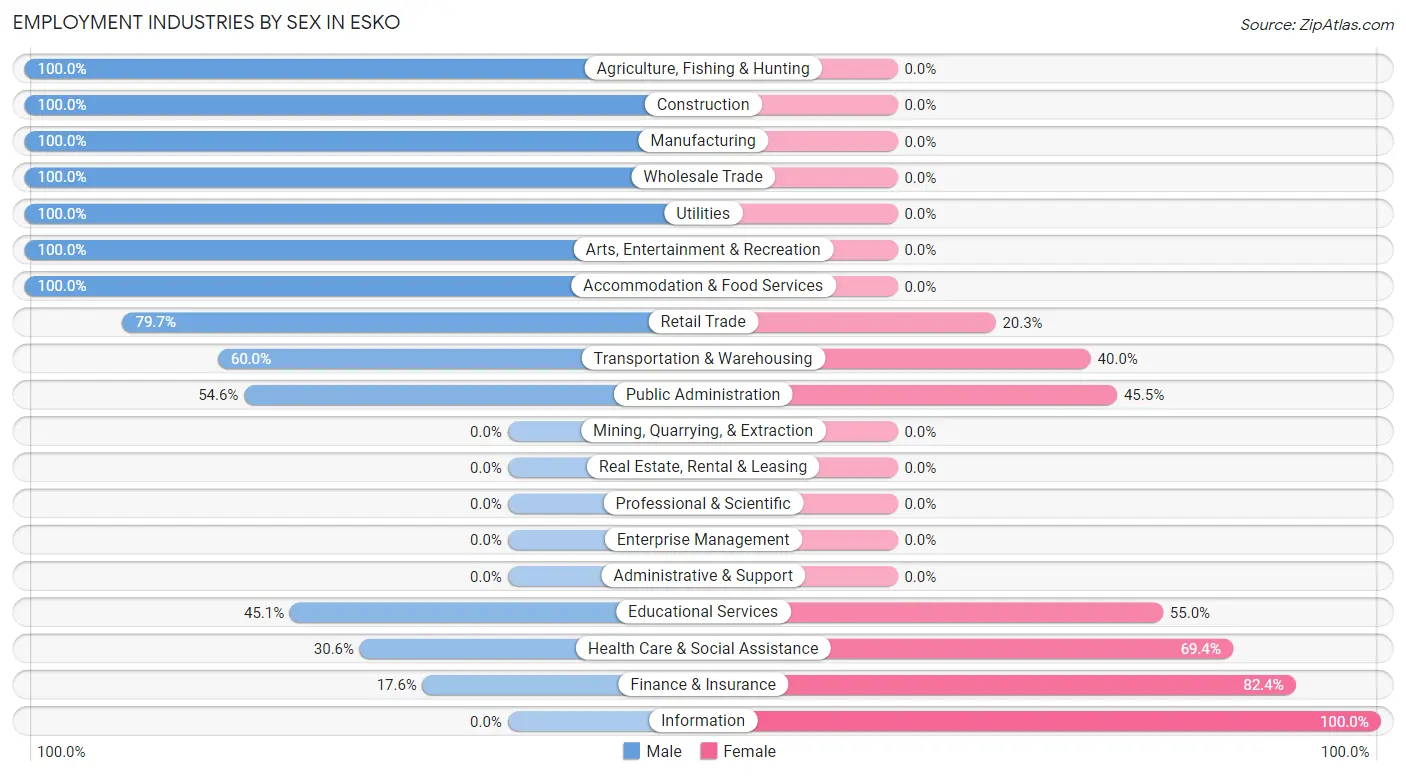
The Esko industries that see more men than women are Agriculture, Fishing & Hunting (100.0%), Construction (100.0%), and Manufacturing (100.0%), whereas the industries that tend to have a higher number of women are Information (100.0%), Finance & Insurance (82.4%), and Health Care & Social Assistance (69.4%).
| Industry | Male | Female |
| Agriculture, Fishing & Hunting | 10 (100.0%) | 0 (0.0%) |
| Mining, Quarrying, & Extraction | 0 (0.0%) | 0 (0.0%) |
| Construction | 44 (100.0%) | 0 (0.0%) |
| Manufacturing | 64 (100.0%) | 0 (0.0%) |
| Wholesale Trade | 8 (100.0%) | 0 (0.0%) |
| Retail Trade | 55 (79.7%) | 14 (20.3%) |
| Transportation & Warehousing | 84 (60.0%) | 56 (40.0%) |
| Utilities | 14 (100.0%) | 0 (0.0%) |
| Information | 0 (0.0%) | 11 (100.0%) |
| Finance & Insurance | 22 (17.6%) | 103 (82.4%) |
| Real Estate, Rental & Leasing | 0 (0.0%) | 0 (0.0%) |
| Professional & Scientific | 0 (0.0%) | 0 (0.0%) |
| Enterprise Management | 0 (0.0%) | 0 (0.0%) |
| Administrative & Support | 0 (0.0%) | 0 (0.0%) |
| Educational Services | 150 (45.1%) | 183 (54.9%) |
| Health Care & Social Assistance | 41 (30.6%) | 93 (69.4%) |
| Arts, Entertainment & Recreation | 45 (100.0%) | 0 (0.0%) |
| Accommodation & Food Services | 30 (100.0%) | 0 (0.0%) |
| Public Administration | 78 (54.5%) | 65 (45.5%) |
| Total | 654 (52.8%) | 584 (47.2%) |
Education in Esko
School Enrollment in Esko
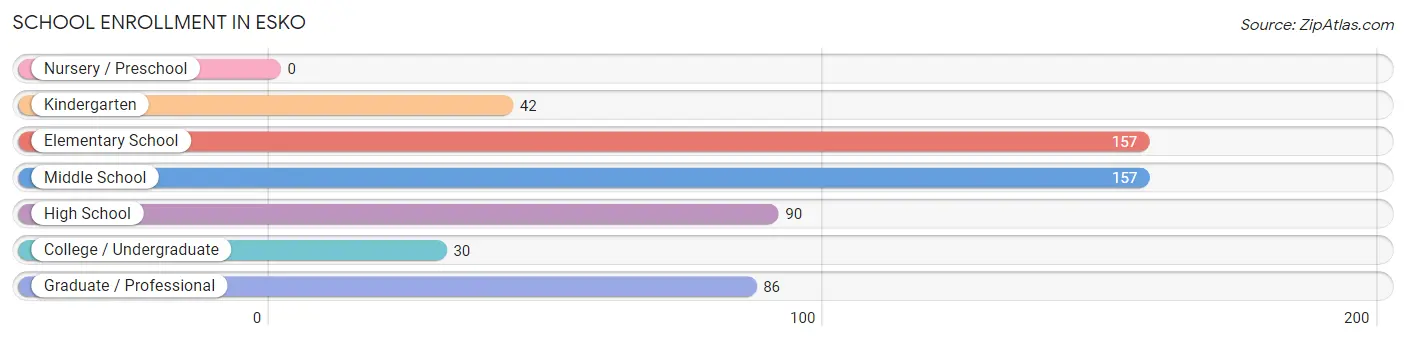
The most common levels of schooling among the 562 students in Esko are elementary school (157 | 27.9%), middle school (157 | 27.9%), and high school (90 | 16.0%).
| School Level | # Students | % Students |
| Nursery / Preschool | 0 | 0.0% |
| Kindergarten | 42 | 7.5% |
| Elementary School | 157 | 27.9% |
| Middle School | 157 | 27.9% |
| High School | 90 | 16.0% |
| College / Undergraduate | 30 | 5.3% |
| Graduate / Professional | 86 | 15.3% |
| Total | 562 | 100.0% |
School Enrollment by Age by Funding Source in Esko
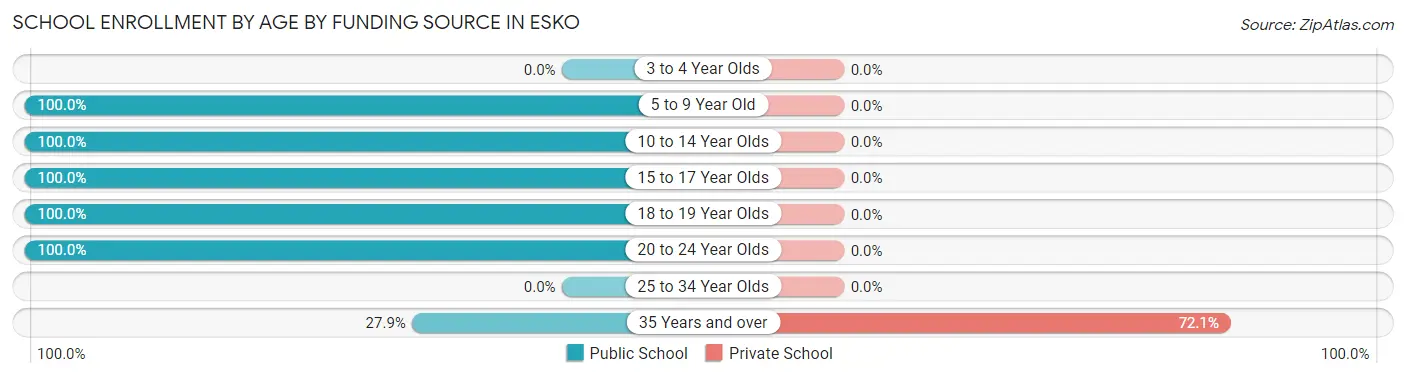
Out of a total of 562 students who are enrolled in schools in Esko, 62 (11.0%) attend a private institution, while the remaining 500 (89.0%) are enrolled in public schools. The age group of 35 years and over has the highest likelihood of being enrolled in private schools, with 62 (72.1% in the age bracket) enrolled. Conversely, the age group of 5 to 9 year old has the lowest likelihood of being enrolled in a private school, with 199 (100.0% in the age bracket) attending a public institution.
| Age Bracket | Public School | Private School |
| 3 to 4 Year Olds | 0 (0.0%) | 0 (0.0%) |
| 5 to 9 Year Old | 199 (100.0%) | 0 (0.0%) |
| 10 to 14 Year Olds | 167 (100.0%) | 0 (0.0%) |
| 15 to 17 Year Olds | 63 (100.0%) | 0 (0.0%) |
| 18 to 19 Year Olds | 17 (100.0%) | 0 (0.0%) |
| 20 to 24 Year Olds | 30 (100.0%) | 0 (0.0%) |
| 25 to 34 Year Olds | 0 (0.0%) | 0 (0.0%) |
| 35 Years and over | 24 (27.9%) | 62 (72.1%) |
| Total | 500 (89.0%) | 62 (11.0%) |
Educational Attainment by Field of Study in Esko
Education (273 | 29.1%), business (184 | 19.6%), science & technology (115 | 12.3%), psychology (89 | 9.5%), and bio, nature & agricultural (78 | 8.3%) are the most common fields of study among 938 individuals in Esko who have obtained a bachelor's degree or higher.
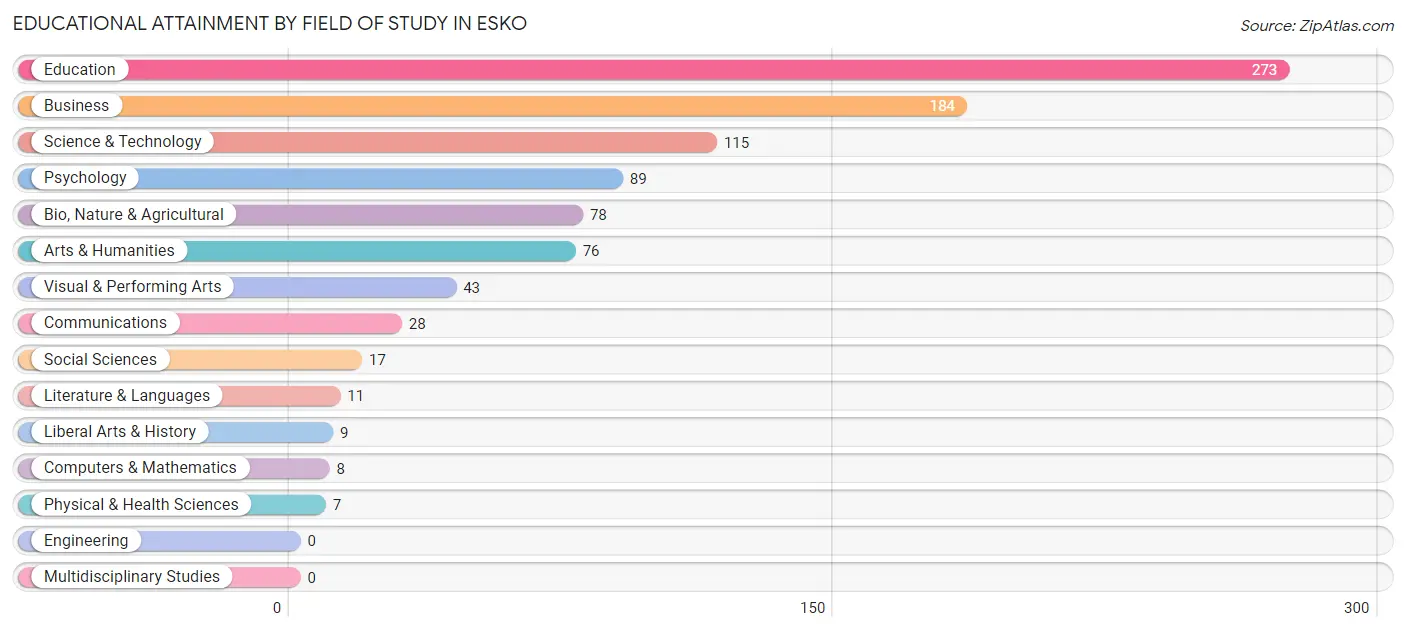
| Field of Study | # Graduates | % Graduates |
| Computers & Mathematics | 8 | 0.9% |
| Bio, Nature & Agricultural | 78 | 8.3% |
| Physical & Health Sciences | 7 | 0.7% |
| Psychology | 89 | 9.5% |
| Social Sciences | 17 | 1.8% |
| Engineering | 0 | 0.0% |
| Multidisciplinary Studies | 0 | 0.0% |
| Science & Technology | 115 | 12.3% |
| Business | 184 | 19.6% |
| Education | 273 | 29.1% |
| Literature & Languages | 11 | 1.2% |
| Liberal Arts & History | 9 | 1.0% |
| Visual & Performing Arts | 43 | 4.6% |
| Communications | 28 | 3.0% |
| Arts & Humanities | 76 | 8.1% |
| Total | 938 | 100.0% |
Transportation & Commute in Esko
Vehicle Availability by Sex in Esko
The most prevalent vehicle ownership categories in Esko are males with 2 vehicles (219, accounting for 34.6%) and females with 2 vehicles (229, making up 37.5%).
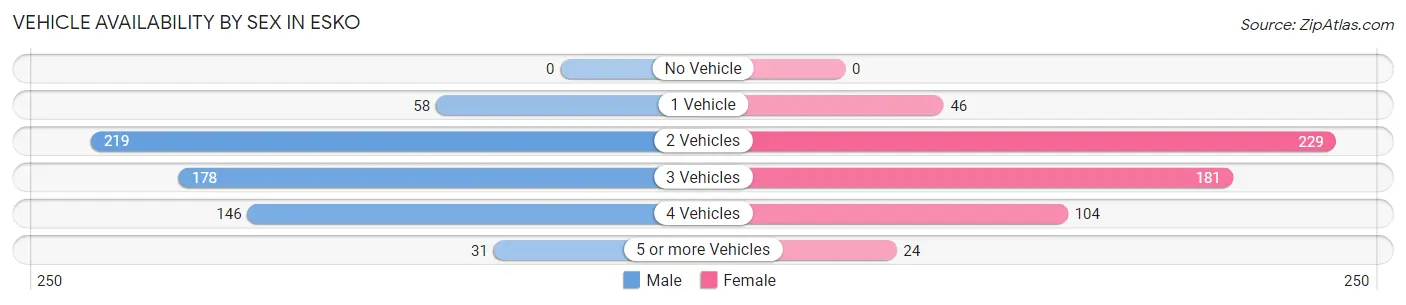
| Vehicles Available | Male | Female |
| No Vehicle | 0 (0.0%) | 0 (0.0%) |
| 1 Vehicle | 58 (9.2%) | 46 (7.9%) |
| 2 Vehicles | 219 (34.6%) | 229 (39.2%) |
| 3 Vehicles | 178 (28.2%) | 181 (31.0%) |
| 4 Vehicles | 146 (23.1%) | 104 (17.8%) |
| 5 or more Vehicles | 31 (4.9%) | 24 (4.1%) |
| Total | 632 (100.0%) | 584 (100.0%) |
Commute Time in Esko
The most frequently occuring commute durations in Esko are 10 to 14 minutes (261 commuters, 23.6%), 30 to 34 minutes (205 commuters, 18.6%), and 20 to 24 minutes (163 commuters, 14.8%).
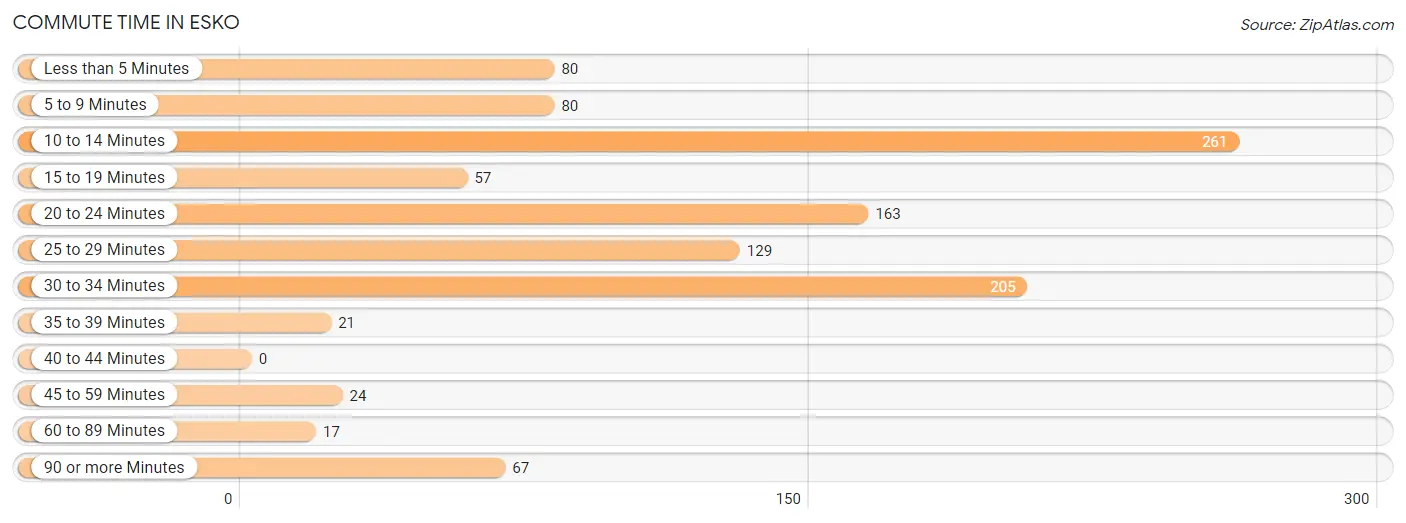
| Commute Time | # Commuters | % Commuters |
| Less than 5 Minutes | 80 | 7.2% |
| 5 to 9 Minutes | 80 | 7.2% |
| 10 to 14 Minutes | 261 | 23.6% |
| 15 to 19 Minutes | 57 | 5.2% |
| 20 to 24 Minutes | 163 | 14.8% |
| 25 to 29 Minutes | 129 | 11.7% |
| 30 to 34 Minutes | 205 | 18.6% |
| 35 to 39 Minutes | 21 | 1.9% |
| 40 to 44 Minutes | 0 | 0.0% |
| 45 to 59 Minutes | 24 | 2.2% |
| 60 to 89 Minutes | 17 | 1.5% |
| 90 or more Minutes | 67 | 6.1% |
Commute Time by Sex in Esko
The most common commute times in Esko are 20 to 24 minutes (152 commuters, 27.2%) for males and 10 to 14 minutes (182 commuters, 33.3%) for females.
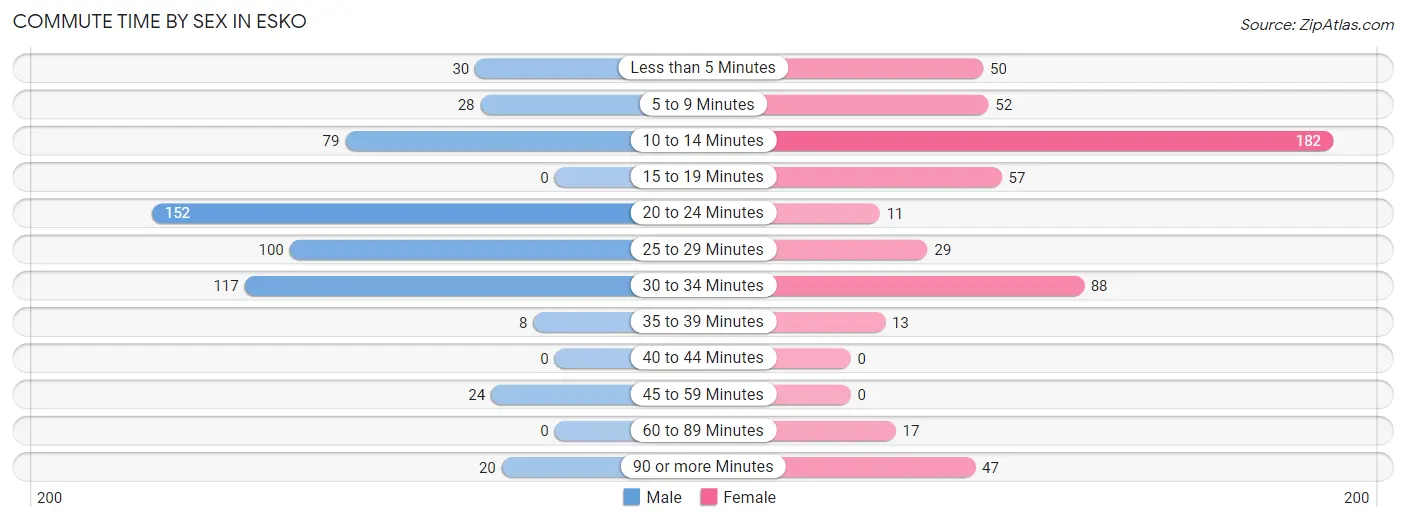
| Commute Time | Male | Female |
| Less than 5 Minutes | 30 (5.4%) | 50 (9.2%) |
| 5 to 9 Minutes | 28 (5.0%) | 52 (9.5%) |
| 10 to 14 Minutes | 79 (14.2%) | 182 (33.3%) |
| 15 to 19 Minutes | 0 (0.0%) | 57 (10.4%) |
| 20 to 24 Minutes | 152 (27.2%) | 11 (2.0%) |
| 25 to 29 Minutes | 100 (17.9%) | 29 (5.3%) |
| 30 to 34 Minutes | 117 (21.0%) | 88 (16.1%) |
| 35 to 39 Minutes | 8 (1.4%) | 13 (2.4%) |
| 40 to 44 Minutes | 0 (0.0%) | 0 (0.0%) |
| 45 to 59 Minutes | 24 (4.3%) | 0 (0.0%) |
| 60 to 89 Minutes | 0 (0.0%) | 17 (3.1%) |
| 90 or more Minutes | 20 (3.6%) | 47 (8.6%) |
Time of Departure to Work by Sex in Esko
The most frequent times of departure to work in Esko are 7:00 AM to 7:29 AM (118, 21.1%) for males and 7:00 AM to 7:29 AM (205, 37.6%) for females.
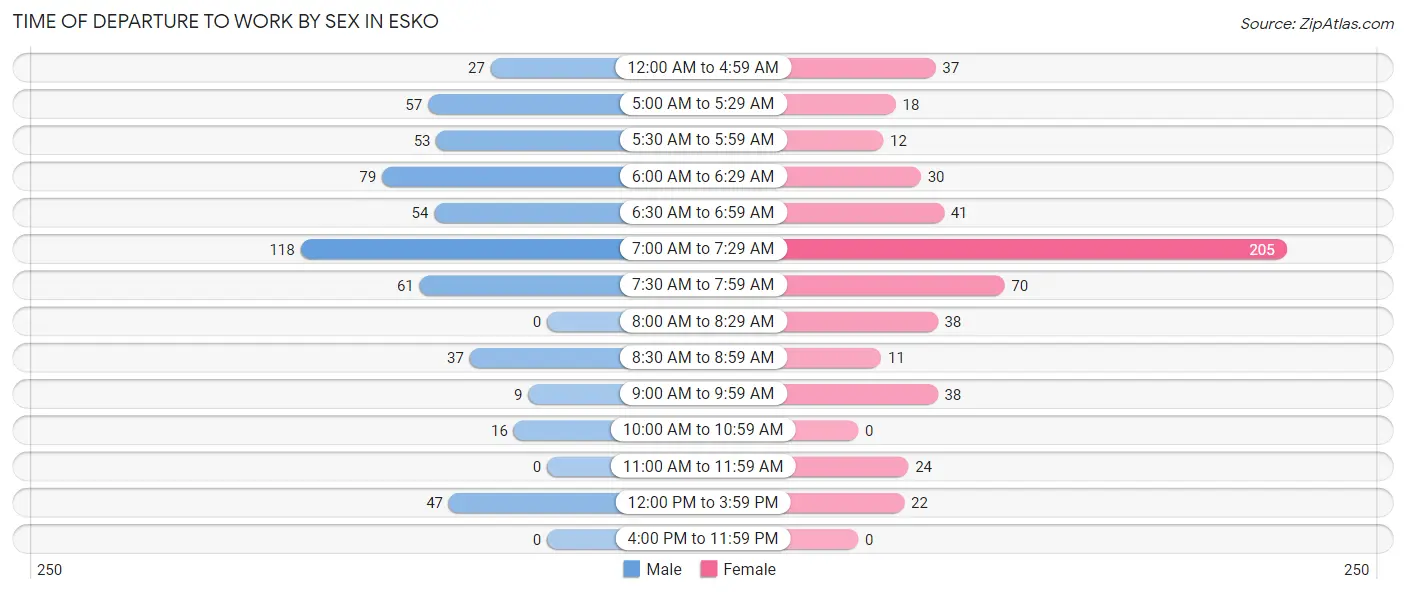
| Time of Departure | Male | Female |
| 12:00 AM to 4:59 AM | 27 (4.8%) | 37 (6.8%) |
| 5:00 AM to 5:29 AM | 57 (10.2%) | 18 (3.3%) |
| 5:30 AM to 5:59 AM | 53 (9.5%) | 12 (2.2%) |
| 6:00 AM to 6:29 AM | 79 (14.2%) | 30 (5.5%) |
| 6:30 AM to 6:59 AM | 54 (9.7%) | 41 (7.5%) |
| 7:00 AM to 7:29 AM | 118 (21.1%) | 205 (37.6%) |
| 7:30 AM to 7:59 AM | 61 (10.9%) | 70 (12.8%) |
| 8:00 AM to 8:29 AM | 0 (0.0%) | 38 (7.0%) |
| 8:30 AM to 8:59 AM | 37 (6.6%) | 11 (2.0%) |
| 9:00 AM to 9:59 AM | 9 (1.6%) | 38 (7.0%) |
| 10:00 AM to 10:59 AM | 16 (2.9%) | 0 (0.0%) |
| 11:00 AM to 11:59 AM | 0 (0.0%) | 24 (4.4%) |
| 12:00 PM to 3:59 PM | 47 (8.4%) | 22 (4.0%) |
| 4:00 PM to 11:59 PM | 0 (0.0%) | 0 (0.0%) |
| Total | 558 (100.0%) | 546 (100.0%) |
Housing Occupancy in Esko
Occupancy by Ownership in Esko
Of the total 876 dwellings in Esko, owner-occupied units account for 781 (89.2%), while renter-occupied units make up 95 (10.8%).
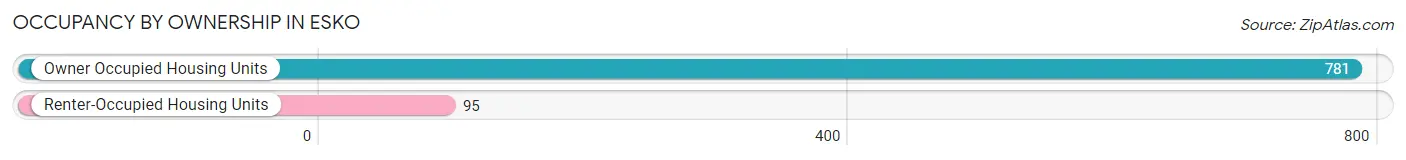
| Occupancy | # Housing Units | % Housing Units |
| Owner Occupied Housing Units | 781 | 89.2% |
| Renter-Occupied Housing Units | 95 | 10.8% |
| Total Occupied Housing Units | 876 | 100.0% |
Occupancy by Household Size in Esko
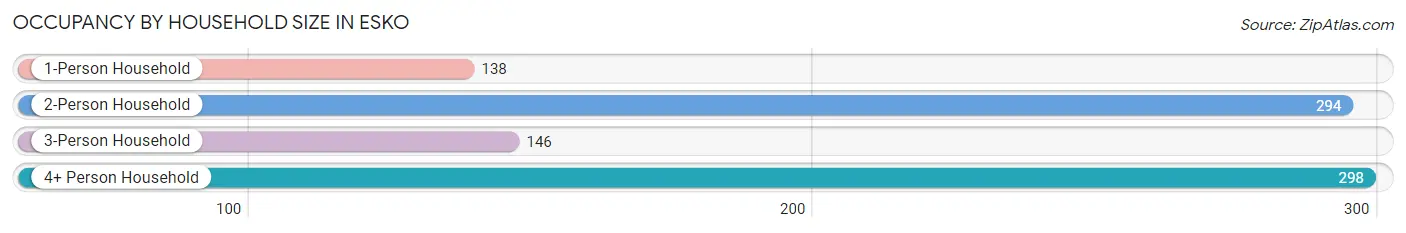
| Household Size | # Housing Units | % Housing Units |
| 1-Person Household | 138 | 15.8% |
| 2-Person Household | 294 | 33.6% |
| 3-Person Household | 146 | 16.7% |
| 4+ Person Household | 298 | 34.0% |
| Total Housing Units | 876 | 100.0% |
Occupancy by Ownership by Household Size in Esko
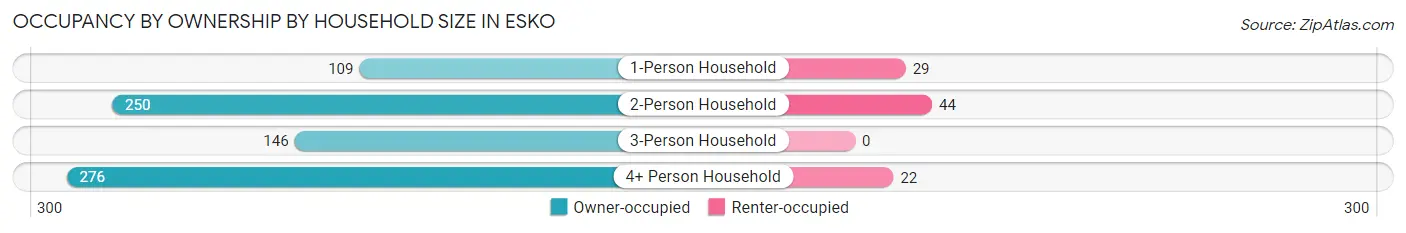
| Household Size | Owner-occupied | Renter-occupied |
| 1-Person Household | 109 (79.0%) | 29 (21.0%) |
| 2-Person Household | 250 (85.0%) | 44 (15.0%) |
| 3-Person Household | 146 (100.0%) | 0 (0.0%) |
| 4+ Person Household | 276 (92.6%) | 22 (7.4%) |
| Total Housing Units | 781 (89.2%) | 95 (10.8%) |
Occupancy by Educational Attainment in Esko
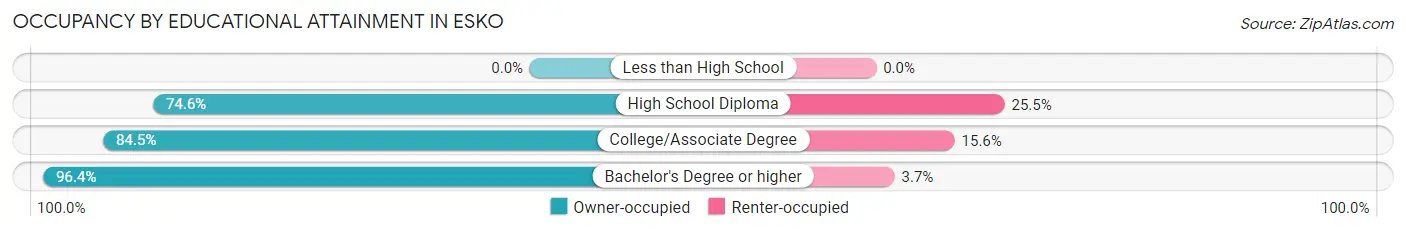
| Household Size | Owner-occupied | Renter-occupied |
| Less than High School | 0 (0.0%) | 0 (0.0%) |
| High School Diploma | 82 (74.6%) | 28 (25.5%) |
| College/Associate Degree | 277 (84.5%) | 51 (15.5%) |
| Bachelor's Degree or higher | 422 (96.4%) | 16 (3.6%) |
Occupancy by Age of Householder in Esko
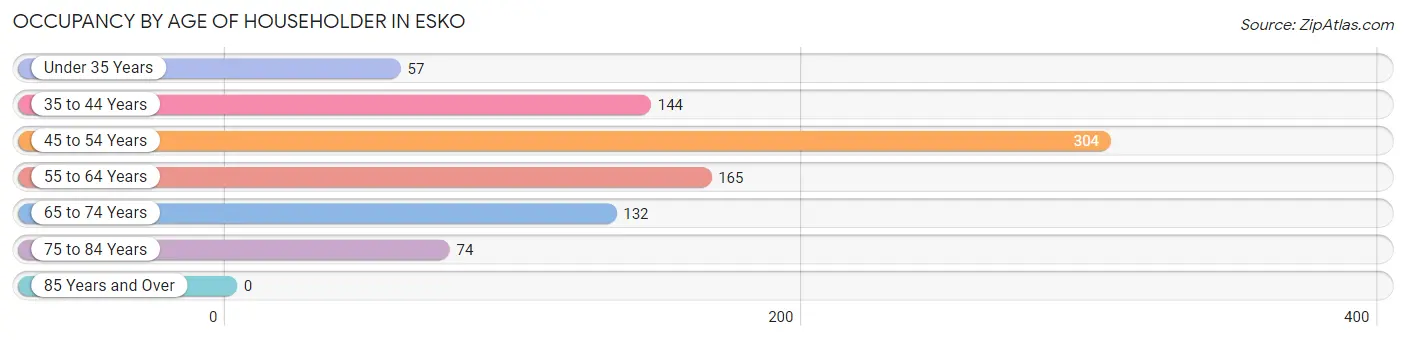
| Age Bracket | # Households | % Households |
| Under 35 Years | 57 | 6.5% |
| 35 to 44 Years | 144 | 16.4% |
| 45 to 54 Years | 304 | 34.7% |
| 55 to 64 Years | 165 | 18.8% |
| 65 to 74 Years | 132 | 15.1% |
| 75 to 84 Years | 74 | 8.5% |
| 85 Years and Over | 0 | 0.0% |
| Total | 876 | 100.0% |
Housing Finances in Esko
Median Income by Occupancy in Esko
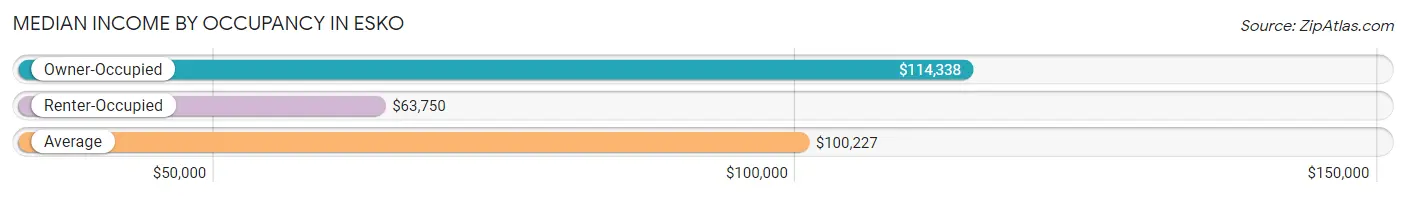
| Occupancy Type | # Households | Median Income |
| Owner-Occupied | 781 (89.2%) | $114,338 |
| Renter-Occupied | 95 (10.8%) | $63,750 |
| Average | 876 (100.0%) | $100,227 |
Occupancy by Householder Income Bracket in Esko
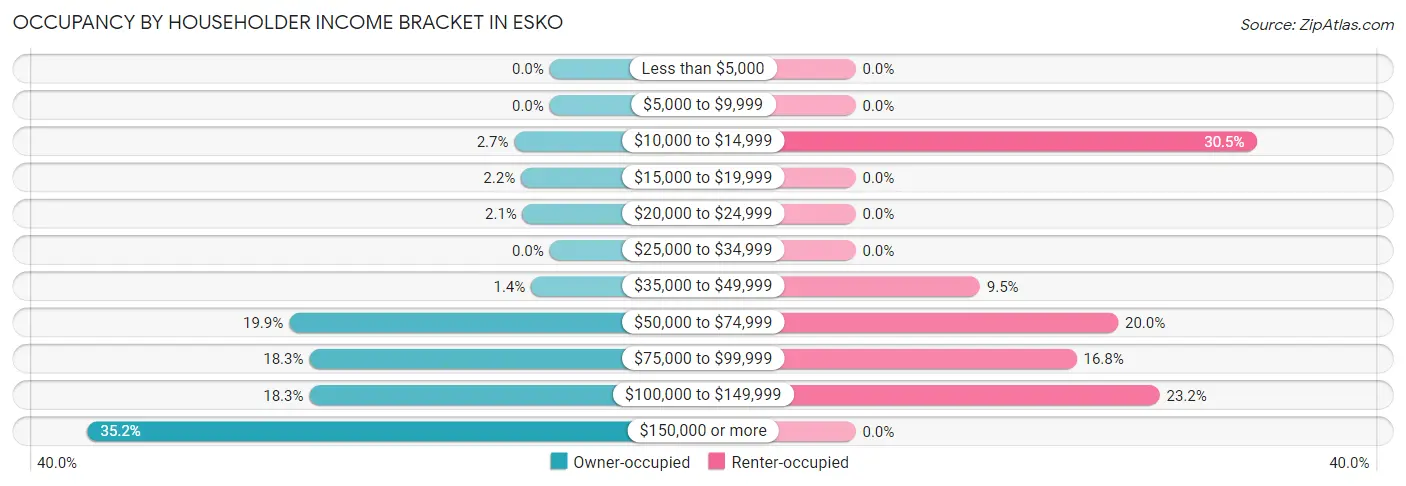
| Income Bracket | Owner-occupied | Renter-occupied |
| Less than $5,000 | 0 (0.0%) | 0 (0.0%) |
| $5,000 to $9,999 | 0 (0.0%) | 0 (0.0%) |
| $10,000 to $14,999 | 21 (2.7%) | 29 (30.5%) |
| $15,000 to $19,999 | 17 (2.2%) | 0 (0.0%) |
| $20,000 to $24,999 | 16 (2.1%) | 0 (0.0%) |
| $25,000 to $34,999 | 0 (0.0%) | 0 (0.0%) |
| $35,000 to $49,999 | 11 (1.4%) | 9 (9.5%) |
| $50,000 to $74,999 | 155 (19.9%) | 19 (20.0%) |
| $75,000 to $99,999 | 143 (18.3%) | 16 (16.8%) |
| $100,000 to $149,999 | 143 (18.3%) | 22 (23.2%) |
| $150,000 or more | 275 (35.2%) | 0 (0.0%) |
| Total | 781 (100.0%) | 95 (100.0%) |
Monthly Housing Cost Tiers in Esko
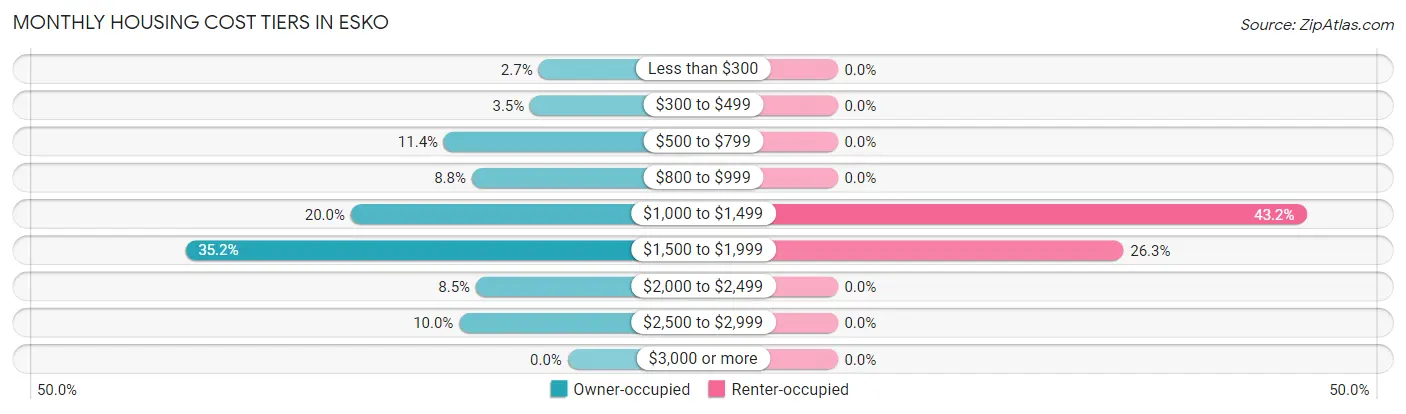
| Monthly Cost | Owner-occupied | Renter-occupied |
| Less than $300 | 21 (2.7%) | 0 (0.0%) |
| $300 to $499 | 27 (3.5%) | 0 (0.0%) |
| $500 to $799 | 89 (11.4%) | 0 (0.0%) |
| $800 to $999 | 69 (8.8%) | 0 (0.0%) |
| $1,000 to $1,499 | 156 (20.0%) | 41 (43.2%) |
| $1,500 to $1,999 | 275 (35.2%) | 25 (26.3%) |
| $2,000 to $2,499 | 66 (8.5%) | 0 (0.0%) |
| $2,500 to $2,999 | 78 (10.0%) | 0 (0.0%) |
| $3,000 or more | 0 (0.0%) | 0 (0.0%) |
| Total | 781 (100.0%) | 95 (100.0%) |
Physical Housing Characteristics in Esko
Housing Structures in Esko
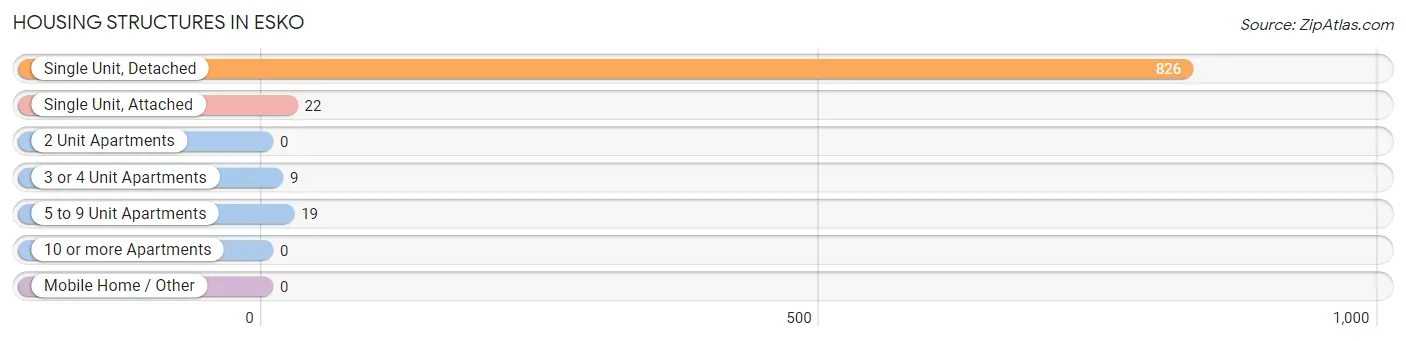
| Structure Type | # Housing Units | % Housing Units |
| Single Unit, Detached | 826 | 94.3% |
| Single Unit, Attached | 22 | 2.5% |
| 2 Unit Apartments | 0 | 0.0% |
| 3 or 4 Unit Apartments | 9 | 1.0% |
| 5 to 9 Unit Apartments | 19 | 2.2% |
| 10 or more Apartments | 0 | 0.0% |
| Mobile Home / Other | 0 | 0.0% |
| Total | 876 | 100.0% |
Housing Structures by Occupancy in Esko
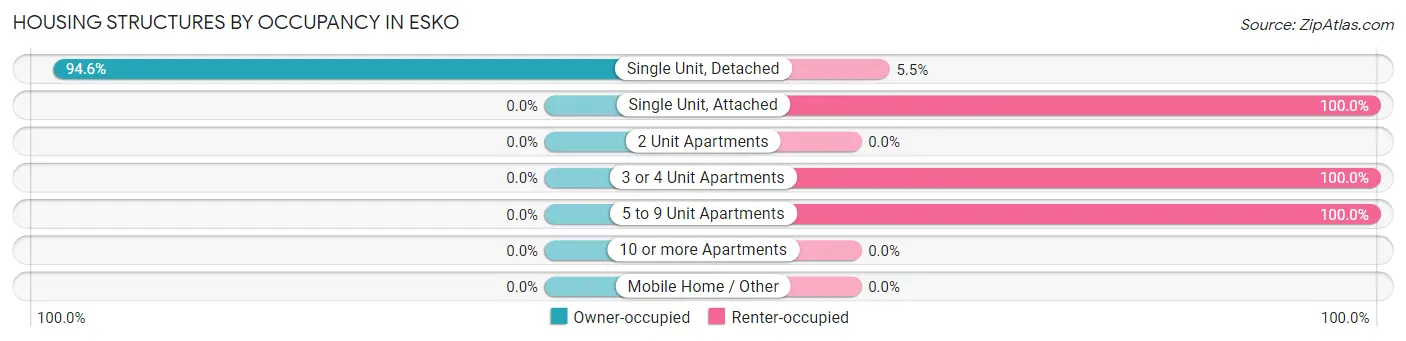
| Structure Type | Owner-occupied | Renter-occupied |
| Single Unit, Detached | 781 (94.6%) | 45 (5.4%) |
| Single Unit, Attached | 0 (0.0%) | 22 (100.0%) |
| 2 Unit Apartments | 0 (0.0%) | 0 (0.0%) |
| 3 or 4 Unit Apartments | 0 (0.0%) | 9 (100.0%) |
| 5 to 9 Unit Apartments | 0 (0.0%) | 19 (100.0%) |
| 10 or more Apartments | 0 (0.0%) | 0 (0.0%) |
| Mobile Home / Other | 0 (0.0%) | 0 (0.0%) |
| Total | 781 (89.2%) | 95 (10.8%) |
Housing Structures by Number of Rooms in Esko
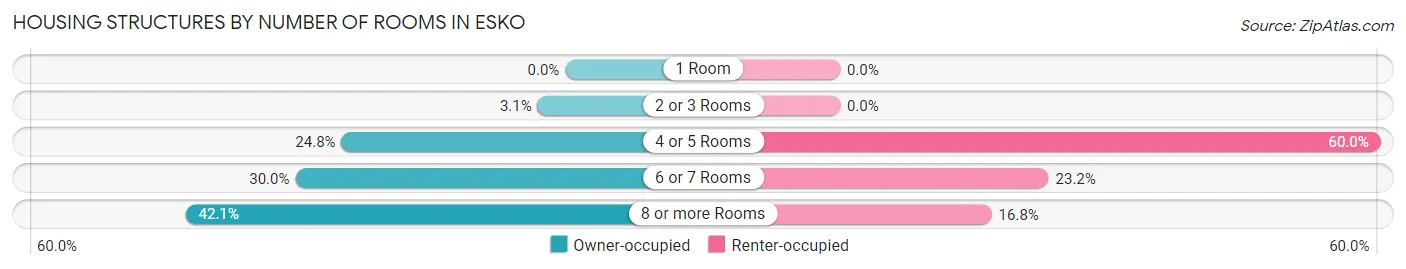
| Number of Rooms | Owner-occupied | Renter-occupied |
| 1 Room | 0 (0.0%) | 0 (0.0%) |
| 2 or 3 Rooms | 24 (3.1%) | 0 (0.0%) |
| 4 or 5 Rooms | 194 (24.8%) | 57 (60.0%) |
| 6 or 7 Rooms | 234 (30.0%) | 22 (23.2%) |
| 8 or more Rooms | 329 (42.1%) | 16 (16.8%) |
| Total | 781 (100.0%) | 95 (100.0%) |
Housing Structure by Heating Type in Esko
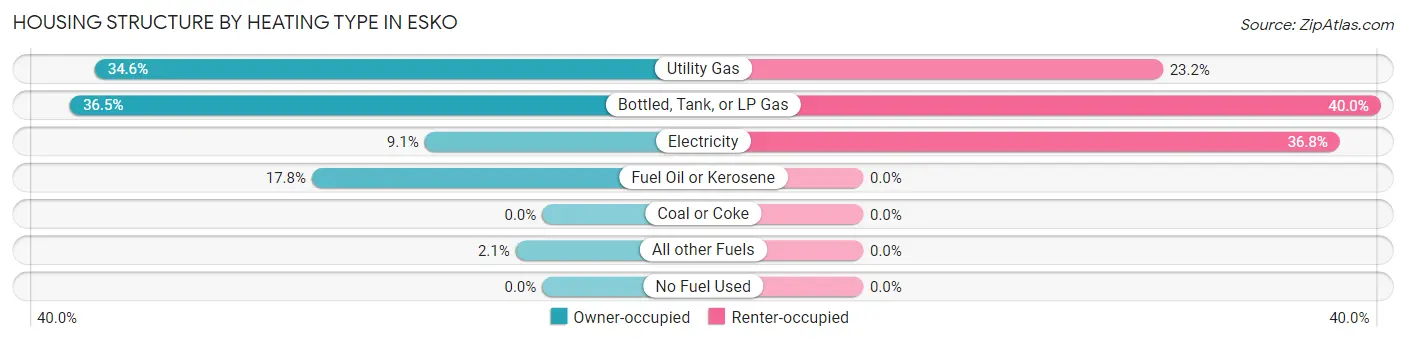
| Heating Type | Owner-occupied | Renter-occupied |
| Utility Gas | 270 (34.6%) | 22 (23.2%) |
| Bottled, Tank, or LP Gas | 285 (36.5%) | 38 (40.0%) |
| Electricity | 71 (9.1%) | 35 (36.8%) |
| Fuel Oil or Kerosene | 139 (17.8%) | 0 (0.0%) |
| Coal or Coke | 0 (0.0%) | 0 (0.0%) |
| All other Fuels | 16 (2.1%) | 0 (0.0%) |
| No Fuel Used | 0 (0.0%) | 0 (0.0%) |
| Total | 781 (100.0%) | 95 (100.0%) |
Household Vehicle Usage in Esko
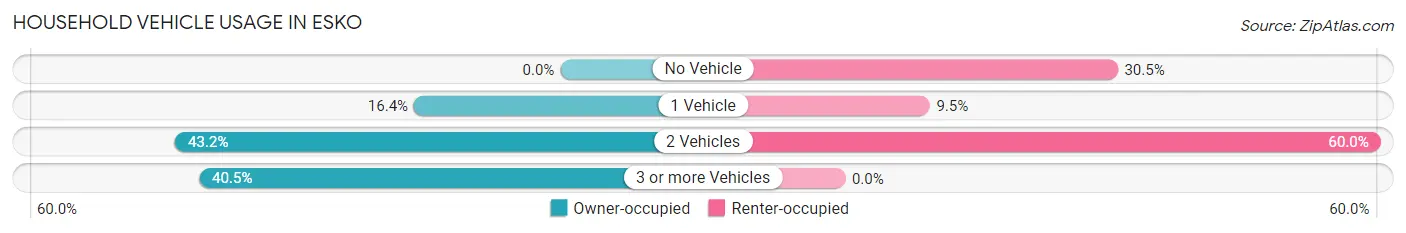
| Vehicles per Household | Owner-occupied | Renter-occupied |
| No Vehicle | 0 (0.0%) | 29 (30.5%) |
| 1 Vehicle | 128 (16.4%) | 9 (9.5%) |
| 2 Vehicles | 337 (43.1%) | 57 (60.0%) |
| 3 or more Vehicles | 316 (40.5%) | 0 (0.0%) |
| Total | 781 (100.0%) | 95 (100.0%) |
Real Estate & Mortgages in Esko
Real Estate and Mortgage Overview in Esko
| Characteristic | Without Mortgage | With Mortgage |
| Housing Units | 195 | 586 |
| Median Property Value | $326,500 | $236,200 |
| Median Household Income | $94,875 | $246 |
| Monthly Housing Costs | $658 | $0 |
| Real Estate Taxes | $3,464 | $0 |
Property Value by Mortgage Status in Esko
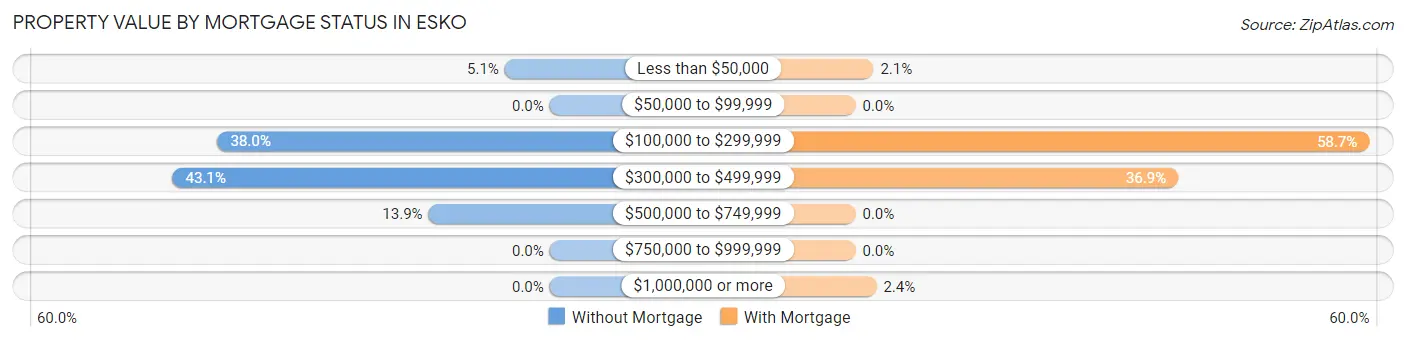
| Property Value | Without Mortgage | With Mortgage |
| Less than $50,000 | 10 (5.1%) | 12 (2.1%) |
| $50,000 to $99,999 | 0 (0.0%) | 0 (0.0%) |
| $100,000 to $299,999 | 74 (38.0%) | 344 (58.7%) |
| $300,000 to $499,999 | 84 (43.1%) | 216 (36.9%) |
| $500,000 to $749,999 | 27 (13.9%) | 0 (0.0%) |
| $750,000 to $999,999 | 0 (0.0%) | 0 (0.0%) |
| $1,000,000 or more | 0 (0.0%) | 14 (2.4%) |
| Total | 195 (100.0%) | 586 (100.0%) |
Household Income by Mortgage Status in Esko
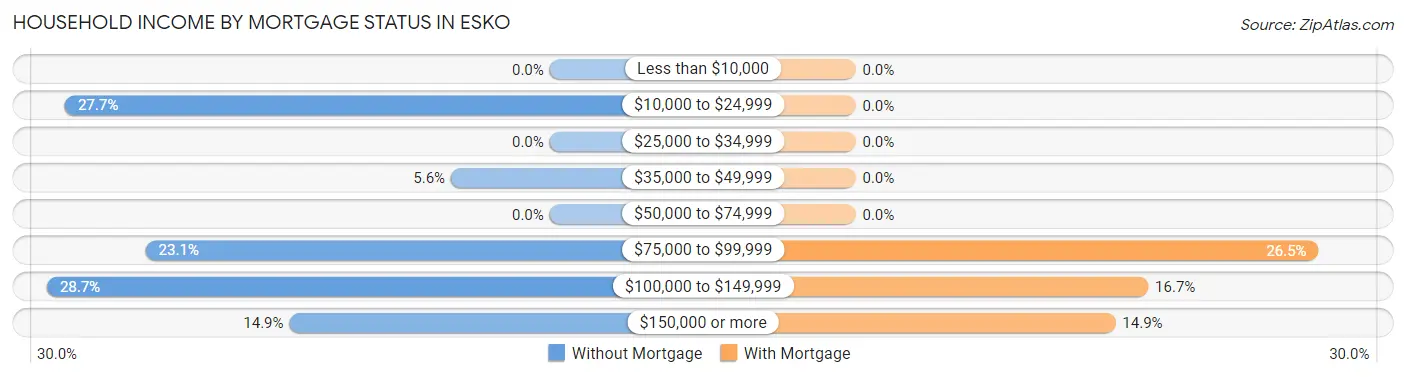
| Household Income | Without Mortgage | With Mortgage |
| Less than $10,000 | 0 (0.0%) | 0 (0.0%) |
| $10,000 to $24,999 | 54 (27.7%) | 0 (0.0%) |
| $25,000 to $34,999 | 0 (0.0%) | 0 (0.0%) |
| $35,000 to $49,999 | 11 (5.6%) | 0 (0.0%) |
| $50,000 to $74,999 | 0 (0.0%) | 0 (0.0%) |
| $75,000 to $99,999 | 45 (23.1%) | 155 (26.5%) |
| $100,000 to $149,999 | 56 (28.7%) | 98 (16.7%) |
| $150,000 or more | 29 (14.9%) | 87 (14.8%) |
| Total | 195 (100.0%) | 586 (100.0%) |
Property Value to Household Income Ratio in Esko
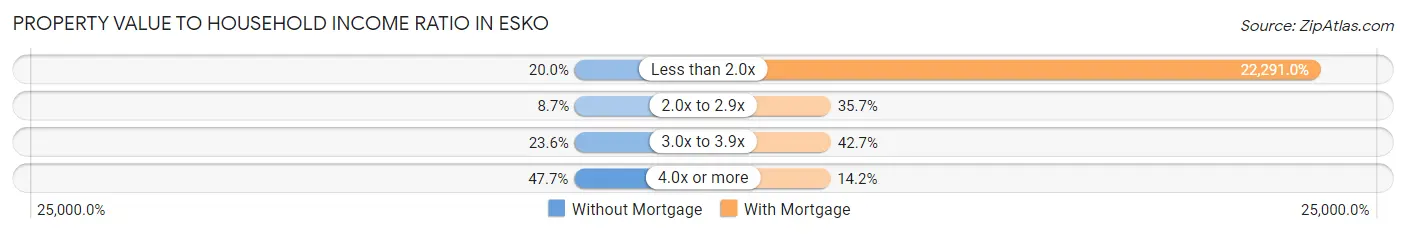
| Value-to-Income Ratio | Without Mortgage | With Mortgage |
| Less than 2.0x | 39 (20.0%) | 130,625 (22,291.0%) |
| 2.0x to 2.9x | 17 (8.7%) | 209 (35.7%) |
| 3.0x to 3.9x | 46 (23.6%) | 250 (42.7%) |
| 4.0x or more | 93 (47.7%) | 83 (14.2%) |
| Total | 195 (100.0%) | 586 (100.0%) |
Real Estate Taxes by Mortgage Status in Esko
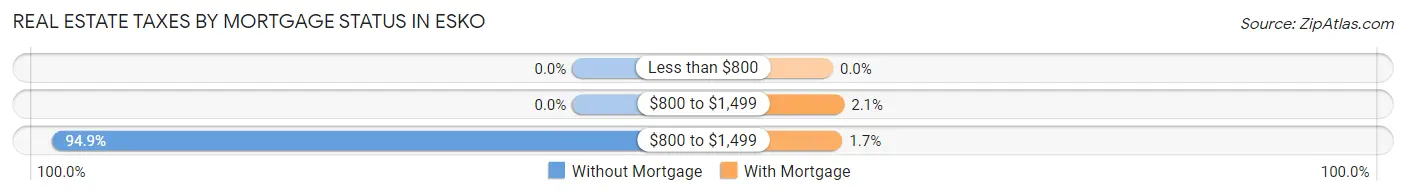
| Property Taxes | Without Mortgage | With Mortgage |
| Less than $800 | 0 (0.0%) | 0 (0.0%) |
| $800 to $1,499 | 0 (0.0%) | 12 (2.1%) |
| $800 to $1,499 | 185 (94.9%) | 10 (1.7%) |
| Total | 195 (100.0%) | 586 (100.0%) |
Health & Disability in Esko
Health Insurance Coverage by Age in Esko
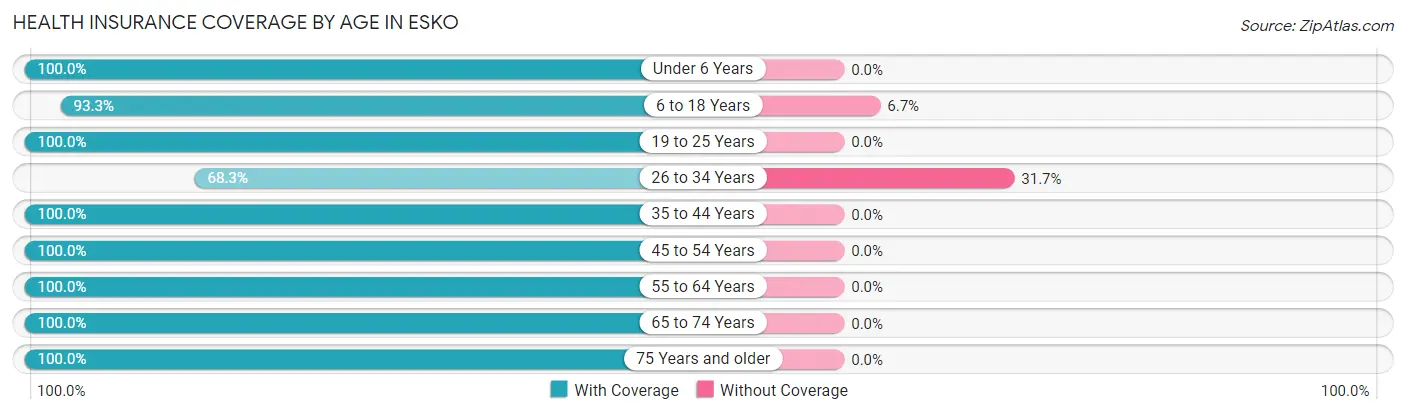
| Age Bracket | With Coverage | Without Coverage |
| Under 6 Years | 26 (100.0%) | 0 (0.0%) |
| 6 to 18 Years | 416 (93.3%) | 30 (6.7%) |
| 19 to 25 Years | 131 (100.0%) | 0 (0.0%) |
| 26 to 34 Years | 84 (68.3%) | 39 (31.7%) |
| 35 to 44 Years | 317 (100.0%) | 0 (0.0%) |
| 45 to 54 Years | 523 (100.0%) | 0 (0.0%) |
| 55 to 64 Years | 260 (100.0%) | 0 (0.0%) |
| 65 to 74 Years | 247 (100.0%) | 0 (0.0%) |
| 75 Years and older | 99 (100.0%) | 0 (0.0%) |
| Total | 2,103 (96.8%) | 69 (3.2%) |
Health Insurance Coverage by Citizenship Status in Esko
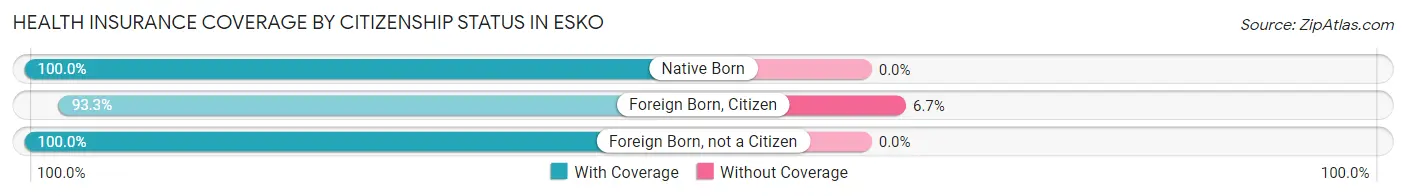
| Citizenship Status | With Coverage | Without Coverage |
| Native Born | 26 (100.0%) | 0 (0.0%) |
| Foreign Born, Citizen | 416 (93.3%) | 30 (6.7%) |
| Foreign Born, not a Citizen | 131 (100.0%) | 0 (0.0%) |
Health Insurance Coverage by Household Income in Esko
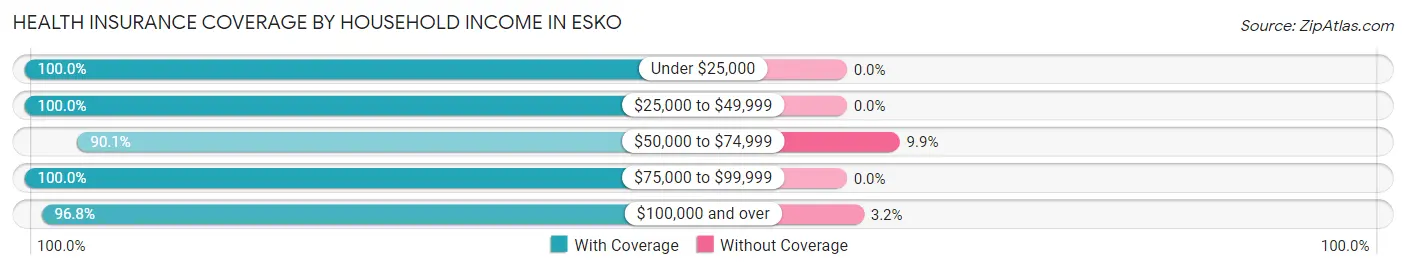
| Household Income | With Coverage | Without Coverage |
| Under $25,000 | 157 (100.0%) | 0 (0.0%) |
| $25,000 to $49,999 | 45 (100.0%) | 0 (0.0%) |
| $50,000 to $74,999 | 273 (90.1%) | 30 (9.9%) |
| $75,000 to $99,999 | 440 (100.0%) | 0 (0.0%) |
| $100,000 and over | 1,188 (96.8%) | 39 (3.2%) |
Public vs Private Health Insurance Coverage by Age in Esko
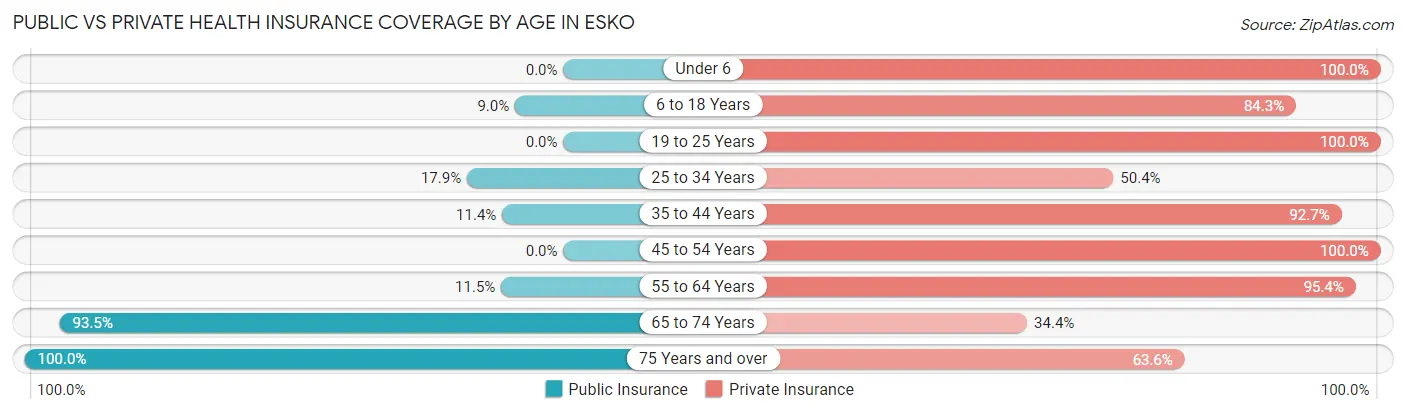
| Age Bracket | Public Insurance | Private Insurance |
| Under 6 | 0 (0.0%) | 26 (100.0%) |
| 6 to 18 Years | 40 (9.0%) | 376 (84.3%) |
| 19 to 25 Years | 0 (0.0%) | 131 (100.0%) |
| 25 to 34 Years | 22 (17.9%) | 62 (50.4%) |
| 35 to 44 Years | 36 (11.4%) | 294 (92.7%) |
| 45 to 54 Years | 0 (0.0%) | 523 (100.0%) |
| 55 to 64 Years | 30 (11.5%) | 248 (95.4%) |
| 65 to 74 Years | 231 (93.5%) | 85 (34.4%) |
| 75 Years and over | 99 (100.0%) | 63 (63.6%) |
| Total | 458 (21.1%) | 1,808 (83.2%) |
Disability Status by Sex by Age in Esko
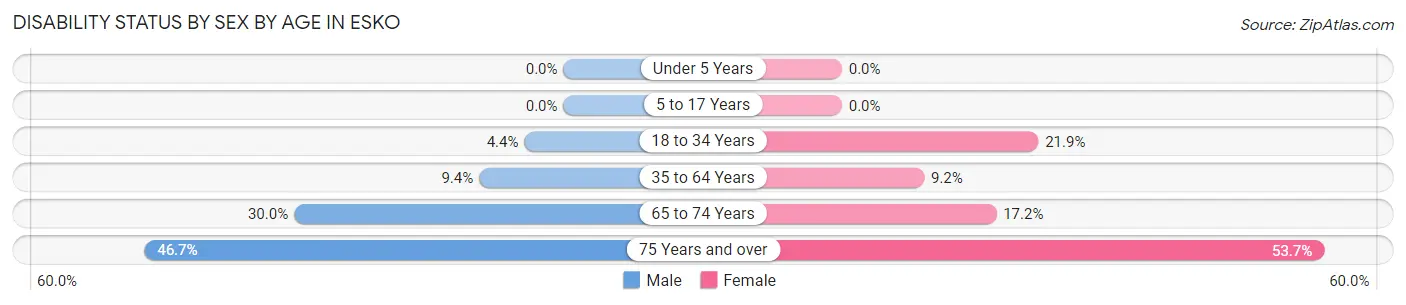
| Age Bracket | Male | Female |
| Under 5 Years | 0 (0.0%) | 0 (0.0%) |
| 5 to 17 Years | 0 (0.0%) | 0 (0.0%) |
| 18 to 34 Years | 9 (4.3%) | 14 (21.9%) |
| 35 to 64 Years | 51 (9.4%) | 51 (9.2%) |
| 65 to 74 Years | 27 (30.0%) | 27 (17.2%) |
| 75 Years and over | 21 (46.7%) | 29 (53.7%) |
Disability Class by Sex by Age in Esko
Disability Class: Hearing Difficulty
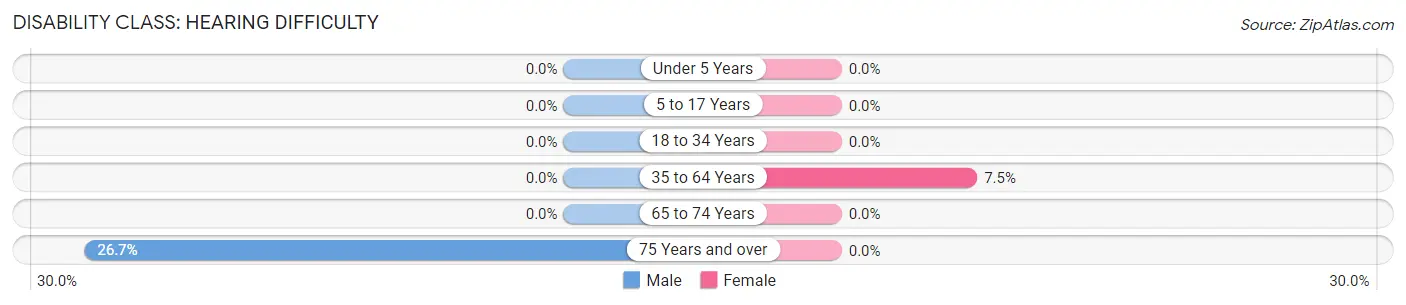
| Age Bracket | Male | Female |
| Under 5 Years | 0 (0.0%) | 0 (0.0%) |
| 5 to 17 Years | 0 (0.0%) | 0 (0.0%) |
| 18 to 34 Years | 0 (0.0%) | 0 (0.0%) |
| 35 to 64 Years | 0 (0.0%) | 42 (7.5%) |
| 65 to 74 Years | 0 (0.0%) | 0 (0.0%) |
| 75 Years and over | 12 (26.7%) | 0 (0.0%) |
Disability Class: Vision Difficulty
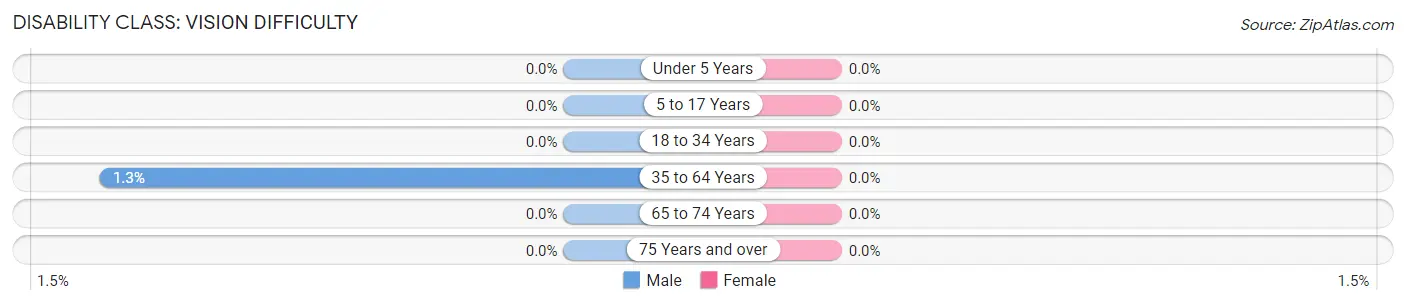
| Age Bracket | Male | Female |
| Under 5 Years | 0 (0.0%) | 0 (0.0%) |
| 5 to 17 Years | 0 (0.0%) | 0 (0.0%) |
| 18 to 34 Years | 0 (0.0%) | 0 (0.0%) |
| 35 to 64 Years | 7 (1.3%) | 0 (0.0%) |
| 65 to 74 Years | 0 (0.0%) | 0 (0.0%) |
| 75 Years and over | 0 (0.0%) | 0 (0.0%) |
Disability Class: Cognitive Difficulty
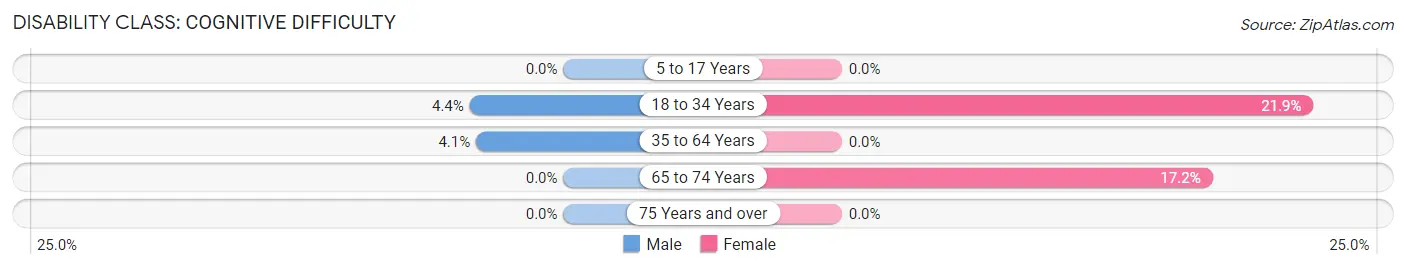
| Age Bracket | Male | Female |
| 5 to 17 Years | 0 (0.0%) | 0 (0.0%) |
| 18 to 34 Years | 9 (4.3%) | 14 (21.9%) |
| 35 to 64 Years | 22 (4.1%) | 0 (0.0%) |
| 65 to 74 Years | 0 (0.0%) | 27 (17.2%) |
| 75 Years and over | 0 (0.0%) | 0 (0.0%) |
Disability Class: Ambulatory Difficulty
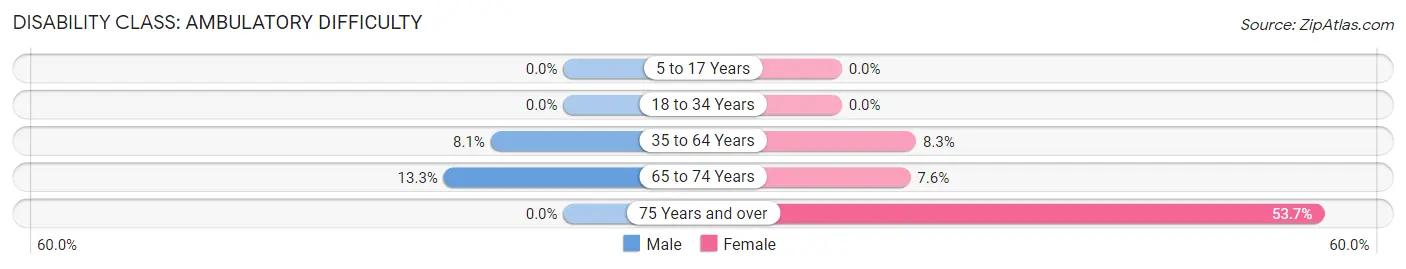
| Age Bracket | Male | Female |
| 5 to 17 Years | 0 (0.0%) | 0 (0.0%) |
| 18 to 34 Years | 0 (0.0%) | 0 (0.0%) |
| 35 to 64 Years | 44 (8.1%) | 46 (8.3%) |
| 65 to 74 Years | 12 (13.3%) | 12 (7.6%) |
| 75 Years and over | 0 (0.0%) | 29 (53.7%) |
Disability Class: Self-Care Difficulty
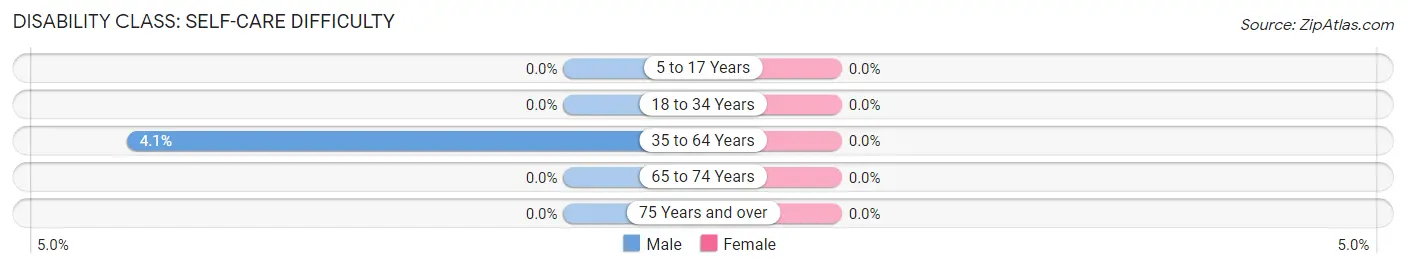
| Age Bracket | Male | Female |
| 5 to 17 Years | 0 (0.0%) | 0 (0.0%) |
| 18 to 34 Years | 0 (0.0%) | 0 (0.0%) |
| 35 to 64 Years | 22 (4.1%) | 0 (0.0%) |
| 65 to 74 Years | 0 (0.0%) | 0 (0.0%) |
| 75 Years and over | 0 (0.0%) | 0 (0.0%) |
Technology Access in Esko
Computing Device Access in Esko
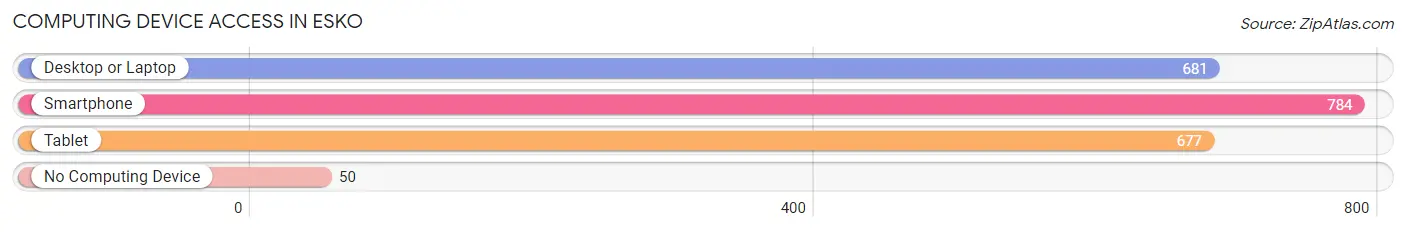
| Device Type | # Households | % Households |
| Desktop or Laptop | 681 | 77.7% |
| Smartphone | 784 | 89.5% |
| Tablet | 677 | 77.3% |
| No Computing Device | 50 | 5.7% |
| Total | 876 | 100.0% |
Internet Access in Esko
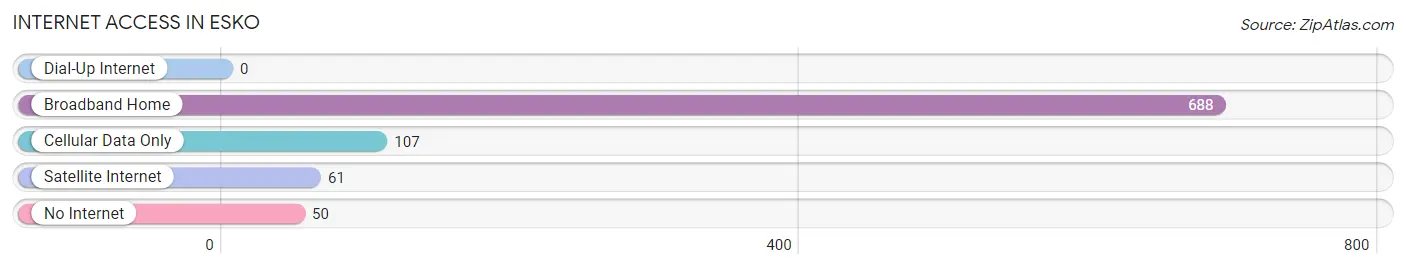
| Internet Type | # Households | % Households |
| Dial-Up Internet | 0 | 0.0% |
| Broadband Home | 688 | 78.5% |
| Cellular Data Only | 107 | 12.2% |
| Satellite Internet | 61 | 7.0% |
| No Internet | 50 | 5.7% |
| Total | 876 | 100.0% |
Esko Summary
Esko, Minnesota is a small town located in Carlton County, in the northeastern part of the state. It is situated on the banks of the Nemadji River, and is part of the Twin Ports metropolitan area. The town has a population of approximately 1,400 people, and is known for its rural charm and small-town atmosphere.
Geography
Esko is located in the northeastern part of Minnesota, in Carlton County. It is situated on the banks of the Nemadji River, and is part of the Twin Ports metropolitan area. The town is located approximately 25 miles south of Duluth, and is bordered by the cities of Cloquet and Scanlon. The town is situated on a flat plain, with rolling hills to the north and east. The climate in Esko is typical of the northern Midwest, with cold winters and warm summers.
Economy
Esko’s economy is largely based on agriculture and forestry. The town is home to several small farms, as well as a sawmill and a lumber yard. The town also has a few small businesses, including a grocery store, a hardware store, and a few restaurants. The town is also home to a few small manufacturing companies, including a paper mill and a plastics factory.
Demographics
As of the 2010 census, the population of Esko was 1,400 people. The racial makeup of the town was 97.3% White, 0.7% African American, 0.3% Native American, 0.3% Asian, 0.1% Pacific Islander, and 1.3% from other races. The median household income in Esko was $45,000, and the median age was 43.
History
Esko was first settled in the late 1800s by Finnish immigrants. The town was originally known as “Finn Town”, and was home to a large Finnish population. The town was officially incorporated in 1906, and the name was changed to Esko, after a Finnish explorer. The town grew slowly over the years, and by the 1950s, it had a population of around 1,000 people.
Today, Esko is a small, rural town with a population of around 1,400 people. The town is known for its rural charm and small-town atmosphere. It is a popular destination for outdoor recreation, and is home to several parks and trails. The town is also home to a few small businesses, and is a popular destination for tourists.
Common Questions
What is Per Capita Income in Esko?
Per Capita income in Esko is $42,529.
What is the Median Family Income in Esko?
Median Family Income in Esko is $106,875.
What is the Median Household income in Esko?
Median Household Income in Esko is $100,227.
What is Income or Wage Gap in Esko?
Income or Wage Gap in Esko is 9.1%.
Women in Esko earn 90.9 cents for every dollar earned by a man.
What is Inequality or Gini Index in Esko?
Inequality or Gini Index in Esko is 0.30.
What is the Total Population of Esko?
Total Population of Esko is 2,172.
What is the Total Male Population of Esko?
Total Male Population of Esko is 1,182.
What is the Total Female Population of Esko?
Total Female Population of Esko is 990.
What is the Ratio of Males per 100 Females in Esko?
There are 119.39 Males per 100 Females in Esko.
What is the Ratio of Females per 100 Males in Esko?
There are 83.76 Females per 100 Males in Esko.
What is the Median Population Age in Esko?
Median Population Age in Esko is 46.3 Years.
What is the Average Family Size in Esko
Average Family Size in Esko is 2.7 People.
What is the Average Household Size in Esko
Average Household Size in Esko is 2.5 People.
How Large is the Labor Force in Esko?
There are 1,250 People in the Labor Forcein in Esko.
What is the Percentage of People in the Labor Force in Esko?
70.4% of People are in the Labor Force in Esko.
What is the Unemployment Rate in Esko?
Unemployment Rate in Esko is 1.0%.