Zip Codes with the Highest Percentage of Population with a Degree in Psychology in Minnesota
RELATED REPORTS & OPTIONS
Psychology
Minnesota
Compare Zip Codes
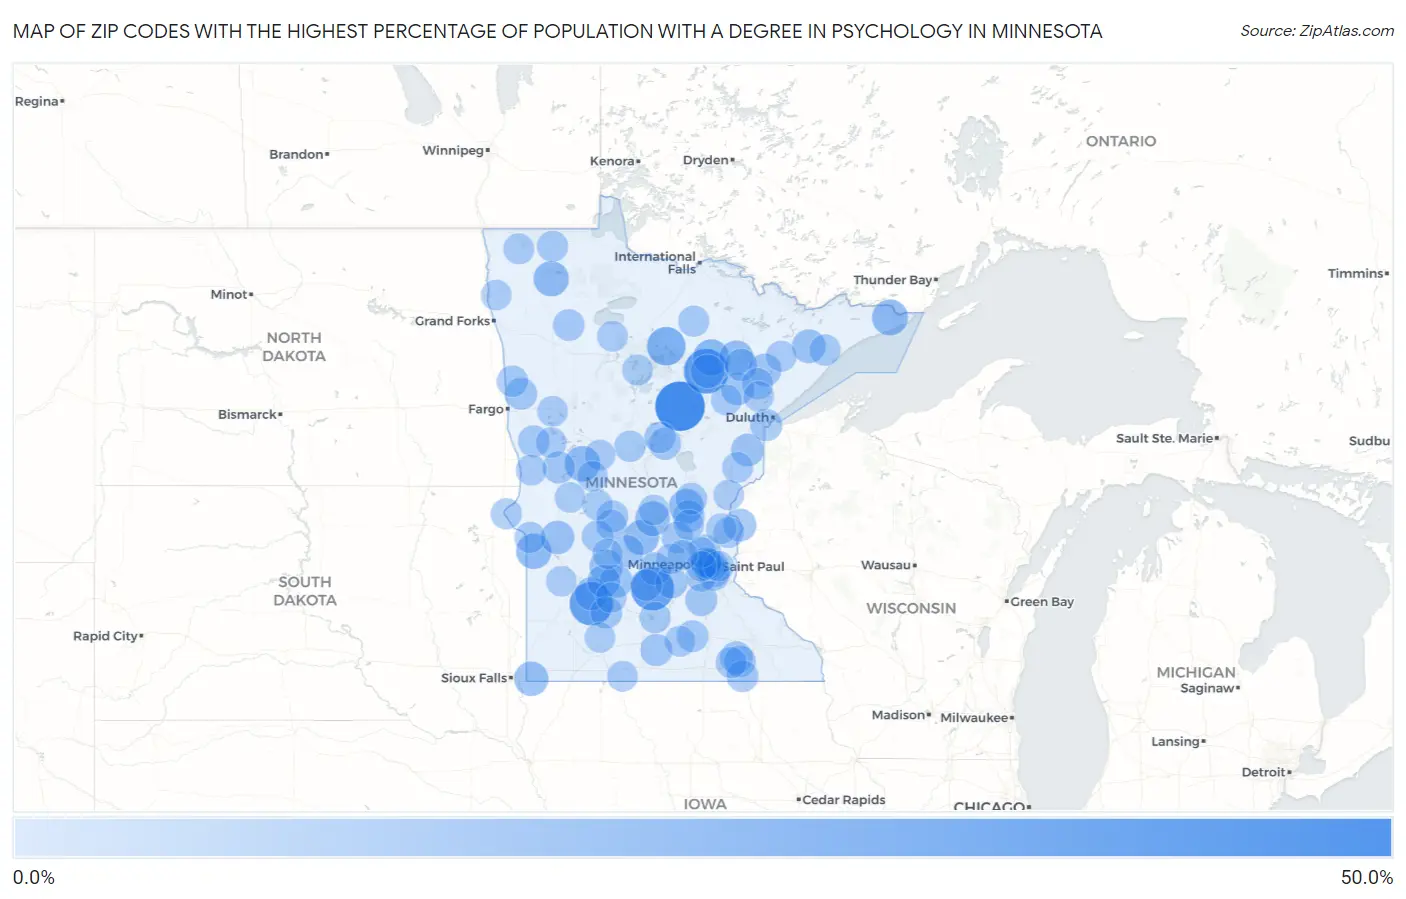
Map of Zip Codes with the Highest Percentage of Population with a Degree in Psychology in Minnesota
0.0%
50.0%
Zip Codes with the Highest Percentage of Population with a Degree in Psychology in Minnesota
| Zip Code | % Graduates | vs State | vs National | |
| 1. | 55785 | 46.4% | 5.1%(+41.3)#1 | 5.1%(+41.4)#140 |
| 2. | 55764 | 36.4% | 5.1%(+31.3)#2 | 5.1%(+31.3)#202 |
| 3. | 55366 | 33.3% | 5.1%(+28.2)#3 | 5.1%(+28.3)#242 |
| 4. | 56287 | 33.3% | 5.1%(+28.2)#4 | 5.1%(+28.3)#253 |
| 5. | 56659 | 23.8% | 5.1%(+18.7)#5 | 5.1%(+18.8)#465 |
| 6. | 55769 | 19.4% | 5.1%(+14.3)#6 | 5.1%(+14.4)#694 |
| 7. | 55606 | 18.6% | 5.1%(+13.5)#7 | 5.1%(+13.5)#760 |
| 8. | 56588 | 17.7% | 5.1%(+12.6)#8 | 5.1%(+12.7)#826 |
| 9. | 56737 | 17.3% | 5.1%(+12.2)#9 | 5.1%(+12.2)#873 |
| 10. | 56212 | 17.3% | 5.1%(+12.2)#10 | 5.1%(+12.2)#874 |
| 11. | 55389 | 16.7% | 5.1%(+11.6)#11 | 5.1%(+11.6)#923 |
| 12. | 56387 | 16.2% | 5.1%(+11.1)#12 | 5.1%(+11.1)#991 |
| 13. | 56363 | 16.0% | 5.1%(+10.9)#13 | 5.1%(+10.9)#1,012 |
| 14. | 56138 | 15.2% | 5.1%(+10.1)#14 | 5.1%(+10.1)#1,104 |
| 15. | 55713 | 14.9% | 5.1%(+9.83)#15 | 5.1%(+9.87)#1,141 |
| 16. | 55716 | 14.3% | 5.1%(+9.19)#16 | 5.1%(+9.23)#1,238 |
| 17. | 55607 | 14.0% | 5.1%(+8.94)#17 | 5.1%(+8.98)#1,280 |
| 18. | 56249 | 13.6% | 5.1%(+8.54)#18 | 5.1%(+8.59)#1,348 |
| 19. | 56216 | 13.5% | 5.1%(+8.39)#19 | 5.1%(+8.43)#1,388 |
| 20. | 55310 | 12.8% | 5.1%(+7.67)#20 | 5.1%(+7.71)#1,525 |
| 21. | 56214 | 12.7% | 5.1%(+7.58)#21 | 5.1%(+7.62)#1,552 |
| 22. | 56230 | 12.7% | 5.1%(+7.56)#22 | 5.1%(+7.61)#1,556 |
| 23. | 55765 | 12.6% | 5.1%(+7.54)#23 | 5.1%(+7.58)#1,561 |
| 24. | 55084 | 12.2% | 5.1%(+7.07)#24 | 5.1%(+7.11)#1,678 |
| 25. | 55756 | 12.1% | 5.1%(+7.03)#25 | 5.1%(+7.07)#1,692 |
| 26. | 55763 | 12.1% | 5.1%(+6.97)#26 | 5.1%(+7.02)#1,703 |
| 27. | 55381 | 12.0% | 5.1%(+6.93)#27 | 5.1%(+6.98)#1,715 |
| 28. | 55751 | 11.7% | 5.1%(+6.56)#28 | 5.1%(+6.61)#1,832 |
| 29. | 55973 | 11.6% | 5.1%(+6.53)#29 | 5.1%(+6.58)#1,840 |
| 30. | 56010 | 11.1% | 5.1%(+5.96)#30 | 5.1%(+6.00)#2,043 |
| 31. | 56455 | 11.0% | 5.1%(+5.93)#31 | 5.1%(+5.97)#2,053 |
| 32. | 55808 | 10.9% | 5.1%(+5.79)#32 | 5.1%(+5.84)#2,105 |
| 33. | 56324 | 10.9% | 5.1%(+5.78)#33 | 5.1%(+5.83)#2,109 |
| 34. | 55150 | 10.9% | 5.1%(+5.77)#34 | 5.1%(+5.82)#2,115 |
| 35. | 56243 | 10.8% | 5.1%(+5.70)#35 | 5.1%(+5.75)#2,138 |
| 36. | 55088 | 10.6% | 5.1%(+5.55)#36 | 5.1%(+5.59)#2,200 |
| 37. | 55368 | 10.5% | 5.1%(+5.43)#37 | 5.1%(+5.48)#2,241 |
| 38. | 56224 | 10.5% | 5.1%(+5.43)#38 | 5.1%(+5.48)#2,248 |
| 39. | 56536 | 10.4% | 5.1%(+5.32)#39 | 5.1%(+5.37)#2,291 |
| 40. | 55371 | 10.3% | 5.1%(+5.20)#40 | 5.1%(+5.24)#2,345 |
| 41. | 56093 | 10.2% | 5.1%(+5.12)#41 | 5.1%(+5.16)#2,380 |
| 42. | 55926 | 10.1% | 5.1%(+5.00)#42 | 5.1%(+5.05)#2,447 |
| 43. | 56684 | 10.0% | 5.1%(+4.90)#43 | 5.1%(+4.95)#2,497 |
| 44. | 56325 | 10.0% | 5.1%(+4.90)#44 | 5.1%(+4.95)#2,501 |
| 45. | 55977 | 10.0% | 5.1%(+4.90)#45 | 5.1%(+4.95)#2,503 |
| 46. | 56313 | 10.0% | 5.1%(+4.90)#46 | 5.1%(+4.95)#2,504 |
| 47. | 55121 | 10.0% | 5.1%(+4.89)#47 | 5.1%(+4.94)#2,508 |
| 48. | 56579 | 10.0% | 5.1%(+4.86)#48 | 5.1%(+4.90)#2,520 |
| 49. | 56289 | 9.9% | 5.1%(+4.82)#49 | 5.1%(+4.87)#2,548 |
| 50. | 55312 | 9.8% | 5.1%(+4.66)#50 | 5.1%(+4.70)#2,627 |
| 51. | 56465 | 9.7% | 5.1%(+4.65)#51 | 5.1%(+4.69)#2,639 |
| 52. | 55362 | 9.7% | 5.1%(+4.64)#52 | 5.1%(+4.68)#2,647 |
| 53. | 56574 | 9.6% | 5.1%(+4.52)#53 | 5.1%(+4.56)#2,721 |
| 54. | 56466 | 9.4% | 5.1%(+4.31)#54 | 5.1%(+4.36)#2,841 |
| 55. | 55724 | 9.2% | 5.1%(+4.13)#55 | 5.1%(+4.17)#2,971 |
| 56. | 56074 | 9.2% | 5.1%(+4.12)#56 | 5.1%(+4.17)#2,972 |
| 57. | 55918 | 9.1% | 5.1%(+3.99)#57 | 5.1%(+4.04)#3,060 |
| 58. | 55603 | 9.1% | 5.1%(+3.99)#58 | 5.1%(+4.04)#3,070 |
| 59. | 55433 | 8.9% | 5.1%(+3.78)#59 | 5.1%(+3.83)#3,242 |
| 60. | 56278 | 8.8% | 5.1%(+3.70)#60 | 5.1%(+3.74)#3,309 |
| 61. | 56219 | 8.7% | 5.1%(+3.65)#61 | 5.1%(+3.70)#3,343 |
| 62. | 55438 | 8.7% | 5.1%(+3.60)#62 | 5.1%(+3.65)#3,400 |
| 63. | 56714 | 8.7% | 5.1%(+3.60)#63 | 5.1%(+3.64)#3,405 |
| 64. | 56639 | 8.7% | 5.1%(+3.60)#64 | 5.1%(+3.64)#3,414 |
| 65. | 55405 | 8.7% | 5.1%(+3.57)#65 | 5.1%(+3.62)#3,441 |
| 66. | 56078 | 8.6% | 5.1%(+3.52)#66 | 5.1%(+3.57)#3,492 |
| 67. | 55072 | 8.5% | 5.1%(+3.42)#67 | 5.1%(+3.47)#3,589 |
| 68. | 56312 | 8.5% | 5.1%(+3.41)#68 | 5.1%(+3.45)#3,604 |
| 69. | 55750 | 8.5% | 5.1%(+3.35)#69 | 5.1%(+3.40)#3,657 |
| 70. | 56734 | 8.4% | 5.1%(+3.33)#70 | 5.1%(+3.38)#3,688 |
| 71. | 56522 | 8.3% | 5.1%(+3.24)#71 | 5.1%(+3.28)#3,786 |
| 72. | 56633 | 8.3% | 5.1%(+3.19)#72 | 5.1%(+3.24)#3,820 |
| 73. | 56534 | 8.2% | 5.1%(+3.15)#73 | 5.1%(+3.20)#3,855 |
| 74. | 56667 | 8.2% | 5.1%(+3.13)#74 | 5.1%(+3.18)#3,881 |
| 75. | 55114 | 8.2% | 5.1%(+3.09)#75 | 5.1%(+3.13)#3,928 |
| 76. | 56511 | 8.2% | 5.1%(+3.08)#76 | 5.1%(+3.13)#3,930 |
| 77. | 55736 | 8.1% | 5.1%(+3.03)#77 | 5.1%(+3.08)#3,985 |
| 78. | 55415 | 8.1% | 5.1%(+3.02)#78 | 5.1%(+3.06)#4,003 |
| 79. | 55013 | 8.1% | 5.1%(+2.97)#79 | 5.1%(+3.02)#4,050 |
| 80. | 56385 | 8.0% | 5.1%(+2.93)#80 | 5.1%(+2.98)#4,085 |
| 81. | 56453 | 8.0% | 5.1%(+2.90)#81 | 5.1%(+2.95)#4,130 |
| 82. | 56354 | 8.0% | 5.1%(+2.87)#82 | 5.1%(+2.91)#4,175 |
| 83. | 56127 | 7.9% | 5.1%(+2.84)#83 | 5.1%(+2.89)#4,213 |
| 84. | 55079 | 7.9% | 5.1%(+2.77)#84 | 5.1%(+2.81)#4,300 |
| 85. | 55063 | 7.8% | 5.1%(+2.73)#85 | 5.1%(+2.77)#4,341 |
| 86. | 56710 | 7.8% | 5.1%(+2.72)#86 | 5.1%(+2.76)#4,366 |
| 87. | 55717 | 7.8% | 5.1%(+2.72)#87 | 5.1%(+2.76)#4,368 |
| 88. | 56377 | 7.8% | 5.1%(+2.70)#88 | 5.1%(+2.75)#4,377 |
| 89. | 55411 | 7.8% | 5.1%(+2.69)#89 | 5.1%(+2.73)#4,393 |
| 90. | 55363 | 7.7% | 5.1%(+2.65)#90 | 5.1%(+2.69)#4,436 |
| 91. | 56223 | 7.7% | 5.1%(+2.64)#91 | 5.1%(+2.69)#4,440 |
| 92. | 55101 | 7.7% | 5.1%(+2.61)#92 | 5.1%(+2.65)#4,480 |
| 93. | 56343 | 7.7% | 5.1%(+2.60)#93 | 5.1%(+2.64)#4,509 |
| 94. | 56145 | 7.7% | 5.1%(+2.60)#94 | 5.1%(+2.64)#4,514 |
| 95. | 55445 | 7.7% | 5.1%(+2.59)#95 | 5.1%(+2.64)#4,530 |
| 96. | 55398 | 7.7% | 5.1%(+2.59)#96 | 5.1%(+2.63)#4,531 |
| 97. | 56270 | 7.6% | 5.1%(+2.52)#97 | 5.1%(+2.57)#4,623 |
| 98. | 55426 | 7.6% | 5.1%(+2.48)#98 | 5.1%(+2.52)#4,691 |
| 99. | 56201 | 7.6% | 5.1%(+2.46)#99 | 5.1%(+2.51)#4,714 |
| 100. | 55373 | 7.5% | 5.1%(+2.42)#100 | 5.1%(+2.46)#4,794 |
Common Questions
What are the Top 10 Zip Codes with the Highest Percentage of Population with a Degree in Psychology in Minnesota?
Top 10 Zip Codes with the Highest Percentage of Population with a Degree in Psychology in Minnesota are:
What zip code has the Highest Percentage of Population with a Degree in Psychology in Minnesota?
55785 has the Highest Percentage of Population with a Degree in Psychology in Minnesota with 46.4%.
What is the Percentage of Population with a Degree in Psychology in the State of Minnesota?
Percentage of Population with a Degree in Psychology in Minnesota is 5.1%.
What is the Percentage of Population with a Degree in Psychology in the United States?
Percentage of Population with a Degree in Psychology in the United States is 5.1%.