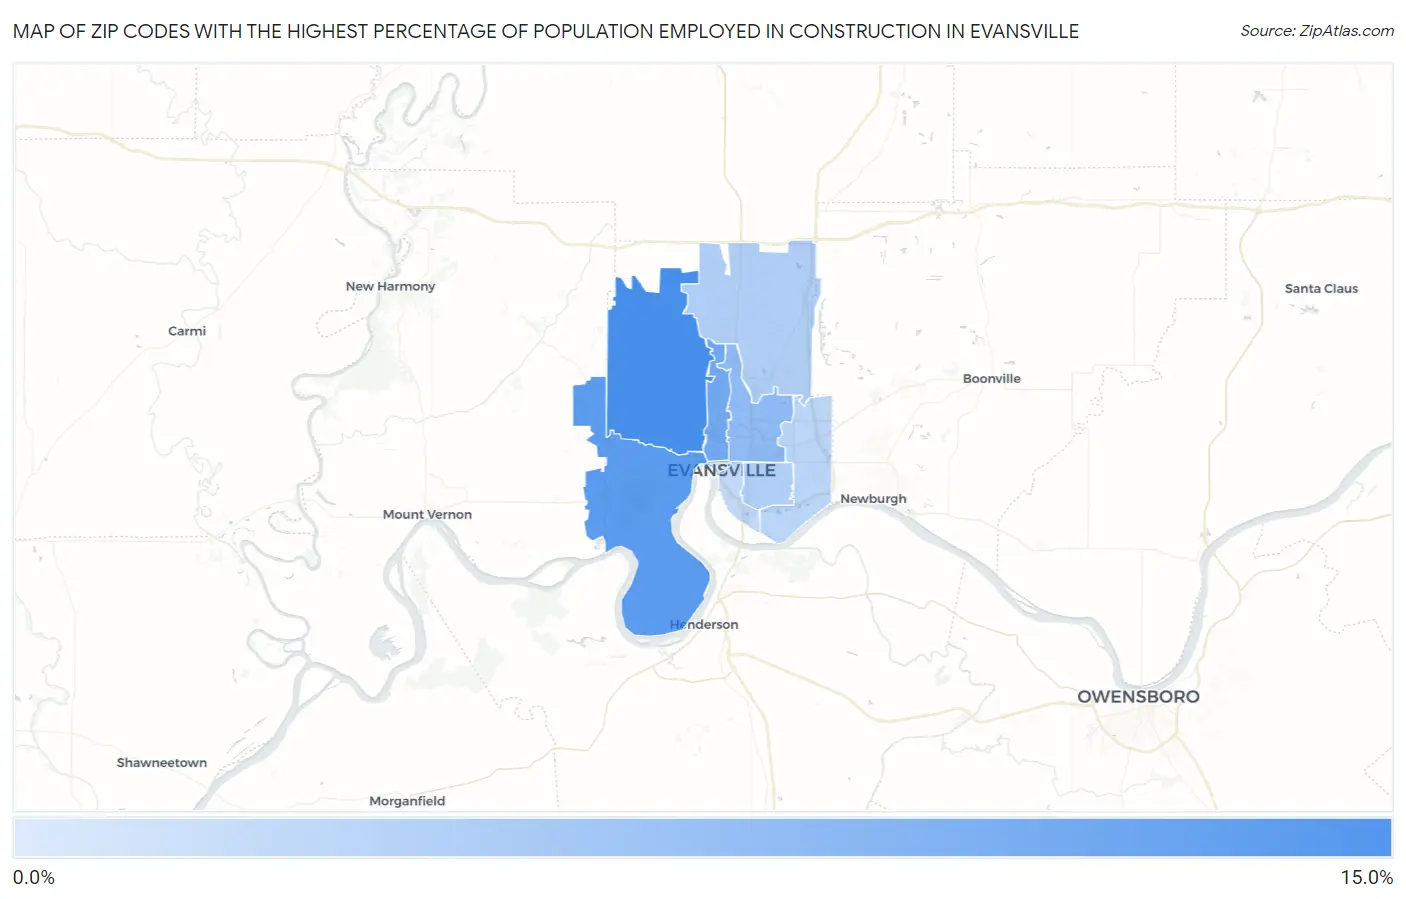
Zip Codes with the Highest Percentage of Population Employed in Construction in Evansville, IN
RELATED REPORTS & OPTIONS
Construction
Evansville
Compare Zip Codes
Map of Zip Codes with the Highest Percentage of Population Employed in Construction in Evansville
1.3%
10.1%

Zip Codes with the Highest Percentage of Population Employed in Construction in Evansville, IN
| Zip Code | % Employed | vs State | vs National | |
| 1. | 47720 | 10.1% | 6.4%(+3.65)#183 | 6.9%(+3.18)#8,477 |
| 2. | 47712 | 8.9% | 6.4%(+2.46)#236 | 6.9%(+1.98)#10,909 |
| 3. | 47710 | 7.5% | 6.4%(+1.13)#326 | 6.9%(+0.647)#14,259 |
| 4. | 47711 | 5.8% | 6.4%(-0.614)#464 | 6.9%(-1.09)#19,597 |
| 5. | 47725 | 3.9% | 6.4%(-2.50)#599 | 6.9%(-2.98)#24,989 |
| 6. | 47714 | 3.8% | 6.4%(-2.61)#604 | 6.9%(-3.09)#25,277 |
| 7. | 47715 | 3.3% | 6.4%(-3.13)#638 | 6.9%(-3.61)#26,359 |
| 8. | 47713 | 2.8% | 6.4%(-3.62)#662 | 6.9%(-4.09)#27,280 |
| 9. | 47708 | 1.3% | 6.4%(-5.12)#701 | 6.9%(-5.60)#29,047 |
1
Common Questions
What are the Top 5 Zip Codes with the Highest Percentage of Population Employed in Construction in Evansville, IN?
Top 5 Zip Codes with the Highest Percentage of Population Employed in Construction in Evansville, IN are:
What zip code has the Highest Percentage of Population Employed in Construction in Evansville, IN?
47720 has the Highest Percentage of Population Employed in Construction in Evansville, IN with 10.1%.
What is the Percentage of Population Employed in Construction in Evansville, IN?
Percentage of Population Employed in Construction in Evansville is 5.2%.
What is the Percentage of Population Employed in Construction in Indiana?
Percentage of Population Employed in Construction in Indiana is 6.4%.
What is the Percentage of Population Employed in Construction in the United States?
Percentage of Population Employed in Construction in the United States is 6.9%.