Rock Valley, IA Map & Demographics
Rock Valley Map
Rock Valley Overview
$35,539
PER CAPITA INCOME
$90,605
AVG FAMILY INCOME
$63,485
AVG HOUSEHOLD INCOME
35.1%
WAGE / INCOME GAP [ % ]
64.9¢/ $1
WAGE / INCOME GAP [ $ ]
0.45
INEQUALITY / GINI INDEX
4,045
TOTAL POPULATION
1,945
MALE POPULATION
2,100
FEMALE POPULATION
92.62
MALES / 100 FEMALES
107.97
FEMALES / 100 MALES
41.1
MEDIAN AGE
3.3
AVG FAMILY SIZE
2.5
AVG HOUSEHOLD SIZE
2,383
LABOR FORCE [ PEOPLE ]
74.9%
PERCENT IN LABOR FORCE
0.8%
UNEMPLOYMENT RATE
Rock Valley Zip Codes
Rock Valley Area Codes
Income in Rock Valley
Income Overview in Rock Valley
Per Capita Income in Rock Valley is $35,539, while median incomes of families and households are $90,605 and $63,485 respectively.
| Characteristic | Number | Measure |
| Per Capita Income | 4,045 | $35,539 |
| Median Family Income | 967 | $90,605 |
| Mean Family Income | 967 | $112,080 |
| Median Household Income | 1,594 | $63,485 |
| Mean Household Income | 1,594 | $89,808 |
| Income Deficit | 967 | $0 |
| Wage / Income Gap (%) | 4,045 | 35.13% |
| Wage / Income Gap ($) | 4,045 | 64.87¢ per $1 |
| Gini / Inequality Index | 4,045 | 0.45 |
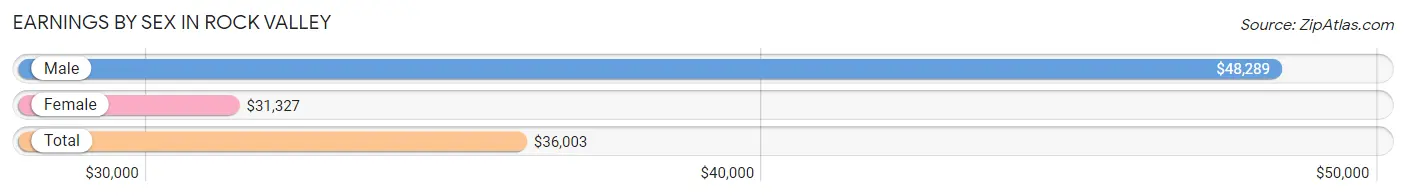
Earnings by Sex in Rock Valley
Average Earnings in Rock Valley are $36,003, $48,289 for men and $31,327 for women, a difference of 35.1%.
| Sex | Number | Average Earnings |
| Male | 1,258 (50.4%) | $48,289 |
| Female | 1,240 (49.6%) | $31,327 |
| Total | 2,498 (100.0%) | $36,003 |
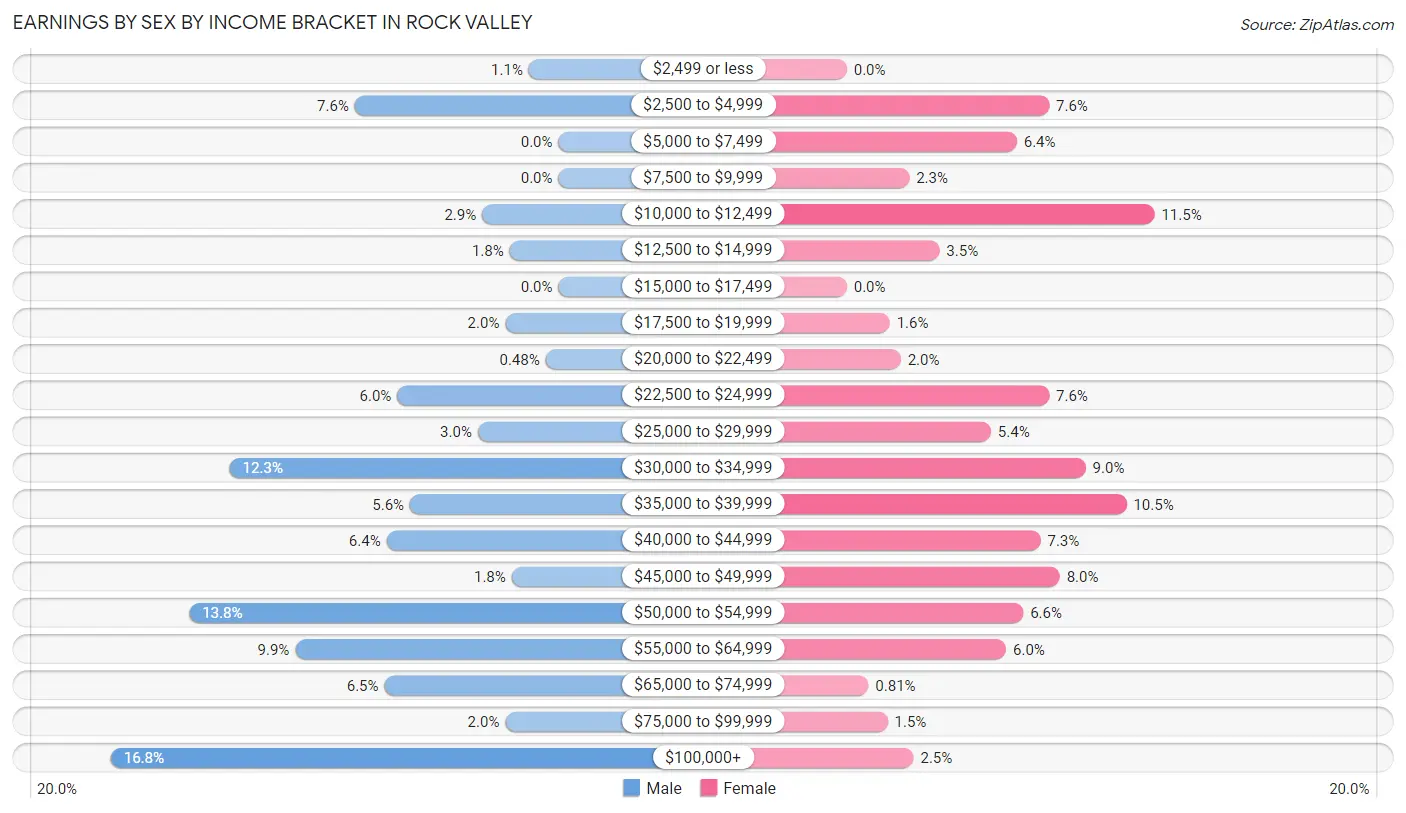
Earnings by Sex by Income Bracket in Rock Valley
The most common earnings brackets in Rock Valley are $100,000+ for men (211 | 16.8%) and $10,000 to $12,499 for women (143 | 11.5%).
| Income | Male | Female |
| $2,499 or less | 14 (1.1%) | 0 (0.0%) |
| $2,500 to $4,999 | 96 (7.6%) | 94 (7.6%) |
| $5,000 to $7,499 | 0 (0.0%) | 79 (6.4%) |
| $7,500 to $9,999 | 0 (0.0%) | 29 (2.3%) |
| $10,000 to $12,499 | 36 (2.9%) | 143 (11.5%) |
| $12,500 to $14,999 | 23 (1.8%) | 43 (3.5%) |
| $15,000 to $17,499 | 0 (0.0%) | 0 (0.0%) |
| $17,500 to $19,999 | 25 (2.0%) | 20 (1.6%) |
| $20,000 to $22,499 | 6 (0.5%) | 25 (2.0%) |
| $22,500 to $24,999 | 76 (6.0%) | 94 (7.6%) |
| $25,000 to $29,999 | 38 (3.0%) | 67 (5.4%) |
| $30,000 to $34,999 | 155 (12.3%) | 111 (8.9%) |
| $35,000 to $39,999 | 70 (5.6%) | 130 (10.5%) |
| $40,000 to $44,999 | 81 (6.4%) | 90 (7.3%) |
| $45,000 to $49,999 | 22 (1.8%) | 99 (8.0%) |
| $50,000 to $54,999 | 174 (13.8%) | 82 (6.6%) |
| $55,000 to $64,999 | 124 (9.9%) | 74 (6.0%) |
| $65,000 to $74,999 | 82 (6.5%) | 10 (0.8%) |
| $75,000 to $99,999 | 25 (2.0%) | 19 (1.5%) |
| $100,000+ | 211 (16.8%) | 31 (2.5%) |
| Total | 1,258 (100.0%) | 1,240 (100.0%) |
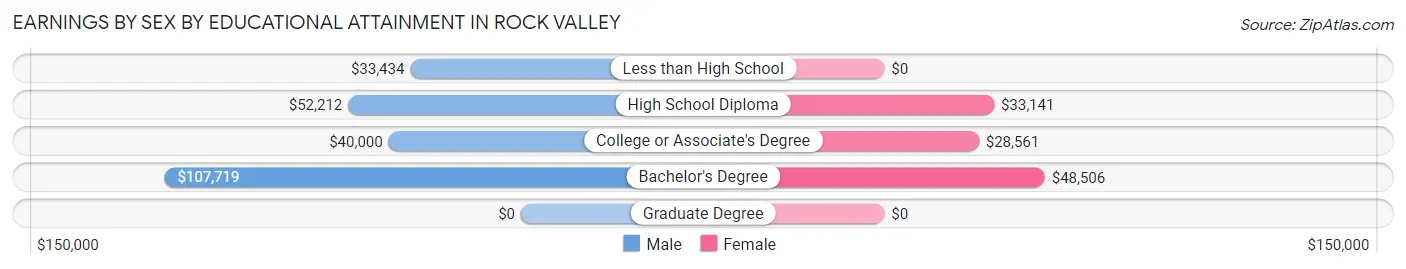
Earnings by Sex by Educational Attainment in Rock Valley
Average earnings in Rock Valley are $51,392 for men and $35,074 for women, a difference of 31.8%. Men with an educational attainment of bachelor's degree enjoy the highest average annual earnings of $107,719, while those with less than high school education earn the least with $33,434. Women with an educational attainment of bachelor's degree earn the most with the average annual earnings of $48,506, while those with college or associate's degree education have the smallest earnings of $28,561.
| Educational Attainment | Male Income | Female Income |
| Less than High School | $33,434 | $0 |
| High School Diploma | $52,212 | $33,141 |
| College or Associate's Degree | $40,000 | $28,561 |
| Bachelor's Degree | $107,719 | $48,506 |
| Graduate Degree | - | - |
| Total | $51,392 | $35,074 |
Family Income in Rock Valley
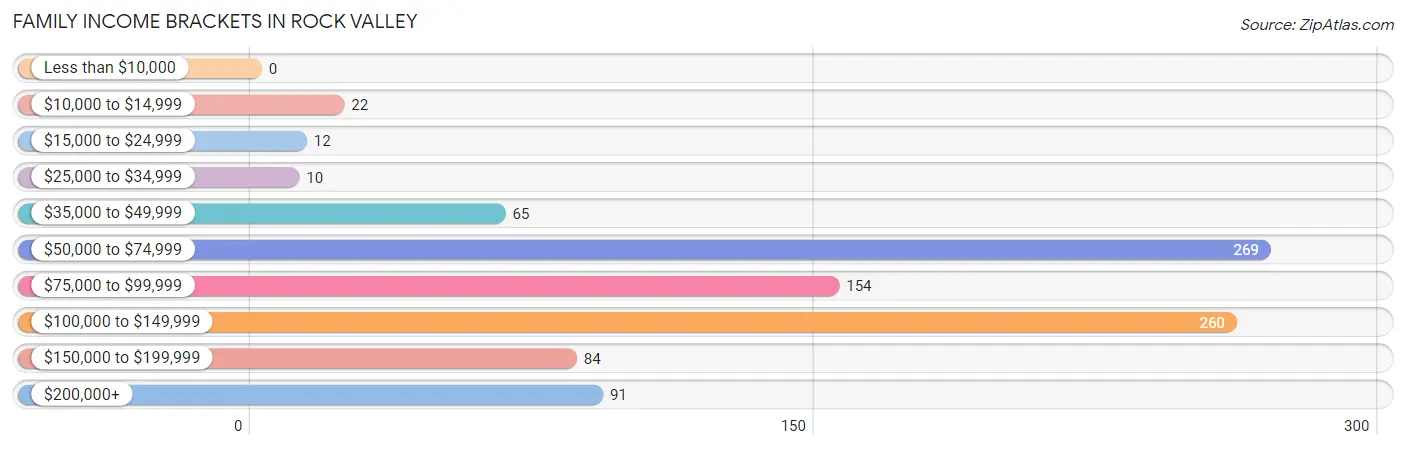
Family Income Brackets in Rock Valley
According to the Rock Valley family income data, there are 269 families falling into the $50,000 to $74,999 income range, which is the most common income bracket and makes up 27.8% of all families.
| Income Bracket | # Families | % Families |
| Less than $10,000 | 0 | 0.0% |
| $10,000 to $14,999 | 22 | 2.3% |
| $15,000 to $24,999 | 12 | 1.2% |
| $25,000 to $34,999 | 10 | 1.0% |
| $35,000 to $49,999 | 65 | 6.7% |
| $50,000 to $74,999 | 269 | 27.8% |
| $75,000 to $99,999 | 154 | 15.9% |
| $100,000 to $149,999 | 260 | 26.9% |
| $150,000 to $199,999 | 84 | 8.7% |
| $200,000+ | 91 | 9.4% |
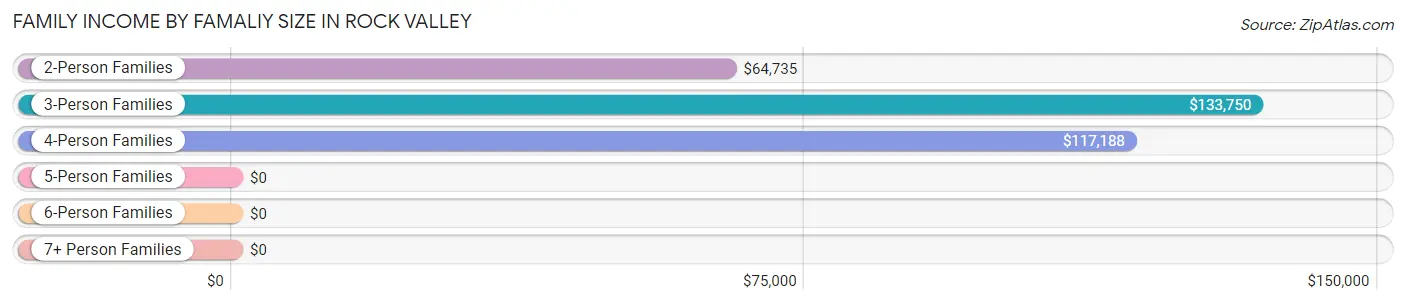
Family Income by Famaliy Size in Rock Valley
3-person families (76 | 7.9%) account for the highest median family income in Rock Valley with $133,750 per family, while 3-person families (76 | 7.9%) have the highest median income of $44,583 per family member.
| Income Bracket | # Families | Median Income |
| 2-Person Families | 430 (44.5%) | $64,735 |
| 3-Person Families | 76 (7.9%) | $133,750 |
| 4-Person Families | 231 (23.9%) | $117,188 |
| 5-Person Families | 149 (15.4%) | $0 |
| 6-Person Families | 81 (8.4%) | $0 |
| 7+ Person Families | 0 (0.0%) | $0 |
| Total | 967 (100.0%) | $90,605 |
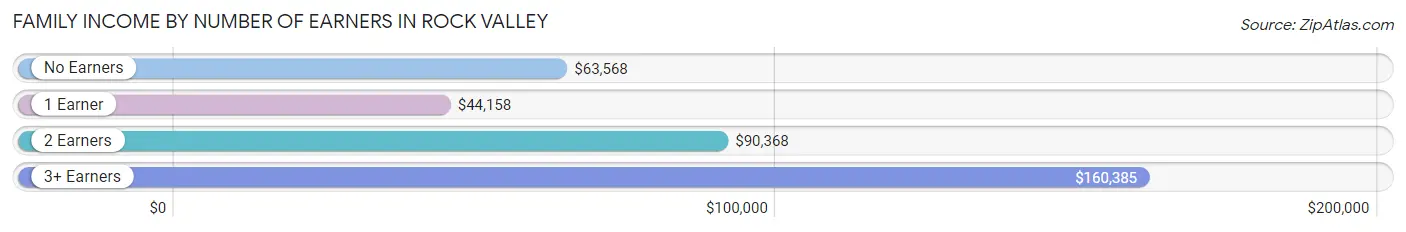
Family Income by Number of Earners in Rock Valley
The median family income in Rock Valley is $90,605, with families comprising 3+ earners (186) having the highest median family income of $160,385, while families with 1 earner (105) have the lowest median family income of $44,158, accounting for 19.2% and 10.9% of families, respectively.
| Number of Earners | # Families | Median Income |
| No Earners | 91 (9.4%) | $63,568 |
| 1 Earner | 105 (10.9%) | $44,158 |
| 2 Earners | 585 (60.5%) | $90,368 |
| 3+ Earners | 186 (19.2%) | $160,385 |
| Total | 967 (100.0%) | $90,605 |
Household Income in Rock Valley
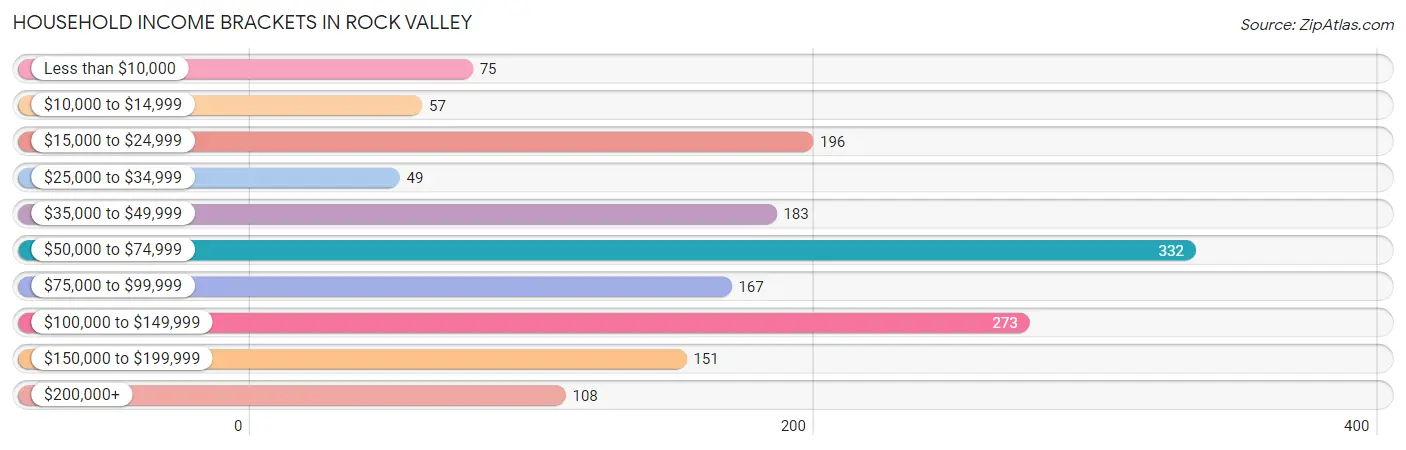
Household Income Brackets in Rock Valley
With 332 households falling in the category, the $50,000 to $74,999 income range is the most frequent in Rock Valley, accounting for 20.8% of all households. In contrast, only 49 households (3.1%) fall into the $25,000 to $34,999 income bracket, making it the least populous group.
| Income Bracket | # Households | % Households |
| Less than $10,000 | 75 | 4.7% |
| $10,000 to $14,999 | 57 | 3.6% |
| $15,000 to $24,999 | 196 | 12.3% |
| $25,000 to $34,999 | 49 | 3.1% |
| $35,000 to $49,999 | 183 | 11.5% |
| $50,000 to $74,999 | 332 | 20.8% |
| $75,000 to $99,999 | 167 | 10.5% |
| $100,000 to $149,999 | 273 | 17.1% |
| $150,000 to $199,999 | 151 | 9.5% |
| $200,000+ | 108 | 6.8% |
Household Income by Householder Age in Rock Valley
The median household income in Rock Valley is $63,485, with the highest median household income of $113,750 found in the 45 to 64 years age bracket for the primary householder. A total of 466 households (29.2%) fall into this category. Meanwhile, the 15 to 24 years age bracket for the primary householder has the lowest median household income of $0, with 160 households (10.0%) in this group.
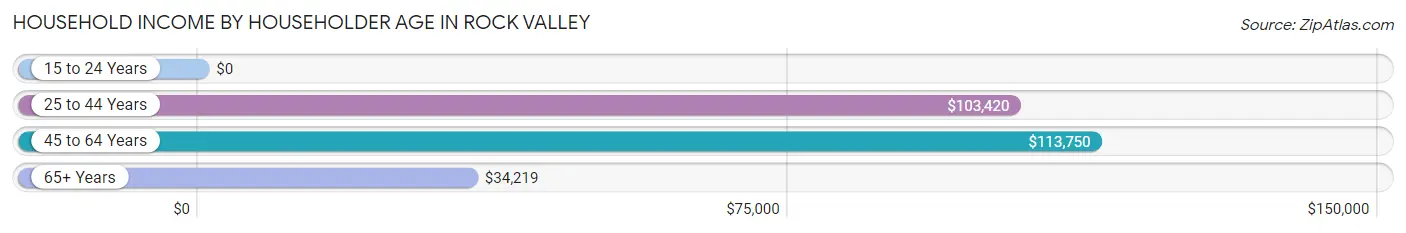
| Income Bracket | # Households | Median Income |
| 15 to 24 Years | 160 (10.0%) | $0 |
| 25 to 44 Years | 431 (27.0%) | $103,420 |
| 45 to 64 Years | 466 (29.2%) | $113,750 |
| 65+ Years | 537 (33.7%) | $34,219 |
| Total | 1,594 (100.0%) | $63,485 |
Poverty in Rock Valley
Income Below Poverty by Sex and Age in Rock Valley
With 6.9% poverty level for males and 4.4% for females among the residents of Rock Valley, under 5 year old males and 65 to 74 year old females are the most vulnerable to poverty, with 32 males (43.2%) and 46 females (20.5%) in their respective age groups living below the poverty level.
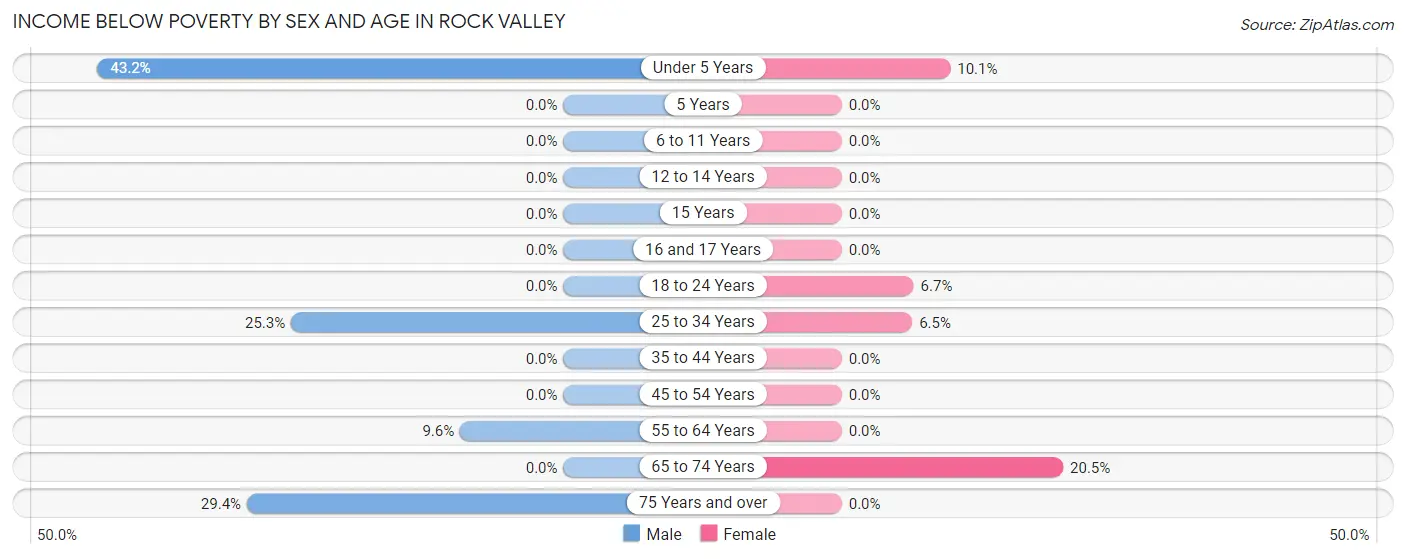
| Age Bracket | Male | Female |
| Under 5 Years | 32 (43.2%) | 14 (10.1%) |
| 5 Years | 0 (0.0%) | 0 (0.0%) |
| 6 to 11 Years | 0 (0.0%) | 0 (0.0%) |
| 12 to 14 Years | 0 (0.0%) | 0 (0.0%) |
| 15 Years | 0 (0.0%) | 0 (0.0%) |
| 16 and 17 Years | 0 (0.0%) | 0 (0.0%) |
| 18 to 24 Years | 0 (0.0%) | 22 (6.7%) |
| 25 to 34 Years | 47 (25.3%) | 7 (6.5%) |
| 35 to 44 Years | 0 (0.0%) | 0 (0.0%) |
| 45 to 54 Years | 0 (0.0%) | 0 (0.0%) |
| 55 to 64 Years | 14 (9.6%) | 0 (0.0%) |
| 65 to 74 Years | 0 (0.0%) | 46 (20.5%) |
| 75 Years and over | 42 (29.4%) | 0 (0.0%) |
| Total | 135 (6.9%) | 89 (4.4%) |
Income Above Poverty by Sex and Age in Rock Valley
According to the poverty statistics in Rock Valley, males aged 6 to 11 years and females aged 5 years are the age groups that are most secure financially, with 100.0% of males and 100.0% of females in these age groups living above the poverty line.
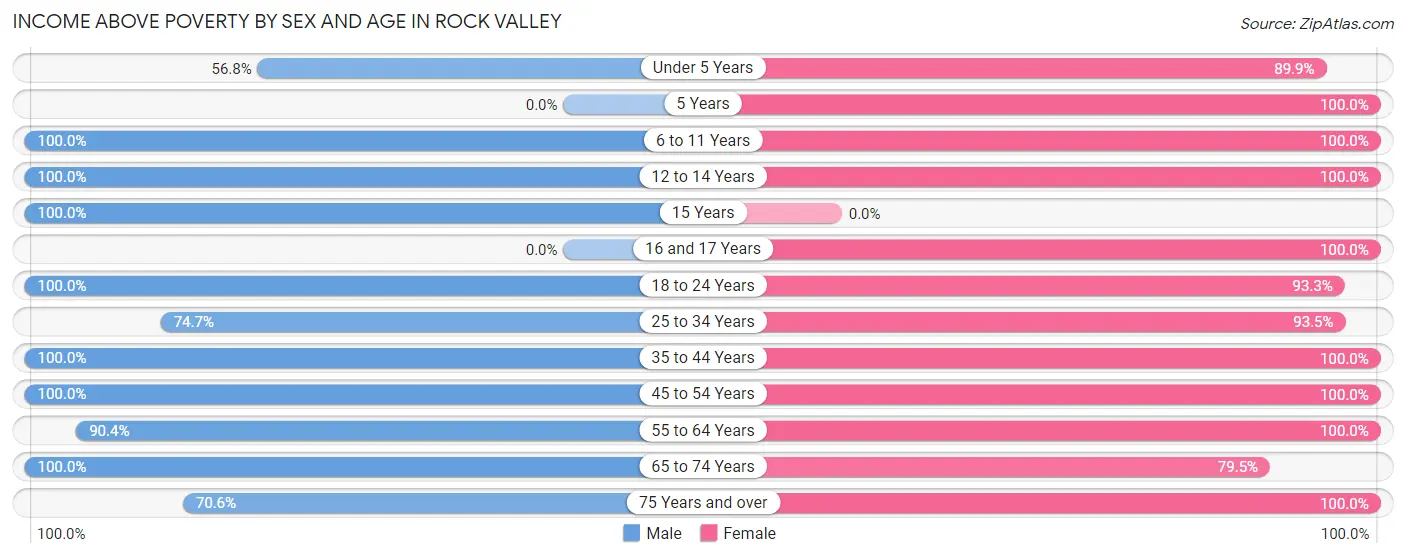
| Age Bracket | Male | Female |
| Under 5 Years | 42 (56.8%) | 125 (89.9%) |
| 5 Years | 0 (0.0%) | 58 (100.0%) |
| 6 to 11 Years | 270 (100.0%) | 80 (100.0%) |
| 12 to 14 Years | 90 (100.0%) | 101 (100.0%) |
| 15 Years | 52 (100.0%) | 0 (0.0%) |
| 16 and 17 Years | 0 (0.0%) | 69 (100.0%) |
| 18 to 24 Years | 240 (100.0%) | 308 (93.3%) |
| 25 to 34 Years | 139 (74.7%) | 100 (93.5%) |
| 35 to 44 Years | 366 (100.0%) | 281 (100.0%) |
| 45 to 54 Years | 234 (100.0%) | 227 (100.0%) |
| 55 to 64 Years | 132 (90.4%) | 206 (100.0%) |
| 65 to 74 Years | 144 (100.0%) | 178 (79.5%) |
| 75 Years and over | 101 (70.6%) | 219 (100.0%) |
| Total | 1,810 (93.1%) | 1,952 (95.6%) |
Income Below Poverty Among Married-Couple Families in Rock Valley
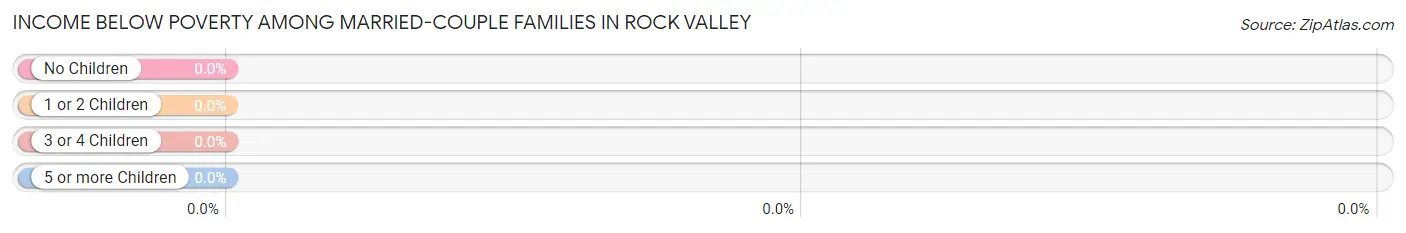
| Children | Above Poverty | Below Poverty |
| No Children | 472 (100.0%) | 0 (0.0%) |
| 1 or 2 Children | 178 (100.0%) | 0 (0.0%) |
| 3 or 4 Children | 203 (100.0%) | 0 (0.0%) |
| 5 or more Children | 0 (0.0%) | 0 (0.0%) |
| Total | 853 (100.0%) | 0 (0.0%) |
Income Below Poverty Among Single-Parent Households in Rock Valley
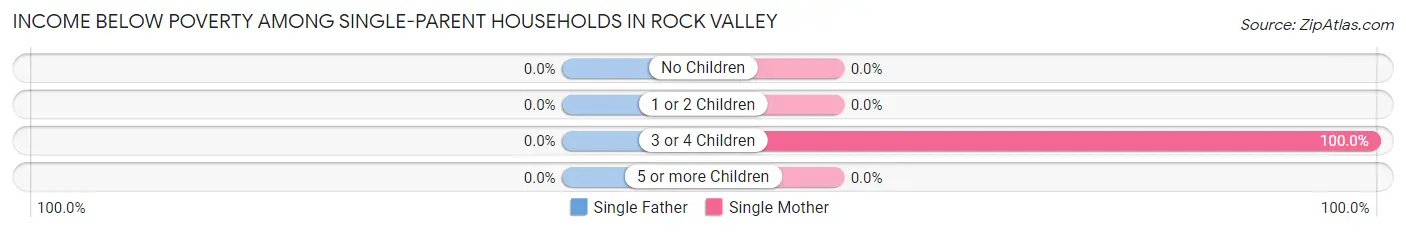
| Children | Single Father | Single Mother |
| No Children | 0 (0.0%) | 0 (0.0%) |
| 1 or 2 Children | 0 (0.0%) | 0 (0.0%) |
| 3 or 4 Children | 0 (0.0%) | 22 (100.0%) |
| 5 or more Children | 0 (0.0%) | 0 (0.0%) |
| Total | 0 (0.0%) | 22 (21.8%) |
Income Below Poverty Among Married-Couple vs Single-Parent Households in Rock Valley
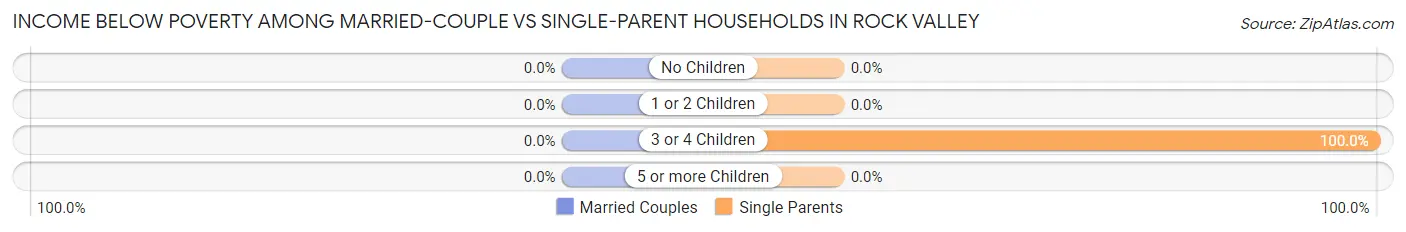
| Children | Married-Couple Families | Single-Parent Households |
| No Children | 0 (0.0%) | 0 (0.0%) |
| 1 or 2 Children | 0 (0.0%) | 0 (0.0%) |
| 3 or 4 Children | 0 (0.0%) | 22 (100.0%) |
| 5 or more Children | 0 (0.0%) | 0 (0.0%) |
| Total | 0 (0.0%) | 22 (19.3%) |
Race in Rock Valley
The most populous races in Rock Valley are White / Caucasian (3,296 | 81.5%), Hispanic or Latino (978 | 24.2%), and Two or more Races (606 | 15.0%).
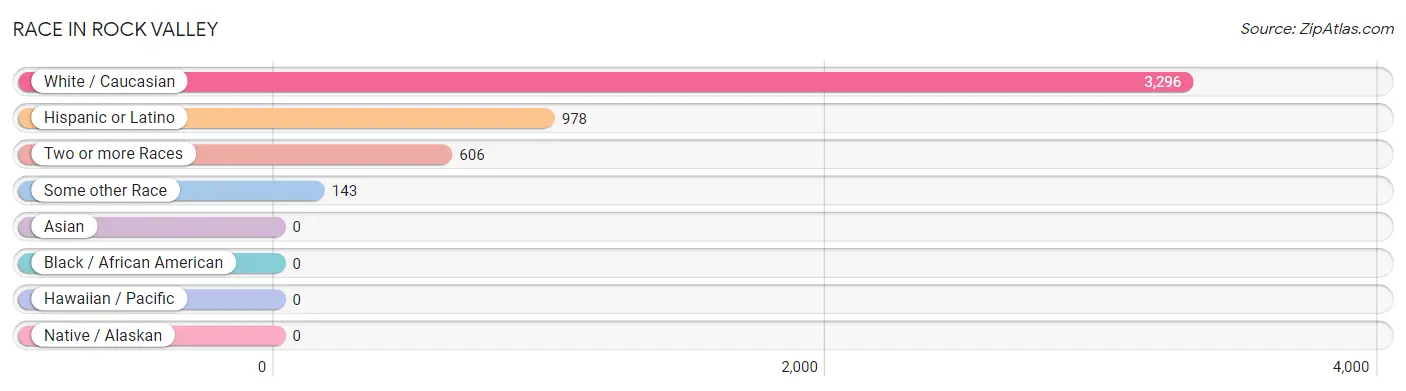
| Race | # Population | % Population |
| Asian | 0 | 0.0% |
| Black / African American | 0 | 0.0% |
| Hawaiian / Pacific | 0 | 0.0% |
| Hispanic or Latino | 978 | 24.2% |
| Native / Alaskan | 0 | 0.0% |
| White / Caucasian | 3,296 | 81.5% |
| Two or more Races | 606 | 15.0% |
| Some other Race | 143 | 3.5% |
| Total | 4,045 | 100.0% |
Ancestry in Rock Valley
The most populous ancestries reported in Rock Valley are Dutch (1,686 | 41.7%), German (763 | 18.9%), Mexican (504 | 12.5%), Central American (408 | 10.1%), and Guatemalan (408 | 10.1%), together accounting for 93.2% of all Rock Valley residents.
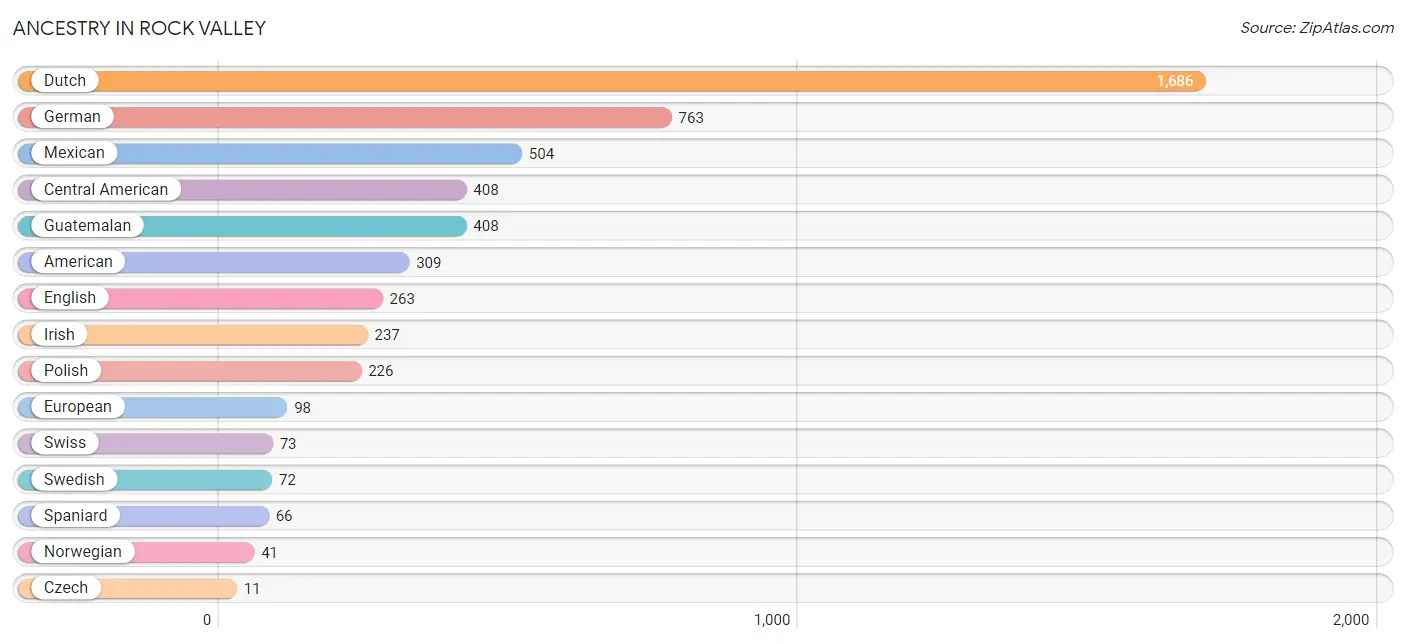
| Ancestry | # Population | % Population |
| American | 309 | 7.6% |
| Central American | 408 | 10.1% |
| Czech | 11 | 0.3% |
| Danish | 9 | 0.2% |
| Dutch | 1,686 | 41.7% |
| English | 263 | 6.5% |
| European | 98 | 2.4% |
| German | 763 | 18.9% |
| Guatemalan | 408 | 10.1% |
| Irish | 237 | 5.9% |
| Mexican | 504 | 12.5% |
| Norwegian | 41 | 1.0% |
| Polish | 226 | 5.6% |
| Spaniard | 66 | 1.6% |
| Swedish | 72 | 1.8% |
| Swiss | 73 | 1.8% | View All 16 Rows |
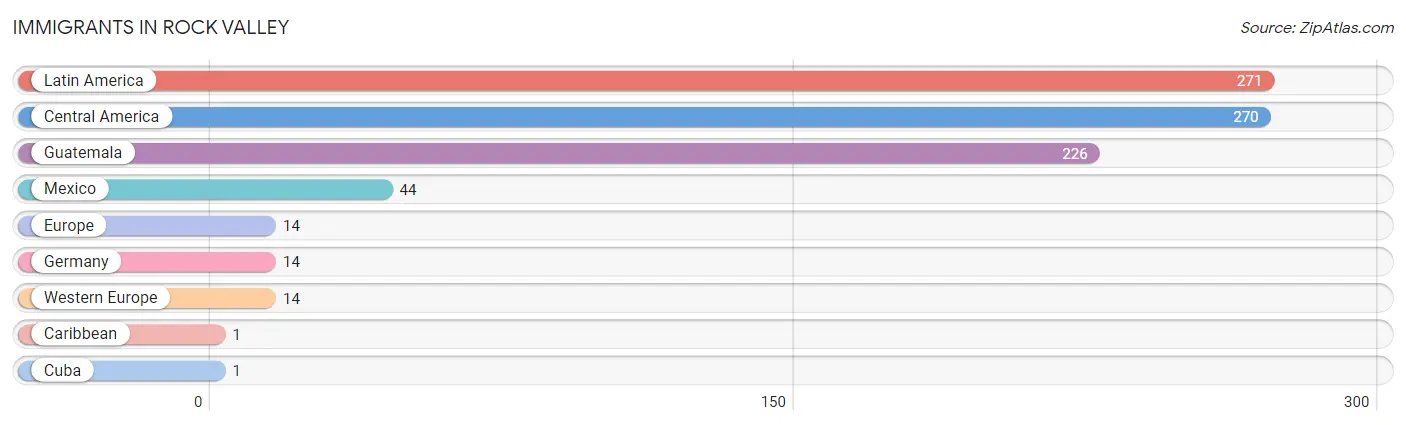
Immigrants in Rock Valley
The most numerous immigrant groups reported in Rock Valley came from Latin America (271 | 6.7%), Central America (270 | 6.7%), Guatemala (226 | 5.6%), Mexico (44 | 1.1%), and Europe (14 | 0.4%), together accounting for 20.4% of all Rock Valley residents.
| Immigration Origin | # Population | % Population |
| Caribbean | 1 | 0.0% |
| Central America | 270 | 6.7% |
| Cuba | 1 | 0.0% |
| Europe | 14 | 0.4% |
| Germany | 14 | 0.4% |
| Guatemala | 226 | 5.6% |
| Latin America | 271 | 6.7% |
| Mexico | 44 | 1.1% |
| Western Europe | 14 | 0.4% | View All 9 Rows |
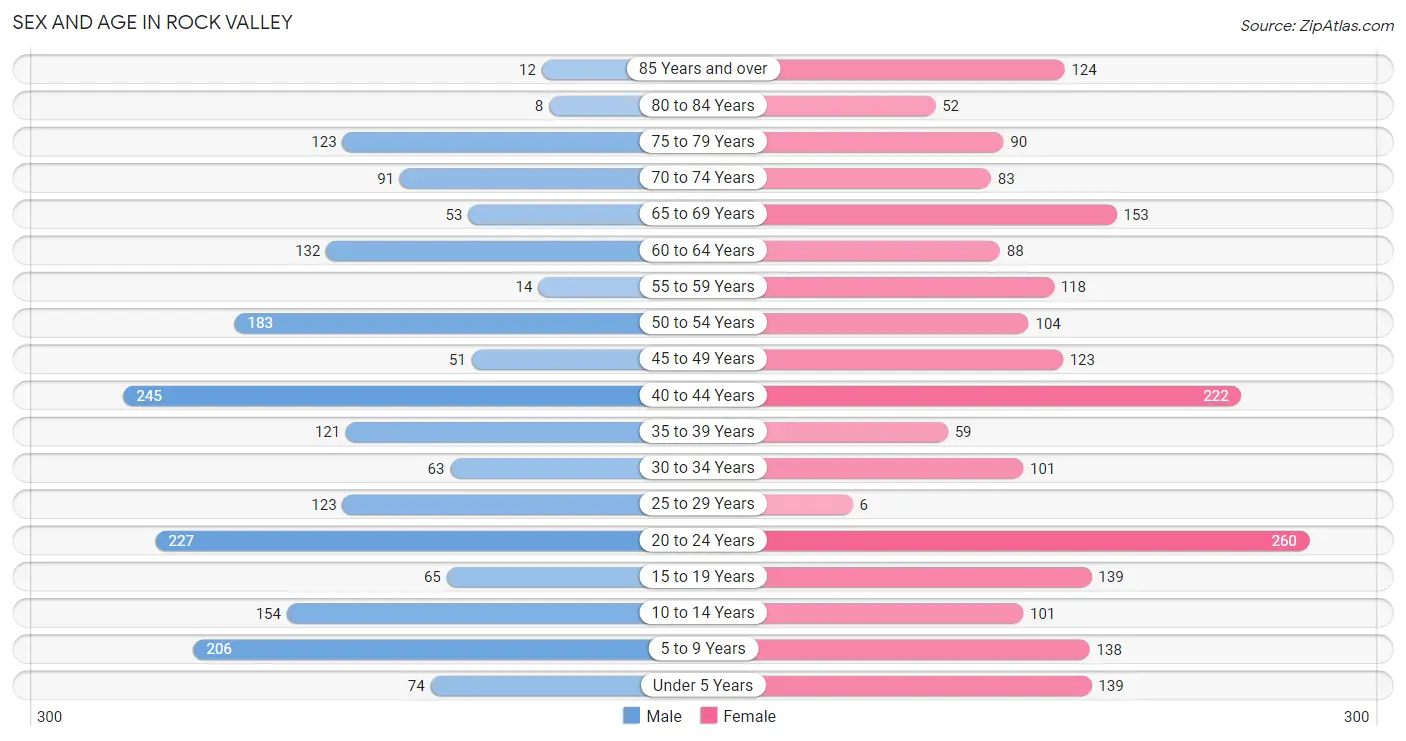
Sex and Age in Rock Valley
Sex and Age in Rock Valley
The most populous age groups in Rock Valley are 40 to 44 Years (245 | 12.6%) for men and 20 to 24 Years (260 | 12.4%) for women.
| Age Bracket | Male | Female |
| Under 5 Years | 74 (3.8%) | 139 (6.6%) |
| 5 to 9 Years | 206 (10.6%) | 138 (6.6%) |
| 10 to 14 Years | 154 (7.9%) | 101 (4.8%) |
| 15 to 19 Years | 65 (3.3%) | 139 (6.6%) |
| 20 to 24 Years | 227 (11.7%) | 260 (12.4%) |
| 25 to 29 Years | 123 (6.3%) | 6 (0.3%) |
| 30 to 34 Years | 63 (3.2%) | 101 (4.8%) |
| 35 to 39 Years | 121 (6.2%) | 59 (2.8%) |
| 40 to 44 Years | 245 (12.6%) | 222 (10.6%) |
| 45 to 49 Years | 51 (2.6%) | 123 (5.9%) |
| 50 to 54 Years | 183 (9.4%) | 104 (5.0%) |
| 55 to 59 Years | 14 (0.7%) | 118 (5.6%) |
| 60 to 64 Years | 132 (6.8%) | 88 (4.2%) |
| 65 to 69 Years | 53 (2.7%) | 153 (7.3%) |
| 70 to 74 Years | 91 (4.7%) | 83 (4.0%) |
| 75 to 79 Years | 123 (6.3%) | 90 (4.3%) |
| 80 to 84 Years | 8 (0.4%) | 52 (2.5%) |
| 85 Years and over | 12 (0.6%) | 124 (5.9%) |
| Total | 1,945 (100.0%) | 2,100 (100.0%) |
Families and Households in Rock Valley
Median Family Size in Rock Valley
The median family size in Rock Valley is 3.31 persons per family, with married-couple families (853 | 88.2%) accounting for the largest median family size of 3.45 persons per family. On the other hand, single male/father families (13 | 1.3%) represent the smallest median family size with 2.00 persons per family.
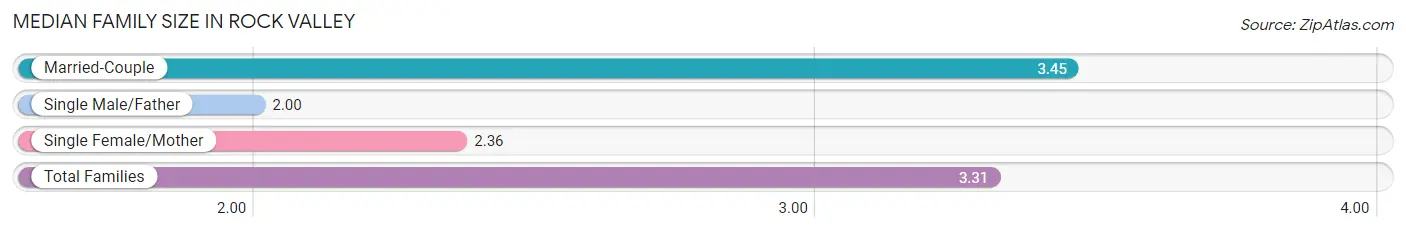
| Family Type | # Families | Family Size |
| Married-Couple | 853 (88.2%) | 3.45 |
| Single Male/Father | 13 (1.3%) | 2.00 |
| Single Female/Mother | 101 (10.4%) | 2.36 |
| Total Families | 967 (100.0%) | 3.31 |
Median Household Size in Rock Valley
The median household size in Rock Valley is 2.47 persons per household, with married-couple households (853 | 53.5%) accounting for the largest median household size of 3.46 persons per household. non-family households (627 | 39.3%) represent the smallest median household size with 1.13 persons per household.
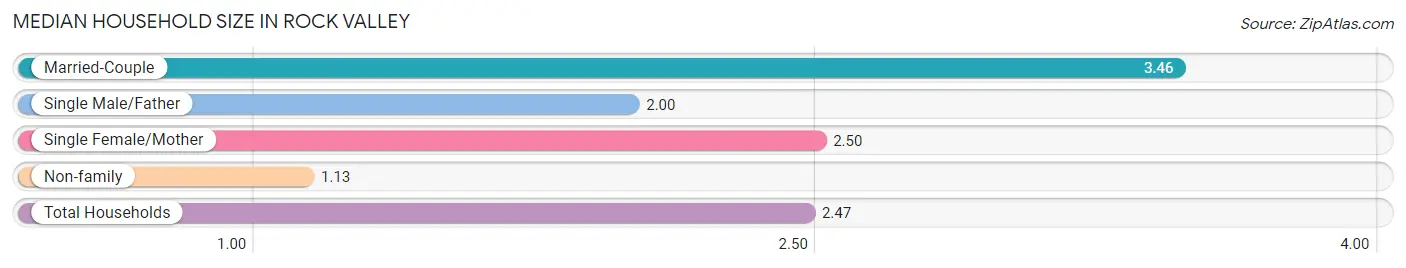
| Household Type | # Households | Household Size |
| Married-Couple | 853 (53.5%) | 3.46 |
| Single Male/Father | 13 (0.8%) | 2.00 |
| Single Female/Mother | 101 (6.3%) | 2.50 |
| Non-family | 627 (39.3%) | 1.13 |
| Total Households | 1,594 (100.0%) | 2.47 |
Household Size by Marriage Status in Rock Valley
Out of a total of 1,594 households in Rock Valley, 967 (60.7%) are family households, while 627 (39.3%) are nonfamily households. The most numerous type of family households are 2-person households, comprising 430, and the most common type of nonfamily households are 1-person households, comprising 556.
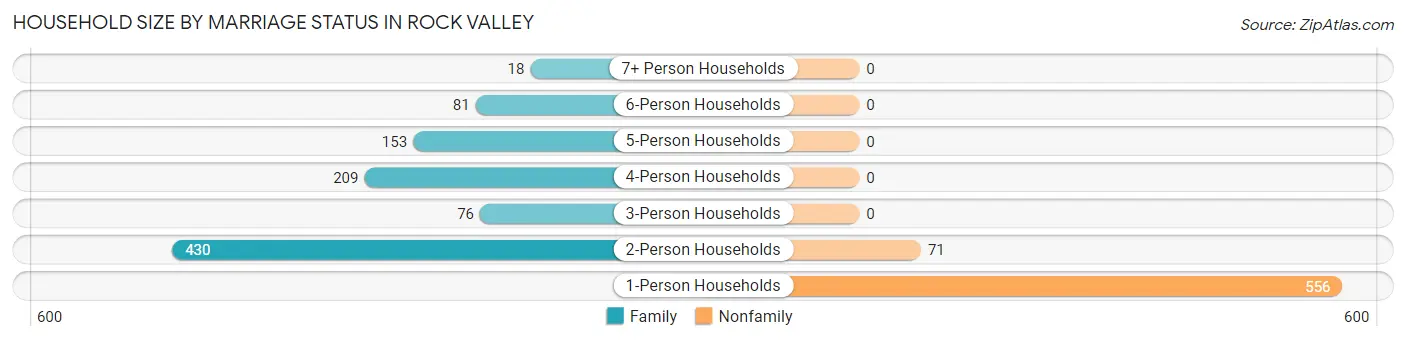
| Household Size | Family Households | Nonfamily Households |
| 1-Person Households | - | 556 (34.9%) |
| 2-Person Households | 430 (27.0%) | 71 (4.4%) |
| 3-Person Households | 76 (4.8%) | 0 (0.0%) |
| 4-Person Households | 209 (13.1%) | 0 (0.0%) |
| 5-Person Households | 153 (9.6%) | 0 (0.0%) |
| 6-Person Households | 81 (5.1%) | 0 (0.0%) |
| 7+ Person Households | 18 (1.1%) | 0 (0.0%) |
| Total | 967 (60.7%) | 627 (39.3%) |
Female Fertility in Rock Valley
Fertility by Age in Rock Valley
Average fertility rate in Rock Valley is 58.0 births per 1,000 women. Women in the age bracket of 20 to 34 years have the highest fertility rate with 147.0 births per 1,000 women. Women in the age bracket of 20 to 34 years acount for 100.0% of all women with births.
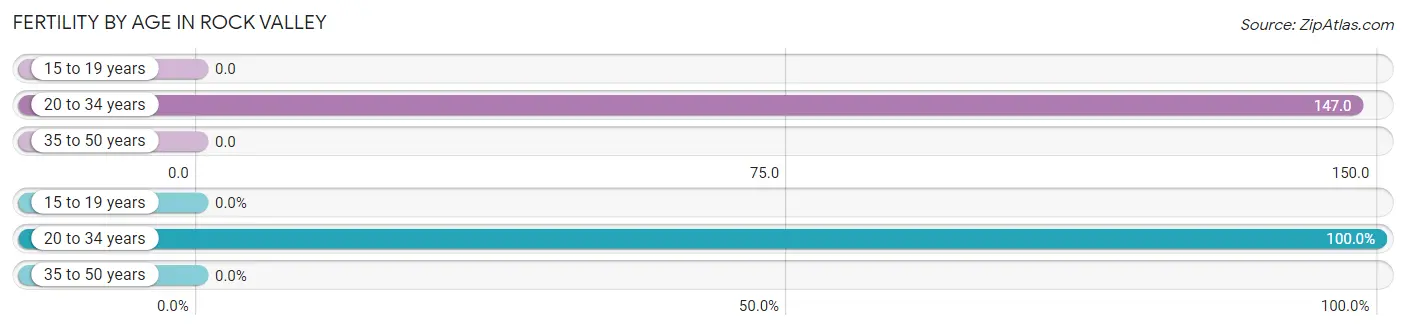
| Age Bracket | Women with Births | Births / 1,000 Women |
| 15 to 19 years | 0 (0.0%) | 0.0 |
| 20 to 34 years | 54 (100.0%) | 147.0 |
| 35 to 50 years | 0 (0.0%) | 0.0 |
| Total | 54 (100.0%) | 58.0 |
Fertility by Age by Marriage Status in Rock Valley
59.3% of women with births (54) in Rock Valley are married. The highest percentage of unmarried women with births falls into 20 to 34 years age bracket with 40.7% of them unmarried at the time of birth, while the lowest percentage of unmarried women with births belong to 20 to 34 years age bracket with 40.7% of them unmarried.
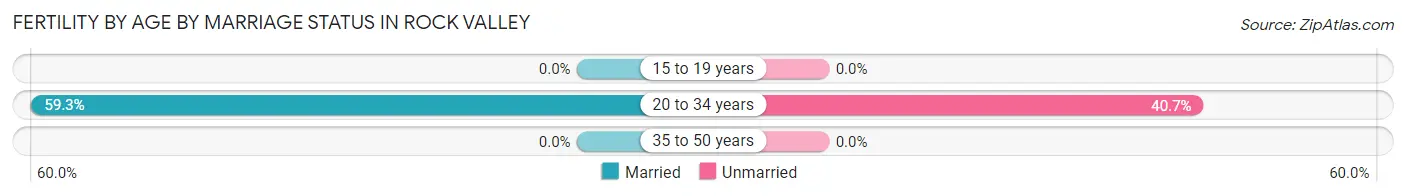
| Age Bracket | Married | Unmarried |
| 15 to 19 years | 0 (0.0%) | 0 (0.0%) |
| 20 to 34 years | 32 (59.3%) | 22 (40.7%) |
| 35 to 50 years | 0 (0.0%) | 0 (0.0%) |
| Total | 32 (59.3%) | 22 (40.7%) |
Fertility by Education in Rock Valley
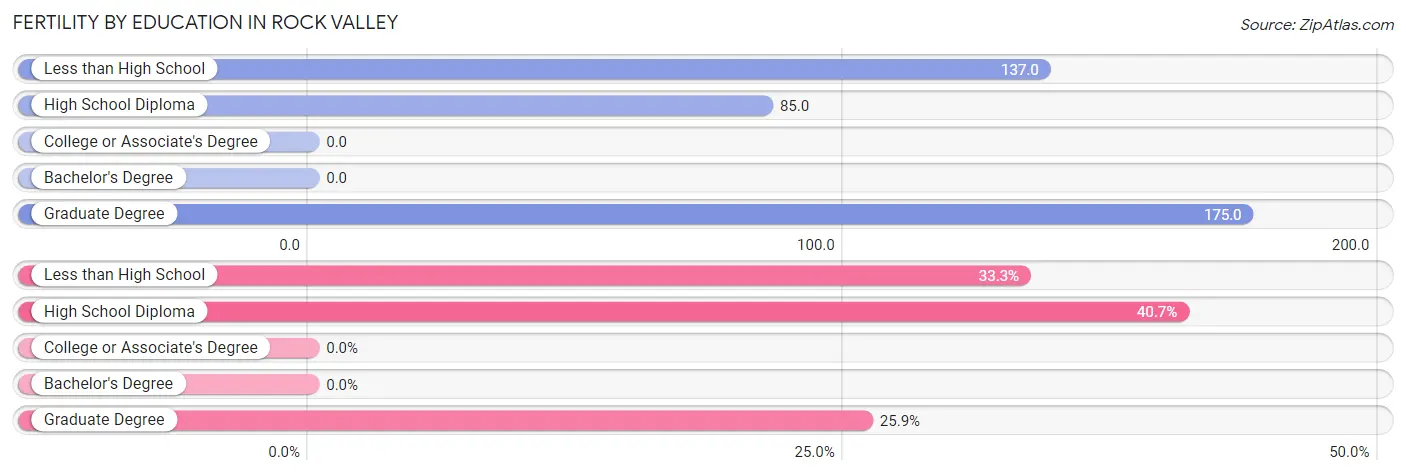
| Educational Attainment | Women with Births | Births / 1,000 Women |
| Less than High School | 18 (33.3%) | 137.0 |
| High School Diploma | 22 (40.7%) | 85.0 |
| College or Associate's Degree | 0 (0.0%) | 0.0 |
| Bachelor's Degree | 0 (0.0%) | 0.0 |
| Graduate Degree | 14 (25.9%) | 175.0 |
| Total | 54 (100.0%) | 58.0 |
Fertility by Education by Marriage Status in Rock Valley
40.7% of women with births in Rock Valley are unmarried. Women with the educational attainment of less than high school are most likely to be married with 100.0% of them married at childbirth, while women with the educational attainment of high school diploma are least likely to be married with 100.0% of them unmarried at childbirth.
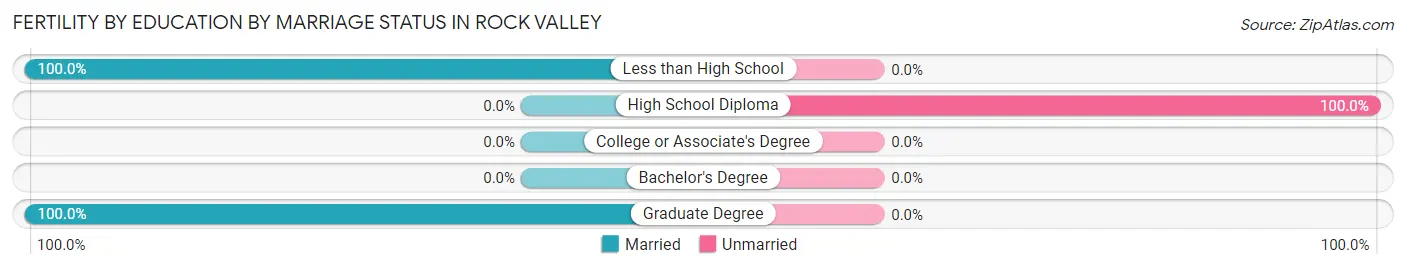
| Educational Attainment | Married | Unmarried |
| Less than High School | 18 (100.0%) | 0 (0.0%) |
| High School Diploma | 0 (0.0%) | 22 (100.0%) |
| College or Associate's Degree | 0 (0.0%) | 0 (0.0%) |
| Bachelor's Degree | 0 (0.0%) | 0 (0.0%) |
| Graduate Degree | 14 (100.0%) | 0 (0.0%) |
| Total | 32 (59.3%) | 22 (40.7%) |
Employment Characteristics in Rock Valley
Employment by Class of Employer in Rock Valley
Among the 2,363 employed individuals in Rock Valley, private company employees (1,464 | 62.0%), self-employed (not incorporated) (340 | 14.4%), and not-for-profit organizations (262 | 11.1%) make up the most common classes of employment.
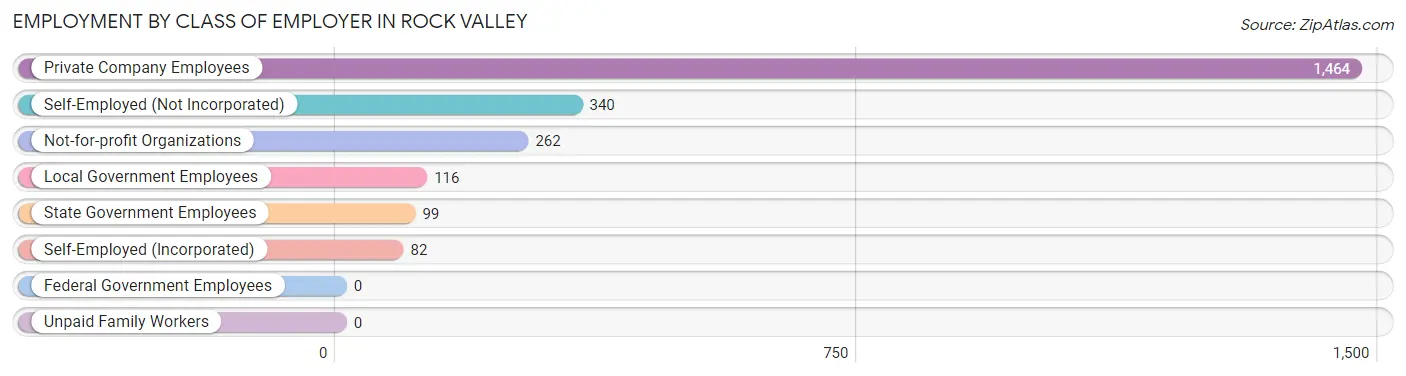
| Employer Class | # Employees | % Employees |
| Private Company Employees | 1,464 | 62.0% |
| Self-Employed (Incorporated) | 82 | 3.5% |
| Self-Employed (Not Incorporated) | 340 | 14.4% |
| Not-for-profit Organizations | 262 | 11.1% |
| Local Government Employees | 116 | 4.9% |
| State Government Employees | 99 | 4.2% |
| Federal Government Employees | 0 | 0.0% |
| Unpaid Family Workers | 0 | 0.0% |
| Total | 2,363 | 100.0% |
Employment Status by Age in Rock Valley
According to the labor force statistics for Rock Valley, out of the total population over 16 years of age (3,181), 74.9% or 2,383 individuals are in the labor force, with 0.8% or 19 of them unemployed. The age group with the highest labor force participation rate is 35 to 44 years, with 100.0% or 647 individuals in the labor force. Within the labor force, the 30 to 34 years age range has the highest percentage of unemployed individuals, with 14.4% or 20 of them being unemployed.
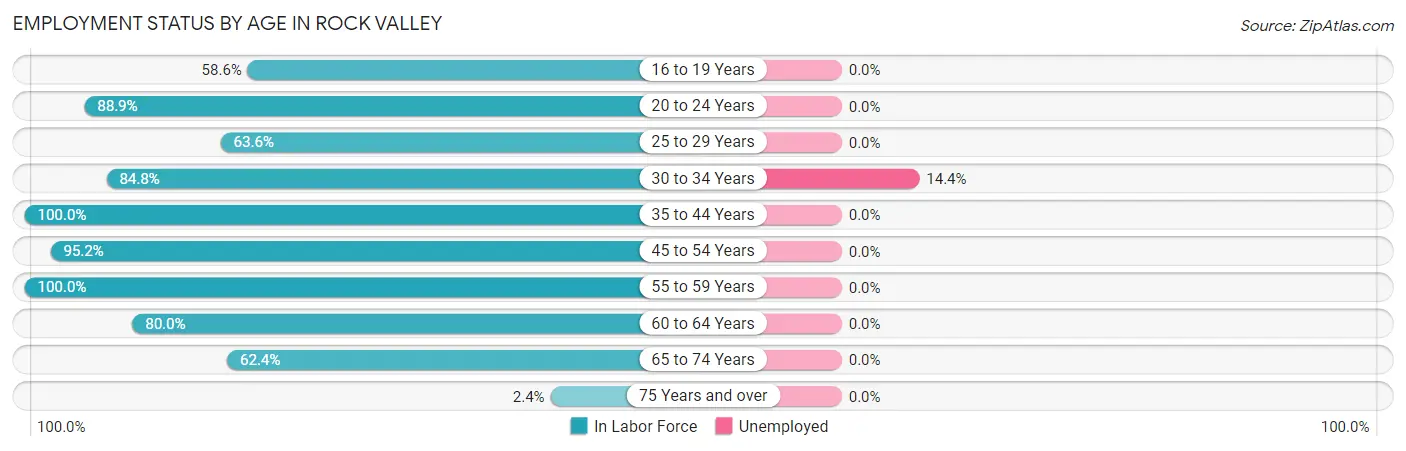
| Age Bracket | In Labor Force | Unemployed |
| 16 to 19 Years | 89 (58.6%) | 0 (0.0%) |
| 20 to 24 Years | 433 (88.9%) | 0 (0.0%) |
| 25 to 29 Years | 82 (63.6%) | 0 (0.0%) |
| 30 to 34 Years | 139 (84.8%) | 20 (14.4%) |
| 35 to 44 Years | 647 (100.0%) | 0 (0.0%) |
| 45 to 54 Years | 439 (95.2%) | 0 (0.0%) |
| 55 to 59 Years | 132 (100.0%) | 0 (0.0%) |
| 60 to 64 Years | 176 (80.0%) | 0 (0.0%) |
| 65 to 74 Years | 237 (62.4%) | 0 (0.0%) |
| 75 Years and over | 10 (2.4%) | 0 (0.0%) |
| Total | 2,383 (74.9%) | 19 (0.8%) |
Employment Status by Educational Attainment in Rock Valley
According to labor force statistics for Rock Valley, 92.1% of individuals (1,615) out of the total population between 25 and 64 years of age (1,753) are in the labor force, with 1.2% or 19 of them being unemployed. The group with the highest labor force participation rate are those with the educational attainment of bachelor's degree or higher, with 100.0% or 375 individuals in the labor force. Within the labor force, individuals with high school diploma education have the highest percentage of unemployment, with 2.9% or 20 of them being unemployed.
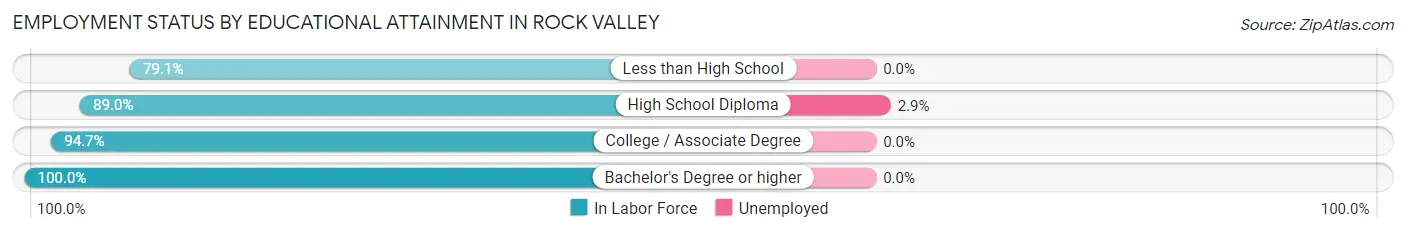
| Educational Attainment | In Labor Force | Unemployed |
| Less than High School | 102 (79.1%) | 0 (0.0%) |
| High School Diploma | 693 (89.0%) | 23 (2.9%) |
| College / Associate Degree | 445 (94.7%) | 0 (0.0%) |
| Bachelor's Degree or higher | 375 (100.0%) | 0 (0.0%) |
| Total | 1,615 (92.1%) | 21 (1.2%) |
Employment Occupations by Sex in Rock Valley
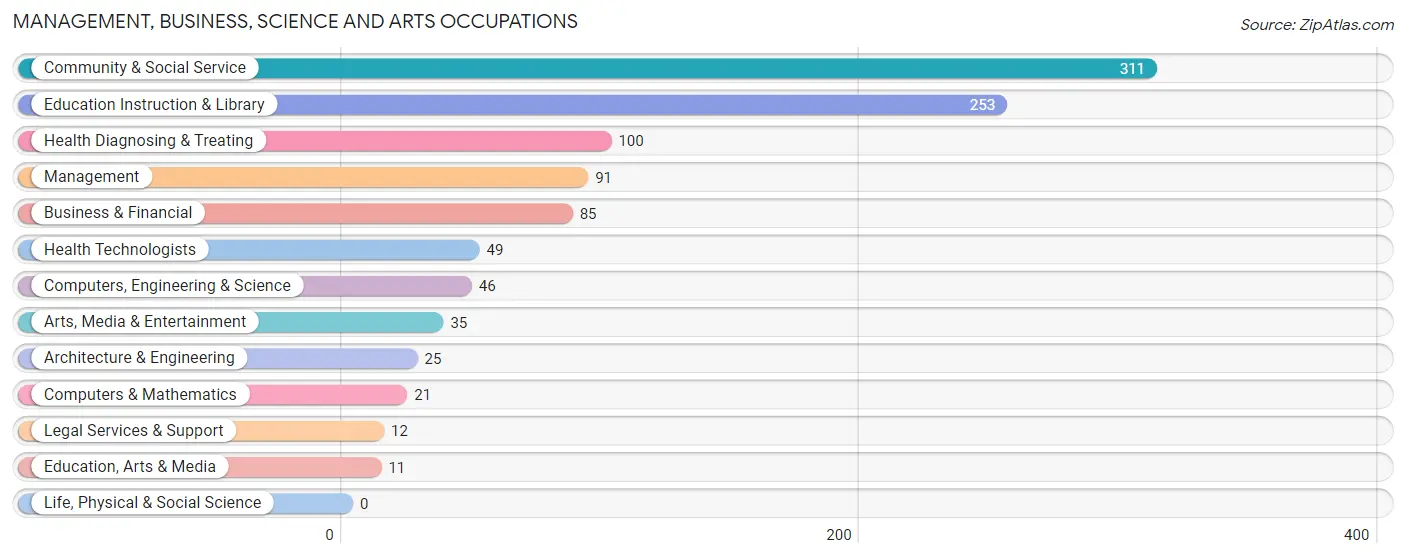
Management, Business, Science and Arts Occupations
The most common Management, Business, Science and Arts occupations in Rock Valley are Community & Social Service (311 | 13.2%), Education Instruction & Library (253 | 10.7%), Health Diagnosing & Treating (100 | 4.2%), Management (91 | 3.8%), and Business & Financial (85 | 3.6%).
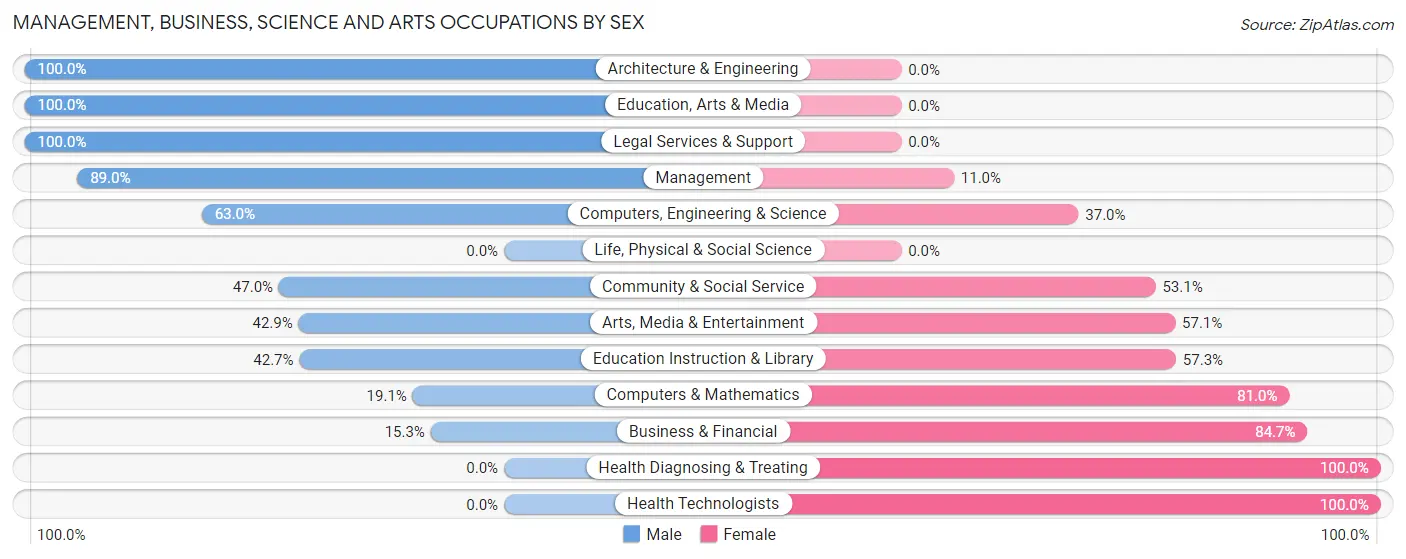
Management, Business, Science and Arts Occupations by Sex
Within the Management, Business, Science and Arts occupations in Rock Valley, the most male-oriented occupations are Architecture & Engineering (100.0%), Education, Arts & Media (100.0%), and Legal Services & Support (100.0%), while the most female-oriented occupations are Health Diagnosing & Treating (100.0%), Health Technologists (100.0%), and Business & Financial (84.7%).
| Occupation | Male | Female |
| Management | 81 (89.0%) | 10 (11.0%) |
| Business & Financial | 13 (15.3%) | 72 (84.7%) |
| Computers, Engineering & Science | 29 (63.0%) | 17 (37.0%) |
| Computers & Mathematics | 4 (19.1%) | 17 (80.9%) |
| Architecture & Engineering | 25 (100.0%) | 0 (0.0%) |
| Life, Physical & Social Science | 0 (0.0%) | 0 (0.0%) |
| Community & Social Service | 146 (46.9%) | 165 (53.0%) |
| Education, Arts & Media | 11 (100.0%) | 0 (0.0%) |
| Legal Services & Support | 12 (100.0%) | 0 (0.0%) |
| Education Instruction & Library | 108 (42.7%) | 145 (57.3%) |
| Arts, Media & Entertainment | 15 (42.9%) | 20 (57.1%) |
| Health Diagnosing & Treating | 0 (0.0%) | 100 (100.0%) |
| Health Technologists | 0 (0.0%) | 49 (100.0%) |
| Total (Category) | 269 (42.5%) | 364 (57.5%) |
| Total (Overall) | 1,226 (51.9%) | 1,138 (48.1%) |
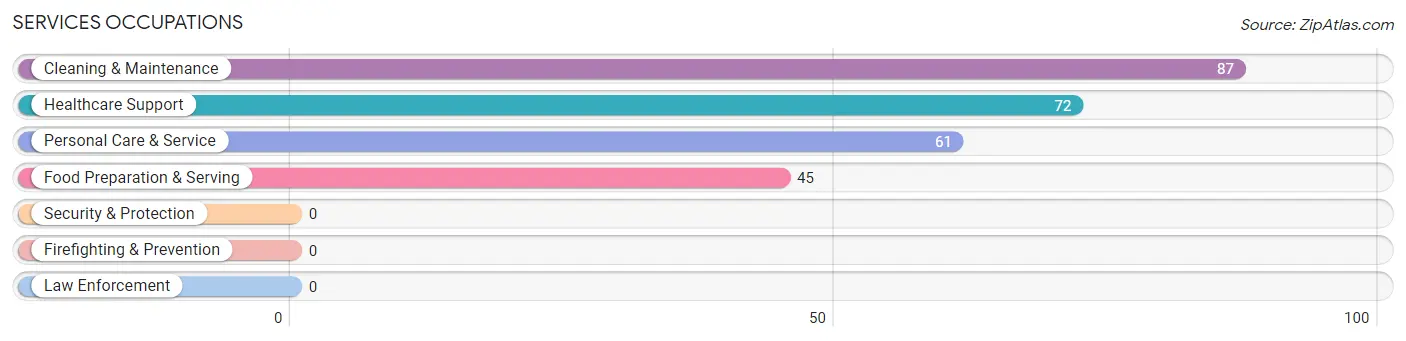
Services Occupations
The most common Services occupations in Rock Valley are Cleaning & Maintenance (87 | 3.7%), Healthcare Support (72 | 3.0%), Personal Care & Service (61 | 2.6%), and Food Preparation & Serving (45 | 1.9%).
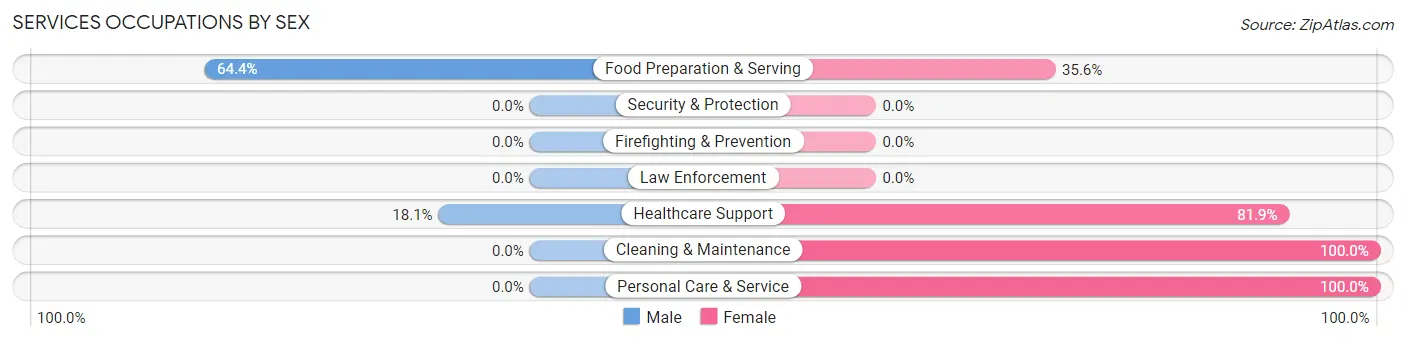
Services Occupations by Sex
Within the Services occupations in Rock Valley, the most male-oriented occupations are Food Preparation & Serving (64.4%), and Healthcare Support (18.1%), while the most female-oriented occupations are Cleaning & Maintenance (100.0%), Personal Care & Service (100.0%), and Healthcare Support (81.9%).
| Occupation | Male | Female |
| Healthcare Support | 13 (18.1%) | 59 (81.9%) |
| Security & Protection | 0 (0.0%) | 0 (0.0%) |
| Firefighting & Prevention | 0 (0.0%) | 0 (0.0%) |
| Law Enforcement | 0 (0.0%) | 0 (0.0%) |
| Food Preparation & Serving | 29 (64.4%) | 16 (35.6%) |
| Cleaning & Maintenance | 0 (0.0%) | 87 (100.0%) |
| Personal Care & Service | 0 (0.0%) | 61 (100.0%) |
| Total (Category) | 42 (15.9%) | 223 (84.2%) |
| Total (Overall) | 1,226 (51.9%) | 1,138 (48.1%) |
Sales and Office Occupations
The most common Sales and Office occupations in Rock Valley are Office & Administration (357 | 15.1%), and Sales & Related (273 | 11.6%).

Sales and Office Occupations by Sex
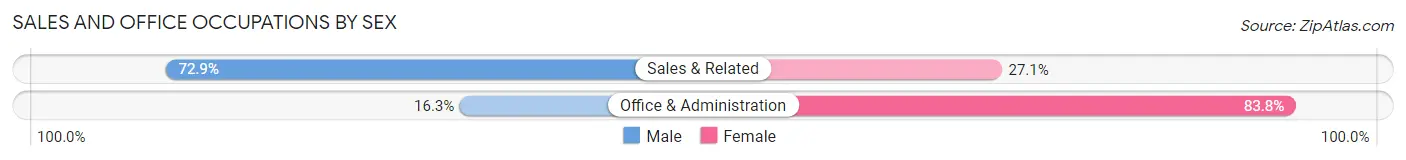
| Occupation | Male | Female |
| Sales & Related | 199 (72.9%) | 74 (27.1%) |
| Office & Administration | 58 (16.3%) | 299 (83.8%) |
| Total (Category) | 257 (40.8%) | 373 (59.2%) |
| Total (Overall) | 1,226 (51.9%) | 1,138 (48.1%) |
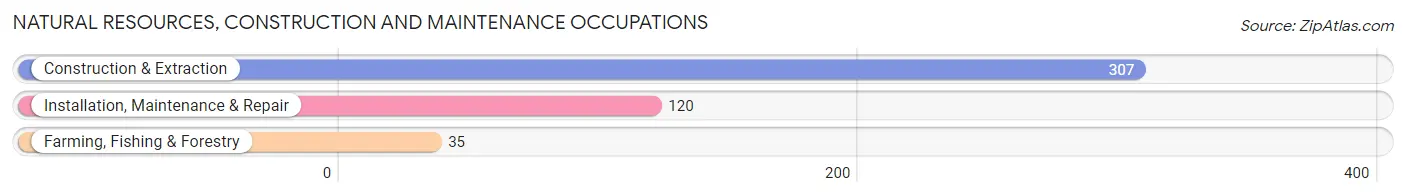
Natural Resources, Construction and Maintenance Occupations
The most common Natural Resources, Construction and Maintenance occupations in Rock Valley are Construction & Extraction (307 | 13.0%), Installation, Maintenance & Repair (120 | 5.1%), and Farming, Fishing & Forestry (35 | 1.5%).
Natural Resources, Construction and Maintenance Occupations by Sex
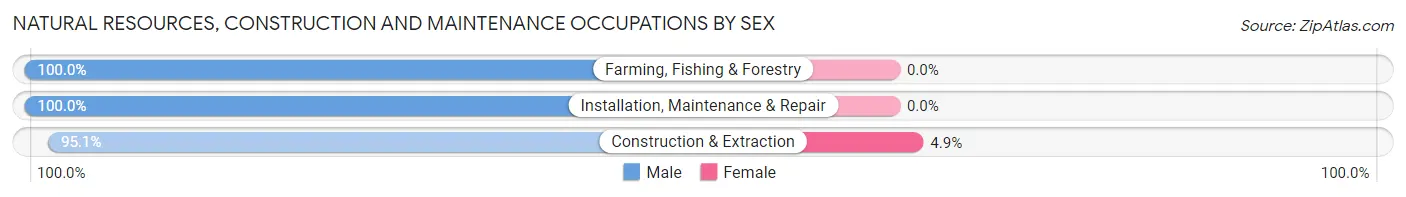
| Occupation | Male | Female |
| Farming, Fishing & Forestry | 35 (100.0%) | 0 (0.0%) |
| Construction & Extraction | 292 (95.1%) | 15 (4.9%) |
| Installation, Maintenance & Repair | 120 (100.0%) | 0 (0.0%) |
| Total (Category) | 447 (96.8%) | 15 (3.3%) |
| Total (Overall) | 1,226 (51.9%) | 1,138 (48.1%) |
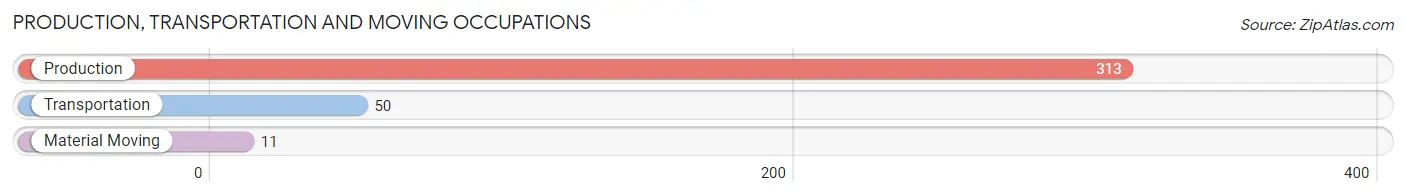
Production, Transportation and Moving Occupations
The most common Production, Transportation and Moving occupations in Rock Valley are Production (313 | 13.2%), Transportation (50 | 2.1%), and Material Moving (11 | 0.5%).
Production, Transportation and Moving Occupations by Sex
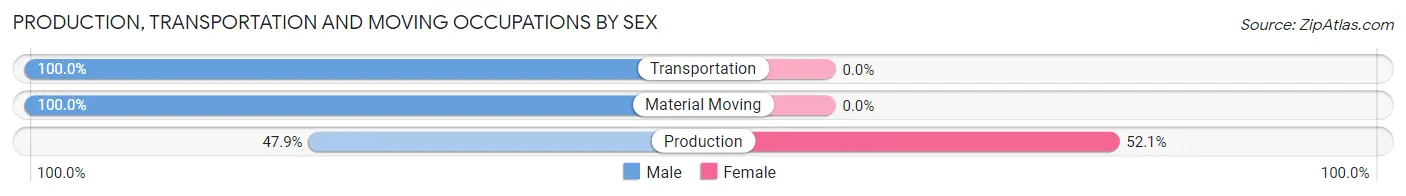
| Occupation | Male | Female |
| Production | 150 (47.9%) | 163 (52.1%) |
| Transportation | 50 (100.0%) | 0 (0.0%) |
| Material Moving | 11 (100.0%) | 0 (0.0%) |
| Total (Category) | 211 (56.4%) | 163 (43.6%) |
| Total (Overall) | 1,226 (51.9%) | 1,138 (48.1%) |
Employment Industries by Sex in Rock Valley
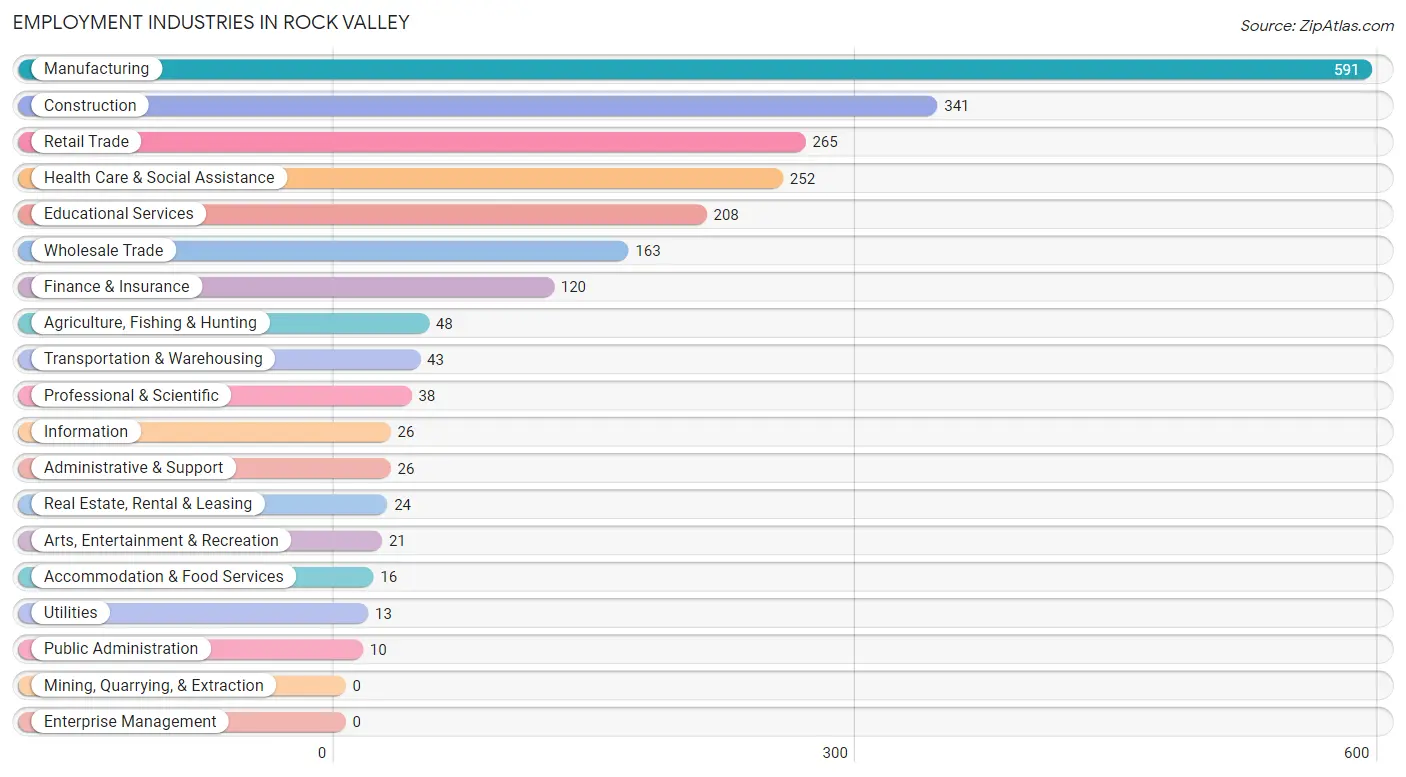
Employment Industries in Rock Valley
The major employment industries in Rock Valley include Manufacturing (591 | 25.0%), Construction (341 | 14.4%), Retail Trade (265 | 11.2%), Health Care & Social Assistance (252 | 10.7%), and Educational Services (208 | 8.8%).
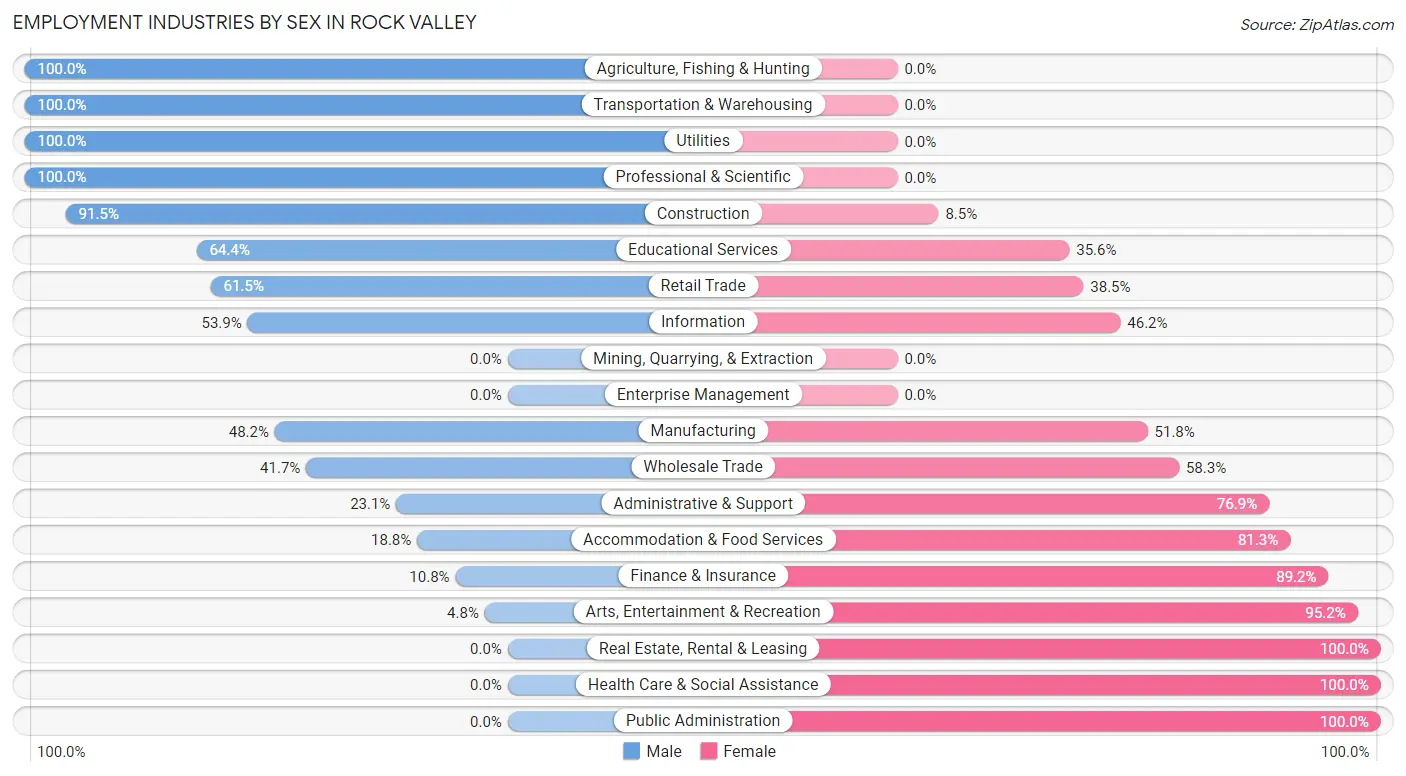
Employment Industries by Sex in Rock Valley
The Rock Valley industries that see more men than women are Agriculture, Fishing & Hunting (100.0%), Transportation & Warehousing (100.0%), and Utilities (100.0%), whereas the industries that tend to have a higher number of women are Real Estate, Rental & Leasing (100.0%), Health Care & Social Assistance (100.0%), and Public Administration (100.0%).
| Industry | Male | Female |
| Agriculture, Fishing & Hunting | 48 (100.0%) | 0 (0.0%) |
| Mining, Quarrying, & Extraction | 0 (0.0%) | 0 (0.0%) |
| Construction | 312 (91.5%) | 29 (8.5%) |
| Manufacturing | 285 (48.2%) | 306 (51.8%) |
| Wholesale Trade | 68 (41.7%) | 95 (58.3%) |
| Retail Trade | 163 (61.5%) | 102 (38.5%) |
| Transportation & Warehousing | 43 (100.0%) | 0 (0.0%) |
| Utilities | 13 (100.0%) | 0 (0.0%) |
| Information | 14 (53.8%) | 12 (46.2%) |
| Finance & Insurance | 13 (10.8%) | 107 (89.2%) |
| Real Estate, Rental & Leasing | 0 (0.0%) | 24 (100.0%) |
| Professional & Scientific | 38 (100.0%) | 0 (0.0%) |
| Enterprise Management | 0 (0.0%) | 0 (0.0%) |
| Administrative & Support | 6 (23.1%) | 20 (76.9%) |
| Educational Services | 134 (64.4%) | 74 (35.6%) |
| Health Care & Social Assistance | 0 (0.0%) | 252 (100.0%) |
| Arts, Entertainment & Recreation | 1 (4.8%) | 20 (95.2%) |
| Accommodation & Food Services | 3 (18.8%) | 13 (81.2%) |
| Public Administration | 0 (0.0%) | 10 (100.0%) |
| Total | 1,226 (51.9%) | 1,138 (48.1%) |
Education in Rock Valley
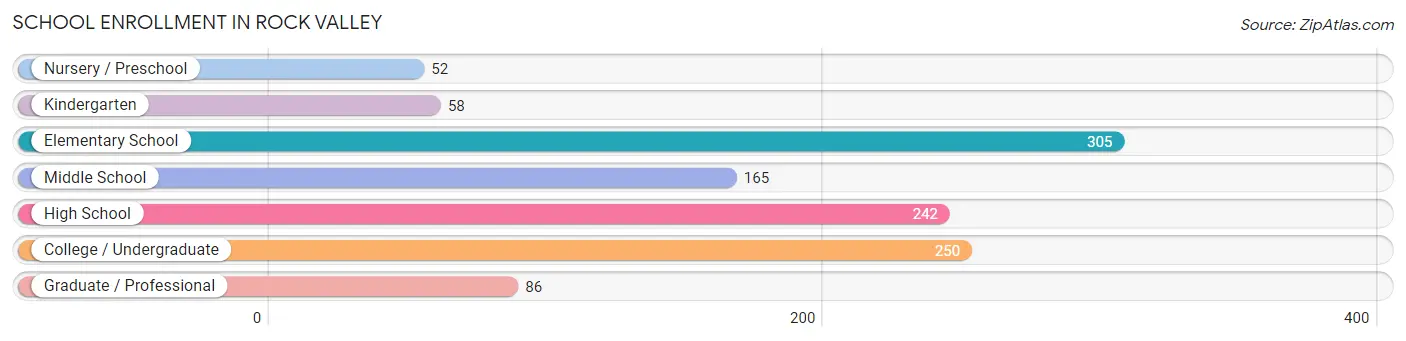
School Enrollment in Rock Valley
The most common levels of schooling among the 1,158 students in Rock Valley are elementary school (305 | 26.3%), college / undergraduate (250 | 21.6%), and high school (242 | 20.9%).
| School Level | # Students | % Students |
| Nursery / Preschool | 52 | 4.5% |
| Kindergarten | 58 | 5.0% |
| Elementary School | 305 | 26.3% |
| Middle School | 165 | 14.2% |
| High School | 242 | 20.9% |
| College / Undergraduate | 250 | 21.6% |
| Graduate / Professional | 86 | 7.4% |
| Total | 1,158 | 100.0% |
School Enrollment by Age by Funding Source in Rock Valley
Out of a total of 1,158 students who are enrolled in schools in Rock Valley, 378 (32.6%) attend a private institution, while the remaining 780 (67.4%) are enrolled in public schools. The age group of 18 to 19 year olds has the highest likelihood of being enrolled in private schools, with 76 (100.0% in the age bracket) enrolled. Conversely, the age group of 3 to 4 year olds has the lowest likelihood of being enrolled in a private school, with 52 (100.0% in the age bracket) attending a public institution.
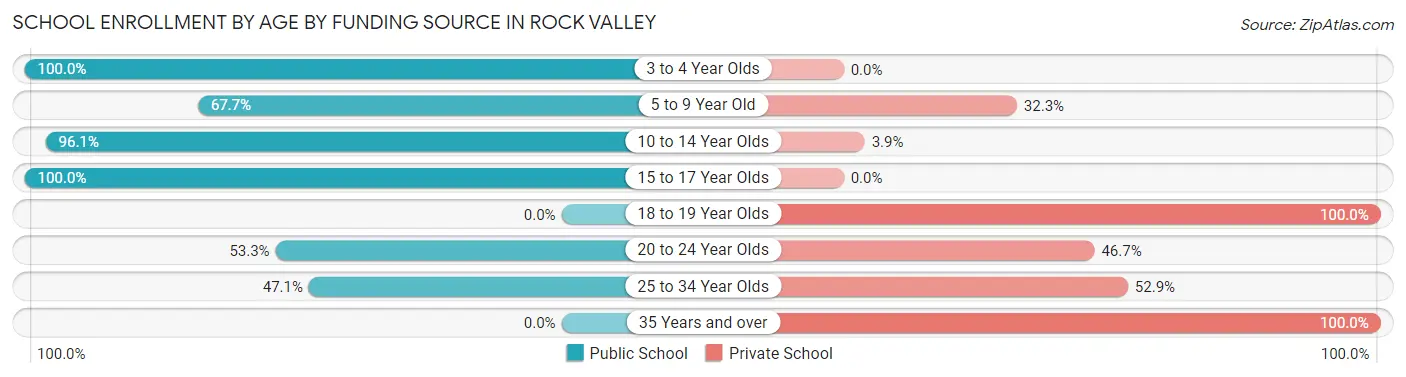
| Age Bracket | Public School | Private School |
| 3 to 4 Year Olds | 52 (100.0%) | 0 (0.0%) |
| 5 to 9 Year Old | 233 (67.7%) | 111 (32.3%) |
| 10 to 14 Year Olds | 245 (96.1%) | 10 (3.9%) |
| 15 to 17 Year Olds | 121 (100.0%) | 0 (0.0%) |
| 18 to 19 Year Olds | 0 (0.0%) | 76 (100.0%) |
| 20 to 24 Year Olds | 122 (53.3%) | 107 (46.7%) |
| 25 to 34 Year Olds | 8 (47.1%) | 9 (52.9%) |
| 35 Years and over | 0 (0.0%) | 64 (100.0%) |
| Total | 780 (67.4%) | 378 (32.6%) |
Educational Attainment by Field of Study in Rock Valley
Education (120 | 17.3%), business (105 | 15.1%), psychology (80 | 11.5%), social sciences (80 | 11.5%), and computers & mathematics (66 | 9.5%) are the most common fields of study among 693 individuals in Rock Valley who have obtained a bachelor's degree or higher.
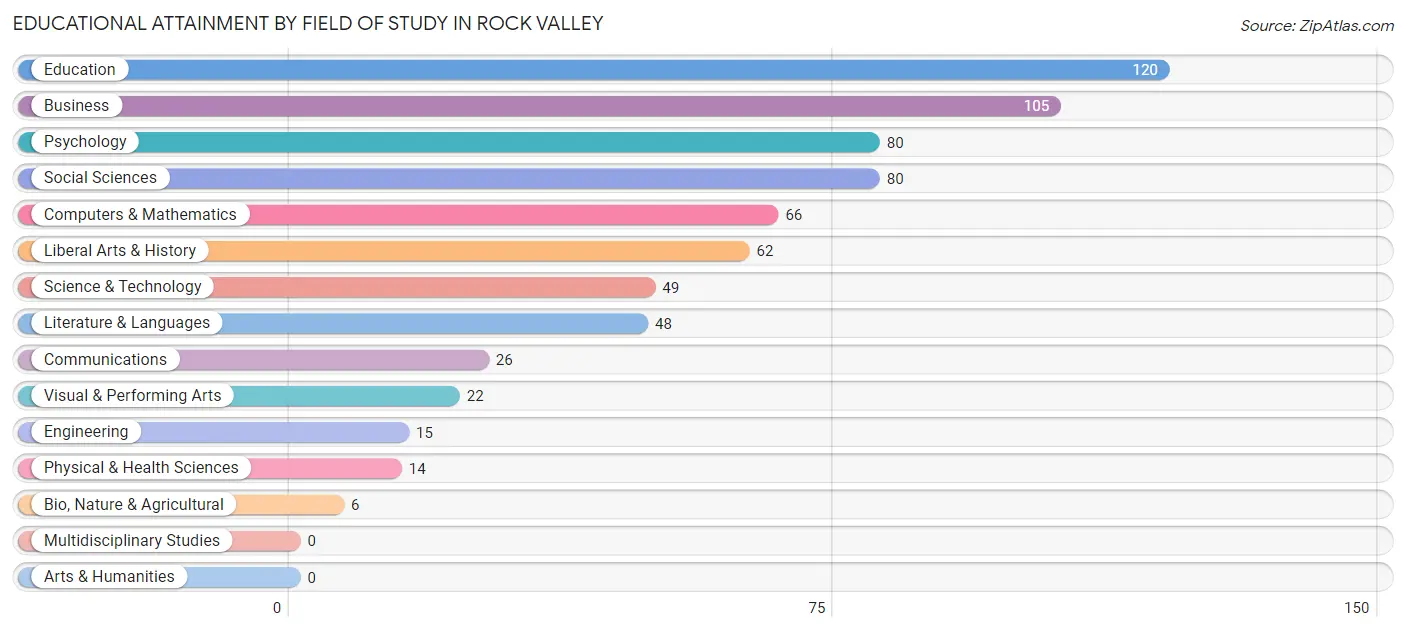
| Field of Study | # Graduates | % Graduates |
| Computers & Mathematics | 66 | 9.5% |
| Bio, Nature & Agricultural | 6 | 0.9% |
| Physical & Health Sciences | 14 | 2.0% |
| Psychology | 80 | 11.5% |
| Social Sciences | 80 | 11.5% |
| Engineering | 15 | 2.2% |
| Multidisciplinary Studies | 0 | 0.0% |
| Science & Technology | 49 | 7.1% |
| Business | 105 | 15.1% |
| Education | 120 | 17.3% |
| Literature & Languages | 48 | 6.9% |
| Liberal Arts & History | 62 | 8.9% |
| Visual & Performing Arts | 22 | 3.2% |
| Communications | 26 | 3.7% |
| Arts & Humanities | 0 | 0.0% |
| Total | 693 | 100.0% |
Transportation & Commute in Rock Valley
Vehicle Availability by Sex in Rock Valley
The most prevalent vehicle ownership categories in Rock Valley are males with 2 vehicles (575, accounting for 46.9%) and females with 2 vehicles (450, making up 50.5%).
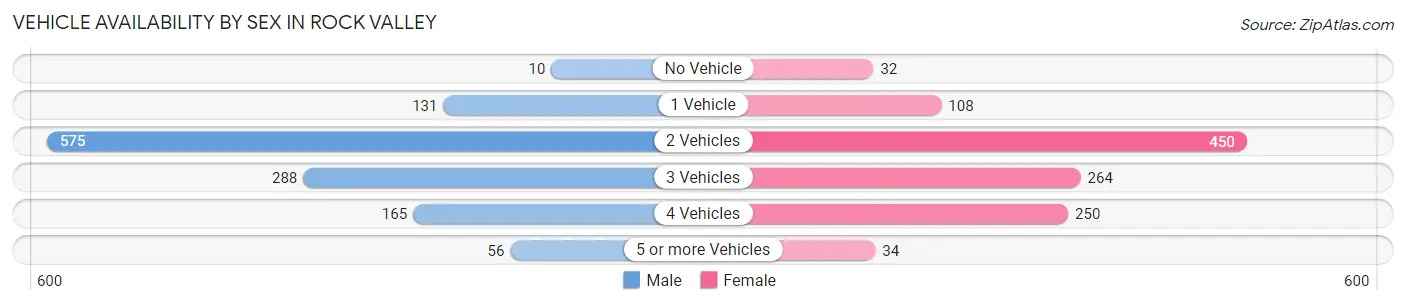
| Vehicles Available | Male | Female |
| No Vehicle | 10 (0.8%) | 32 (2.8%) |
| 1 Vehicle | 131 (10.7%) | 108 (9.5%) |
| 2 Vehicles | 575 (46.9%) | 450 (39.5%) |
| 3 Vehicles | 288 (23.5%) | 264 (23.2%) |
| 4 Vehicles | 165 (13.5%) | 250 (22.0%) |
| 5 or more Vehicles | 56 (4.6%) | 34 (3.0%) |
| Total | 1,225 (100.0%) | 1,138 (100.0%) |
Commute Time in Rock Valley
The most frequently occuring commute durations in Rock Valley are 5 to 9 minutes (721 commuters, 33.8%), less than 5 minutes (500 commuters, 23.4%), and 15 to 19 minutes (289 commuters, 13.6%).
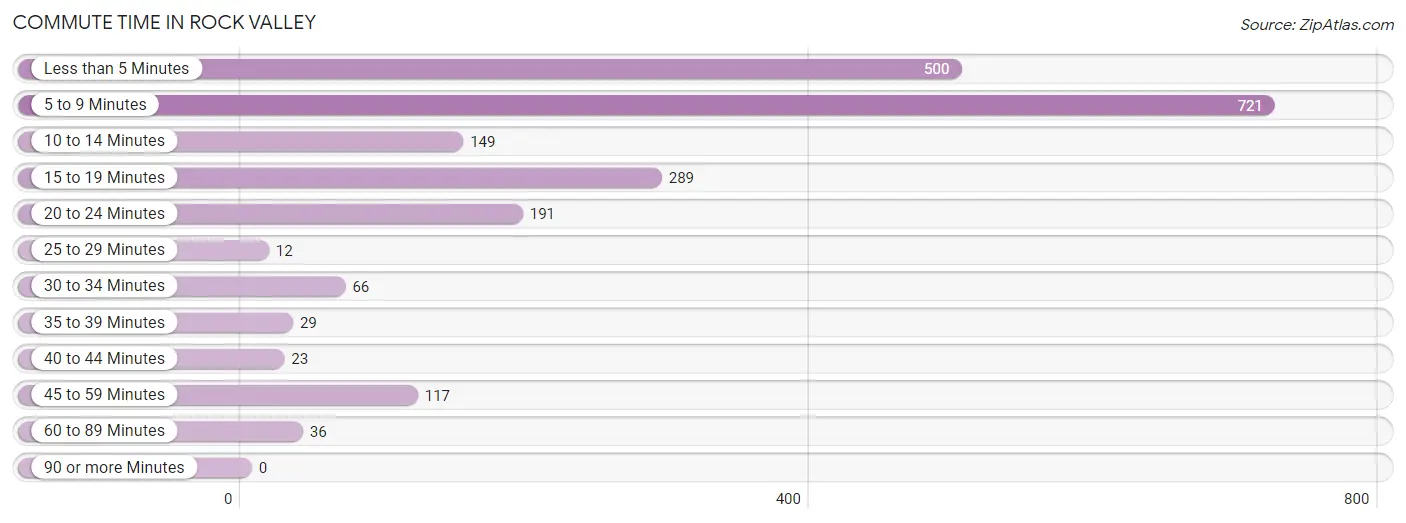
| Commute Time | # Commuters | % Commuters |
| Less than 5 Minutes | 500 | 23.4% |
| 5 to 9 Minutes | 721 | 33.8% |
| 10 to 14 Minutes | 149 | 7.0% |
| 15 to 19 Minutes | 289 | 13.6% |
| 20 to 24 Minutes | 191 | 8.9% |
| 25 to 29 Minutes | 12 | 0.6% |
| 30 to 34 Minutes | 66 | 3.1% |
| 35 to 39 Minutes | 29 | 1.4% |
| 40 to 44 Minutes | 23 | 1.1% |
| 45 to 59 Minutes | 117 | 5.5% |
| 60 to 89 Minutes | 36 | 1.7% |
| 90 or more Minutes | 0 | 0.0% |
Commute Time by Sex in Rock Valley
The most common commute times in Rock Valley are 5 to 9 minutes (358 commuters, 31.9%) for males and 5 to 9 minutes (363 commuters, 35.9%) for females.
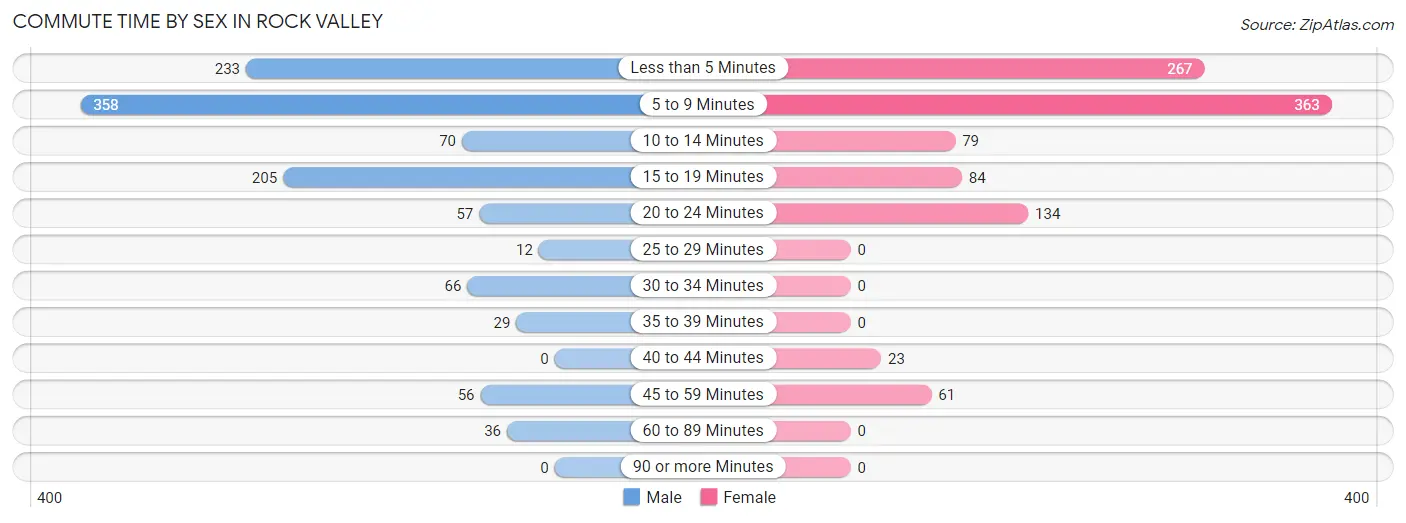
| Commute Time | Male | Female |
| Less than 5 Minutes | 233 (20.8%) | 267 (26.4%) |
| 5 to 9 Minutes | 358 (31.9%) | 363 (35.9%) |
| 10 to 14 Minutes | 70 (6.2%) | 79 (7.8%) |
| 15 to 19 Minutes | 205 (18.3%) | 84 (8.3%) |
| 20 to 24 Minutes | 57 (5.1%) | 134 (13.3%) |
| 25 to 29 Minutes | 12 (1.1%) | 0 (0.0%) |
| 30 to 34 Minutes | 66 (5.9%) | 0 (0.0%) |
| 35 to 39 Minutes | 29 (2.6%) | 0 (0.0%) |
| 40 to 44 Minutes | 0 (0.0%) | 23 (2.3%) |
| 45 to 59 Minutes | 56 (5.0%) | 61 (6.0%) |
| 60 to 89 Minutes | 36 (3.2%) | 0 (0.0%) |
| 90 or more Minutes | 0 (0.0%) | 0 (0.0%) |
Time of Departure to Work by Sex in Rock Valley
The most frequent times of departure to work in Rock Valley are 6:30 AM to 6:59 AM (337, 30.0%) for males and 7:30 AM to 7:59 AM (283, 28.0%) for females.
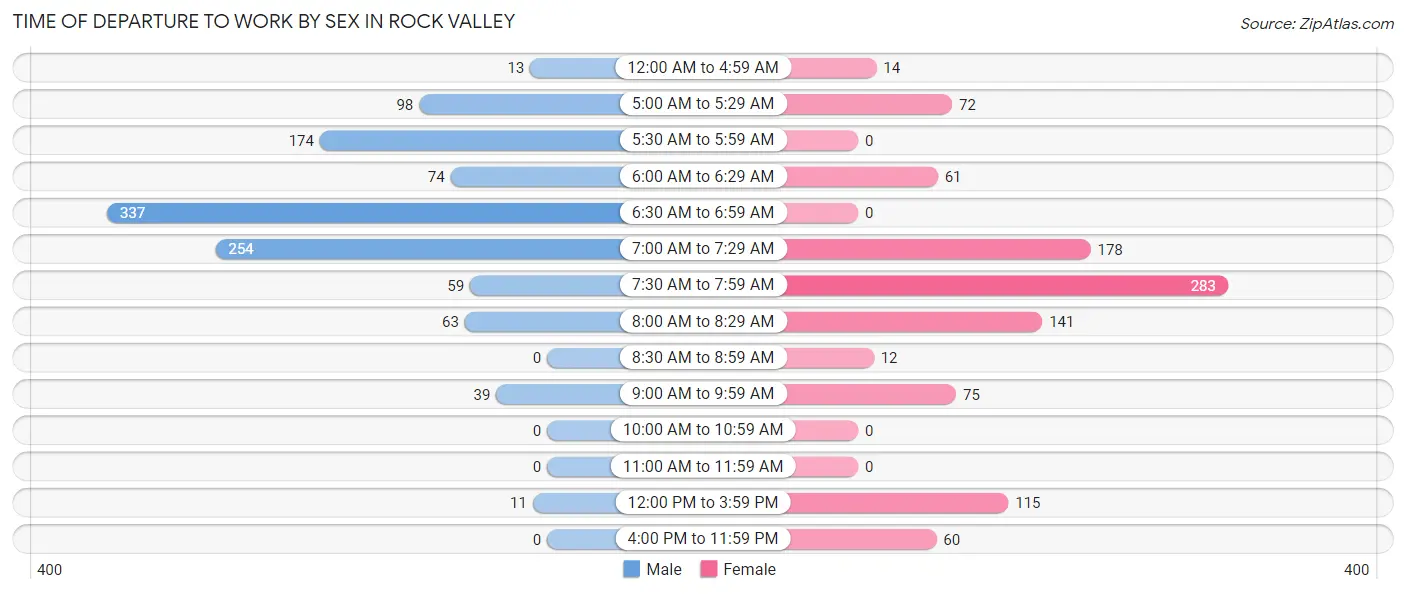
| Time of Departure | Male | Female |
| 12:00 AM to 4:59 AM | 13 (1.2%) | 14 (1.4%) |
| 5:00 AM to 5:29 AM | 98 (8.7%) | 72 (7.1%) |
| 5:30 AM to 5:59 AM | 174 (15.5%) | 0 (0.0%) |
| 6:00 AM to 6:29 AM | 74 (6.6%) | 61 (6.0%) |
| 6:30 AM to 6:59 AM | 337 (30.0%) | 0 (0.0%) |
| 7:00 AM to 7:29 AM | 254 (22.6%) | 178 (17.6%) |
| 7:30 AM to 7:59 AM | 59 (5.3%) | 283 (28.0%) |
| 8:00 AM to 8:29 AM | 63 (5.6%) | 141 (14.0%) |
| 8:30 AM to 8:59 AM | 0 (0.0%) | 12 (1.2%) |
| 9:00 AM to 9:59 AM | 39 (3.5%) | 75 (7.4%) |
| 10:00 AM to 10:59 AM | 0 (0.0%) | 0 (0.0%) |
| 11:00 AM to 11:59 AM | 0 (0.0%) | 0 (0.0%) |
| 12:00 PM to 3:59 PM | 11 (1.0%) | 115 (11.4%) |
| 4:00 PM to 11:59 PM | 0 (0.0%) | 60 (5.9%) |
| Total | 1,122 (100.0%) | 1,011 (100.0%) |
Housing Occupancy in Rock Valley
Occupancy by Ownership in Rock Valley
Of the total 1,594 dwellings in Rock Valley, owner-occupied units account for 1,165 (73.1%), while renter-occupied units make up 429 (26.9%).
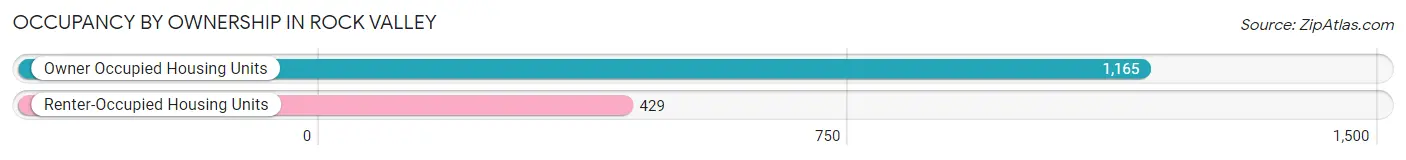
| Occupancy | # Housing Units | % Housing Units |
| Owner Occupied Housing Units | 1,165 | 73.1% |
| Renter-Occupied Housing Units | 429 | 26.9% |
| Total Occupied Housing Units | 1,594 | 100.0% |
Occupancy by Household Size in Rock Valley
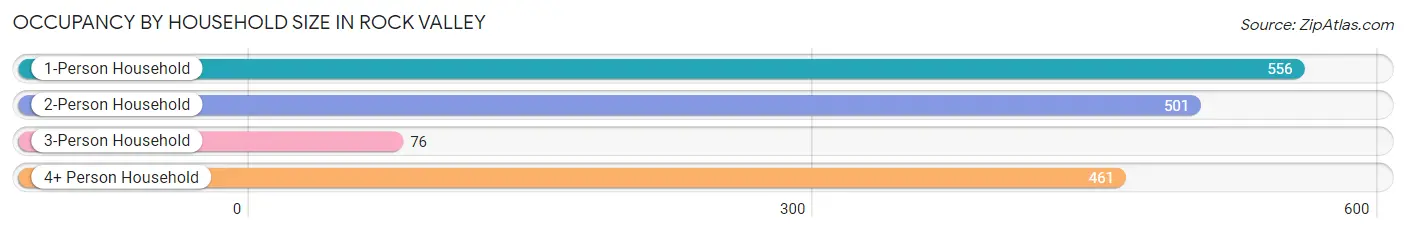
| Household Size | # Housing Units | % Housing Units |
| 1-Person Household | 556 | 34.9% |
| 2-Person Household | 501 | 31.4% |
| 3-Person Household | 76 | 4.8% |
| 4+ Person Household | 461 | 28.9% |
| Total Housing Units | 1,594 | 100.0% |
Occupancy by Ownership by Household Size in Rock Valley
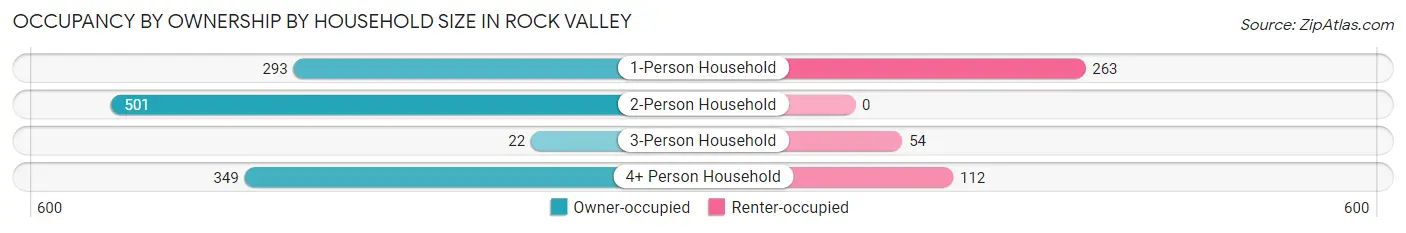
| Household Size | Owner-occupied | Renter-occupied |
| 1-Person Household | 293 (52.7%) | 263 (47.3%) |
| 2-Person Household | 501 (100.0%) | 0 (0.0%) |
| 3-Person Household | 22 (28.9%) | 54 (71.1%) |
| 4+ Person Household | 349 (75.7%) | 112 (24.3%) |
| Total Housing Units | 1,165 (73.1%) | 429 (26.9%) |
Occupancy by Educational Attainment in Rock Valley
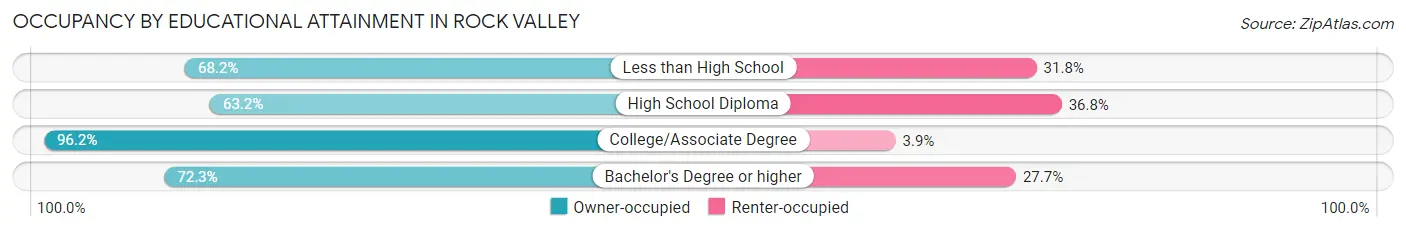
| Household Size | Owner-occupied | Renter-occupied |
| Less than High School | 165 (68.2%) | 77 (31.8%) |
| High School Diploma | 361 (63.2%) | 210 (36.8%) |
| College/Associate Degree | 300 (96.2%) | 12 (3.8%) |
| Bachelor's Degree or higher | 339 (72.3%) | 130 (27.7%) |
Occupancy by Age of Householder in Rock Valley
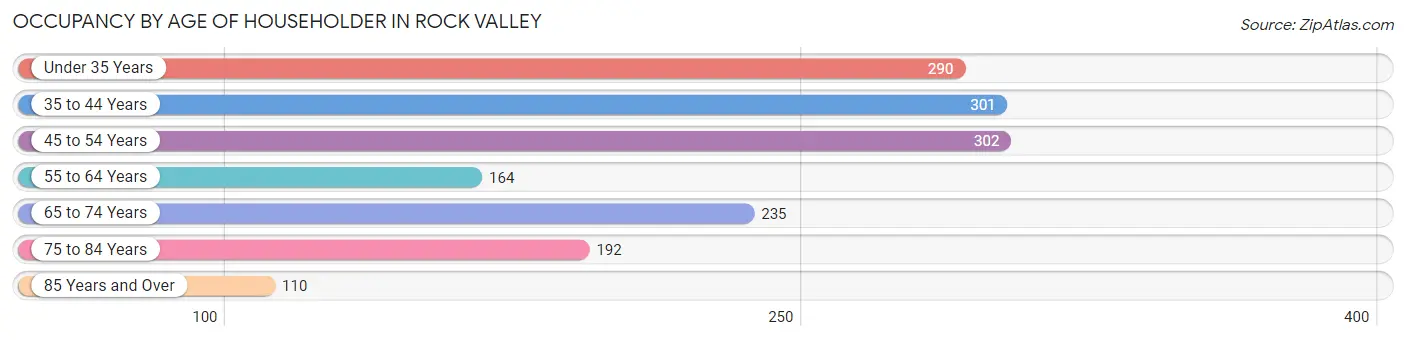
| Age Bracket | # Households | % Households |
| Under 35 Years | 290 | 18.2% |
| 35 to 44 Years | 301 | 18.9% |
| 45 to 54 Years | 302 | 19.0% |
| 55 to 64 Years | 164 | 10.3% |
| 65 to 74 Years | 235 | 14.7% |
| 75 to 84 Years | 192 | 12.0% |
| 85 Years and Over | 110 | 6.9% |
| Total | 1,594 | 100.0% |
Housing Finances in Rock Valley
Median Income by Occupancy in Rock Valley
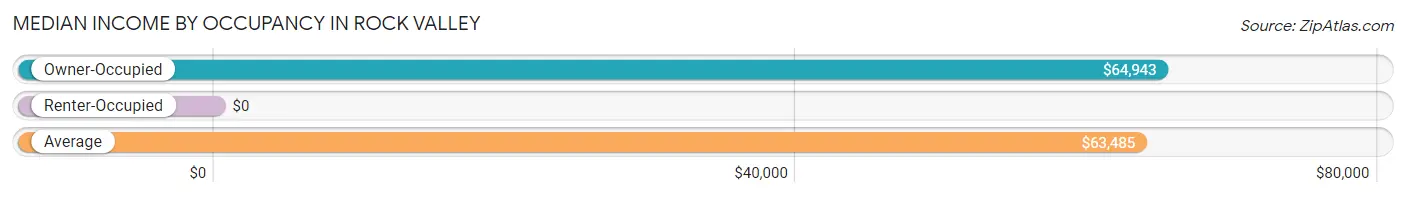
| Occupancy Type | # Households | Median Income |
| Owner-Occupied | 1,165 (73.1%) | $64,943 |
| Renter-Occupied | 429 (26.9%) | $0 |
| Average | 1,594 (100.0%) | $63,485 |
Occupancy by Householder Income Bracket in Rock Valley
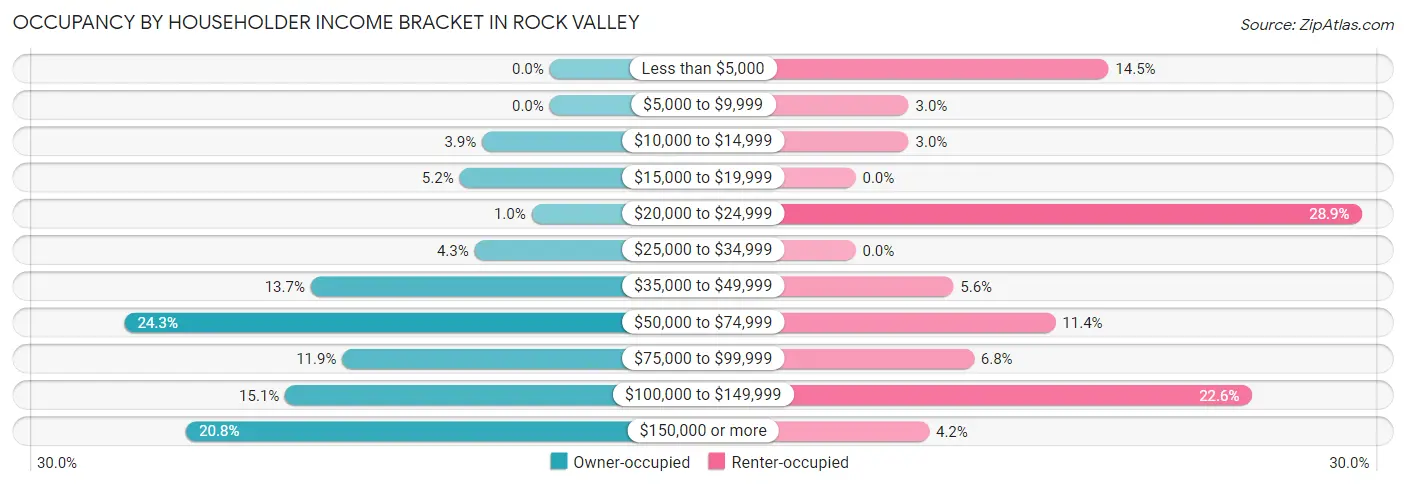
| Income Bracket | Owner-occupied | Renter-occupied |
| Less than $5,000 | 0 (0.0%) | 62 (14.4%) |
| $5,000 to $9,999 | 0 (0.0%) | 13 (3.0%) |
| $10,000 to $14,999 | 45 (3.9%) | 13 (3.0%) |
| $15,000 to $19,999 | 60 (5.1%) | 0 (0.0%) |
| $20,000 to $24,999 | 12 (1.0%) | 124 (28.9%) |
| $25,000 to $34,999 | 50 (4.3%) | 0 (0.0%) |
| $35,000 to $49,999 | 159 (13.7%) | 24 (5.6%) |
| $50,000 to $74,999 | 283 (24.3%) | 49 (11.4%) |
| $75,000 to $99,999 | 138 (11.8%) | 29 (6.8%) |
| $100,000 to $149,999 | 176 (15.1%) | 97 (22.6%) |
| $150,000 or more | 242 (20.8%) | 18 (4.2%) |
| Total | 1,165 (100.0%) | 429 (100.0%) |
Monthly Housing Cost Tiers in Rock Valley
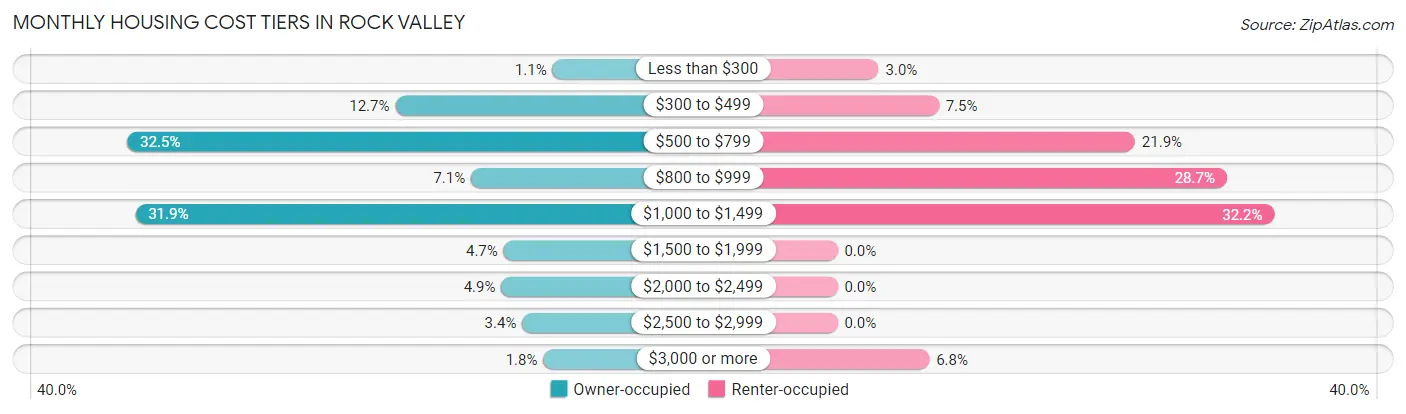
| Monthly Cost | Owner-occupied | Renter-occupied |
| Less than $300 | 13 (1.1%) | 13 (3.0%) |
| $300 to $499 | 148 (12.7%) | 32 (7.5%) |
| $500 to $799 | 378 (32.5%) | 94 (21.9%) |
| $800 to $999 | 83 (7.1%) | 123 (28.7%) |
| $1,000 to $1,499 | 371 (31.9%) | 138 (32.2%) |
| $1,500 to $1,999 | 55 (4.7%) | 0 (0.0%) |
| $2,000 to $2,499 | 57 (4.9%) | 0 (0.0%) |
| $2,500 to $2,999 | 39 (3.4%) | 0 (0.0%) |
| $3,000 or more | 21 (1.8%) | 29 (6.8%) |
| Total | 1,165 (100.0%) | 429 (100.0%) |
Physical Housing Characteristics in Rock Valley
Housing Structures in Rock Valley
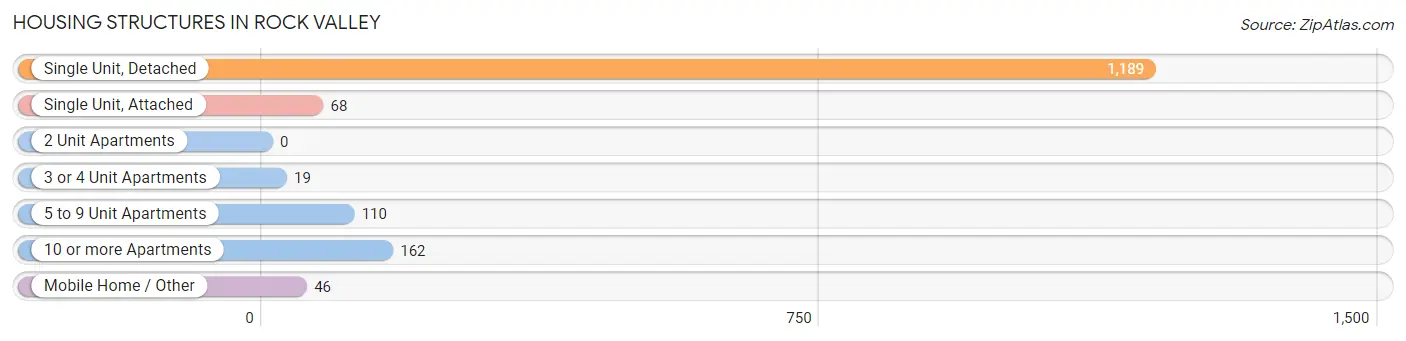
| Structure Type | # Housing Units | % Housing Units |
| Single Unit, Detached | 1,189 | 74.6% |
| Single Unit, Attached | 68 | 4.3% |
| 2 Unit Apartments | 0 | 0.0% |
| 3 or 4 Unit Apartments | 19 | 1.2% |
| 5 to 9 Unit Apartments | 110 | 6.9% |
| 10 or more Apartments | 162 | 10.2% |
| Mobile Home / Other | 46 | 2.9% |
| Total | 1,594 | 100.0% |
Housing Structures by Occupancy in Rock Valley
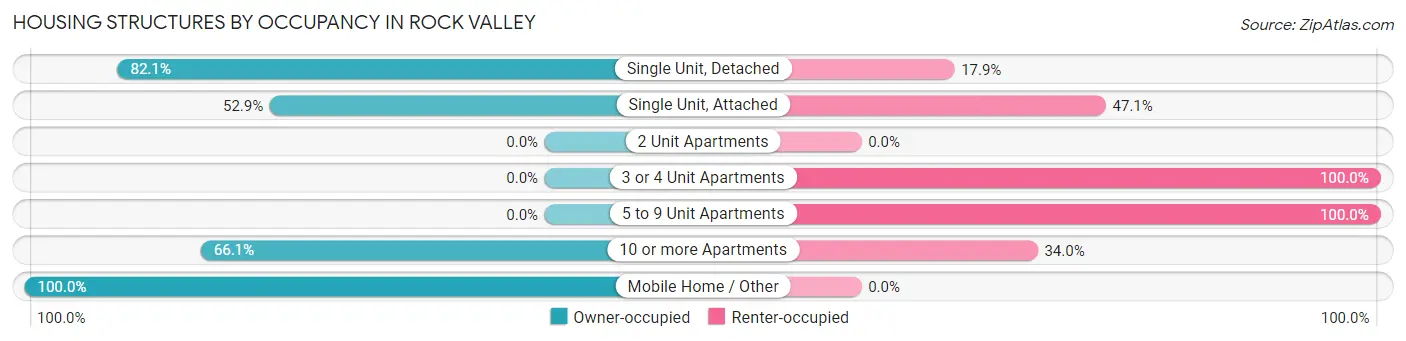
| Structure Type | Owner-occupied | Renter-occupied |
| Single Unit, Detached | 976 (82.1%) | 213 (17.9%) |
| Single Unit, Attached | 36 (52.9%) | 32 (47.1%) |
| 2 Unit Apartments | 0 (0.0%) | 0 (0.0%) |
| 3 or 4 Unit Apartments | 0 (0.0%) | 19 (100.0%) |
| 5 to 9 Unit Apartments | 0 (0.0%) | 110 (100.0%) |
| 10 or more Apartments | 107 (66.0%) | 55 (34.0%) |
| Mobile Home / Other | 46 (100.0%) | 0 (0.0%) |
| Total | 1,165 (73.1%) | 429 (26.9%) |
Housing Structures by Number of Rooms in Rock Valley
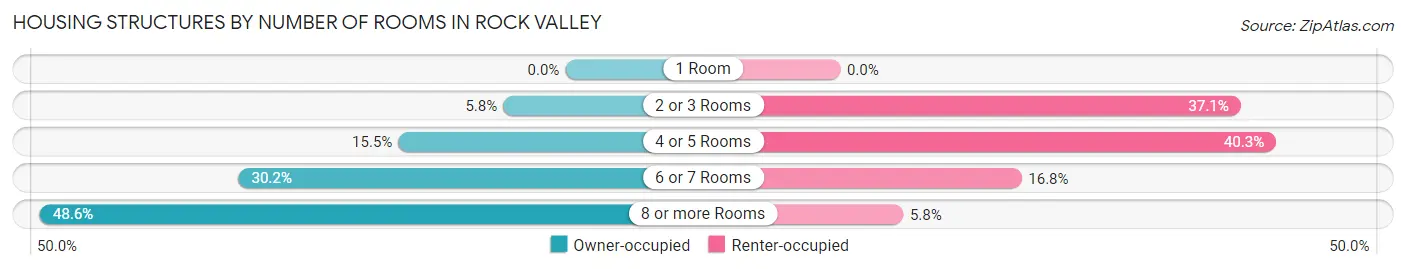
| Number of Rooms | Owner-occupied | Renter-occupied |
| 1 Room | 0 (0.0%) | 0 (0.0%) |
| 2 or 3 Rooms | 67 (5.8%) | 159 (37.1%) |
| 4 or 5 Rooms | 180 (15.4%) | 173 (40.3%) |
| 6 or 7 Rooms | 352 (30.2%) | 72 (16.8%) |
| 8 or more Rooms | 566 (48.6%) | 25 (5.8%) |
| Total | 1,165 (100.0%) | 429 (100.0%) |
Housing Structure by Heating Type in Rock Valley
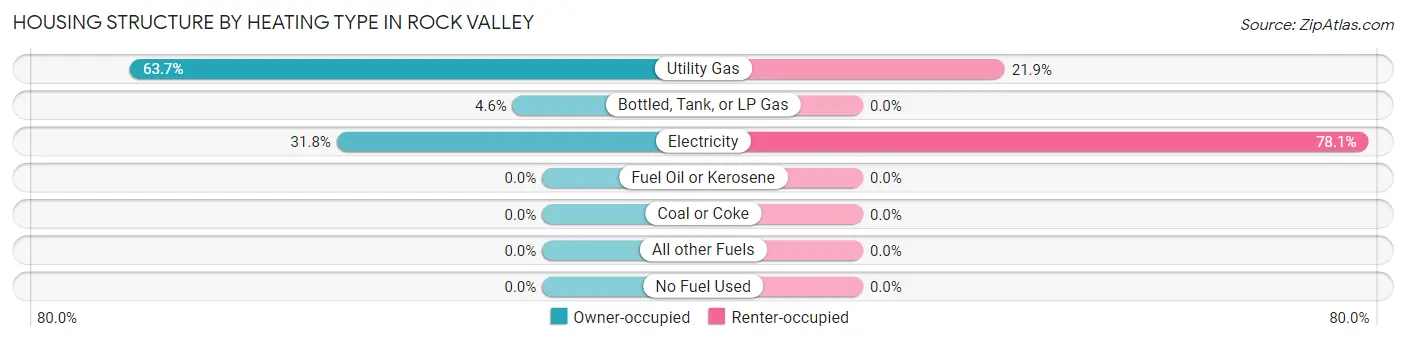
| Heating Type | Owner-occupied | Renter-occupied |
| Utility Gas | 742 (63.7%) | 94 (21.9%) |
| Bottled, Tank, or LP Gas | 53 (4.5%) | 0 (0.0%) |
| Electricity | 370 (31.8%) | 335 (78.1%) |
| Fuel Oil or Kerosene | 0 (0.0%) | 0 (0.0%) |
| Coal or Coke | 0 (0.0%) | 0 (0.0%) |
| All other Fuels | 0 (0.0%) | 0 (0.0%) |
| No Fuel Used | 0 (0.0%) | 0 (0.0%) |
| Total | 1,165 (100.0%) | 429 (100.0%) |
Household Vehicle Usage in Rock Valley
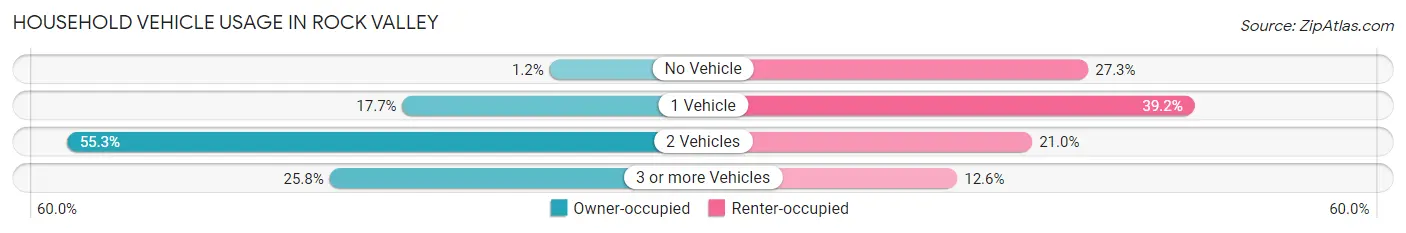
| Vehicles per Household | Owner-occupied | Renter-occupied |
| No Vehicle | 14 (1.2%) | 117 (27.3%) |
| 1 Vehicle | 206 (17.7%) | 168 (39.2%) |
| 2 Vehicles | 644 (55.3%) | 90 (21.0%) |
| 3 or more Vehicles | 301 (25.8%) | 54 (12.6%) |
| Total | 1,165 (100.0%) | 429 (100.0%) |
Real Estate & Mortgages in Rock Valley
Real Estate and Mortgage Overview in Rock Valley
| Characteristic | Without Mortgage | With Mortgage |
| Housing Units | 601 | 564 |
| Median Property Value | $214,000 | $190,400 |
| Median Household Income | $62,822 | $138 |
| Monthly Housing Costs | $599 | $21 |
| Real Estate Taxes | $3,387 | $0 |
Property Value by Mortgage Status in Rock Valley
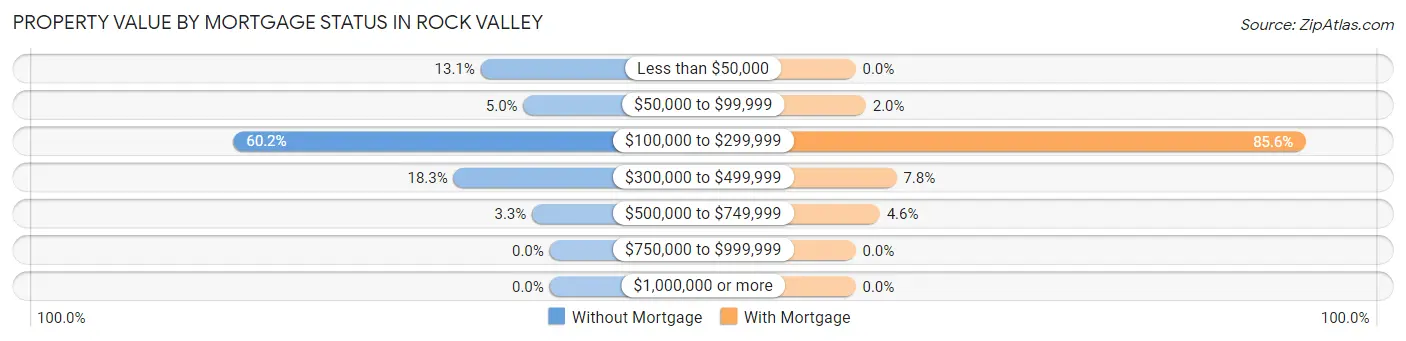
| Property Value | Without Mortgage | With Mortgage |
| Less than $50,000 | 79 (13.1%) | 0 (0.0%) |
| $50,000 to $99,999 | 30 (5.0%) | 11 (1.9%) |
| $100,000 to $299,999 | 362 (60.2%) | 483 (85.6%) |
| $300,000 to $499,999 | 110 (18.3%) | 44 (7.8%) |
| $500,000 to $749,999 | 20 (3.3%) | 26 (4.6%) |
| $750,000 to $999,999 | 0 (0.0%) | 0 (0.0%) |
| $1,000,000 or more | 0 (0.0%) | 0 (0.0%) |
| Total | 601 (100.0%) | 564 (100.0%) |
Household Income by Mortgage Status in Rock Valley
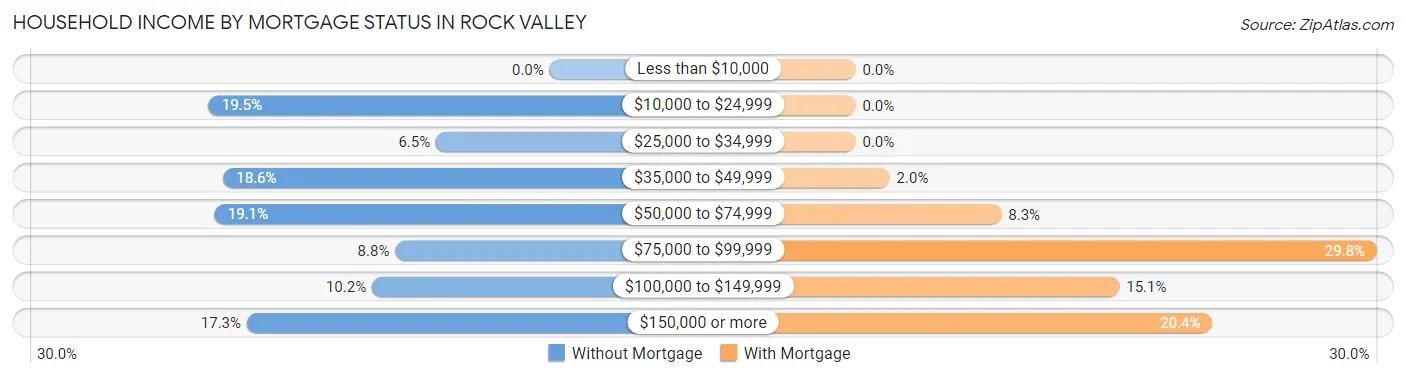
| Household Income | Without Mortgage | With Mortgage |
| Less than $10,000 | 0 (0.0%) | 0 (0.0%) |
| $10,000 to $24,999 | 117 (19.5%) | 0 (0.0%) |
| $25,000 to $34,999 | 39 (6.5%) | 0 (0.0%) |
| $35,000 to $49,999 | 112 (18.6%) | 11 (1.9%) |
| $50,000 to $74,999 | 115 (19.1%) | 47 (8.3%) |
| $75,000 to $99,999 | 53 (8.8%) | 168 (29.8%) |
| $100,000 to $149,999 | 61 (10.2%) | 85 (15.1%) |
| $150,000 or more | 104 (17.3%) | 115 (20.4%) |
| Total | 601 (100.0%) | 564 (100.0%) |
Property Value to Household Income Ratio in Rock Valley
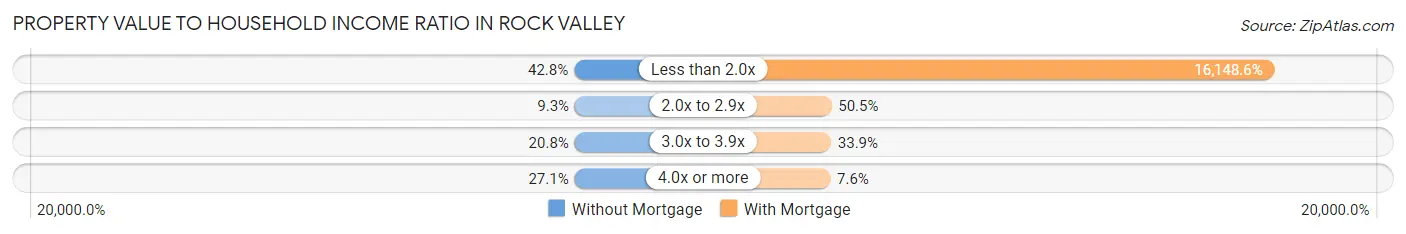
| Value-to-Income Ratio | Without Mortgage | With Mortgage |
| Less than 2.0x | 257 (42.8%) | 91,078 (16,148.6%) |
| 2.0x to 2.9x | 56 (9.3%) | 285 (50.5%) |
| 3.0x to 3.9x | 125 (20.8%) | 191 (33.9%) |
| 4.0x or more | 163 (27.1%) | 43 (7.6%) |
| Total | 601 (100.0%) | 564 (100.0%) |
Real Estate Taxes by Mortgage Status in Rock Valley
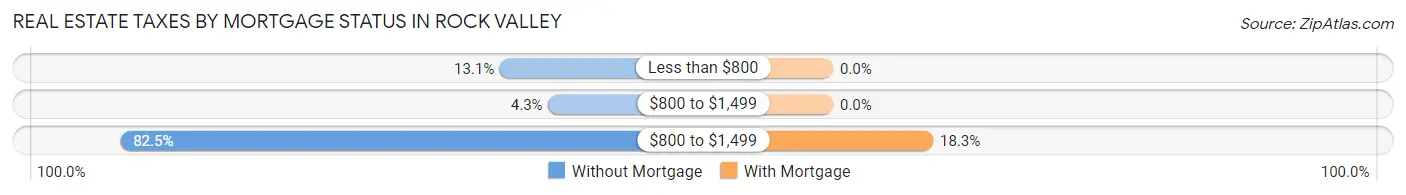
| Property Taxes | Without Mortgage | With Mortgage |
| Less than $800 | 79 (13.1%) | 0 (0.0%) |
| $800 to $1,499 | 26 (4.3%) | 0 (0.0%) |
| $800 to $1,499 | 496 (82.5%) | 103 (18.3%) |
| Total | 601 (100.0%) | 564 (100.0%) |
Health & Disability in Rock Valley
Health Insurance Coverage by Age in Rock Valley
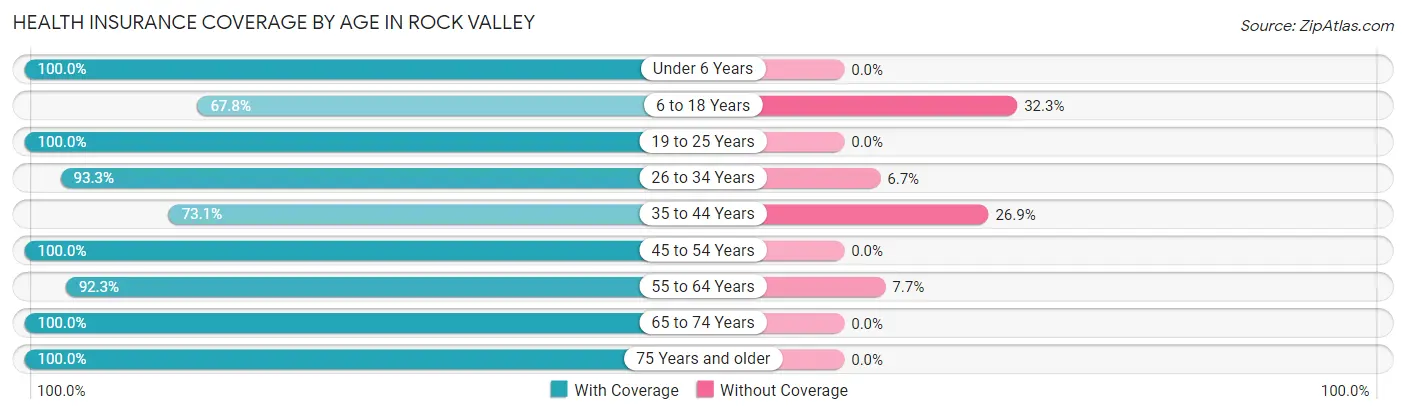
| Age Bracket | With Coverage | Without Coverage |
| Under 6 Years | 271 (100.0%) | 0 (0.0%) |
| 6 to 18 Years | 500 (67.7%) | 238 (32.3%) |
| 19 to 25 Years | 519 (100.0%) | 0 (0.0%) |
| 26 to 34 Years | 250 (93.3%) | 18 (6.7%) |
| 35 to 44 Years | 473 (73.1%) | 174 (26.9%) |
| 45 to 54 Years | 461 (100.0%) | 0 (0.0%) |
| 55 to 64 Years | 325 (92.3%) | 27 (7.7%) |
| 65 to 74 Years | 368 (100.0%) | 0 (0.0%) |
| 75 Years and older | 362 (100.0%) | 0 (0.0%) |
| Total | 3,529 (88.5%) | 457 (11.5%) |
Health Insurance Coverage by Citizenship Status in Rock Valley
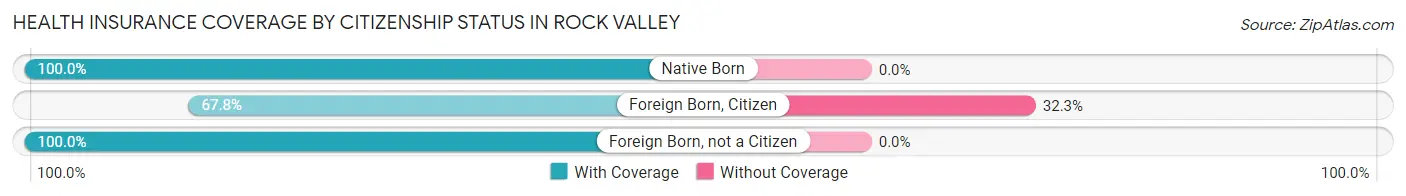
| Citizenship Status | With Coverage | Without Coverage |
| Native Born | 271 (100.0%) | 0 (0.0%) |
| Foreign Born, Citizen | 500 (67.7%) | 238 (32.3%) |
| Foreign Born, not a Citizen | 519 (100.0%) | 0 (0.0%) |
Health Insurance Coverage by Household Income in Rock Valley
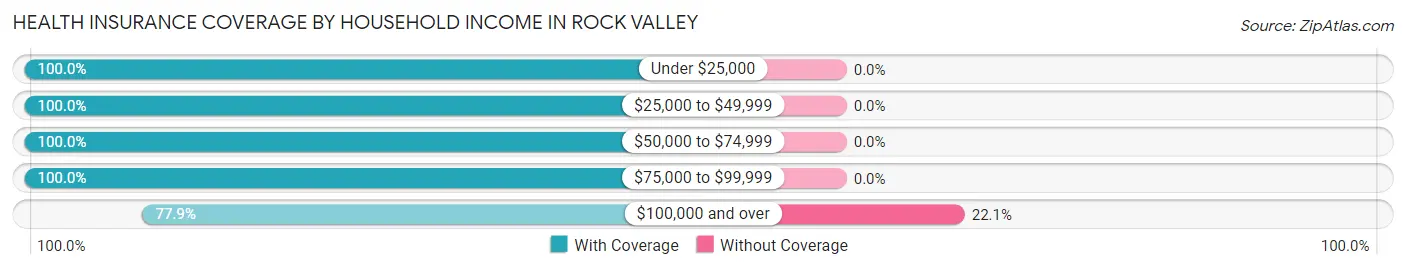
| Household Income | With Coverage | Without Coverage |
| Under $25,000 | 343 (100.0%) | 0 (0.0%) |
| $25,000 to $49,999 | 298 (100.0%) | 0 (0.0%) |
| $50,000 to $74,999 | 800 (100.0%) | 0 (0.0%) |
| $75,000 to $99,999 | 431 (100.0%) | 0 (0.0%) |
| $100,000 and over | 1,610 (77.9%) | 457 (22.1%) |
Public vs Private Health Insurance Coverage by Age in Rock Valley
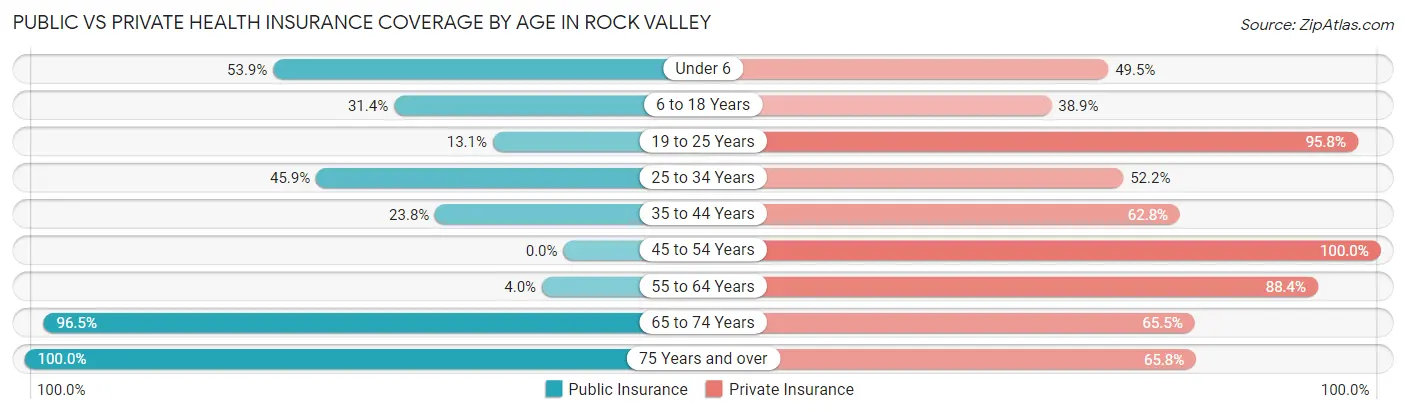
| Age Bracket | Public Insurance | Private Insurance |
| Under 6 | 146 (53.9%) | 134 (49.4%) |
| 6 to 18 Years | 232 (31.4%) | 287 (38.9%) |
| 19 to 25 Years | 68 (13.1%) | 497 (95.8%) |
| 25 to 34 Years | 123 (45.9%) | 140 (52.2%) |
| 35 to 44 Years | 154 (23.8%) | 406 (62.7%) |
| 45 to 54 Years | 0 (0.0%) | 461 (100.0%) |
| 55 to 64 Years | 14 (4.0%) | 311 (88.3%) |
| 65 to 74 Years | 355 (96.5%) | 241 (65.5%) |
| 75 Years and over | 362 (100.0%) | 238 (65.7%) |
| Total | 1,454 (36.5%) | 2,715 (68.1%) |
Disability Status by Sex by Age in Rock Valley
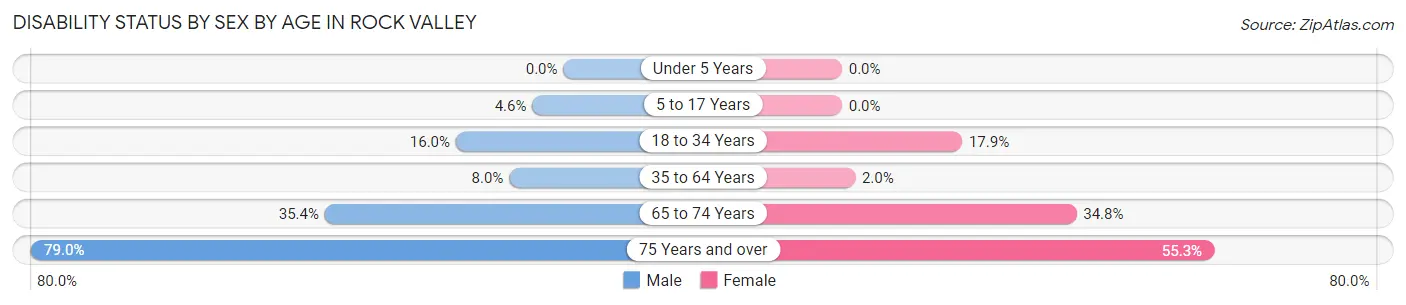
| Age Bracket | Male | Female |
| Under 5 Years | 0 (0.0%) | 0 (0.0%) |
| 5 to 17 Years | 19 (4.6%) | 0 (0.0%) |
| 18 to 34 Years | 68 (16.0%) | 78 (17.8%) |
| 35 to 64 Years | 60 (8.0%) | 14 (2.0%) |
| 65 to 74 Years | 51 (35.4%) | 78 (34.8%) |
| 75 Years and over | 113 (79.0%) | 121 (55.2%) |
Disability Class by Sex by Age in Rock Valley
Disability Class: Hearing Difficulty
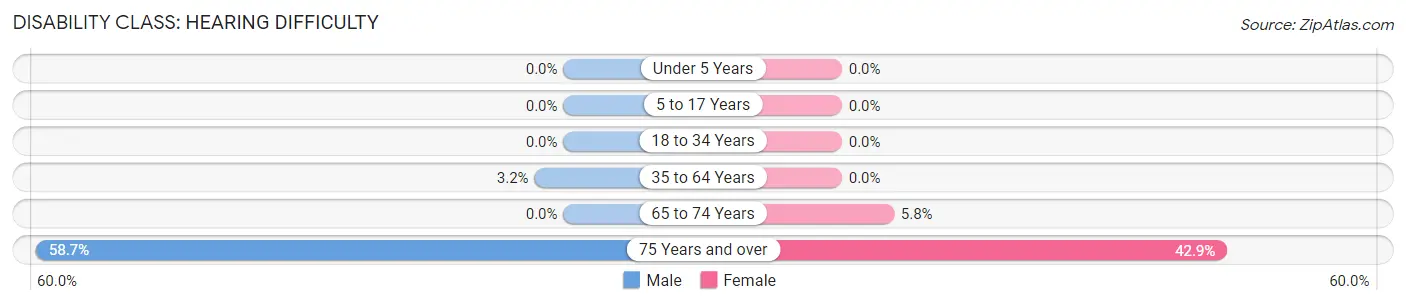
| Age Bracket | Male | Female |
| Under 5 Years | 0 (0.0%) | 0 (0.0%) |
| 5 to 17 Years | 0 (0.0%) | 0 (0.0%) |
| 18 to 34 Years | 0 (0.0%) | 0 (0.0%) |
| 35 to 64 Years | 24 (3.2%) | 0 (0.0%) |
| 65 to 74 Years | 0 (0.0%) | 13 (5.8%) |
| 75 Years and over | 84 (58.7%) | 94 (42.9%) |
Disability Class: Vision Difficulty
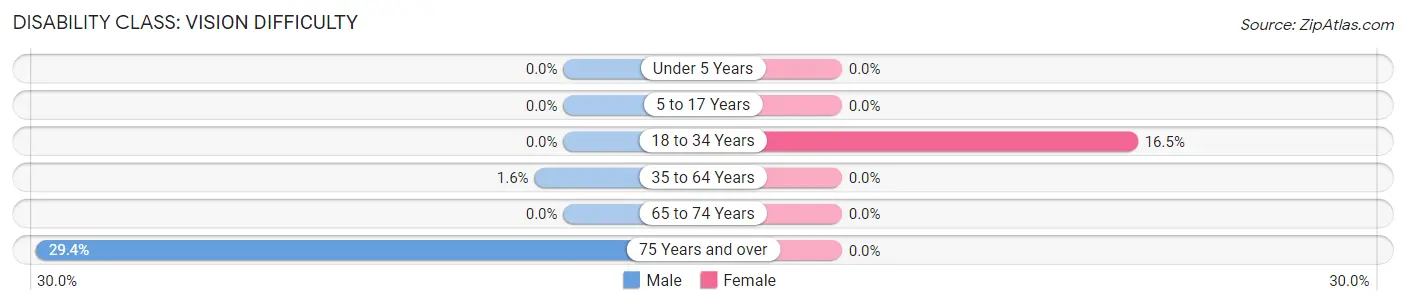
| Age Bracket | Male | Female |
| Under 5 Years | 0 (0.0%) | 0 (0.0%) |
| 5 to 17 Years | 0 (0.0%) | 0 (0.0%) |
| 18 to 34 Years | 0 (0.0%) | 72 (16.5%) |
| 35 to 64 Years | 12 (1.6%) | 0 (0.0%) |
| 65 to 74 Years | 0 (0.0%) | 0 (0.0%) |
| 75 Years and over | 42 (29.4%) | 0 (0.0%) |
Disability Class: Cognitive Difficulty
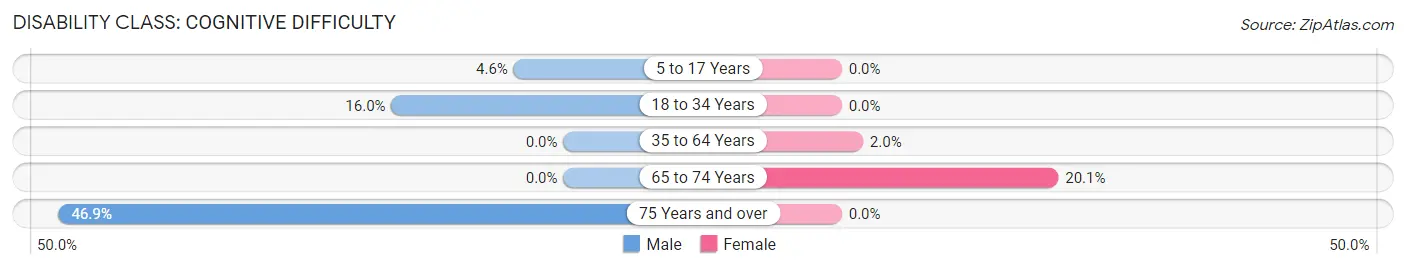
| Age Bracket | Male | Female |
| 5 to 17 Years | 19 (4.6%) | 0 (0.0%) |
| 18 to 34 Years | 68 (16.0%) | 0 (0.0%) |
| 35 to 64 Years | 0 (0.0%) | 14 (2.0%) |
| 65 to 74 Years | 0 (0.0%) | 45 (20.1%) |
| 75 Years and over | 67 (46.9%) | 0 (0.0%) |
Disability Class: Ambulatory Difficulty
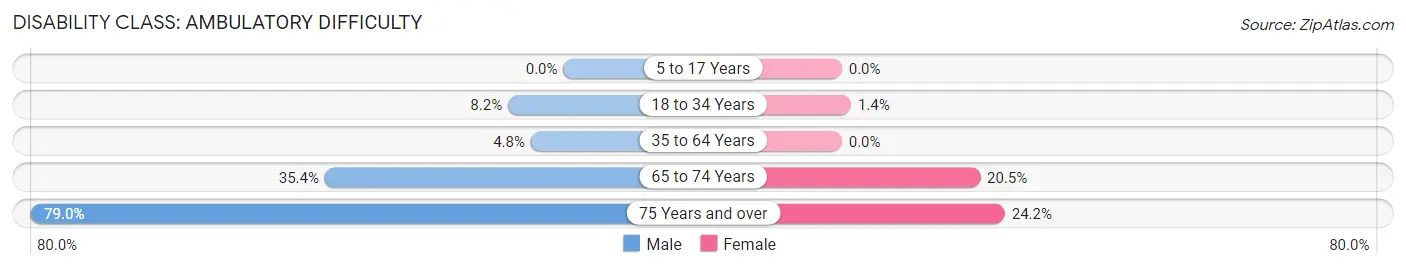
| Age Bracket | Male | Female |
| 5 to 17 Years | 0 (0.0%) | 0 (0.0%) |
| 18 to 34 Years | 35 (8.2%) | 6 (1.4%) |
| 35 to 64 Years | 36 (4.8%) | 0 (0.0%) |
| 65 to 74 Years | 51 (35.4%) | 46 (20.5%) |
| 75 Years and over | 113 (79.0%) | 53 (24.2%) |
Disability Class: Self-Care Difficulty
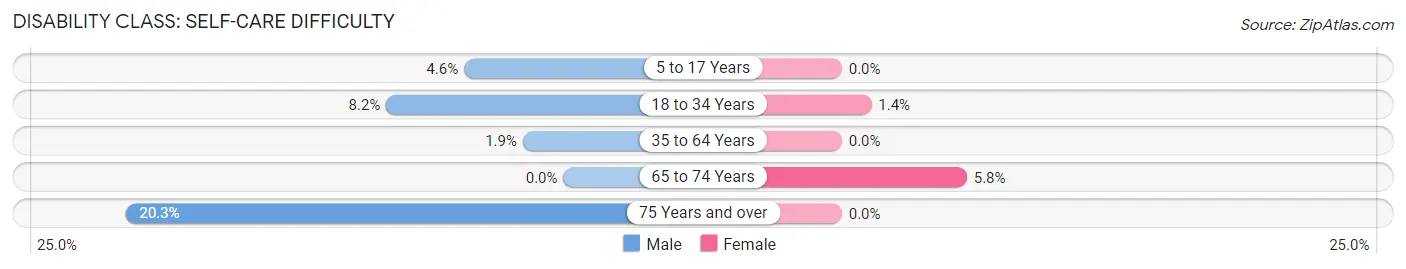
| Age Bracket | Male | Female |
| 5 to 17 Years | 19 (4.6%) | 0 (0.0%) |
| 18 to 34 Years | 35 (8.2%) | 6 (1.4%) |
| 35 to 64 Years | 14 (1.9%) | 0 (0.0%) |
| 65 to 74 Years | 0 (0.0%) | 13 (5.8%) |
| 75 Years and over | 29 (20.3%) | 0 (0.0%) |
Technology Access in Rock Valley
Computing Device Access in Rock Valley
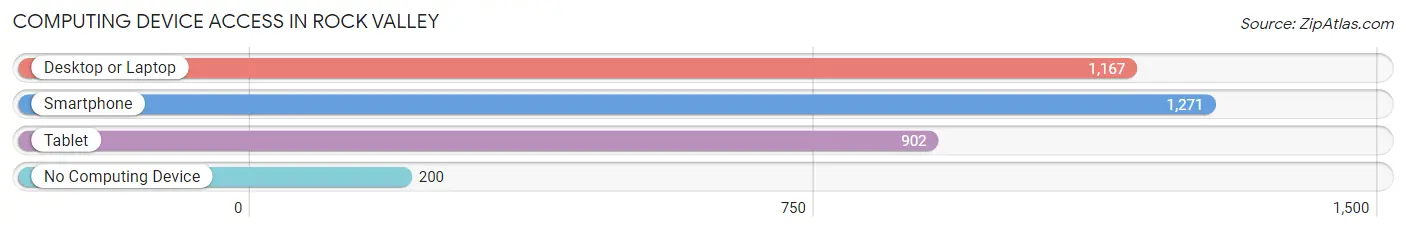
| Device Type | # Households | % Households |
| Desktop or Laptop | 1,167 | 73.2% |
| Smartphone | 1,271 | 79.7% |
| Tablet | 902 | 56.6% |
| No Computing Device | 200 | 12.6% |
| Total | 1,594 | 100.0% |
Internet Access in Rock Valley
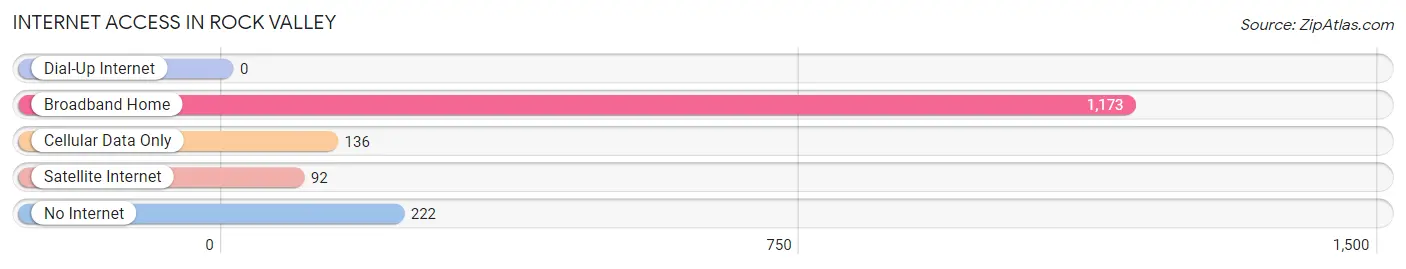
| Internet Type | # Households | % Households |
| Dial-Up Internet | 0 | 0.0% |
| Broadband Home | 1,173 | 73.6% |
| Cellular Data Only | 136 | 8.5% |
| Satellite Internet | 92 | 5.8% |
| No Internet | 222 | 13.9% |
| Total | 1,594 | 100.0% |
Rock Valley Summary
Rock Valley, Iowa is a small city located in Sioux County, Iowa. It is situated on the Big Sioux River, and is part of the Sioux City metropolitan area. The city has a population of approximately 3,000 people, and is known for its rural charm and friendly atmosphere.
History
Rock Valley was founded in 1871 by a group of Dutch settlers who had recently arrived in the area. The city was named after the nearby Rock River, which was named for the rocky terrain of the area. The settlers were attracted to the area due to its fertile soil and abundant natural resources.
The city quickly grew and prospered, and by the early 1900s, it had become a thriving agricultural center. The city was home to several large farms, as well as a number of small businesses. The city also had a thriving lumber industry, and was home to several sawmills.
In the 1950s, the city began to experience a decline in population as many of its residents moved away in search of better economic opportunities. However, the city has since experienced a resurgence in population, and is now home to a diverse population of people from all walks of life.
Geography
Rock Valley is located in the northwest corner of Sioux County, Iowa. It is situated on the Big Sioux River, and is part of the Sioux City metropolitan area. The city is located approximately 25 miles from Sioux City, and is bordered by the cities of Hull, Sioux Center, and Orange City.
The city has a total area of 2.2 square miles, all of which is land. The terrain of the area is mostly flat, with some rolling hills. The city is located in the Central Plains region of the United States, and has a humid continental climate.
Economy
Rock Valley’s economy is largely based on agriculture and manufacturing. The city is home to several large farms, as well as a number of small businesses. The city also has a thriving lumber industry, and is home to several sawmills.
The city is also home to several large employers, including Sioux Steel, Sioux Valley Energy, and Siouxland Community Health Center. The city also has a number of retail stores, restaurants, and other businesses.
Demographics
As of the 2010 census, Rock Valley had a population of 3,000 people. The racial makeup of the city was 97.3% White, 0.7% African American, 0.3% Native American, 0.3% Asian, 0.3% from other races, and 1.3% from two or more races. Hispanic or Latino of any race were 1.3% of the population.
The median income for a household in the city was $45,000, and the median income for a family was $50,000. The per capita income for the city was $20,000. About 8.3% of families and 10.3% of the population were below the poverty line, including 14.3% of those under age 18 and 6.3% of those age 65 or over.
Rock Valley is a small city with a rich history and a diverse population. The city is home to several large employers, as well as a number of small businesses. The city also has a thriving agricultural and lumber industry, and is known for its rural charm and friendly atmosphere.
Common Questions
What is Per Capita Income in Rock Valley?
Per Capita income in Rock Valley is $35,539.
What is the Median Family Income in Rock Valley?
Median Family Income in Rock Valley is $90,605.
What is the Median Household income in Rock Valley?
Median Household Income in Rock Valley is $63,485.
What is Income or Wage Gap in Rock Valley?
Income or Wage Gap in Rock Valley is 35.1%.
Women in Rock Valley earn 64.9 cents for every dollar earned by a man.
What is Inequality or Gini Index in Rock Valley?
Inequality or Gini Index in Rock Valley is 0.45.
What is the Total Population of Rock Valley?
Total Population of Rock Valley is 4,045.
What is the Total Male Population of Rock Valley?
Total Male Population of Rock Valley is 1,945.
What is the Total Female Population of Rock Valley?
Total Female Population of Rock Valley is 2,100.
What is the Ratio of Males per 100 Females in Rock Valley?
There are 92.62 Males per 100 Females in Rock Valley.
What is the Ratio of Females per 100 Males in Rock Valley?
There are 107.97 Females per 100 Males in Rock Valley.
What is the Median Population Age in Rock Valley?
Median Population Age in Rock Valley is 41.1 Years.
What is the Average Family Size in Rock Valley
Average Family Size in Rock Valley is 3.3 People.
What is the Average Household Size in Rock Valley
Average Household Size in Rock Valley is 2.5 People.
How Large is the Labor Force in Rock Valley?
There are 2,383 People in the Labor Forcein in Rock Valley.
What is the Percentage of People in the Labor Force in Rock Valley?
74.9% of People are in the Labor Force in Rock Valley.
What is the Unemployment Rate in Rock Valley?
Unemployment Rate in Rock Valley is 0.8%.