Sioux Rapids, IA Map & Demographics
Sioux Rapids Map
Sioux Rapids Overview
$30,621
PER CAPITA INCOME
$78,194
AVG FAMILY INCOME
$54,904
AVG HOUSEHOLD INCOME
52.2%
WAGE / INCOME GAP [ % ]
47.8¢/ $1
WAGE / INCOME GAP [ $ ]
0.38
INEQUALITY / GINI INDEX
812
TOTAL POPULATION
421
MALE POPULATION
391
FEMALE POPULATION
107.67
MALES / 100 FEMALES
92.87
FEMALES / 100 MALES
45.7
MEDIAN AGE
3.5
AVG FAMILY SIZE
2.5
AVG HOUSEHOLD SIZE
400
LABOR FORCE [ PEOPLE ]
63.3%
PERCENT IN LABOR FORCE
2.0%
UNEMPLOYMENT RATE
Sioux Rapids Zip Codes
Sioux Rapids Area Codes
Income in Sioux Rapids
Income Overview in Sioux Rapids
Per Capita Income in Sioux Rapids is $30,621, while median incomes of families and households are $78,194 and $54,904 respectively.
| Characteristic | Number | Measure |
| Per Capita Income | 812 | $30,621 |
| Median Family Income | 177 | $78,194 |
| Mean Family Income | 177 | $92,418 |
| Median Household Income | 319 | $54,904 |
| Mean Household Income | 319 | $74,556 |
| Income Deficit | 177 | $0 |
| Wage / Income Gap (%) | 812 | 52.19% |
| Wage / Income Gap ($) | 812 | 47.81¢ per $1 |
| Gini / Inequality Index | 812 | 0.38 |
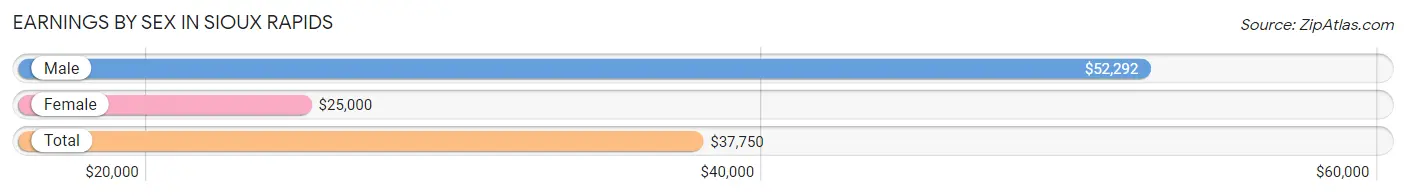
Earnings by Sex in Sioux Rapids
Average Earnings in Sioux Rapids are $37,750, $52,292 for men and $25,000 for women, a difference of 52.2%.
| Sex | Number | Average Earnings |
| Male | 203 (47.1%) | $52,292 |
| Female | 228 (52.9%) | $25,000 |
| Total | 431 (100.0%) | $37,750 |
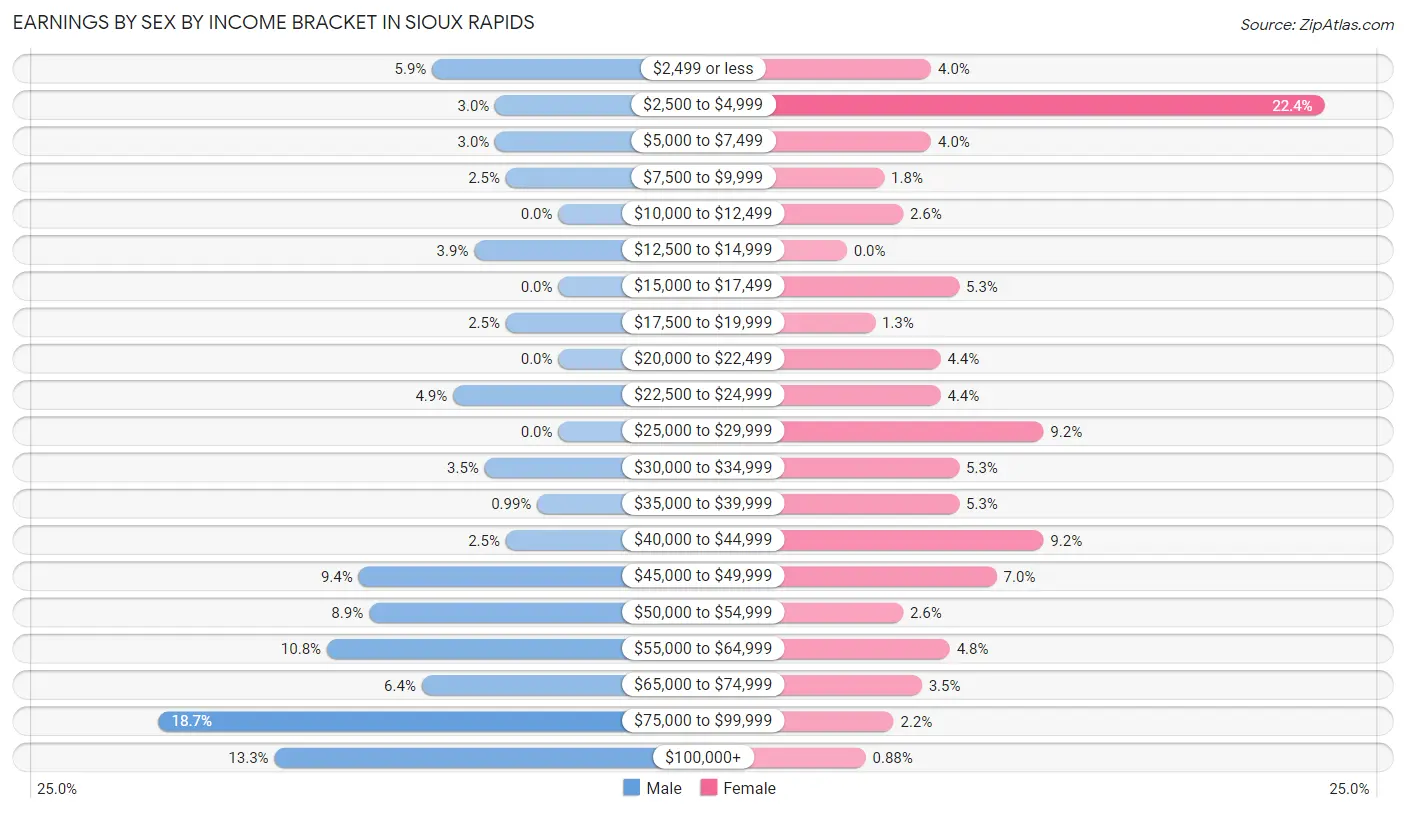
Earnings by Sex by Income Bracket in Sioux Rapids
The most common earnings brackets in Sioux Rapids are $75,000 to $99,999 for men (38 | 18.7%) and $2,500 to $4,999 for women (51 | 22.4%).
| Income | Male | Female |
| $2,499 or less | 12 (5.9%) | 9 (4.0%) |
| $2,500 to $4,999 | 6 (3.0%) | 51 (22.4%) |
| $5,000 to $7,499 | 6 (3.0%) | 9 (4.0%) |
| $7,500 to $9,999 | 5 (2.5%) | 4 (1.8%) |
| $10,000 to $12,499 | 0 (0.0%) | 6 (2.6%) |
| $12,500 to $14,999 | 8 (3.9%) | 0 (0.0%) |
| $15,000 to $17,499 | 0 (0.0%) | 12 (5.3%) |
| $17,500 to $19,999 | 5 (2.5%) | 3 (1.3%) |
| $20,000 to $22,499 | 0 (0.0%) | 10 (4.4%) |
| $22,500 to $24,999 | 10 (4.9%) | 10 (4.4%) |
| $25,000 to $29,999 | 0 (0.0%) | 21 (9.2%) |
| $30,000 to $34,999 | 7 (3.5%) | 12 (5.3%) |
| $35,000 to $39,999 | 2 (1.0%) | 12 (5.3%) |
| $40,000 to $44,999 | 5 (2.5%) | 21 (9.2%) |
| $45,000 to $49,999 | 19 (9.4%) | 16 (7.0%) |
| $50,000 to $54,999 | 18 (8.9%) | 6 (2.6%) |
| $55,000 to $64,999 | 22 (10.8%) | 11 (4.8%) |
| $65,000 to $74,999 | 13 (6.4%) | 8 (3.5%) |
| $75,000 to $99,999 | 38 (18.7%) | 5 (2.2%) |
| $100,000+ | 27 (13.3%) | 2 (0.9%) |
| Total | 203 (100.0%) | 228 (100.0%) |
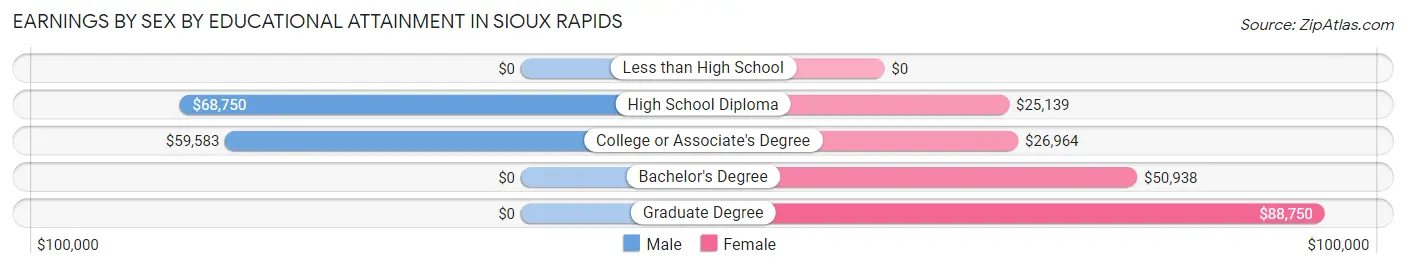
Earnings by Sex by Educational Attainment in Sioux Rapids
Average earnings in Sioux Rapids are $57,045 for men and $27,500 for women, a difference of 51.8%. Men with an educational attainment of high school diploma enjoy the highest average annual earnings of $68,750, while those with college or associate's degree education earn the least with $59,583. Women with an educational attainment of graduate degree earn the most with the average annual earnings of $88,750, while those with high school diploma education have the smallest earnings of $25,139.
| Educational Attainment | Male Income | Female Income |
| Less than High School | - | - |
| High School Diploma | $68,750 | $25,139 |
| College or Associate's Degree | $59,583 | $26,964 |
| Bachelor's Degree | - | - |
| Graduate Degree | - | - |
| Total | $57,045 | $27,500 |
Family Income in Sioux Rapids
Family Income Brackets in Sioux Rapids
According to the Sioux Rapids family income data, there are 36 families falling into the $50,000 to $74,999 income range, which is the most common income bracket and makes up 20.3% of all families. Conversely, the less than $10,000 income bracket is the least frequent group with only 1 families (0.6%) belonging to this category.
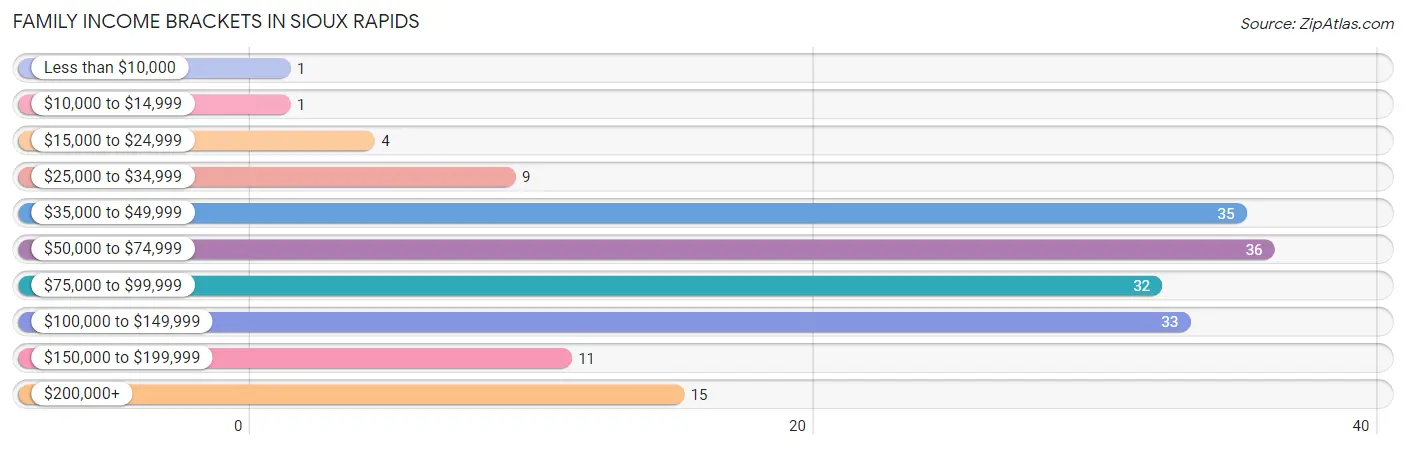
| Income Bracket | # Families | % Families |
| Less than $10,000 | 1 | 0.6% |
| $10,000 to $14,999 | 1 | 0.6% |
| $15,000 to $24,999 | 4 | 2.3% |
| $25,000 to $34,999 | 9 | 5.1% |
| $35,000 to $49,999 | 35 | 19.8% |
| $50,000 to $74,999 | 36 | 20.3% |
| $75,000 to $99,999 | 32 | 18.1% |
| $100,000 to $149,999 | 33 | 18.6% |
| $150,000 to $199,999 | 11 | 6.2% |
| $200,000+ | 15 | 8.5% |
Family Income by Famaliy Size in Sioux Rapids
6-person families (13 | 7.3%) account for the highest median family income in Sioux Rapids with $200,694 per family, while 3-person families (18 | 10.2%) have the highest median income of $47,917 per family member.
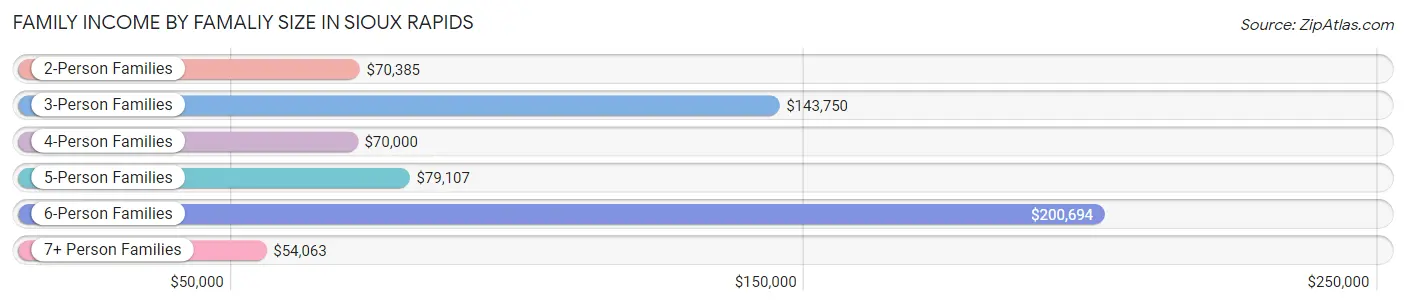
| Income Bracket | # Families | Median Income |
| 2-Person Families | 104 (58.8%) | $70,385 |
| 3-Person Families | 18 (10.2%) | $143,750 |
| 4-Person Families | 18 (10.2%) | $70,000 |
| 5-Person Families | 17 (9.6%) | $79,107 |
| 6-Person Families | 13 (7.3%) | $200,694 |
| 7+ Person Families | 7 (4.0%) | $54,063 |
| Total | 177 (100.0%) | $78,194 |
Family Income by Number of Earners in Sioux Rapids
The median family income in Sioux Rapids is $78,194, with families comprising 3+ earners (30) having the highest median family income of $176,250, while families with no earners (40) have the lowest median family income of $41,429, accounting for 17.0% and 22.6% of families, respectively.
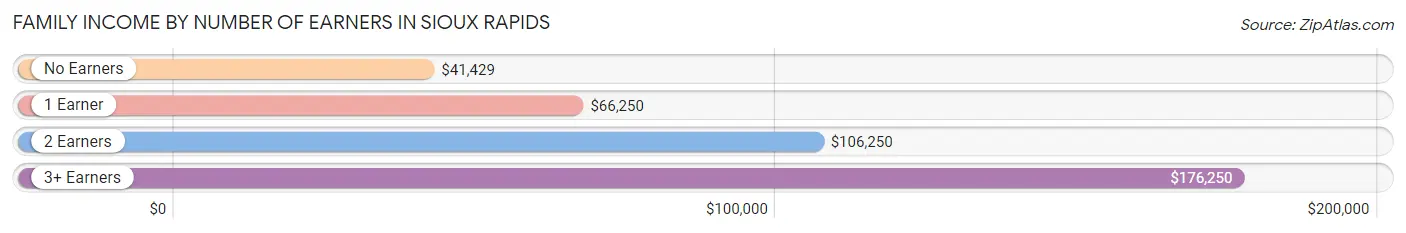
| Number of Earners | # Families | Median Income |
| No Earners | 40 (22.6%) | $41,429 |
| 1 Earner | 39 (22.0%) | $66,250 |
| 2 Earners | 68 (38.4%) | $106,250 |
| 3+ Earners | 30 (17.0%) | $176,250 |
| Total | 177 (100.0%) | $78,194 |
Household Income in Sioux Rapids
Household Income Brackets in Sioux Rapids
With 58 households falling in the category, the $50,000 to $74,999 income range is the most frequent in Sioux Rapids, accounting for 18.2% of all households. In contrast, only 5 households (1.6%) fall into the less than $10,000 income bracket, making it the least populous group.
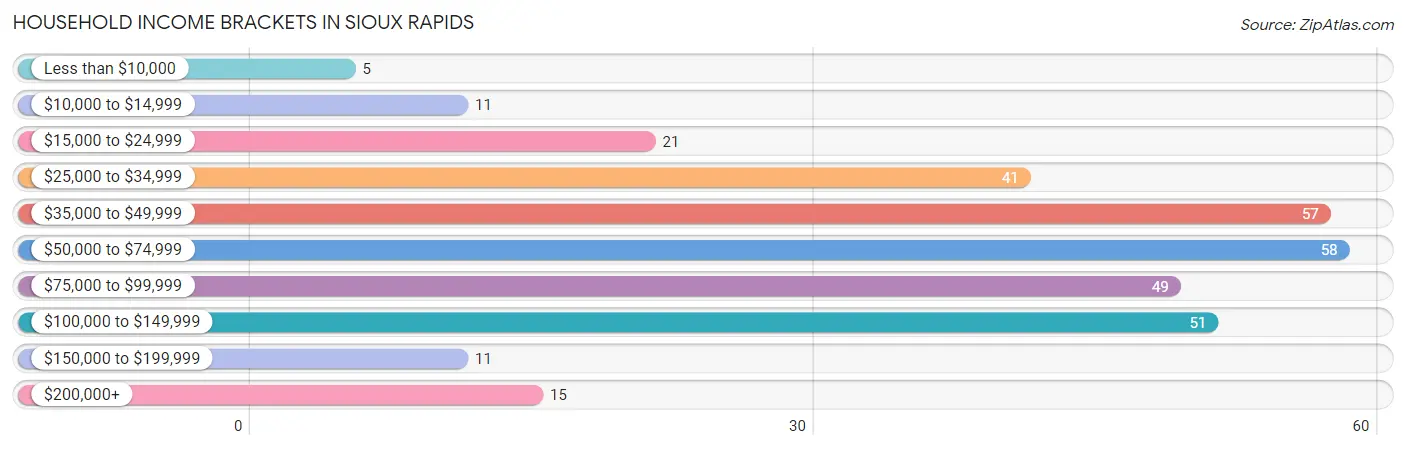
| Income Bracket | # Households | % Households |
| Less than $10,000 | 5 | 1.6% |
| $10,000 to $14,999 | 11 | 3.4% |
| $15,000 to $24,999 | 21 | 6.6% |
| $25,000 to $34,999 | 41 | 12.9% |
| $35,000 to $49,999 | 57 | 17.9% |
| $50,000 to $74,999 | 58 | 18.2% |
| $75,000 to $99,999 | 49 | 15.4% |
| $100,000 to $149,999 | 51 | 16.0% |
| $150,000 to $199,999 | 11 | 3.4% |
| $200,000+ | 15 | 4.7% |
Household Income by Householder Age in Sioux Rapids
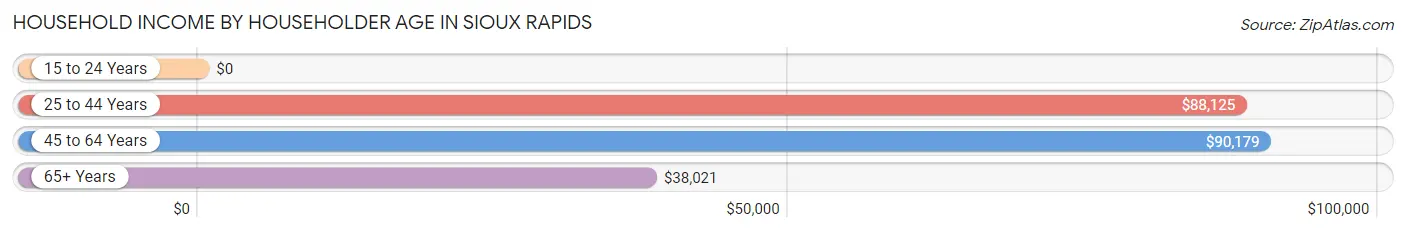
The median household income in Sioux Rapids is $54,904, with the highest median household income of $90,179 found in the 45 to 64 years age bracket for the primary householder. A total of 107 households (33.5%) fall into this category. Meanwhile, the 15 to 24 years age bracket for the primary householder has the lowest median household income of $0, with 26 households (8.2%) in this group.
| Income Bracket | # Households | Median Income |
| 15 to 24 Years | 26 (8.2%) | $0 |
| 25 to 44 Years | 57 (17.9%) | $88,125 |
| 45 to 64 Years | 107 (33.5%) | $90,179 |
| 65+ Years | 129 (40.4%) | $38,021 |
| Total | 319 (100.0%) | $54,904 |
Poverty in Sioux Rapids
Income Below Poverty by Sex and Age in Sioux Rapids
With 3.4% poverty level for males and 9.3% for females among the residents of Sioux Rapids, under 5 year old males and 75 year old and over females are the most vulnerable to poverty, with 2 males (16.7%) and 13 females (61.9%) in their respective age groups living below the poverty level.
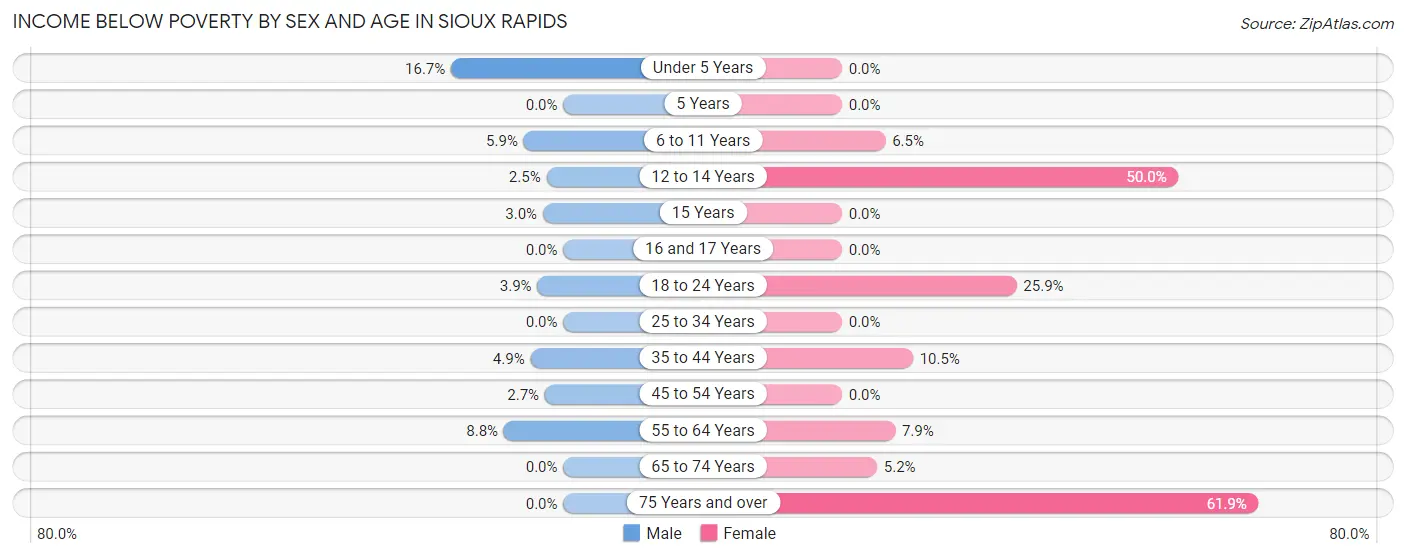
| Age Bracket | Male | Female |
| Under 5 Years | 2 (16.7%) | 0 (0.0%) |
| 5 Years | 0 (0.0%) | 0 (0.0%) |
| 6 to 11 Years | 2 (5.9%) | 2 (6.5%) |
| 12 to 14 Years | 1 (2.5%) | 2 (50.0%) |
| 15 Years | 1 (3.0%) | 0 (0.0%) |
| 16 and 17 Years | 0 (0.0%) | 0 (0.0%) |
| 18 to 24 Years | 1 (3.8%) | 7 (25.9%) |
| 25 to 34 Years | 0 (0.0%) | 0 (0.0%) |
| 35 to 44 Years | 2 (4.9%) | 4 (10.5%) |
| 45 to 54 Years | 2 (2.7%) | 0 (0.0%) |
| 55 to 64 Years | 3 (8.8%) | 3 (7.9%) |
| 65 to 74 Years | 0 (0.0%) | 5 (5.2%) |
| 75 Years and over | 0 (0.0%) | 13 (61.9%) |
| Total | 14 (3.4%) | 36 (9.3%) |
Income Above Poverty by Sex and Age in Sioux Rapids
According to the poverty statistics in Sioux Rapids, males aged 5 years and females aged under 5 years are the age groups that are most secure financially, with 100.0% of males and 100.0% of females in these age groups living above the poverty line.
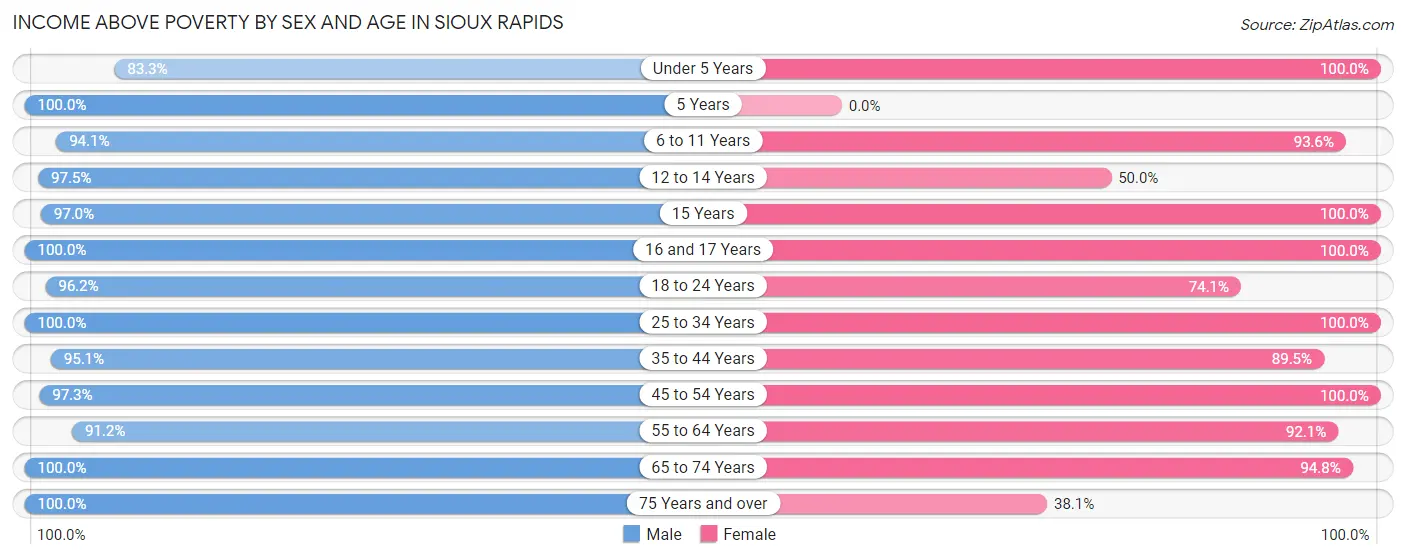
| Age Bracket | Male | Female |
| Under 5 Years | 10 (83.3%) | 9 (100.0%) |
| 5 Years | 6 (100.0%) | 0 (0.0%) |
| 6 to 11 Years | 32 (94.1%) | 29 (93.5%) |
| 12 to 14 Years | 39 (97.5%) | 2 (50.0%) |
| 15 Years | 32 (97.0%) | 11 (100.0%) |
| 16 and 17 Years | 14 (100.0%) | 34 (100.0%) |
| 18 to 24 Years | 25 (96.2%) | 20 (74.1%) |
| 25 to 34 Years | 12 (100.0%) | 29 (100.0%) |
| 35 to 44 Years | 39 (95.1%) | 34 (89.5%) |
| 45 to 54 Years | 71 (97.3%) | 47 (100.0%) |
| 55 to 64 Years | 31 (91.2%) | 35 (92.1%) |
| 65 to 74 Years | 28 (100.0%) | 91 (94.8%) |
| 75 Years and over | 57 (100.0%) | 8 (38.1%) |
| Total | 396 (96.6%) | 349 (90.6%) |
Income Below Poverty Among Married-Couple Families in Sioux Rapids
The poverty statistics for married-couple families in Sioux Rapids show that 1.9% or 3 of the total 158 families live below the poverty line. Families with 3 or 4 children have the highest poverty rate of 5.9%, comprising of 1 families. On the other hand, families with 1 or 2 children have the lowest poverty rate of 0.0%, which includes 0 families.
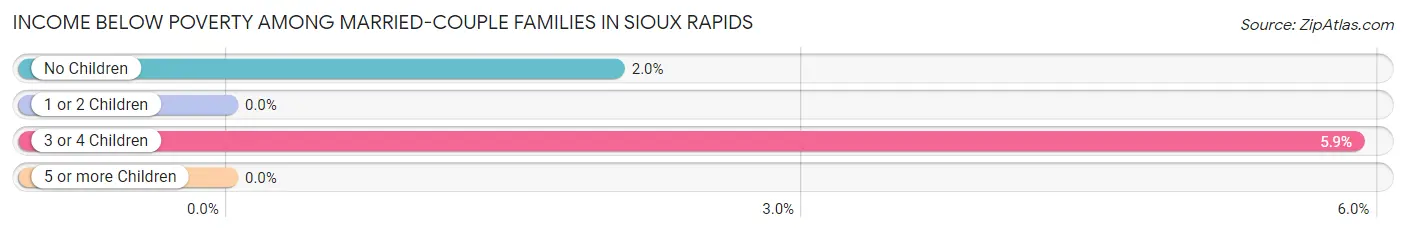
| Children | Above Poverty | Below Poverty |
| No Children | 97 (98.0%) | 2 (2.0%) |
| 1 or 2 Children | 36 (100.0%) | 0 (0.0%) |
| 3 or 4 Children | 16 (94.1%) | 1 (5.9%) |
| 5 or more Children | 6 (100.0%) | 0 (0.0%) |
| Total | 155 (98.1%) | 3 (1.9%) |
Income Below Poverty Among Single-Parent Households in Sioux Rapids
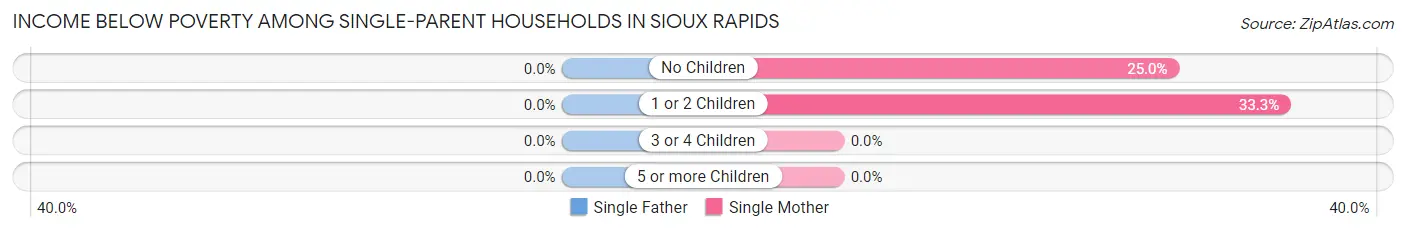
| Children | Single Father | Single Mother |
| No Children | 0 (0.0%) | 1 (25.0%) |
| 1 or 2 Children | 0 (0.0%) | 2 (33.3%) |
| 3 or 4 Children | 0 (0.0%) | 0 (0.0%) |
| 5 or more Children | 0 (0.0%) | 0 (0.0%) |
| Total | 0 (0.0%) | 3 (25.0%) |
Income Below Poverty Among Married-Couple vs Single-Parent Households in Sioux Rapids
The poverty data for Sioux Rapids shows that 3 of the married-couple family households (1.9%) and 3 of the single-parent households (15.8%) are living below the poverty level. Within the married-couple family households, those with 3 or 4 children have the highest poverty rate, with 1 households (5.9%) falling below the poverty line. Among the single-parent households, those with 1 or 2 children have the highest poverty rate, with 2 household (33.3%) living below poverty.
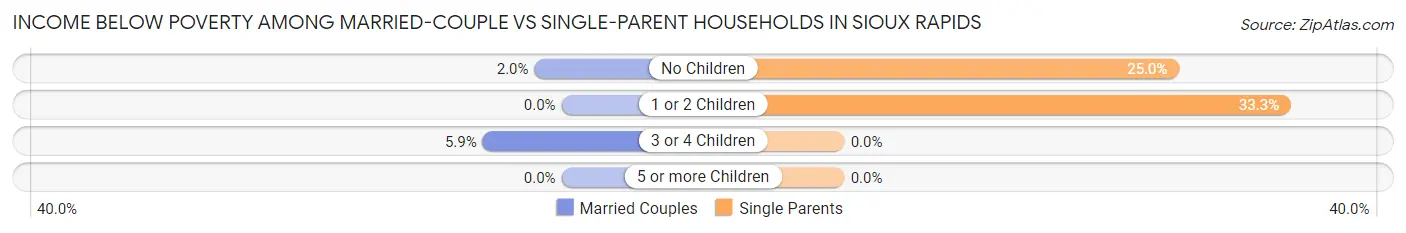
| Children | Married-Couple Families | Single-Parent Households |
| No Children | 2 (2.0%) | 1 (25.0%) |
| 1 or 2 Children | 0 (0.0%) | 2 (33.3%) |
| 3 or 4 Children | 1 (5.9%) | 0 (0.0%) |
| 5 or more Children | 0 (0.0%) | 0 (0.0%) |
| Total | 3 (1.9%) | 3 (15.8%) |
Race in Sioux Rapids
The most populous races in Sioux Rapids are White / Caucasian (685 | 84.4%), Hispanic or Latino (115 | 14.2%), and Some other Race (69 | 8.5%).
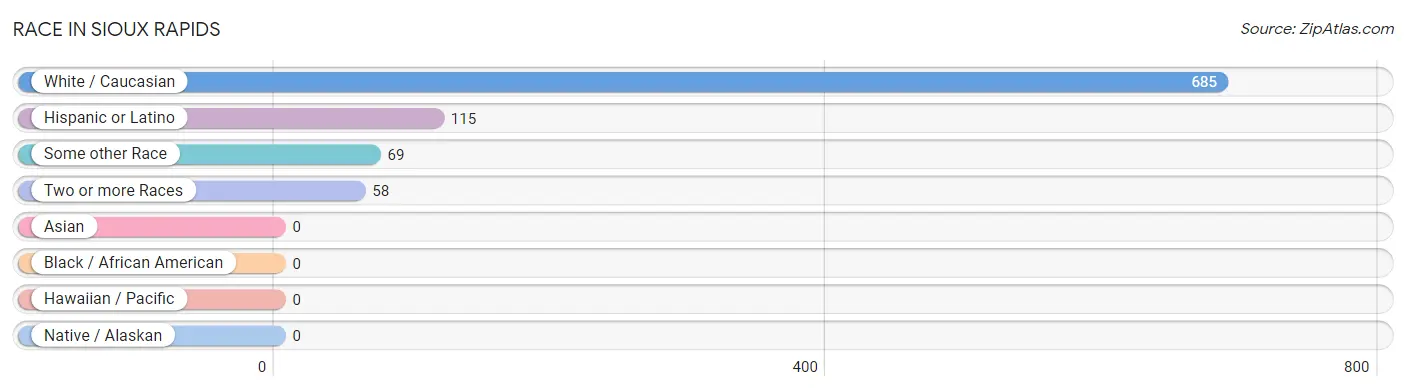
| Race | # Population | % Population |
| Asian | 0 | 0.0% |
| Black / African American | 0 | 0.0% |
| Hawaiian / Pacific | 0 | 0.0% |
| Hispanic or Latino | 115 | 14.2% |
| Native / Alaskan | 0 | 0.0% |
| White / Caucasian | 685 | 84.4% |
| Two or more Races | 58 | 7.1% |
| Some other Race | 69 | 8.5% |
| Total | 812 | 100.0% |
Ancestry in Sioux Rapids
The most populous ancestries reported in Sioux Rapids are German (251 | 30.9%), English (122 | 15.0%), Mexican (113 | 13.9%), Swedish (111 | 13.7%), and Irish (80 | 9.9%), together accounting for 83.4% of all Sioux Rapids residents.
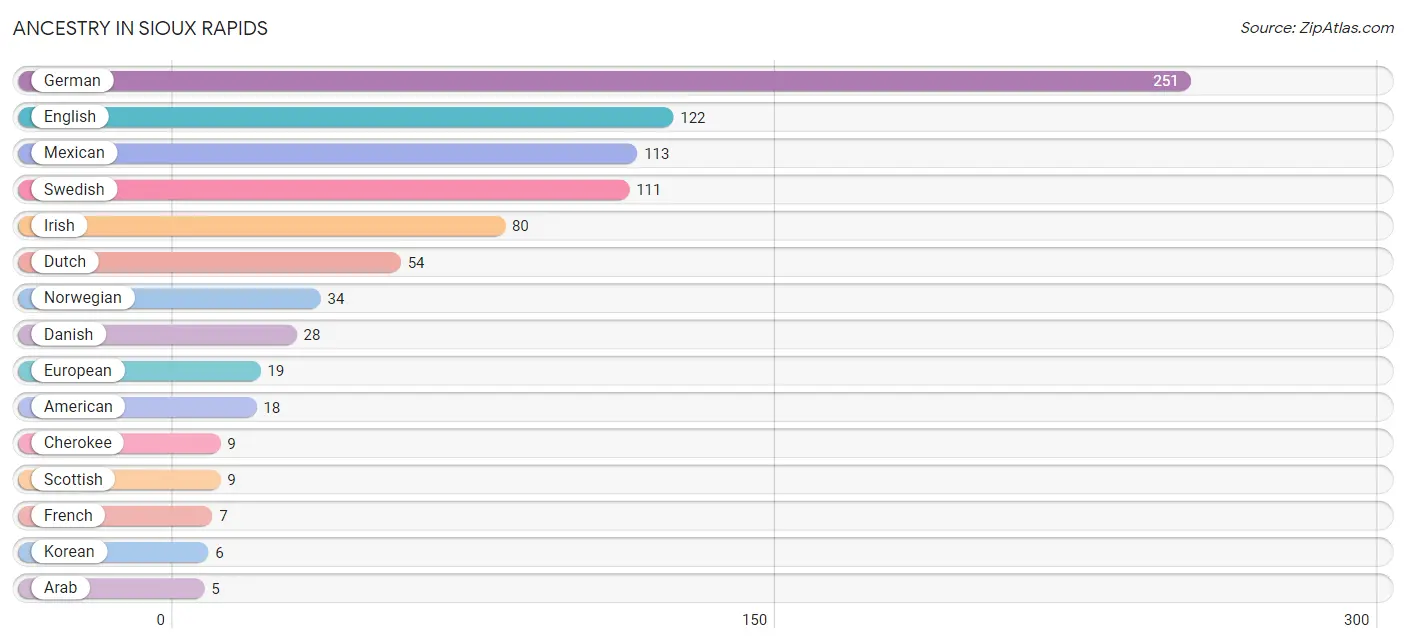
| Ancestry | # Population | % Population |
| American | 18 | 2.2% |
| Arab | 5 | 0.6% |
| Austrian | 2 | 0.3% |
| Belgian | 2 | 0.3% |
| Cherokee | 9 | 1.1% |
| Czech | 2 | 0.3% |
| Danish | 28 | 3.5% |
| Dutch | 54 | 6.7% |
| Eastern European | 1 | 0.1% |
| English | 122 | 15.0% |
| European | 19 | 2.3% |
| French | 7 | 0.9% |
| German | 251 | 30.9% |
| Irish | 80 | 9.9% |
| Italian | 4 | 0.5% |
| Korean | 6 | 0.7% |
| Luxembourger | 5 | 0.6% |
| Mexican | 113 | 13.9% |
| Norwegian | 34 | 4.2% |
| Polish | 3 | 0.4% |
| Puerto Rican | 2 | 0.3% |
| Scottish | 9 | 1.1% |
| Sioux | 1 | 0.1% |
| Slovak | 2 | 0.3% |
| Swedish | 111 | 13.7% |
| Swiss | 4 | 0.5% |
| Syrian | 5 | 0.6% | View All 27 Rows |
Immigrants in Sioux Rapids
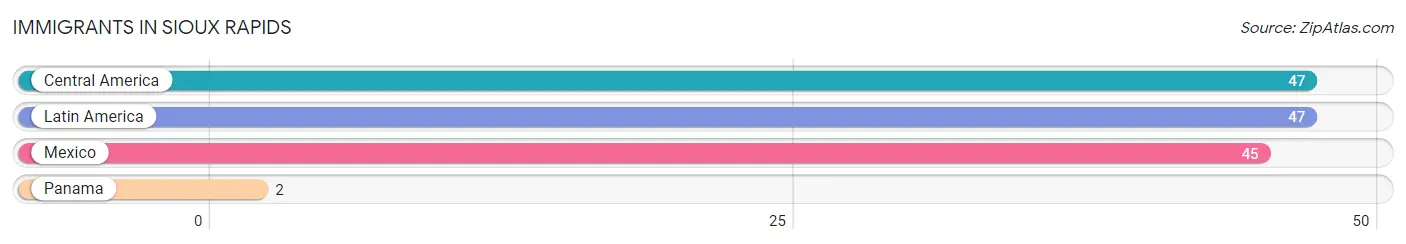
The most numerous immigrant groups reported in Sioux Rapids came from Central America (47 | 5.8%), Latin America (47 | 5.8%), Mexico (45 | 5.5%), and Panama (2 | 0.3%), together accounting for 17.4% of all Sioux Rapids residents.
| Immigration Origin | # Population | % Population |
| Central America | 47 | 5.8% |
| Latin America | 47 | 5.8% |
| Mexico | 45 | 5.5% |
| Panama | 2 | 0.3% | View All 4 Rows |
Sex and Age in Sioux Rapids
Sex and Age in Sioux Rapids
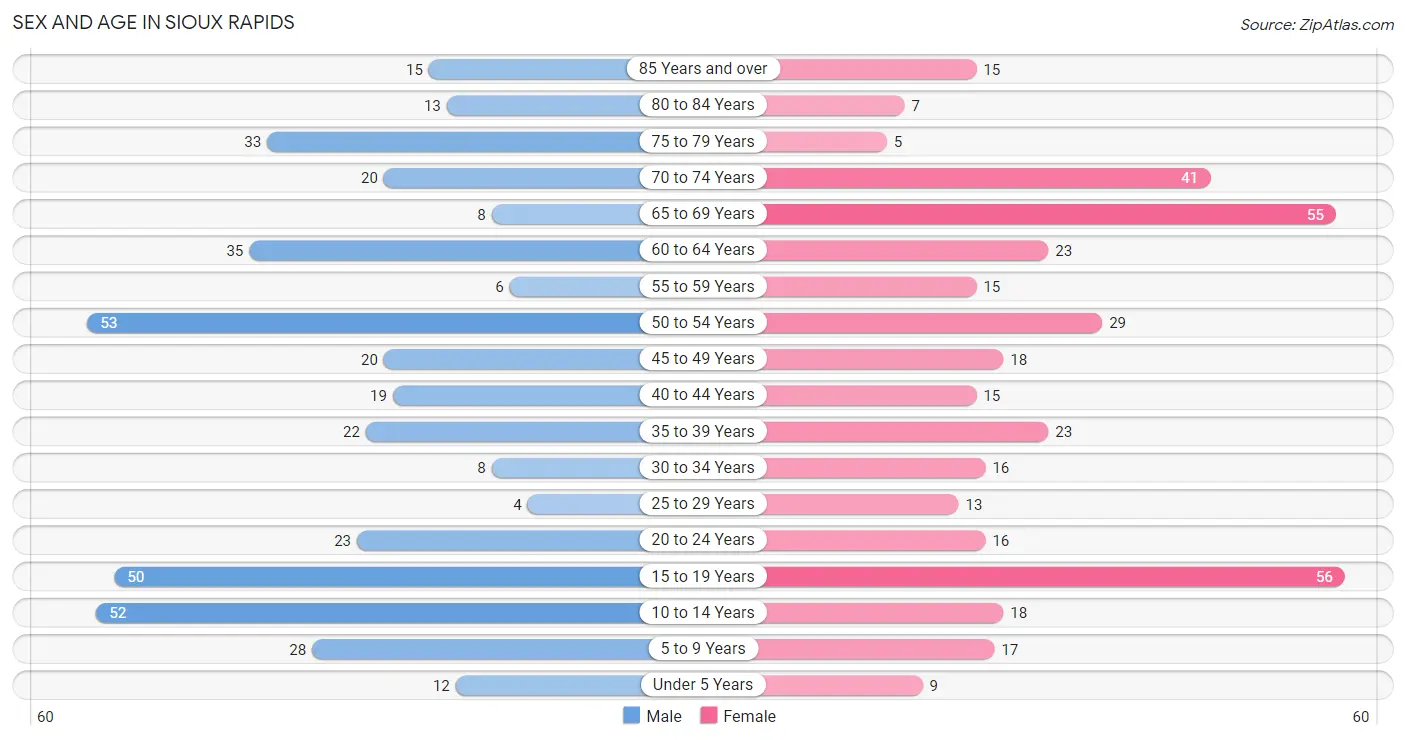
The most populous age groups in Sioux Rapids are 50 to 54 Years (53 | 12.6%) for men and 15 to 19 Years (56 | 14.3%) for women.
| Age Bracket | Male | Female |
| Under 5 Years | 12 (2.9%) | 9 (2.3%) |
| 5 to 9 Years | 28 (6.7%) | 17 (4.3%) |
| 10 to 14 Years | 52 (12.3%) | 18 (4.6%) |
| 15 to 19 Years | 50 (11.9%) | 56 (14.3%) |
| 20 to 24 Years | 23 (5.5%) | 16 (4.1%) |
| 25 to 29 Years | 4 (0.9%) | 13 (3.3%) |
| 30 to 34 Years | 8 (1.9%) | 16 (4.1%) |
| 35 to 39 Years | 22 (5.2%) | 23 (5.9%) |
| 40 to 44 Years | 19 (4.5%) | 15 (3.8%) |
| 45 to 49 Years | 20 (4.8%) | 18 (4.6%) |
| 50 to 54 Years | 53 (12.6%) | 29 (7.4%) |
| 55 to 59 Years | 6 (1.4%) | 15 (3.8%) |
| 60 to 64 Years | 35 (8.3%) | 23 (5.9%) |
| 65 to 69 Years | 8 (1.9%) | 55 (14.1%) |
| 70 to 74 Years | 20 (4.8%) | 41 (10.5%) |
| 75 to 79 Years | 33 (7.8%) | 5 (1.3%) |
| 80 to 84 Years | 13 (3.1%) | 7 (1.8%) |
| 85 Years and over | 15 (3.6%) | 15 (3.8%) |
| Total | 421 (100.0%) | 391 (100.0%) |
Families and Households in Sioux Rapids
Median Family Size in Sioux Rapids
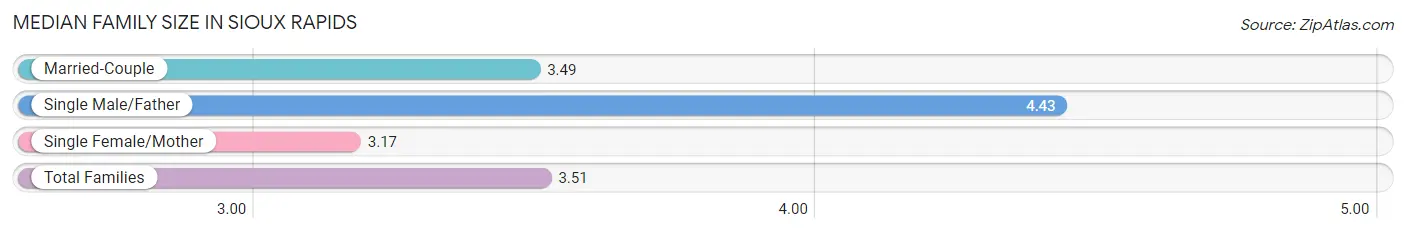
The median family size in Sioux Rapids is 3.51 persons per family, with single male/father families (7 | 4.0%) accounting for the largest median family size of 4.43 persons per family. On the other hand, single female/mother families (12 | 6.8%) represent the smallest median family size with 3.17 persons per family.
| Family Type | # Families | Family Size |
| Married-Couple | 158 (89.3%) | 3.49 |
| Single Male/Father | 7 (4.0%) | 4.43 |
| Single Female/Mother | 12 (6.8%) | 3.17 |
| Total Families | 177 (100.0%) | 3.51 |
Median Household Size in Sioux Rapids
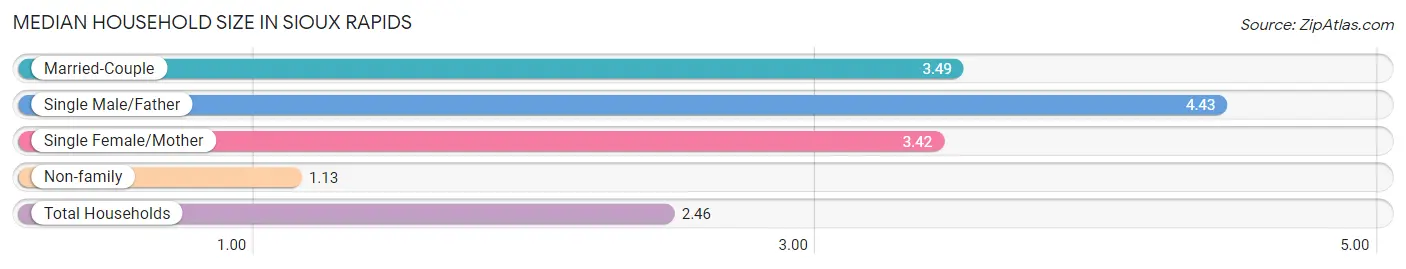
The median household size in Sioux Rapids is 2.46 persons per household, with single male/father households (7 | 2.2%) accounting for the largest median household size of 4.43 persons per household. non-family households (142 | 44.5%) represent the smallest median household size with 1.13 persons per household.
| Household Type | # Households | Household Size |
| Married-Couple | 158 (49.5%) | 3.49 |
| Single Male/Father | 7 (2.2%) | 4.43 |
| Single Female/Mother | 12 (3.8%) | 3.42 |
| Non-family | 142 (44.5%) | 1.13 |
| Total Households | 319 (100.0%) | 2.46 |
Household Size by Marriage Status in Sioux Rapids
Out of a total of 319 households in Sioux Rapids, 177 (55.5%) are family households, while 142 (44.5%) are nonfamily households. The most numerous type of family households are 2-person households, comprising 102, and the most common type of nonfamily households are 1-person households, comprising 123.
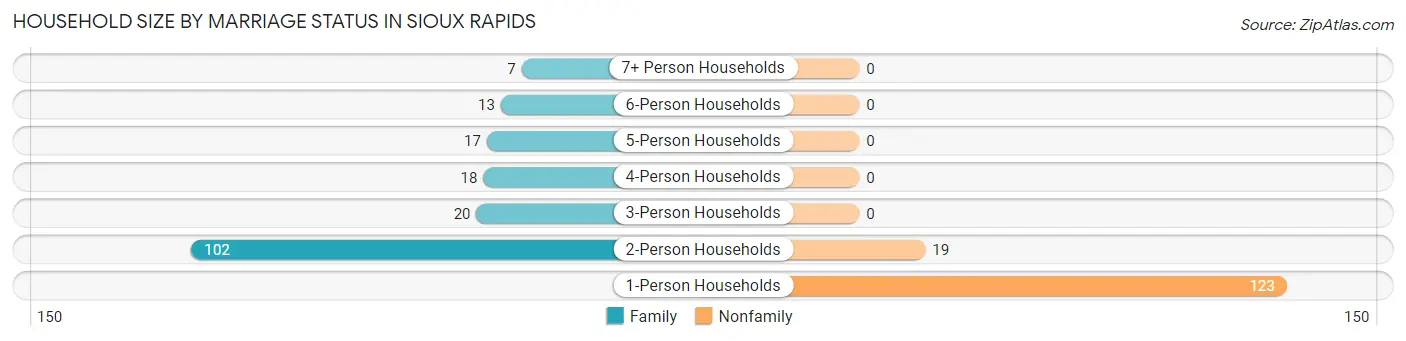
| Household Size | Family Households | Nonfamily Households |
| 1-Person Households | - | 123 (38.6%) |
| 2-Person Households | 102 (32.0%) | 19 (6.0%) |
| 3-Person Households | 20 (6.3%) | 0 (0.0%) |
| 4-Person Households | 18 (5.6%) | 0 (0.0%) |
| 5-Person Households | 17 (5.3%) | 0 (0.0%) |
| 6-Person Households | 13 (4.1%) | 0 (0.0%) |
| 7+ Person Households | 7 (2.2%) | 0 (0.0%) |
| Total | 177 (55.5%) | 142 (44.5%) |
Female Fertility in Sioux Rapids
Fertility by Age in Sioux Rapids
Average fertility rate in Sioux Rapids is 6.0 births per 1,000 women. Women in the age bracket of 35 to 50 years have the highest fertility rate with 16.0 births per 1,000 women. Women in the age bracket of 35 to 50 years acount for 100.0% of all women with births.
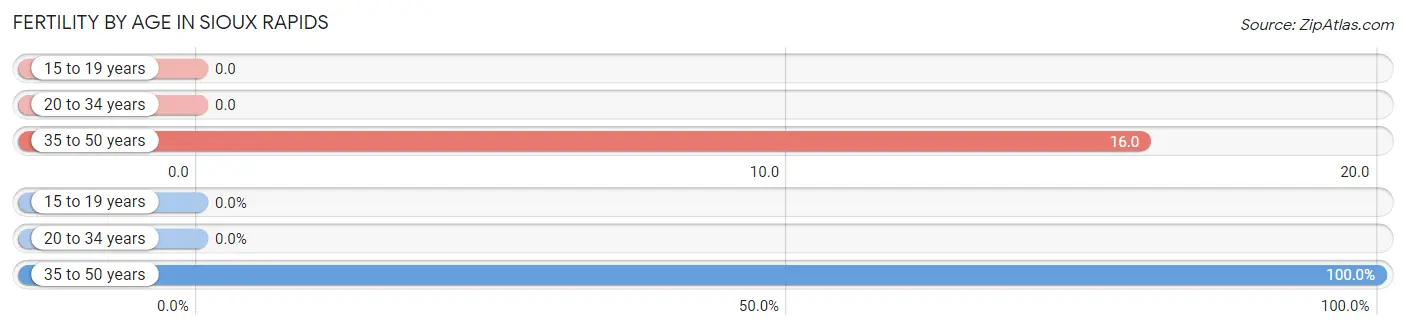
| Age Bracket | Women with Births | Births / 1,000 Women |
| 15 to 19 years | 0 (0.0%) | 0.0 |
| 20 to 34 years | 0 (0.0%) | 0.0 |
| 35 to 50 years | 1 (100.0%) | 16.0 |
| Total | 1 (100.0%) | 6.0 |
Fertility by Age by Marriage Status in Sioux Rapids
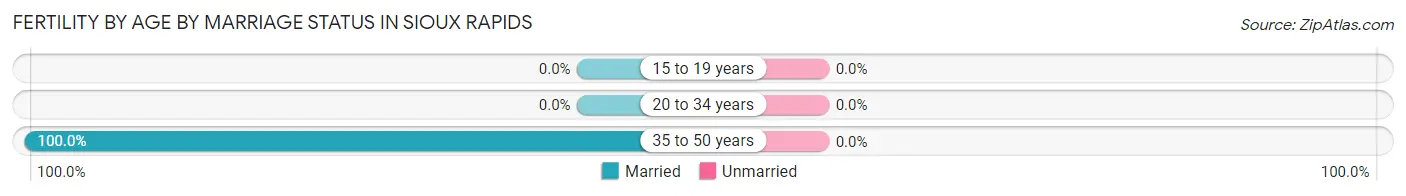
| Age Bracket | Married | Unmarried |
| 15 to 19 years | 0 (0.0%) | 0 (0.0%) |
| 20 to 34 years | 0 (0.0%) | 0 (0.0%) |
| 35 to 50 years | 1 (100.0%) | 0 (0.0%) |
| Total | 1 (100.0%) | 0 (0.0%) |
Fertility by Education in Sioux Rapids
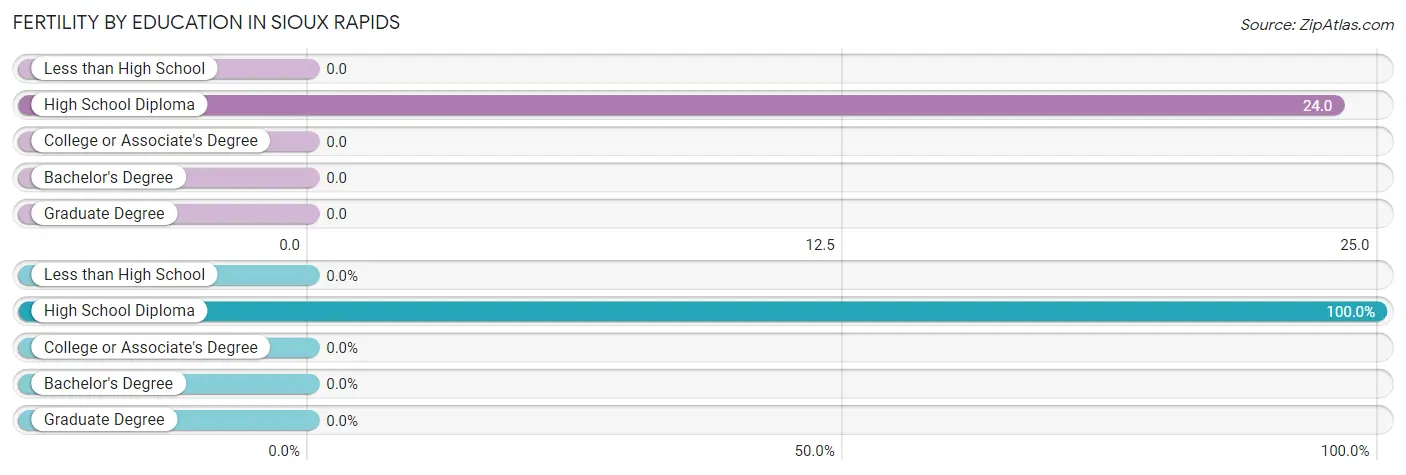
| Educational Attainment | Women with Births | Births / 1,000 Women |
| Less than High School | 0 (0.0%) | 0.0 |
| High School Diploma | 1 (100.0%) | 24.0 |
| College or Associate's Degree | 0 (0.0%) | 0.0 |
| Bachelor's Degree | 0 (0.0%) | 0.0 |
| Graduate Degree | 0 (0.0%) | 0.0 |
| Total | 1 (100.0%) | 6.0 |
Fertility by Education by Marriage Status in Sioux Rapids
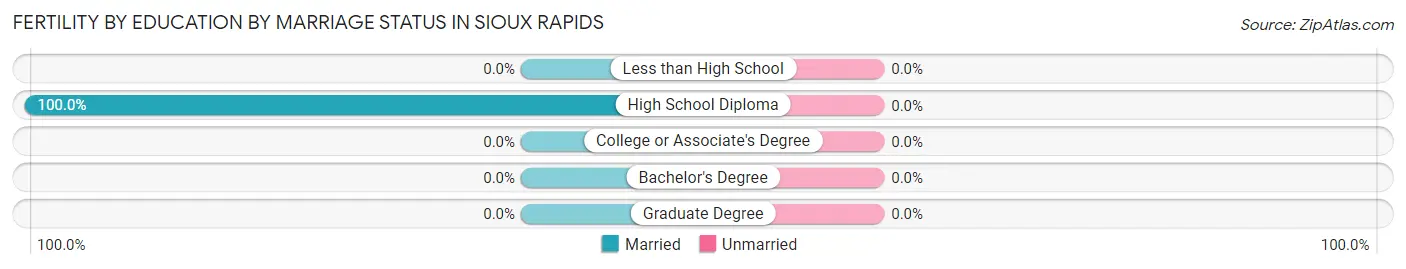
| Educational Attainment | Married | Unmarried |
| Less than High School | 0 (0.0%) | 0 (0.0%) |
| High School Diploma | 1 (100.0%) | 0 (0.0%) |
| College or Associate's Degree | 0 (0.0%) | 0 (0.0%) |
| Bachelor's Degree | 0 (0.0%) | 0 (0.0%) |
| Graduate Degree | 0 (0.0%) | 0 (0.0%) |
| Total | 1 (100.0%) | 0 (0.0%) |
Employment Characteristics in Sioux Rapids
Employment by Class of Employer in Sioux Rapids
Among the 391 employed individuals in Sioux Rapids, private company employees (272 | 69.6%), not-for-profit organizations (35 | 8.9%), and self-employed (not incorporated) (26 | 6.7%) make up the most common classes of employment.
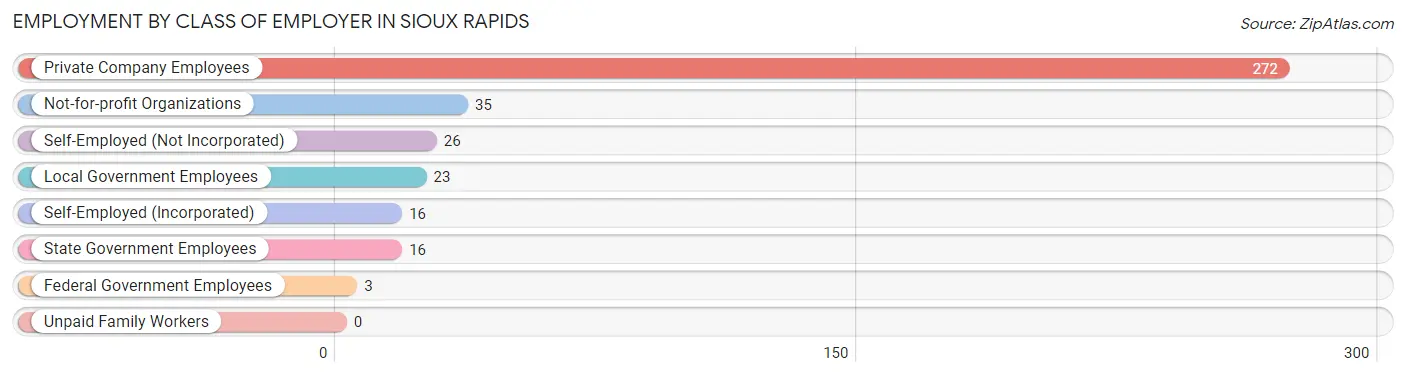
| Employer Class | # Employees | % Employees |
| Private Company Employees | 272 | 69.6% |
| Self-Employed (Incorporated) | 16 | 4.1% |
| Self-Employed (Not Incorporated) | 26 | 6.7% |
| Not-for-profit Organizations | 35 | 8.9% |
| Local Government Employees | 23 | 5.9% |
| State Government Employees | 16 | 4.1% |
| Federal Government Employees | 3 | 0.8% |
| Unpaid Family Workers | 0 | 0.0% |
| Total | 391 | 100.0% |
Employment Status by Age in Sioux Rapids
According to the labor force statistics for Sioux Rapids, out of the total population over 16 years of age (632), 63.3% or 400 individuals are in the labor force, with 2.0% or 8 of them unemployed. The age group with the highest labor force participation rate is 25 to 29 years, with 100.0% or 17 individuals in the labor force. Within the labor force, the 16 to 19 years age range has the highest percentage of unemployed individuals, with 16.7% or 7 of them being unemployed.
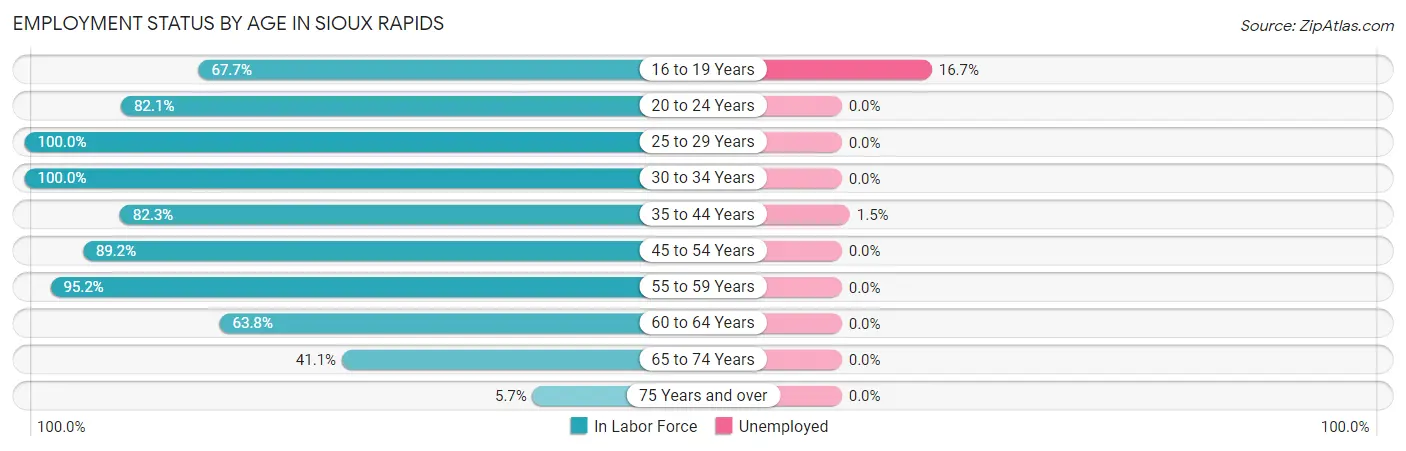
| Age Bracket | In Labor Force | Unemployed |
| 16 to 19 Years | 42 (67.7%) | 7 (16.7%) |
| 20 to 24 Years | 32 (82.1%) | 0 (0.0%) |
| 25 to 29 Years | 17 (100.0%) | 0 (0.0%) |
| 30 to 34 Years | 24 (100.0%) | 0 (0.0%) |
| 35 to 44 Years | 65 (82.3%) | 1 (1.5%) |
| 45 to 54 Years | 107 (89.2%) | 0 (0.0%) |
| 55 to 59 Years | 20 (95.2%) | 0 (0.0%) |
| 60 to 64 Years | 37 (63.8%) | 0 (0.0%) |
| 65 to 74 Years | 51 (41.1%) | 0 (0.0%) |
| 75 Years and over | 5 (5.7%) | 0 (0.0%) |
| Total | 400 (63.3%) | 8 (2.0%) |
Employment Status by Educational Attainment in Sioux Rapids
According to labor force statistics for Sioux Rapids, 84.6% of individuals (270) out of the total population between 25 and 64 years of age (319) are in the labor force, with 0.4% or 1 of them being unemployed. The group with the highest labor force participation rate are those with the educational attainment of bachelor's degree or higher, with 89.7% or 35 individuals in the labor force. Within the labor force, individuals with high school diploma education have the highest percentage of unemployment, with 1.2% or 1 of them being unemployed.
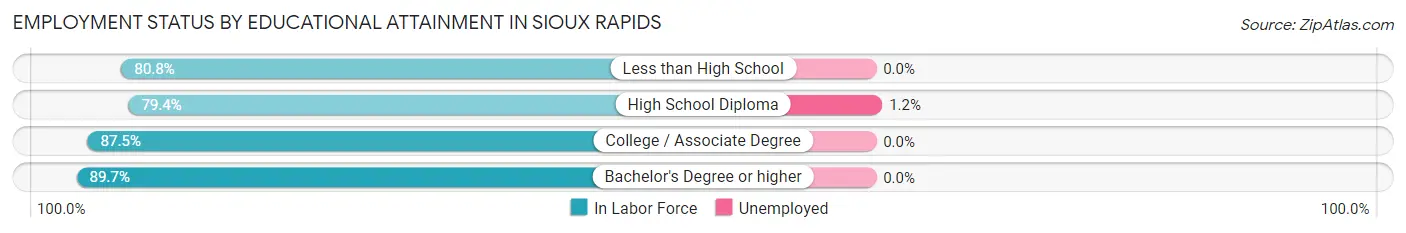
| Educational Attainment | In Labor Force | Unemployed |
| Less than High School | 21 (80.8%) | 0 (0.0%) |
| High School Diploma | 81 (79.4%) | 1 (1.2%) |
| College / Associate Degree | 133 (87.5%) | 0 (0.0%) |
| Bachelor's Degree or higher | 35 (89.7%) | 0 (0.0%) |
| Total | 270 (84.6%) | 1 (0.4%) |
Employment Occupations by Sex in Sioux Rapids
Management, Business, Science and Arts Occupations
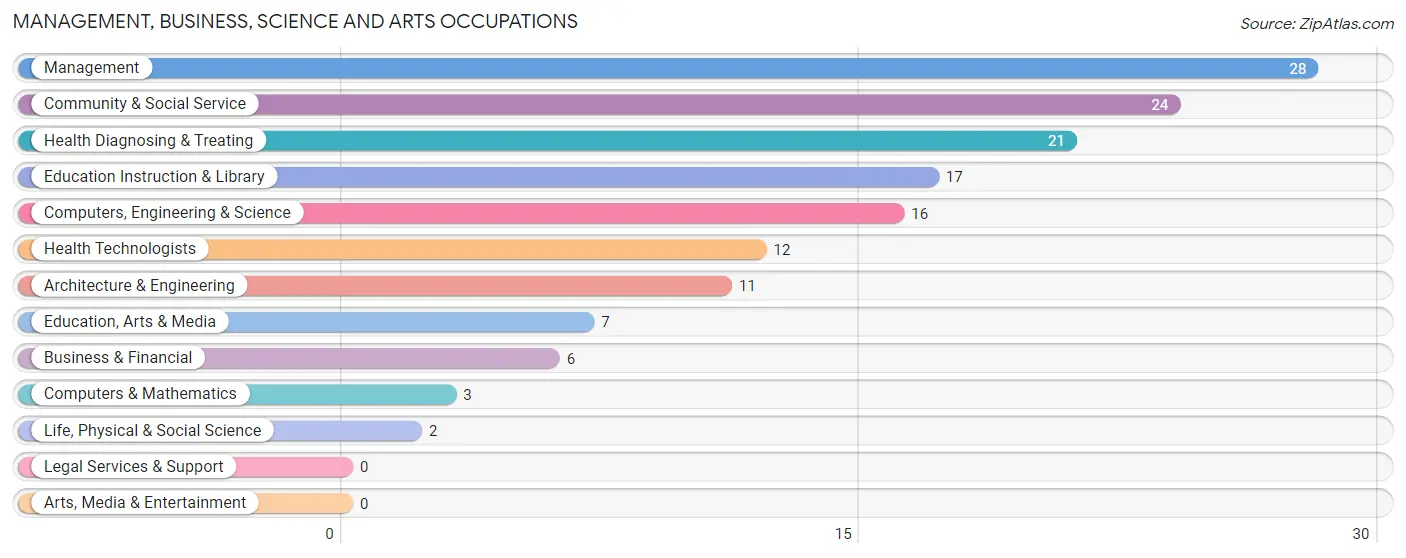
The most common Management, Business, Science and Arts occupations in Sioux Rapids are Management (28 | 7.1%), Community & Social Service (24 | 6.1%), Health Diagnosing & Treating (21 | 5.4%), Education Instruction & Library (17 | 4.3%), and Computers, Engineering & Science (16 | 4.1%).
Management, Business, Science and Arts Occupations by Sex
Within the Management, Business, Science and Arts occupations in Sioux Rapids, the most male-oriented occupations are Computers & Mathematics (100.0%), Life, Physical & Social Science (100.0%), and Computers, Engineering & Science (56.2%), while the most female-oriented occupations are Education, Arts & Media (100.0%), Health Diagnosing & Treating (100.0%), and Health Technologists (100.0%).
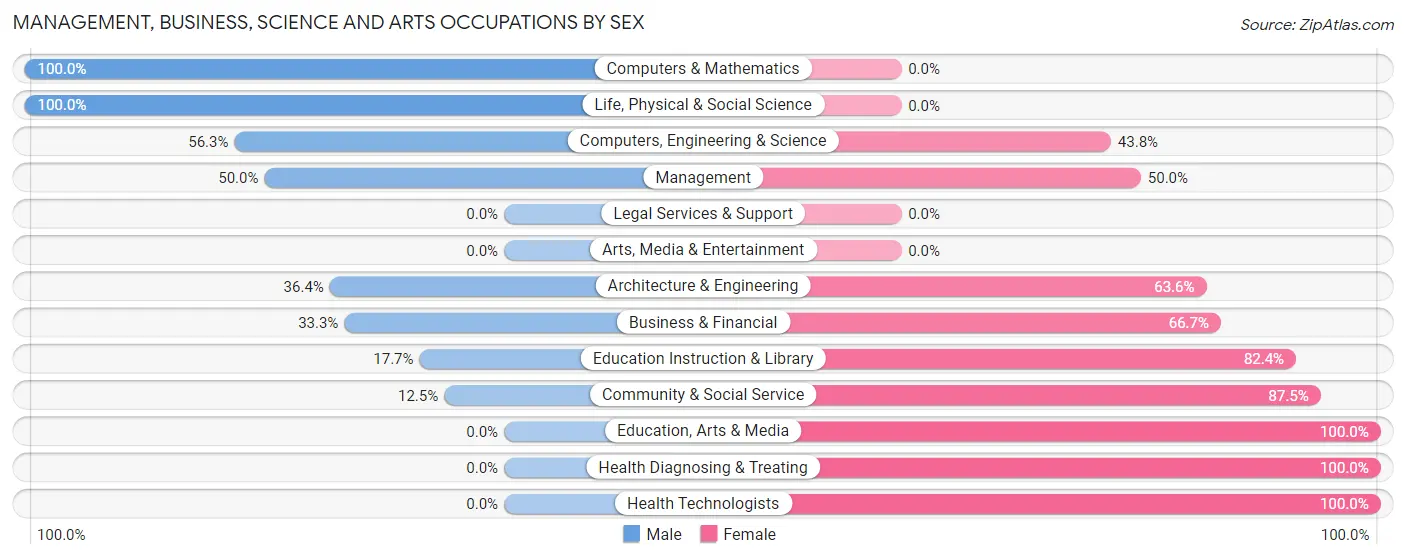
| Occupation | Male | Female |
| Management | 14 (50.0%) | 14 (50.0%) |
| Business & Financial | 2 (33.3%) | 4 (66.7%) |
| Computers, Engineering & Science | 9 (56.2%) | 7 (43.8%) |
| Computers & Mathematics | 3 (100.0%) | 0 (0.0%) |
| Architecture & Engineering | 4 (36.4%) | 7 (63.6%) |
| Life, Physical & Social Science | 2 (100.0%) | 0 (0.0%) |
| Community & Social Service | 3 (12.5%) | 21 (87.5%) |
| Education, Arts & Media | 0 (0.0%) | 7 (100.0%) |
| Legal Services & Support | 0 (0.0%) | 0 (0.0%) |
| Education Instruction & Library | 3 (17.6%) | 14 (82.4%) |
| Arts, Media & Entertainment | 0 (0.0%) | 0 (0.0%) |
| Health Diagnosing & Treating | 0 (0.0%) | 21 (100.0%) |
| Health Technologists | 0 (0.0%) | 12 (100.0%) |
| Total (Category) | 28 (29.5%) | 67 (70.5%) |
| Total (Overall) | 175 (44.6%) | 217 (55.4%) |
Services Occupations
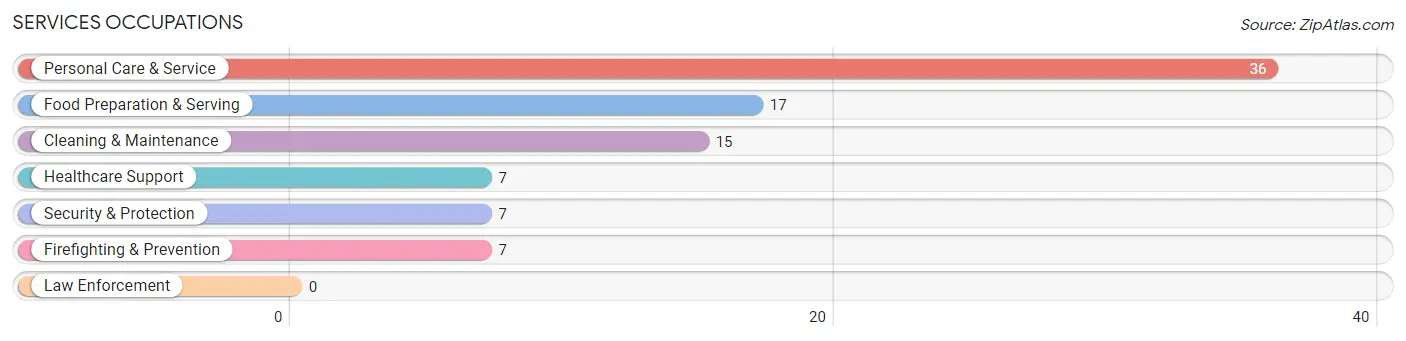
The most common Services occupations in Sioux Rapids are Personal Care & Service (36 | 9.2%), Food Preparation & Serving (17 | 4.3%), Cleaning & Maintenance (15 | 3.8%), Healthcare Support (7 | 1.8%), and Security & Protection (7 | 1.8%).
Services Occupations by Sex
Within the Services occupations in Sioux Rapids, the most male-oriented occupations are Security & Protection (100.0%), Firefighting & Prevention (100.0%), and Cleaning & Maintenance (93.3%), while the most female-oriented occupations are Healthcare Support (100.0%), Food Preparation & Serving (100.0%), and Personal Care & Service (100.0%).
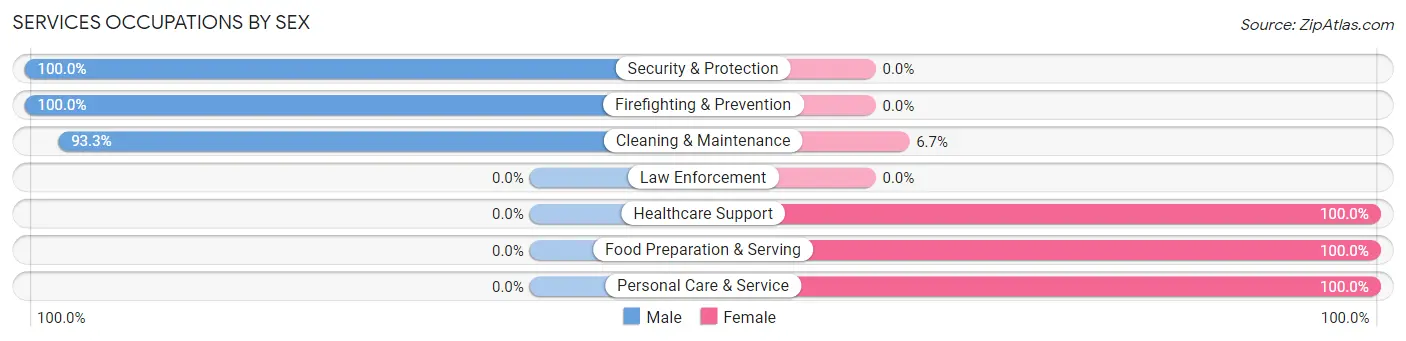
| Occupation | Male | Female |
| Healthcare Support | 0 (0.0%) | 7 (100.0%) |
| Security & Protection | 7 (100.0%) | 0 (0.0%) |
| Firefighting & Prevention | 7 (100.0%) | 0 (0.0%) |
| Law Enforcement | 0 (0.0%) | 0 (0.0%) |
| Food Preparation & Serving | 0 (0.0%) | 17 (100.0%) |
| Cleaning & Maintenance | 14 (93.3%) | 1 (6.7%) |
| Personal Care & Service | 0 (0.0%) | 36 (100.0%) |
| Total (Category) | 21 (25.6%) | 61 (74.4%) |
| Total (Overall) | 175 (44.6%) | 217 (55.4%) |
Sales and Office Occupations
The most common Sales and Office occupations in Sioux Rapids are Sales & Related (50 | 12.8%), and Office & Administration (31 | 7.9%).
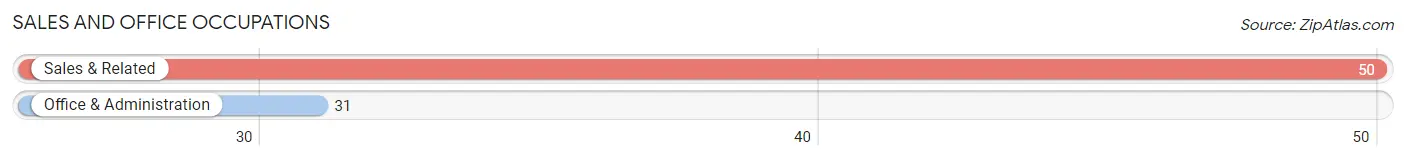
Sales and Office Occupations by Sex
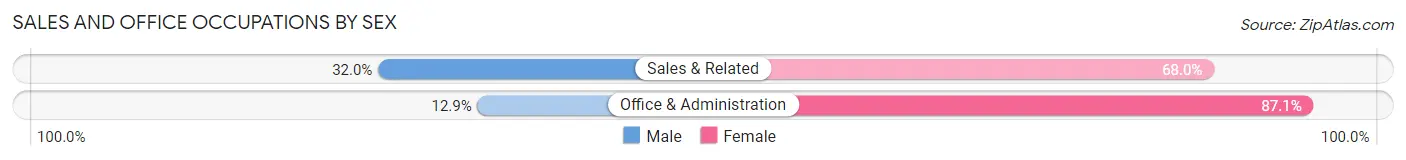
| Occupation | Male | Female |
| Sales & Related | 16 (32.0%) | 34 (68.0%) |
| Office & Administration | 4 (12.9%) | 27 (87.1%) |
| Total (Category) | 20 (24.7%) | 61 (75.3%) |
| Total (Overall) | 175 (44.6%) | 217 (55.4%) |
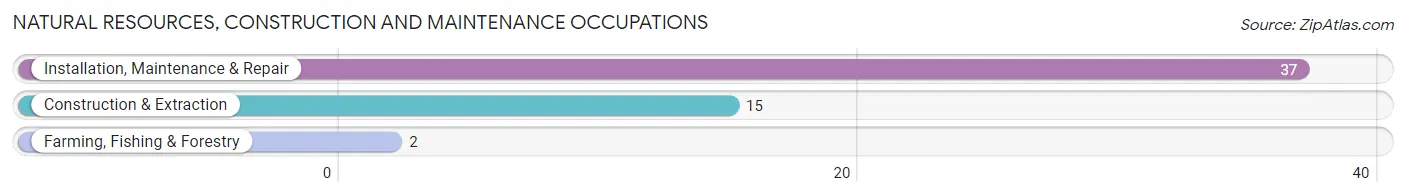
Natural Resources, Construction and Maintenance Occupations
The most common Natural Resources, Construction and Maintenance occupations in Sioux Rapids are Installation, Maintenance & Repair (37 | 9.4%), Construction & Extraction (15 | 3.8%), and Farming, Fishing & Forestry (2 | 0.5%).
Natural Resources, Construction and Maintenance Occupations by Sex
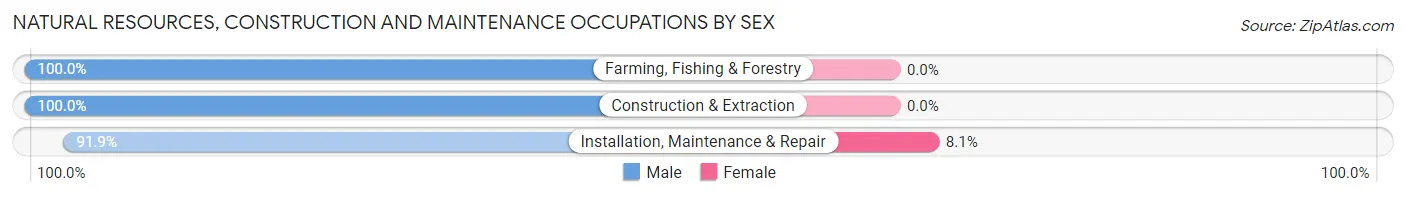
| Occupation | Male | Female |
| Farming, Fishing & Forestry | 2 (100.0%) | 0 (0.0%) |
| Construction & Extraction | 15 (100.0%) | 0 (0.0%) |
| Installation, Maintenance & Repair | 34 (91.9%) | 3 (8.1%) |
| Total (Category) | 51 (94.4%) | 3 (5.6%) |
| Total (Overall) | 175 (44.6%) | 217 (55.4%) |
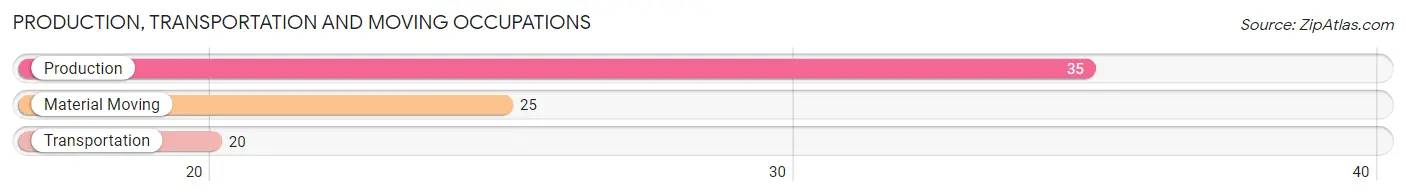
Production, Transportation and Moving Occupations
The most common Production, Transportation and Moving occupations in Sioux Rapids are Production (35 | 8.9%), Material Moving (25 | 6.4%), and Transportation (20 | 5.1%).
Production, Transportation and Moving Occupations by Sex
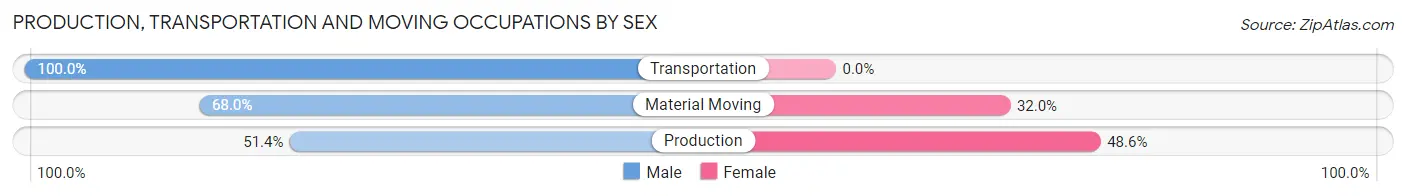
| Occupation | Male | Female |
| Production | 18 (51.4%) | 17 (48.6%) |
| Transportation | 20 (100.0%) | 0 (0.0%) |
| Material Moving | 17 (68.0%) | 8 (32.0%) |
| Total (Category) | 55 (68.8%) | 25 (31.2%) |
| Total (Overall) | 175 (44.6%) | 217 (55.4%) |
Employment Industries by Sex in Sioux Rapids
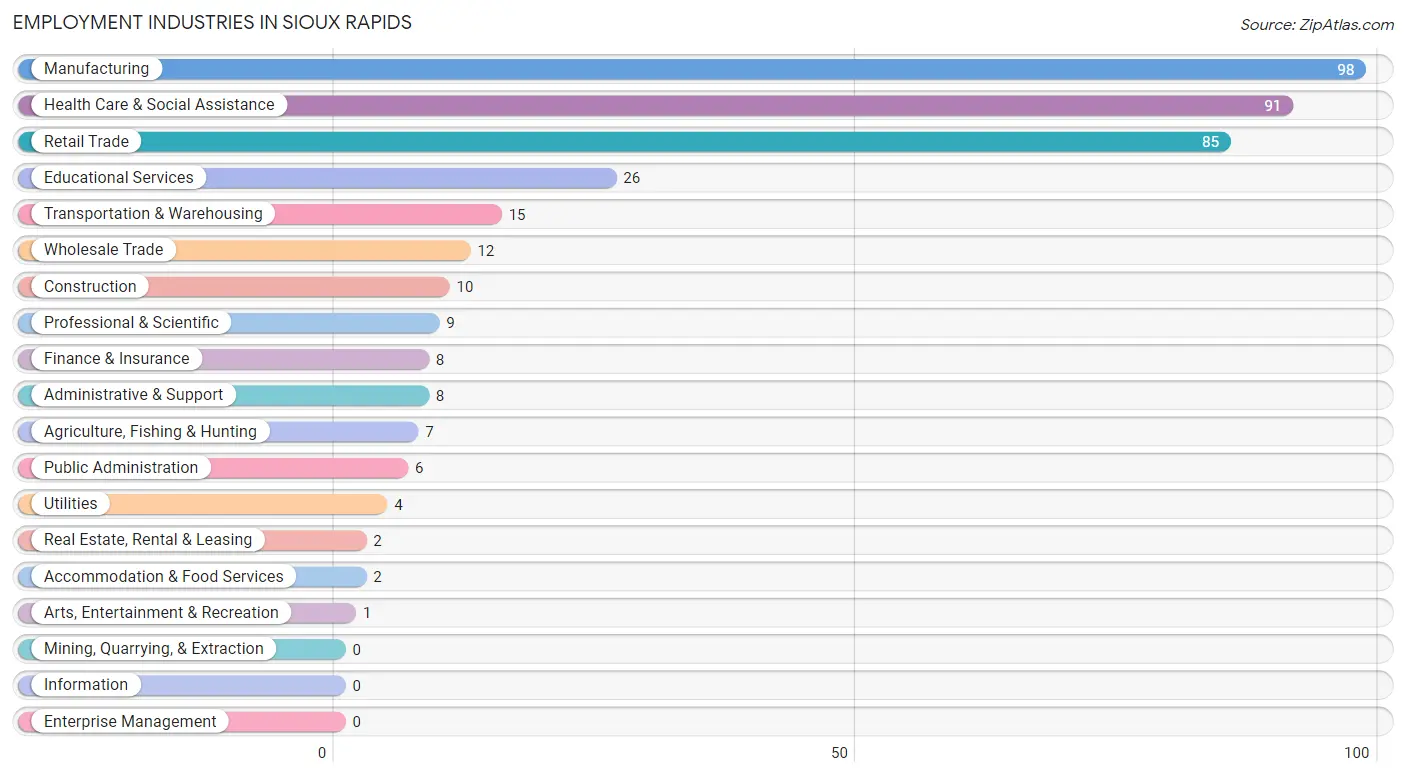
Employment Industries in Sioux Rapids
The major employment industries in Sioux Rapids include Manufacturing (98 | 25.0%), Health Care & Social Assistance (91 | 23.2%), Retail Trade (85 | 21.7%), Educational Services (26 | 6.6%), and Transportation & Warehousing (15 | 3.8%).
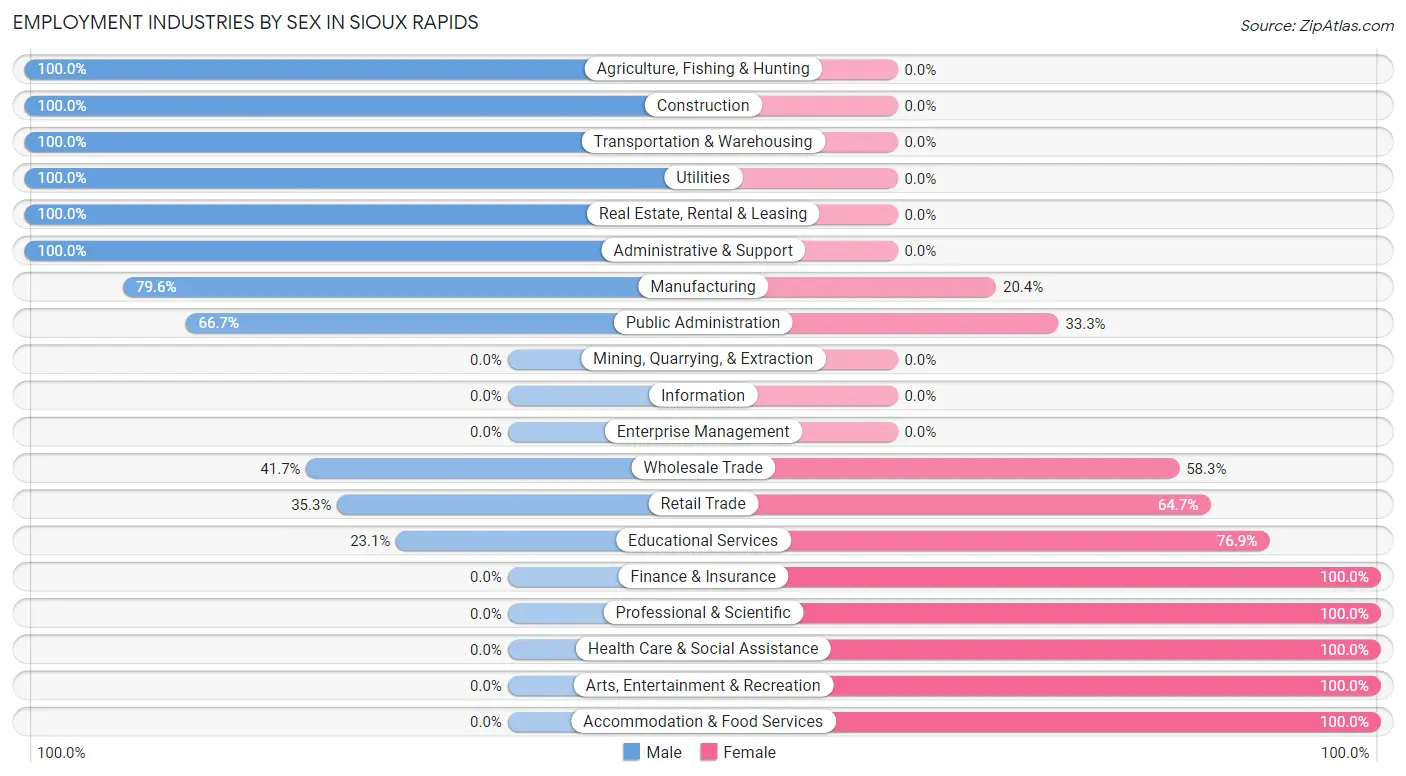
Employment Industries by Sex in Sioux Rapids
The Sioux Rapids industries that see more men than women are Agriculture, Fishing & Hunting (100.0%), Construction (100.0%), and Transportation & Warehousing (100.0%), whereas the industries that tend to have a higher number of women are Finance & Insurance (100.0%), Professional & Scientific (100.0%), and Health Care & Social Assistance (100.0%).
| Industry | Male | Female |
| Agriculture, Fishing & Hunting | 7 (100.0%) | 0 (0.0%) |
| Mining, Quarrying, & Extraction | 0 (0.0%) | 0 (0.0%) |
| Construction | 10 (100.0%) | 0 (0.0%) |
| Manufacturing | 78 (79.6%) | 20 (20.4%) |
| Wholesale Trade | 5 (41.7%) | 7 (58.3%) |
| Retail Trade | 30 (35.3%) | 55 (64.7%) |
| Transportation & Warehousing | 15 (100.0%) | 0 (0.0%) |
| Utilities | 4 (100.0%) | 0 (0.0%) |
| Information | 0 (0.0%) | 0 (0.0%) |
| Finance & Insurance | 0 (0.0%) | 8 (100.0%) |
| Real Estate, Rental & Leasing | 2 (100.0%) | 0 (0.0%) |
| Professional & Scientific | 0 (0.0%) | 9 (100.0%) |
| Enterprise Management | 0 (0.0%) | 0 (0.0%) |
| Administrative & Support | 8 (100.0%) | 0 (0.0%) |
| Educational Services | 6 (23.1%) | 20 (76.9%) |
| Health Care & Social Assistance | 0 (0.0%) | 91 (100.0%) |
| Arts, Entertainment & Recreation | 0 (0.0%) | 1 (100.0%) |
| Accommodation & Food Services | 0 (0.0%) | 2 (100.0%) |
| Public Administration | 4 (66.7%) | 2 (33.3%) |
| Total | 175 (44.6%) | 217 (55.4%) |
Education in Sioux Rapids
School Enrollment in Sioux Rapids
The most common levels of schooling among the 231 students in Sioux Rapids are high school (107 | 46.3%), middle school (52 | 22.5%), and elementary school (34 | 14.7%).
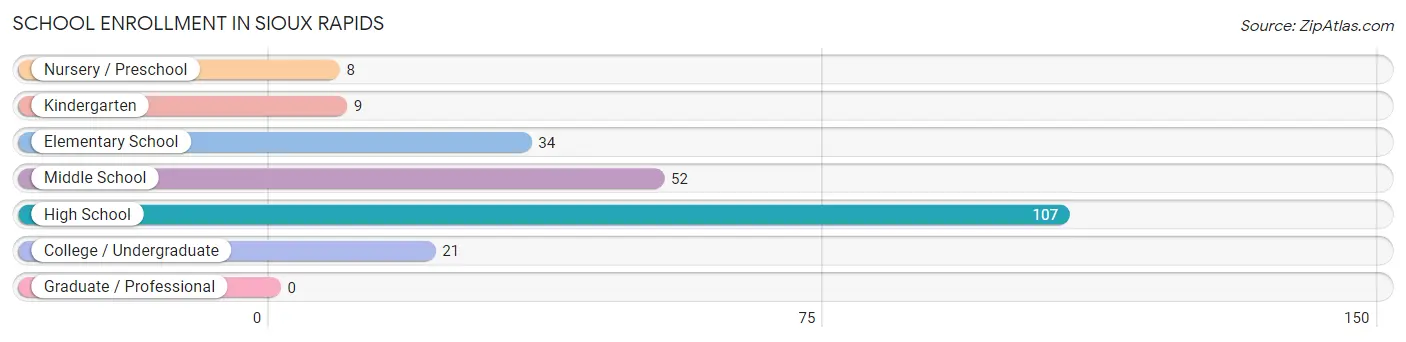
| School Level | # Students | % Students |
| Nursery / Preschool | 8 | 3.5% |
| Kindergarten | 9 | 3.9% |
| Elementary School | 34 | 14.7% |
| Middle School | 52 | 22.5% |
| High School | 107 | 46.3% |
| College / Undergraduate | 21 | 9.1% |
| Graduate / Professional | 0 | 0.0% |
| Total | 231 | 100.0% |
School Enrollment by Age by Funding Source in Sioux Rapids
Out of a total of 231 students who are enrolled in schools in Sioux Rapids, 5 (2.2%) attend a private institution, while the remaining 226 (97.8%) are enrolled in public schools. The age group of 35 years and over has the highest likelihood of being enrolled in private schools, with 5 (55.6% in the age bracket) enrolled. Conversely, the age group of 3 to 4 year olds has the lowest likelihood of being enrolled in a private school, with 2 (100.0% in the age bracket) attending a public institution.
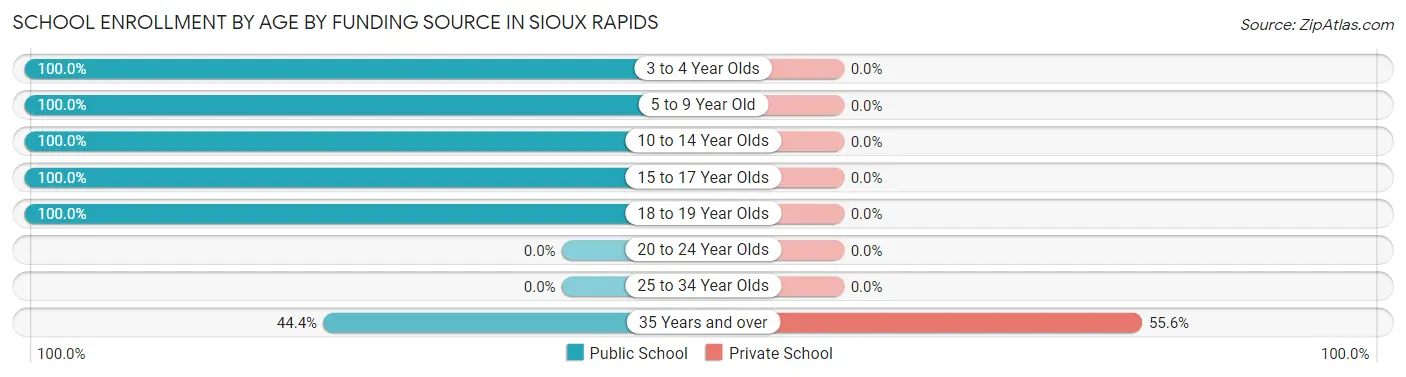
| Age Bracket | Public School | Private School |
| 3 to 4 Year Olds | 2 (100.0%) | 0 (0.0%) |
| 5 to 9 Year Old | 45 (100.0%) | 0 (0.0%) |
| 10 to 14 Year Olds | 70 (100.0%) | 0 (0.0%) |
| 15 to 17 Year Olds | 92 (100.0%) | 0 (0.0%) |
| 18 to 19 Year Olds | 13 (100.0%) | 0 (0.0%) |
| 20 to 24 Year Olds | 0 (0.0%) | 0 (0.0%) |
| 25 to 34 Year Olds | 0 (0.0%) | 0 (0.0%) |
| 35 Years and over | 4 (44.4%) | 5 (55.6%) |
| Total | 226 (97.8%) | 5 (2.2%) |
Educational Attainment by Field of Study in Sioux Rapids
Education (27 | 26.7%), social sciences (23 | 22.8%), psychology (14 | 13.9%), visual & performing arts (11 | 10.9%), and business (9 | 8.9%) are the most common fields of study among 101 individuals in Sioux Rapids who have obtained a bachelor's degree or higher.
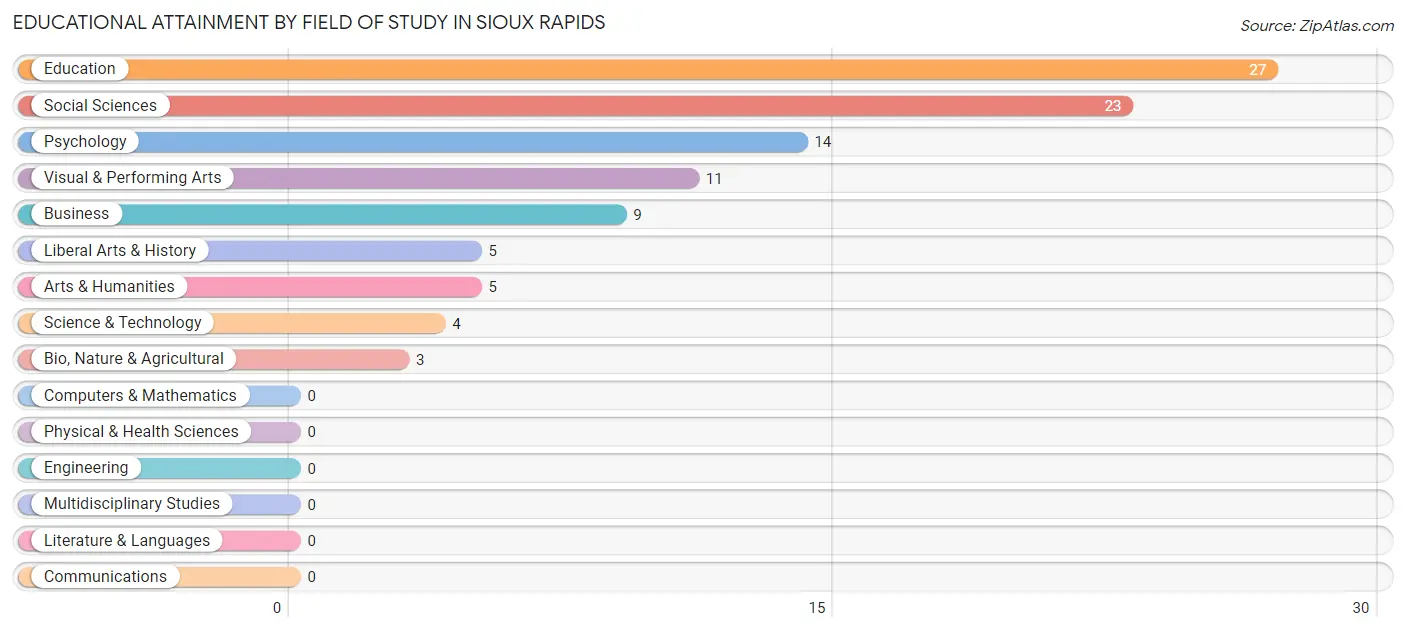
| Field of Study | # Graduates | % Graduates |
| Computers & Mathematics | 0 | 0.0% |
| Bio, Nature & Agricultural | 3 | 3.0% |
| Physical & Health Sciences | 0 | 0.0% |
| Psychology | 14 | 13.9% |
| Social Sciences | 23 | 22.8% |
| Engineering | 0 | 0.0% |
| Multidisciplinary Studies | 0 | 0.0% |
| Science & Technology | 4 | 4.0% |
| Business | 9 | 8.9% |
| Education | 27 | 26.7% |
| Literature & Languages | 0 | 0.0% |
| Liberal Arts & History | 5 | 5.0% |
| Visual & Performing Arts | 11 | 10.9% |
| Communications | 0 | 0.0% |
| Arts & Humanities | 5 | 5.0% |
| Total | 101 | 100.0% |
Transportation & Commute in Sioux Rapids
Vehicle Availability by Sex in Sioux Rapids
The most prevalent vehicle ownership categories in Sioux Rapids are males with 2 vehicles (56, accounting for 32.2%) and females with 2 vehicles (51, making up 25.8%).
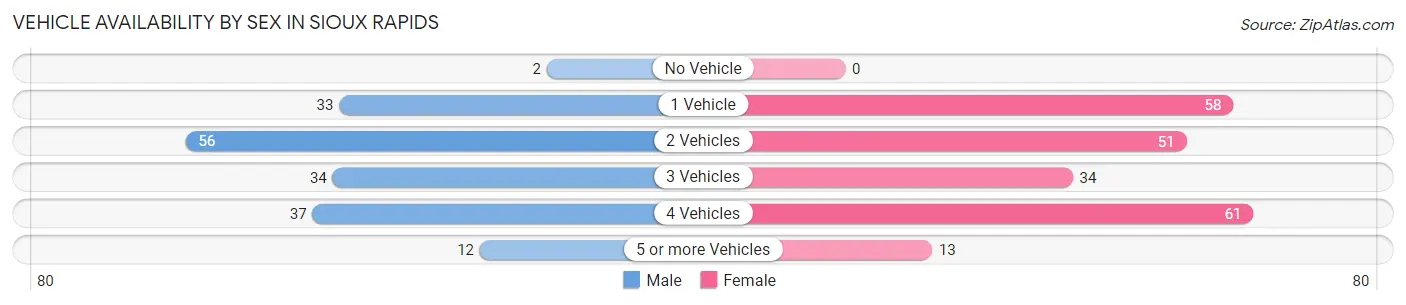
| Vehicles Available | Male | Female |
| No Vehicle | 2 (1.1%) | 0 (0.0%) |
| 1 Vehicle | 33 (19.0%) | 58 (26.7%) |
| 2 Vehicles | 56 (32.2%) | 51 (23.5%) |
| 3 Vehicles | 34 (19.5%) | 34 (15.7%) |
| 4 Vehicles | 37 (21.3%) | 61 (28.1%) |
| 5 or more Vehicles | 12 (6.9%) | 13 (6.0%) |
| Total | 174 (100.0%) | 217 (100.0%) |
Commute Time in Sioux Rapids
The most frequently occuring commute durations in Sioux Rapids are 5 to 9 minutes (92 commuters, 24.9%), 25 to 29 minutes (68 commuters, 18.4%), and 20 to 24 minutes (64 commuters, 17.3%).
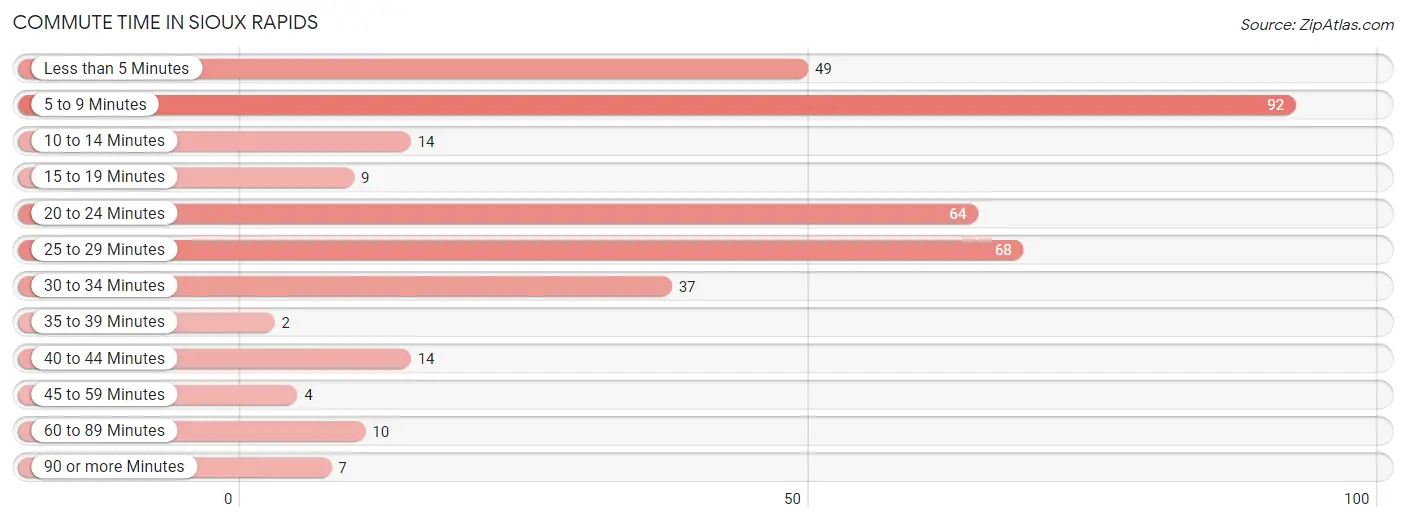
| Commute Time | # Commuters | % Commuters |
| Less than 5 Minutes | 49 | 13.2% |
| 5 to 9 Minutes | 92 | 24.9% |
| 10 to 14 Minutes | 14 | 3.8% |
| 15 to 19 Minutes | 9 | 2.4% |
| 20 to 24 Minutes | 64 | 17.3% |
| 25 to 29 Minutes | 68 | 18.4% |
| 30 to 34 Minutes | 37 | 10.0% |
| 35 to 39 Minutes | 2 | 0.5% |
| 40 to 44 Minutes | 14 | 3.8% |
| 45 to 59 Minutes | 4 | 1.1% |
| 60 to 89 Minutes | 10 | 2.7% |
| 90 or more Minutes | 7 | 1.9% |
Commute Time by Sex in Sioux Rapids
The most common commute times in Sioux Rapids are less than 5 minutes (30 commuters, 18.8%) for males and 5 to 9 minutes (62 commuters, 29.5%) for females.
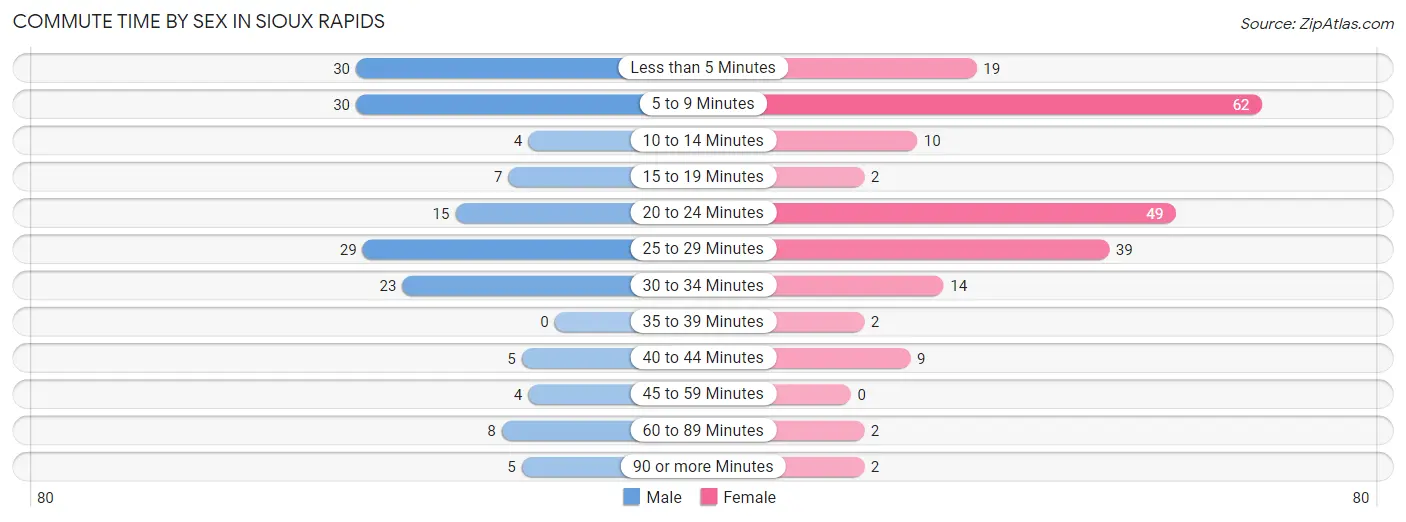
| Commute Time | Male | Female |
| Less than 5 Minutes | 30 (18.8%) | 19 (9.0%) |
| 5 to 9 Minutes | 30 (18.8%) | 62 (29.5%) |
| 10 to 14 Minutes | 4 (2.5%) | 10 (4.8%) |
| 15 to 19 Minutes | 7 (4.4%) | 2 (0.9%) |
| 20 to 24 Minutes | 15 (9.4%) | 49 (23.3%) |
| 25 to 29 Minutes | 29 (18.1%) | 39 (18.6%) |
| 30 to 34 Minutes | 23 (14.4%) | 14 (6.7%) |
| 35 to 39 Minutes | 0 (0.0%) | 2 (0.9%) |
| 40 to 44 Minutes | 5 (3.1%) | 9 (4.3%) |
| 45 to 59 Minutes | 4 (2.5%) | 0 (0.0%) |
| 60 to 89 Minutes | 8 (5.0%) | 2 (0.9%) |
| 90 or more Minutes | 5 (3.1%) | 2 (0.9%) |
Time of Departure to Work by Sex in Sioux Rapids
The most frequent times of departure to work in Sioux Rapids are 6:30 AM to 6:59 AM (59, 36.9%) for males and 10:00 AM to 10:59 AM (38, 18.1%) for females.
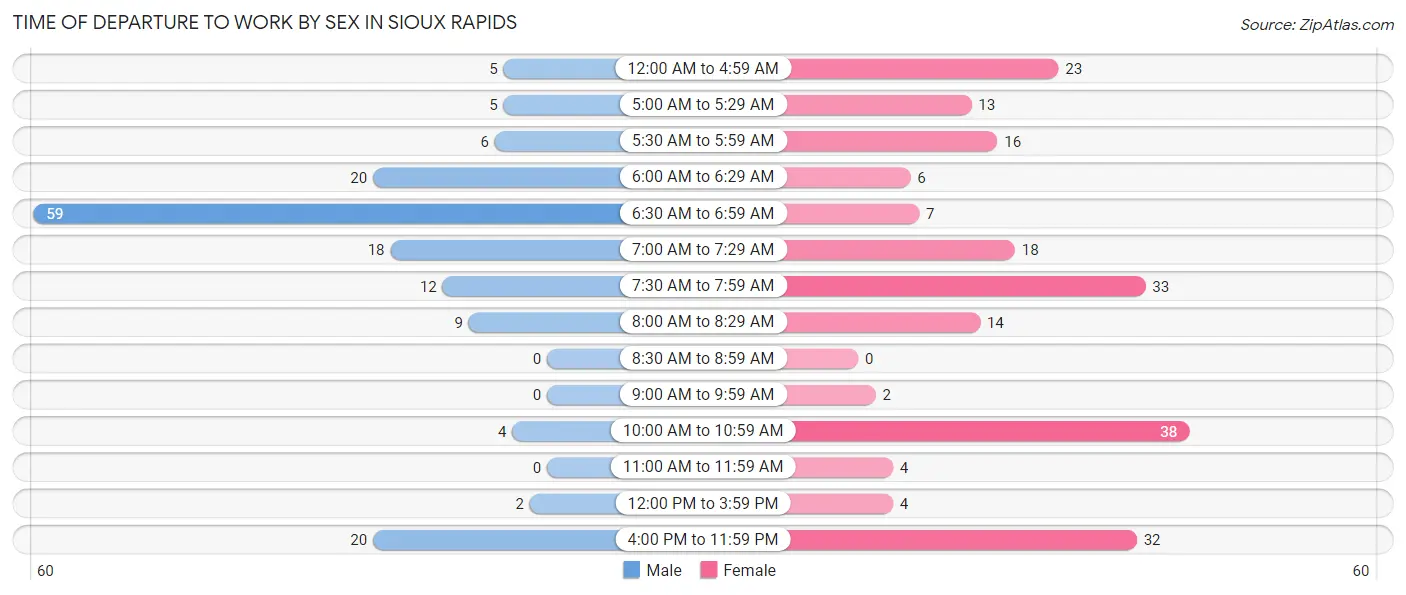
| Time of Departure | Male | Female |
| 12:00 AM to 4:59 AM | 5 (3.1%) | 23 (11.0%) |
| 5:00 AM to 5:29 AM | 5 (3.1%) | 13 (6.2%) |
| 5:30 AM to 5:59 AM | 6 (3.7%) | 16 (7.6%) |
| 6:00 AM to 6:29 AM | 20 (12.5%) | 6 (2.9%) |
| 6:30 AM to 6:59 AM | 59 (36.9%) | 7 (3.3%) |
| 7:00 AM to 7:29 AM | 18 (11.3%) | 18 (8.6%) |
| 7:30 AM to 7:59 AM | 12 (7.5%) | 33 (15.7%) |
| 8:00 AM to 8:29 AM | 9 (5.6%) | 14 (6.7%) |
| 8:30 AM to 8:59 AM | 0 (0.0%) | 0 (0.0%) |
| 9:00 AM to 9:59 AM | 0 (0.0%) | 2 (0.9%) |
| 10:00 AM to 10:59 AM | 4 (2.5%) | 38 (18.1%) |
| 11:00 AM to 11:59 AM | 0 (0.0%) | 4 (1.9%) |
| 12:00 PM to 3:59 PM | 2 (1.3%) | 4 (1.9%) |
| 4:00 PM to 11:59 PM | 20 (12.5%) | 32 (15.2%) |
| Total | 160 (100.0%) | 210 (100.0%) |
Housing Occupancy in Sioux Rapids
Occupancy by Ownership in Sioux Rapids
Of the total 319 dwellings in Sioux Rapids, owner-occupied units account for 266 (83.4%), while renter-occupied units make up 53 (16.6%).
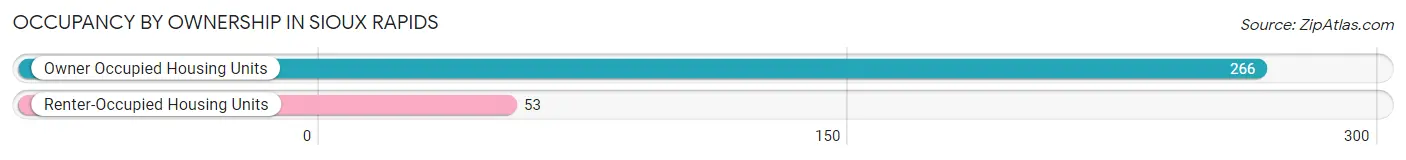
| Occupancy | # Housing Units | % Housing Units |
| Owner Occupied Housing Units | 266 | 83.4% |
| Renter-Occupied Housing Units | 53 | 16.6% |
| Total Occupied Housing Units | 319 | 100.0% |
Occupancy by Household Size in Sioux Rapids
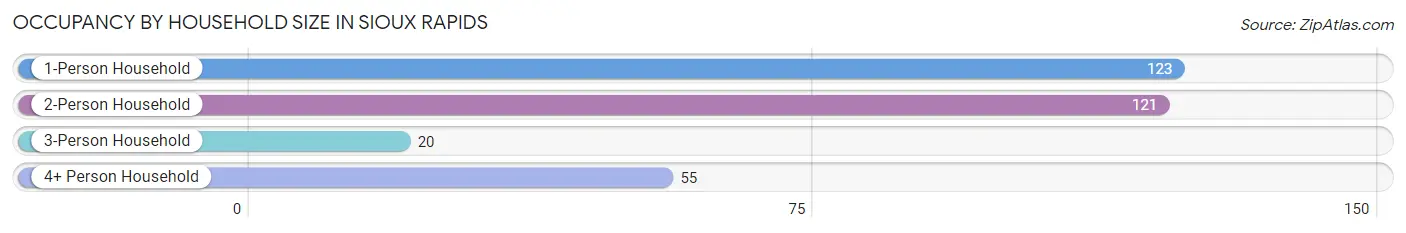
| Household Size | # Housing Units | % Housing Units |
| 1-Person Household | 123 | 38.6% |
| 2-Person Household | 121 | 37.9% |
| 3-Person Household | 20 | 6.3% |
| 4+ Person Household | 55 | 17.2% |
| Total Housing Units | 319 | 100.0% |
Occupancy by Ownership by Household Size in Sioux Rapids
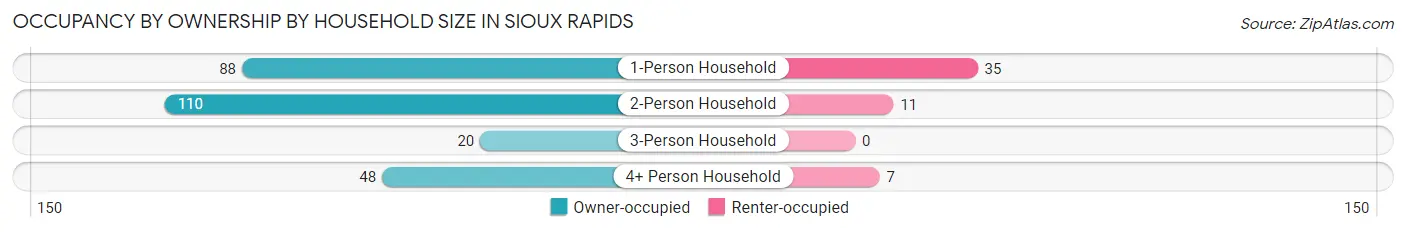
| Household Size | Owner-occupied | Renter-occupied |
| 1-Person Household | 88 (71.5%) | 35 (28.5%) |
| 2-Person Household | 110 (90.9%) | 11 (9.1%) |
| 3-Person Household | 20 (100.0%) | 0 (0.0%) |
| 4+ Person Household | 48 (87.3%) | 7 (12.7%) |
| Total Housing Units | 266 (83.4%) | 53 (16.6%) |
Occupancy by Educational Attainment in Sioux Rapids
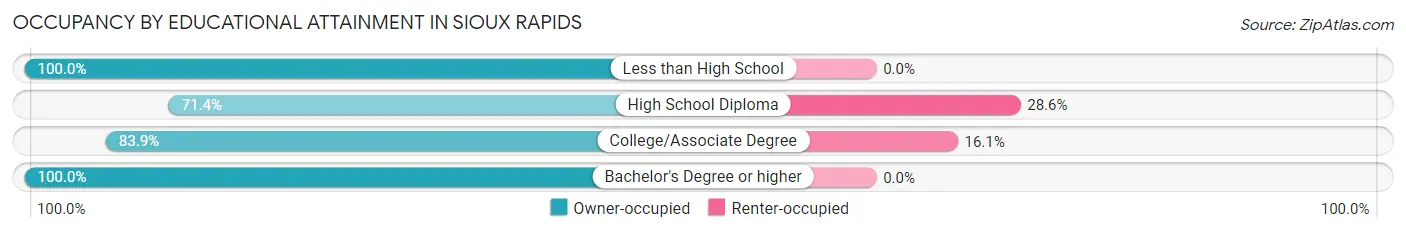
| Household Size | Owner-occupied | Renter-occupied |
| Less than High School | 22 (100.0%) | 0 (0.0%) |
| High School Diploma | 70 (71.4%) | 28 (28.6%) |
| College/Associate Degree | 130 (83.9%) | 25 (16.1%) |
| Bachelor's Degree or higher | 44 (100.0%) | 0 (0.0%) |
Occupancy by Age of Householder in Sioux Rapids
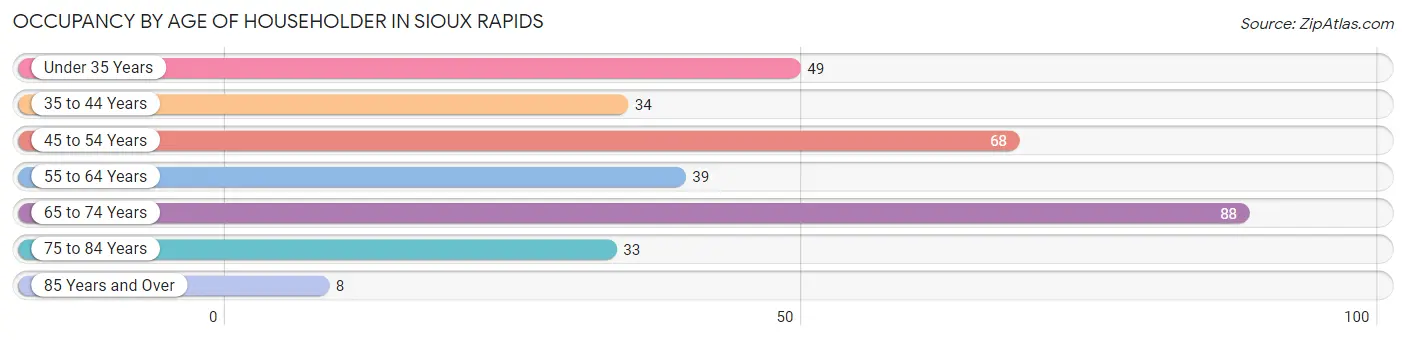
| Age Bracket | # Households | % Households |
| Under 35 Years | 49 | 15.4% |
| 35 to 44 Years | 34 | 10.7% |
| 45 to 54 Years | 68 | 21.3% |
| 55 to 64 Years | 39 | 12.2% |
| 65 to 74 Years | 88 | 27.6% |
| 75 to 84 Years | 33 | 10.3% |
| 85 Years and Over | 8 | 2.5% |
| Total | 319 | 100.0% |
Housing Finances in Sioux Rapids
Median Income by Occupancy in Sioux Rapids
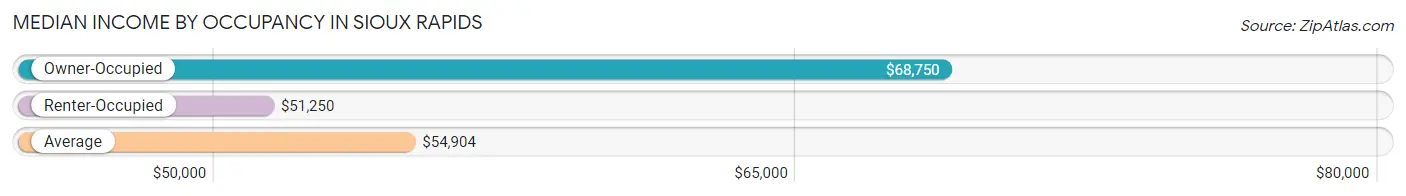
| Occupancy Type | # Households | Median Income |
| Owner-Occupied | 266 (83.4%) | $68,750 |
| Renter-Occupied | 53 (16.6%) | $51,250 |
| Average | 319 (100.0%) | $54,904 |
Occupancy by Householder Income Bracket in Sioux Rapids
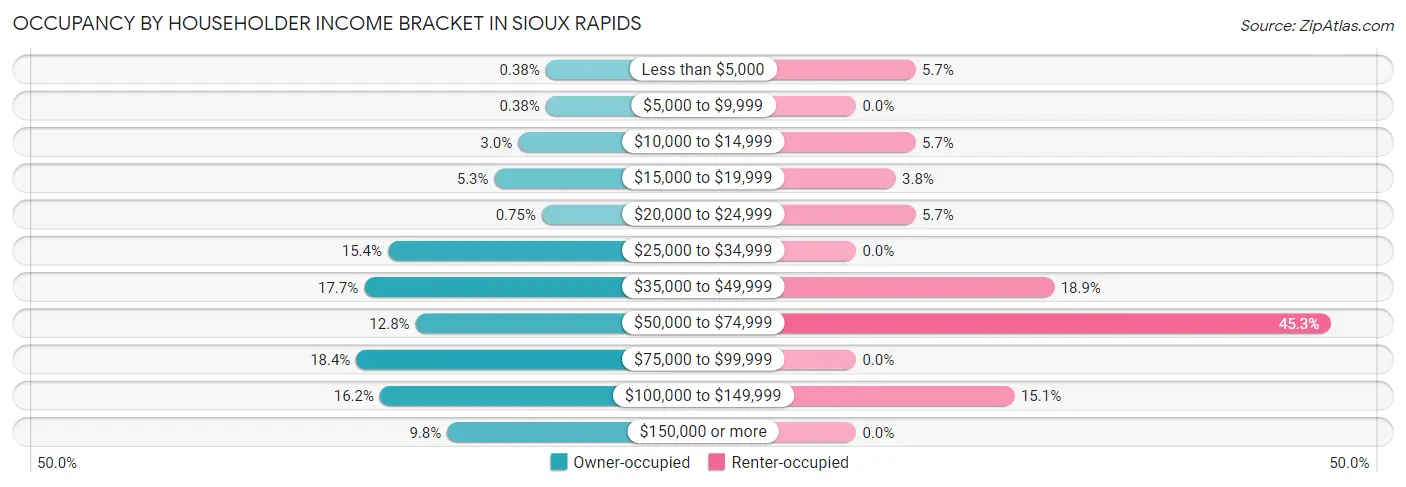
| Income Bracket | Owner-occupied | Renter-occupied |
| Less than $5,000 | 1 (0.4%) | 3 (5.7%) |
| $5,000 to $9,999 | 1 (0.4%) | 0 (0.0%) |
| $10,000 to $14,999 | 8 (3.0%) | 3 (5.7%) |
| $15,000 to $19,999 | 14 (5.3%) | 2 (3.8%) |
| $20,000 to $24,999 | 2 (0.7%) | 3 (5.7%) |
| $25,000 to $34,999 | 41 (15.4%) | 0 (0.0%) |
| $35,000 to $49,999 | 47 (17.7%) | 10 (18.9%) |
| $50,000 to $74,999 | 34 (12.8%) | 24 (45.3%) |
| $75,000 to $99,999 | 49 (18.4%) | 0 (0.0%) |
| $100,000 to $149,999 | 43 (16.2%) | 8 (15.1%) |
| $150,000 or more | 26 (9.8%) | 0 (0.0%) |
| Total | 266 (100.0%) | 53 (100.0%) |
Monthly Housing Cost Tiers in Sioux Rapids
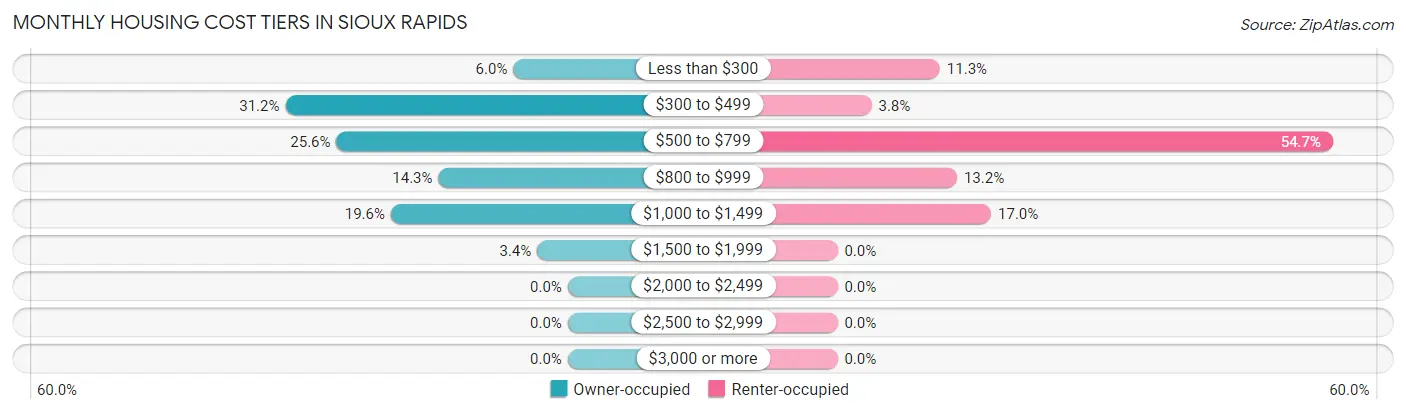
| Monthly Cost | Owner-occupied | Renter-occupied |
| Less than $300 | 16 (6.0%) | 6 (11.3%) |
| $300 to $499 | 83 (31.2%) | 2 (3.8%) |
| $500 to $799 | 68 (25.6%) | 29 (54.7%) |
| $800 to $999 | 38 (14.3%) | 7 (13.2%) |
| $1,000 to $1,499 | 52 (19.6%) | 9 (17.0%) |
| $1,500 to $1,999 | 9 (3.4%) | 0 (0.0%) |
| $2,000 to $2,499 | 0 (0.0%) | 0 (0.0%) |
| $2,500 to $2,999 | 0 (0.0%) | 0 (0.0%) |
| $3,000 or more | 0 (0.0%) | 0 (0.0%) |
| Total | 266 (100.0%) | 53 (100.0%) |
Physical Housing Characteristics in Sioux Rapids
Housing Structures in Sioux Rapids
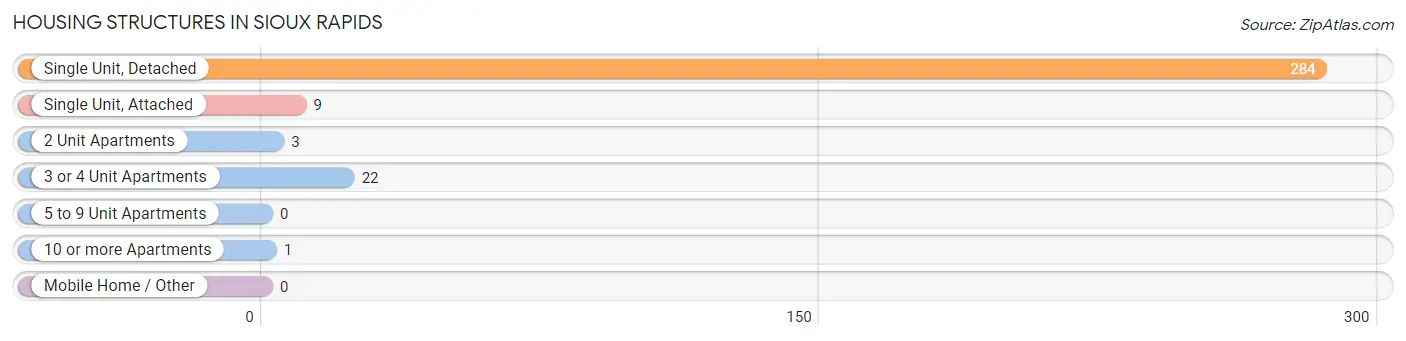
| Structure Type | # Housing Units | % Housing Units |
| Single Unit, Detached | 284 | 89.0% |
| Single Unit, Attached | 9 | 2.8% |
| 2 Unit Apartments | 3 | 0.9% |
| 3 or 4 Unit Apartments | 22 | 6.9% |
| 5 to 9 Unit Apartments | 0 | 0.0% |
| 10 or more Apartments | 1 | 0.3% |
| Mobile Home / Other | 0 | 0.0% |
| Total | 319 | 100.0% |
Housing Structures by Occupancy in Sioux Rapids
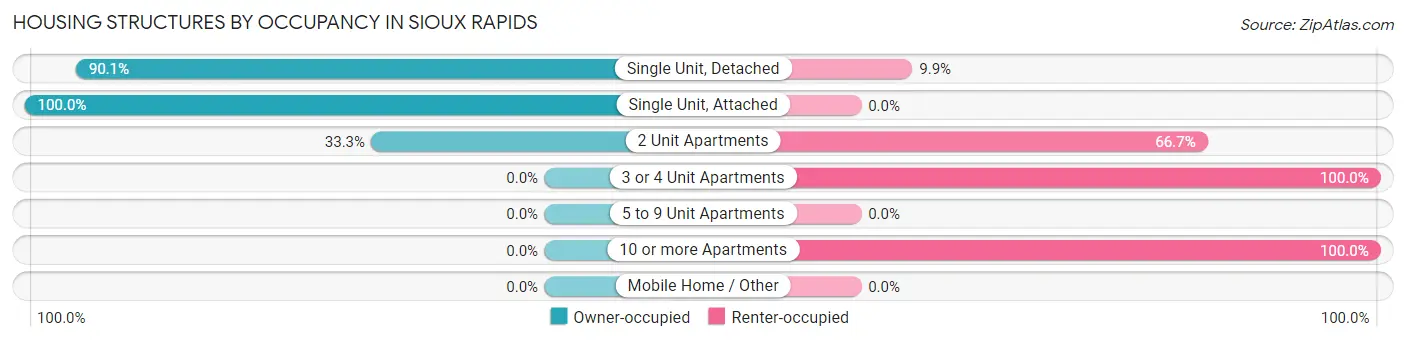
| Structure Type | Owner-occupied | Renter-occupied |
| Single Unit, Detached | 256 (90.1%) | 28 (9.9%) |
| Single Unit, Attached | 9 (100.0%) | 0 (0.0%) |
| 2 Unit Apartments | 1 (33.3%) | 2 (66.7%) |
| 3 or 4 Unit Apartments | 0 (0.0%) | 22 (100.0%) |
| 5 to 9 Unit Apartments | 0 (0.0%) | 0 (0.0%) |
| 10 or more Apartments | 0 (0.0%) | 1 (100.0%) |
| Mobile Home / Other | 0 (0.0%) | 0 (0.0%) |
| Total | 266 (83.4%) | 53 (16.6%) |
Housing Structures by Number of Rooms in Sioux Rapids
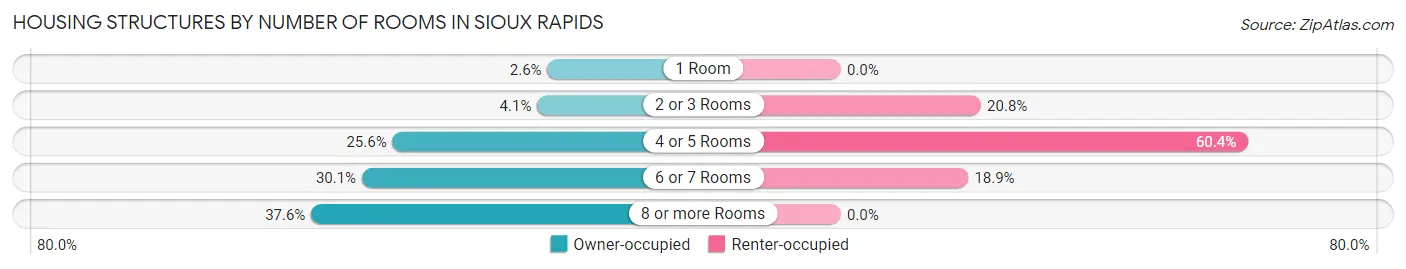
| Number of Rooms | Owner-occupied | Renter-occupied |
| 1 Room | 7 (2.6%) | 0 (0.0%) |
| 2 or 3 Rooms | 11 (4.1%) | 11 (20.7%) |
| 4 or 5 Rooms | 68 (25.6%) | 32 (60.4%) |
| 6 or 7 Rooms | 80 (30.1%) | 10 (18.9%) |
| 8 or more Rooms | 100 (37.6%) | 0 (0.0%) |
| Total | 266 (100.0%) | 53 (100.0%) |
Housing Structure by Heating Type in Sioux Rapids
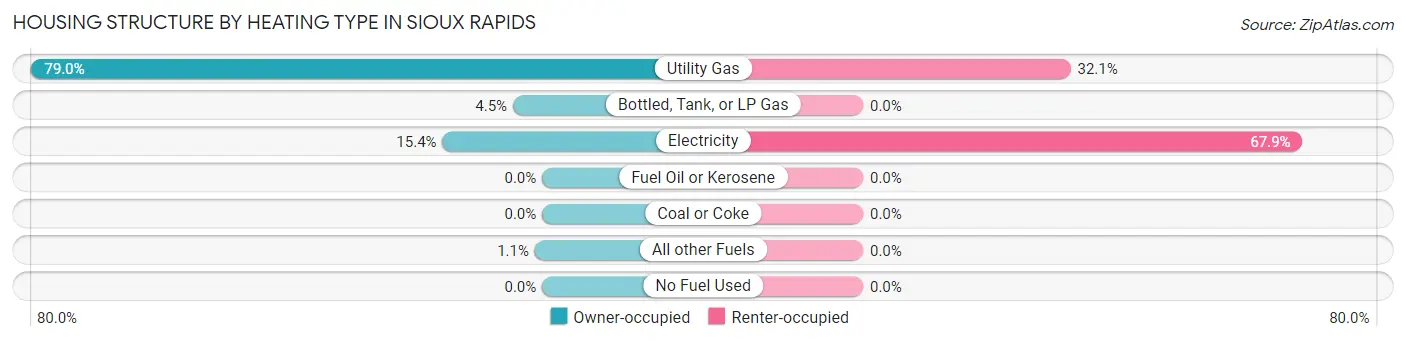
| Heating Type | Owner-occupied | Renter-occupied |
| Utility Gas | 210 (78.9%) | 17 (32.1%) |
| Bottled, Tank, or LP Gas | 12 (4.5%) | 0 (0.0%) |
| Electricity | 41 (15.4%) | 36 (67.9%) |
| Fuel Oil or Kerosene | 0 (0.0%) | 0 (0.0%) |
| Coal or Coke | 0 (0.0%) | 0 (0.0%) |
| All other Fuels | 3 (1.1%) | 0 (0.0%) |
| No Fuel Used | 0 (0.0%) | 0 (0.0%) |
| Total | 266 (100.0%) | 53 (100.0%) |
Household Vehicle Usage in Sioux Rapids
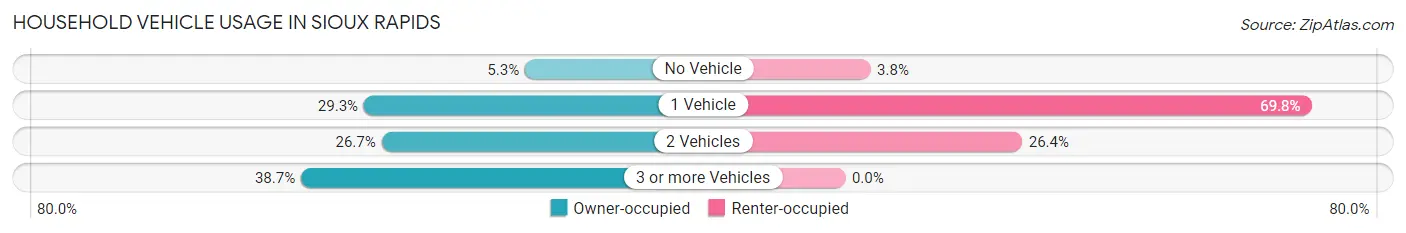
| Vehicles per Household | Owner-occupied | Renter-occupied |
| No Vehicle | 14 (5.3%) | 2 (3.8%) |
| 1 Vehicle | 78 (29.3%) | 37 (69.8%) |
| 2 Vehicles | 71 (26.7%) | 14 (26.4%) |
| 3 or more Vehicles | 103 (38.7%) | 0 (0.0%) |
| Total | 266 (100.0%) | 53 (100.0%) |
Real Estate & Mortgages in Sioux Rapids
Real Estate and Mortgage Overview in Sioux Rapids
| Characteristic | Without Mortgage | With Mortgage |
| Housing Units | 152 | 114 |
| Median Property Value | $74,600 | $96,000 |
| Median Household Income | $40,714 | $21 |
| Monthly Housing Costs | $428 | $0 |
| Real Estate Taxes | $1,155 | $5 |
Property Value by Mortgage Status in Sioux Rapids
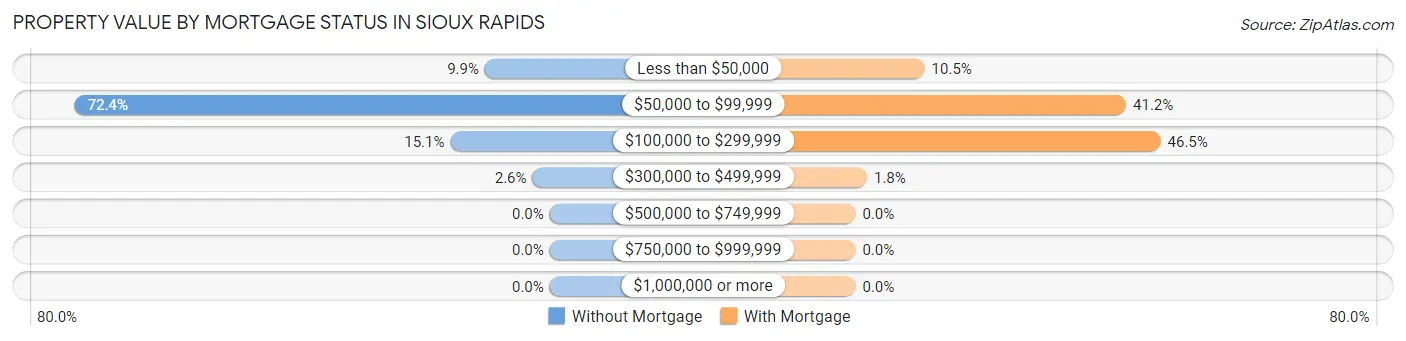
| Property Value | Without Mortgage | With Mortgage |
| Less than $50,000 | 15 (9.9%) | 12 (10.5%) |
| $50,000 to $99,999 | 110 (72.4%) | 47 (41.2%) |
| $100,000 to $299,999 | 23 (15.1%) | 53 (46.5%) |
| $300,000 to $499,999 | 4 (2.6%) | 2 (1.8%) |
| $500,000 to $749,999 | 0 (0.0%) | 0 (0.0%) |
| $750,000 to $999,999 | 0 (0.0%) | 0 (0.0%) |
| $1,000,000 or more | 0 (0.0%) | 0 (0.0%) |
| Total | 152 (100.0%) | 114 (100.0%) |
Household Income by Mortgage Status in Sioux Rapids
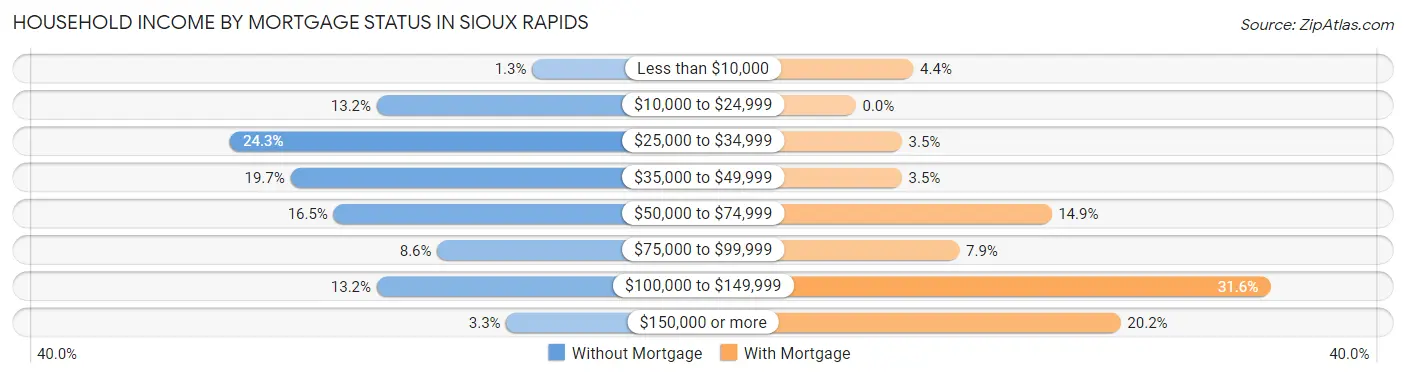
| Household Income | Without Mortgage | With Mortgage |
| Less than $10,000 | 2 (1.3%) | 5 (4.4%) |
| $10,000 to $24,999 | 20 (13.2%) | 0 (0.0%) |
| $25,000 to $34,999 | 37 (24.3%) | 4 (3.5%) |
| $35,000 to $49,999 | 30 (19.7%) | 4 (3.5%) |
| $50,000 to $74,999 | 25 (16.5%) | 17 (14.9%) |
| $75,000 to $99,999 | 13 (8.6%) | 9 (7.9%) |
| $100,000 to $149,999 | 20 (13.2%) | 36 (31.6%) |
| $150,000 or more | 5 (3.3%) | 23 (20.2%) |
| Total | 152 (100.0%) | 114 (100.0%) |
Property Value to Household Income Ratio in Sioux Rapids
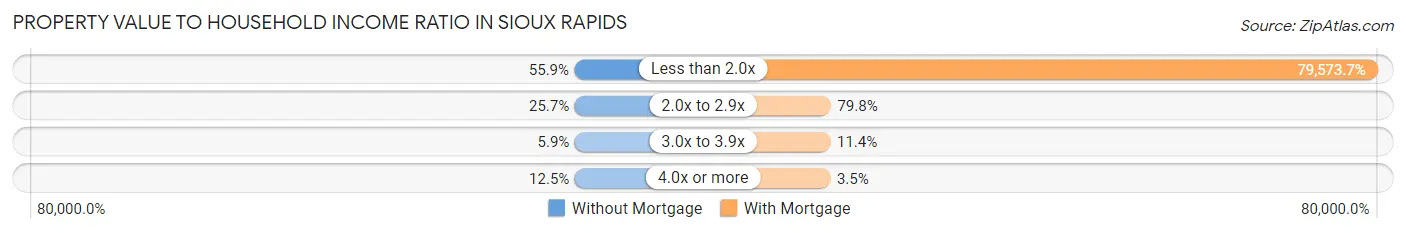
| Value-to-Income Ratio | Without Mortgage | With Mortgage |
| Less than 2.0x | 85 (55.9%) | 90,714 (79,573.7%) |
| 2.0x to 2.9x | 39 (25.7%) | 91 (79.8%) |
| 3.0x to 3.9x | 9 (5.9%) | 13 (11.4%) |
| 4.0x or more | 19 (12.5%) | 4 (3.5%) |
| Total | 152 (100.0%) | 114 (100.0%) |
Real Estate Taxes by Mortgage Status in Sioux Rapids
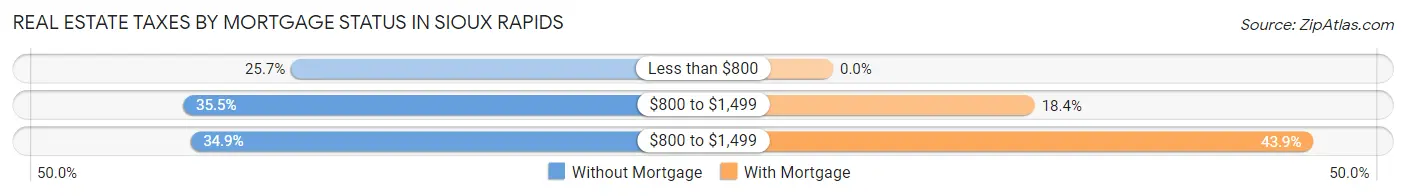
| Property Taxes | Without Mortgage | With Mortgage |
| Less than $800 | 39 (25.7%) | 0 (0.0%) |
| $800 to $1,499 | 54 (35.5%) | 21 (18.4%) |
| $800 to $1,499 | 53 (34.9%) | 50 (43.9%) |
| Total | 152 (100.0%) | 114 (100.0%) |
Health & Disability in Sioux Rapids
Health Insurance Coverage by Age in Sioux Rapids
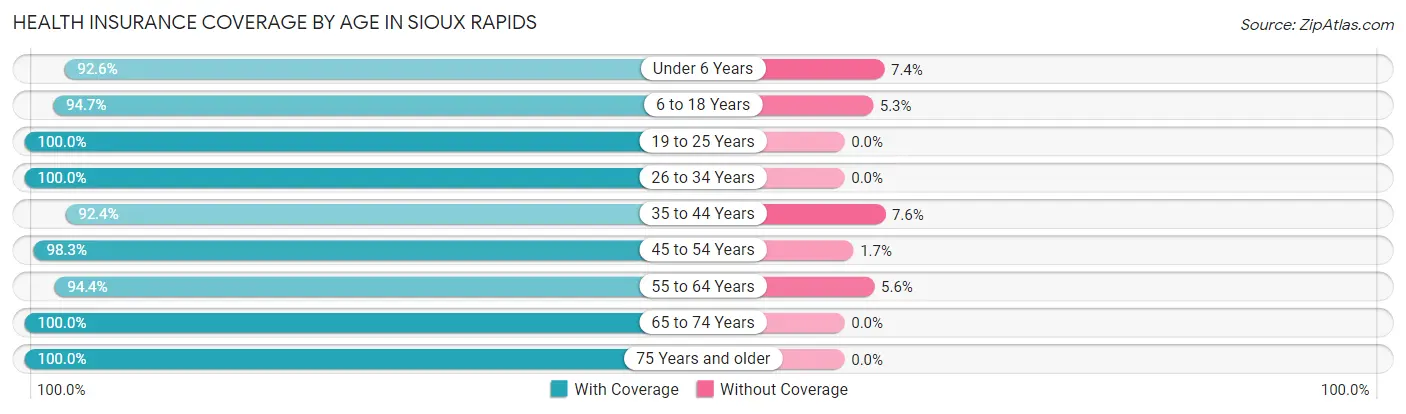
| Age Bracket | With Coverage | Without Coverage |
| Under 6 Years | 25 (92.6%) | 2 (7.4%) |
| 6 to 18 Years | 196 (94.7%) | 11 (5.3%) |
| 19 to 25 Years | 52 (100.0%) | 0 (0.0%) |
| 26 to 34 Years | 36 (100.0%) | 0 (0.0%) |
| 35 to 44 Years | 73 (92.4%) | 6 (7.6%) |
| 45 to 54 Years | 118 (98.3%) | 2 (1.7%) |
| 55 to 64 Years | 68 (94.4%) | 4 (5.6%) |
| 65 to 74 Years | 124 (100.0%) | 0 (0.0%) |
| 75 Years and older | 78 (100.0%) | 0 (0.0%) |
| Total | 770 (96.9%) | 25 (3.1%) |
Health Insurance Coverage by Citizenship Status in Sioux Rapids
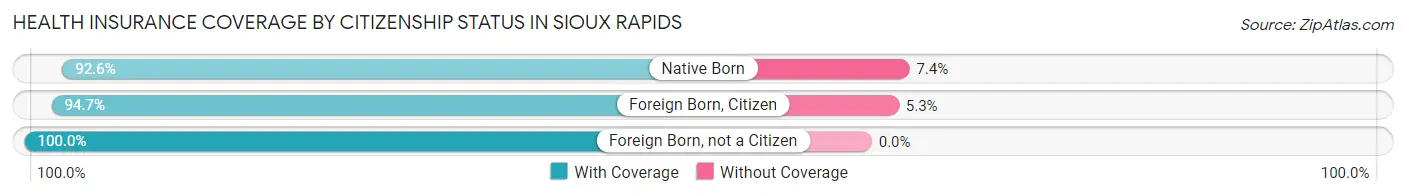
| Citizenship Status | With Coverage | Without Coverage |
| Native Born | 25 (92.6%) | 2 (7.4%) |
| Foreign Born, Citizen | 196 (94.7%) | 11 (5.3%) |
| Foreign Born, not a Citizen | 52 (100.0%) | 0 (0.0%) |
Health Insurance Coverage by Household Income in Sioux Rapids
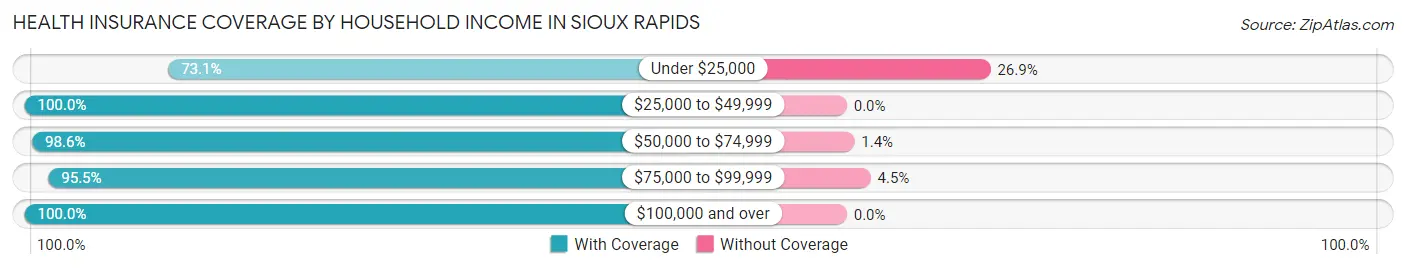
| Household Income | With Coverage | Without Coverage |
| Under $25,000 | 38 (73.1%) | 14 (26.9%) |
| $25,000 to $49,999 | 156 (100.0%) | 0 (0.0%) |
| $50,000 to $74,999 | 139 (98.6%) | 2 (1.4%) |
| $75,000 to $99,999 | 193 (95.5%) | 9 (4.5%) |
| $100,000 and over | 234 (100.0%) | 0 (0.0%) |
Public vs Private Health Insurance Coverage by Age in Sioux Rapids
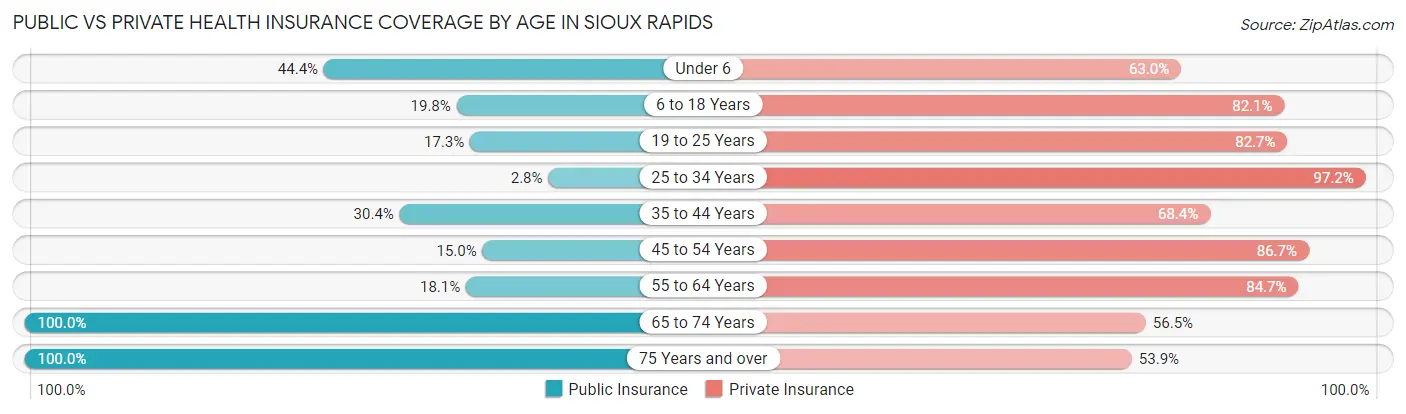
| Age Bracket | Public Insurance | Private Insurance |
| Under 6 | 12 (44.4%) | 17 (63.0%) |
| 6 to 18 Years | 41 (19.8%) | 170 (82.1%) |
| 19 to 25 Years | 9 (17.3%) | 43 (82.7%) |
| 25 to 34 Years | 1 (2.8%) | 35 (97.2%) |
| 35 to 44 Years | 24 (30.4%) | 54 (68.3%) |
| 45 to 54 Years | 18 (15.0%) | 104 (86.7%) |
| 55 to 64 Years | 13 (18.1%) | 61 (84.7%) |
| 65 to 74 Years | 124 (100.0%) | 70 (56.5%) |
| 75 Years and over | 78 (100.0%) | 42 (53.8%) |
| Total | 320 (40.3%) | 596 (75.0%) |
Disability Status by Sex by Age in Sioux Rapids
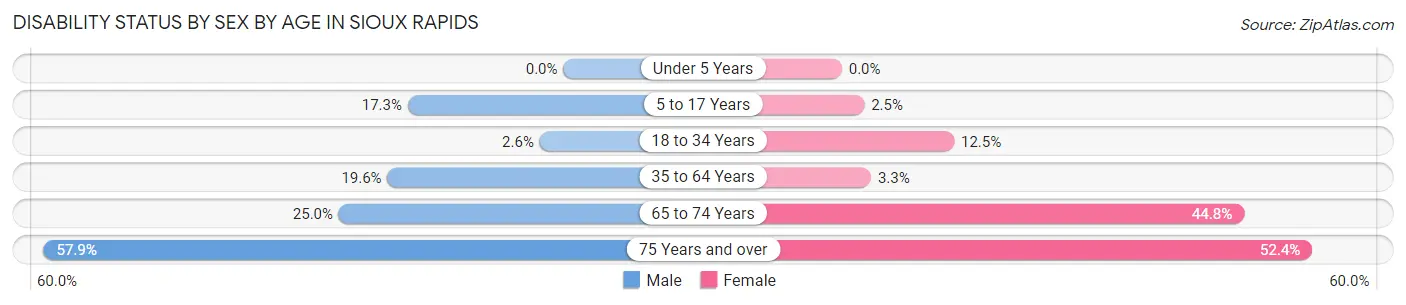
| Age Bracket | Male | Female |
| Under 5 Years | 0 (0.0%) | 0 (0.0%) |
| 5 to 17 Years | 22 (17.3%) | 2 (2.5%) |
| 18 to 34 Years | 1 (2.6%) | 7 (12.5%) |
| 35 to 64 Years | 29 (19.6%) | 4 (3.3%) |
| 65 to 74 Years | 7 (25.0%) | 43 (44.8%) |
| 75 Years and over | 33 (57.9%) | 11 (52.4%) |
Disability Class by Sex by Age in Sioux Rapids
Disability Class: Hearing Difficulty
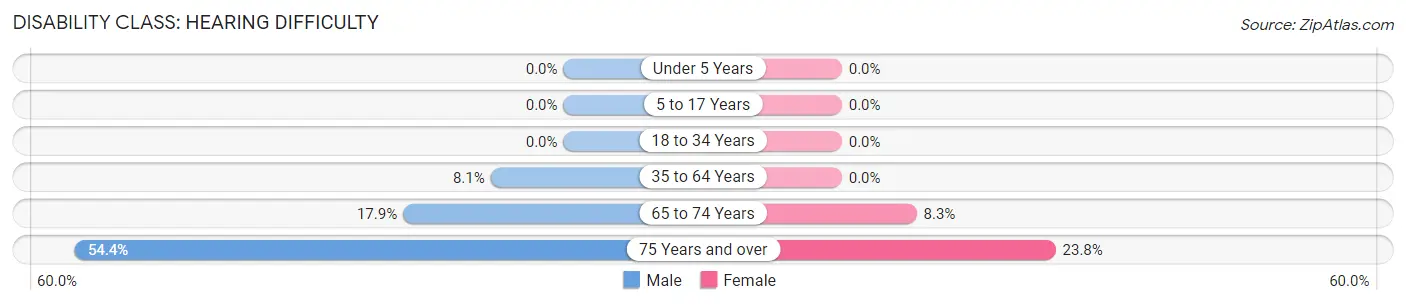
| Age Bracket | Male | Female |
| Under 5 Years | 0 (0.0%) | 0 (0.0%) |
| 5 to 17 Years | 0 (0.0%) | 0 (0.0%) |
| 18 to 34 Years | 0 (0.0%) | 0 (0.0%) |
| 35 to 64 Years | 12 (8.1%) | 0 (0.0%) |
| 65 to 74 Years | 5 (17.9%) | 8 (8.3%) |
| 75 Years and over | 31 (54.4%) | 5 (23.8%) |
Disability Class: Vision Difficulty
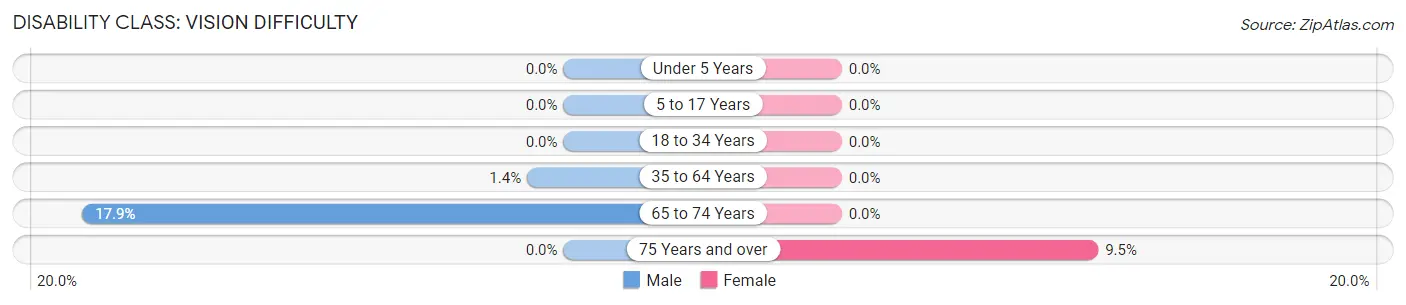
| Age Bracket | Male | Female |
| Under 5 Years | 0 (0.0%) | 0 (0.0%) |
| 5 to 17 Years | 0 (0.0%) | 0 (0.0%) |
| 18 to 34 Years | 0 (0.0%) | 0 (0.0%) |
| 35 to 64 Years | 2 (1.3%) | 0 (0.0%) |
| 65 to 74 Years | 5 (17.9%) | 0 (0.0%) |
| 75 Years and over | 0 (0.0%) | 2 (9.5%) |
Disability Class: Cognitive Difficulty
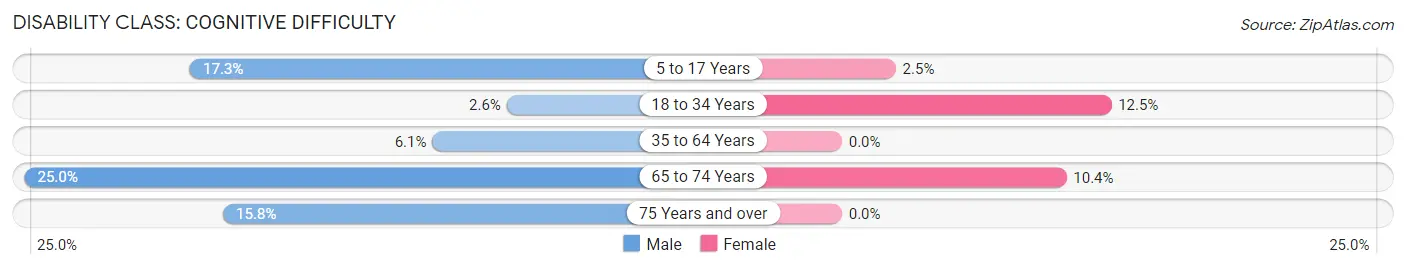
| Age Bracket | Male | Female |
| 5 to 17 Years | 22 (17.3%) | 2 (2.5%) |
| 18 to 34 Years | 1 (2.6%) | 7 (12.5%) |
| 35 to 64 Years | 9 (6.1%) | 0 (0.0%) |
| 65 to 74 Years | 7 (25.0%) | 10 (10.4%) |
| 75 Years and over | 9 (15.8%) | 0 (0.0%) |
Disability Class: Ambulatory Difficulty
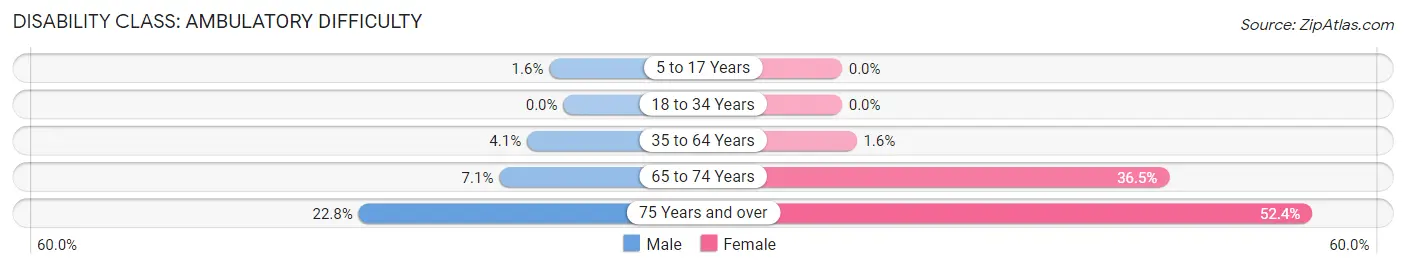
| Age Bracket | Male | Female |
| 5 to 17 Years | 2 (1.6%) | 0 (0.0%) |
| 18 to 34 Years | 0 (0.0%) | 0 (0.0%) |
| 35 to 64 Years | 6 (4.1%) | 2 (1.6%) |
| 65 to 74 Years | 2 (7.1%) | 35 (36.5%) |
| 75 Years and over | 13 (22.8%) | 11 (52.4%) |
Disability Class: Self-Care Difficulty
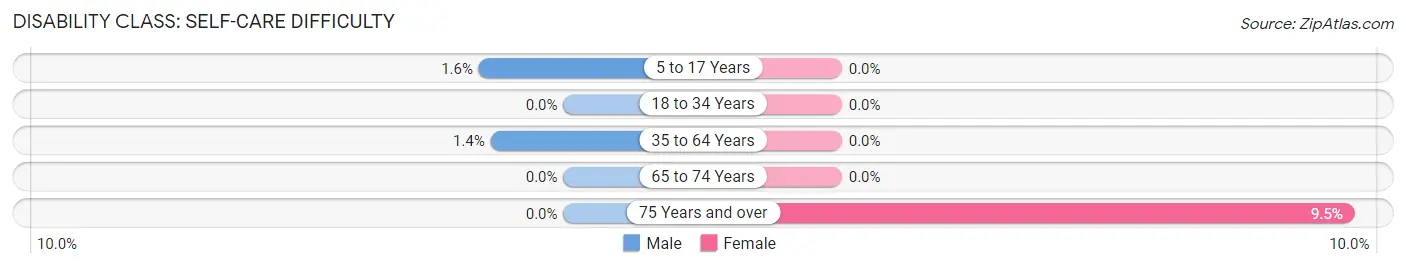
| Age Bracket | Male | Female |
| 5 to 17 Years | 2 (1.6%) | 0 (0.0%) |
| 18 to 34 Years | 0 (0.0%) | 0 (0.0%) |
| 35 to 64 Years | 2 (1.3%) | 0 (0.0%) |
| 65 to 74 Years | 0 (0.0%) | 0 (0.0%) |
| 75 Years and over | 0 (0.0%) | 2 (9.5%) |
Technology Access in Sioux Rapids
Computing Device Access in Sioux Rapids
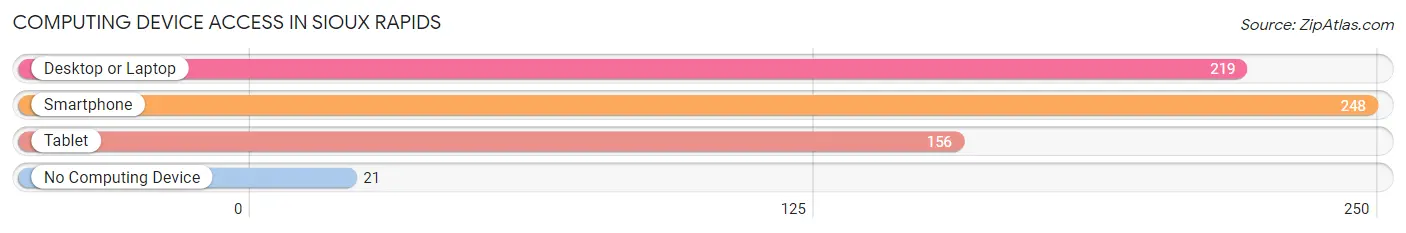
| Device Type | # Households | % Households |
| Desktop or Laptop | 219 | 68.6% |
| Smartphone | 248 | 77.7% |
| Tablet | 156 | 48.9% |
| No Computing Device | 21 | 6.6% |
| Total | 319 | 100.0% |
Internet Access in Sioux Rapids
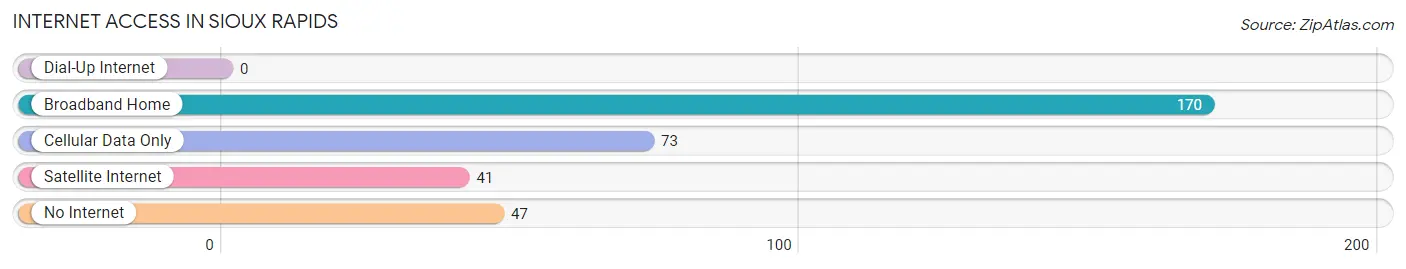
| Internet Type | # Households | % Households |
| Dial-Up Internet | 0 | 0.0% |
| Broadband Home | 170 | 53.3% |
| Cellular Data Only | 73 | 22.9% |
| Satellite Internet | 41 | 12.9% |
| No Internet | 47 | 14.7% |
| Total | 319 | 100.0% |
Sioux Rapids Summary
Sioux Rapids is a city located in Buena Vista County, Iowa, United States. The population was 545 at the 2010 census. It is part of the Storm Lake Micropolitan Statistical Area.
History
Sioux Rapids was founded in 1881 by the Sioux Rapids Land and Improvement Company. The company was formed by a group of investors from Sioux City, Iowa, who wanted to develop the area for agricultural and industrial purposes. The town was named after the nearby Sioux River.
The first settlers arrived in 1882 and the town was officially incorporated in 1883. The first post office was established in 1884.
In the early years, Sioux Rapids was a thriving agricultural community. The town was home to several grain elevators, a creamery, a lumberyard, and a variety of other businesses.
In the late 19th century, the town was also home to a large number of German immigrants. Many of these immigrants were farmers and they helped to shape the town’s culture and economy.
Geography
Sioux Rapids is located at 42 37 17 N 95 17 17 W 42 621445 95 288118
According to the United States Census Bureau, the city has a total area of 0.77 square miles (1.99 km2), all of it land.
Economy
The economy of Sioux Rapids is largely based on agriculture. The town is home to several grain elevators and a variety of other businesses related to farming.
The town is also home to a number of small businesses, including a grocery store, a hardware store, a restaurant, and a bank.
Demographics
As of the census of 2010, there were 545 people, 221 households, and 149 families residing in the city. The population density was 708.2 people per square mile (273.7/km2). There were 241 housing units at an average density of 313.6 per square mile (120.9/km2). The racial makeup of the city was 97.3% White, 0.2% African American, 0.2% Native American, 0.2% Asian, 0.4% from other races, and 1.5% from two or more races. Hispanic or Latino of any race were 1.3% of the population.
There were 221 households, out of which 28.4% had children under the age of 18 living with them, 54.0% were married couples living together, 8.6% had a female householder with no husband present, and 33.5% were non-families. 29.9% of all households were made up of individuals, and 15.4% had someone living alone who was 65 years of age or older. The average household size was 2.46 and the average family size was 3.06.
In the city, the population was spread out, with 25.7% under the age of 18, 7.3% from 18 to 24, 24.2% from 25 to 44, 24.2% from 45 to 64, and 18.6% who were 65 years of age or older. The median age was 40 years. For every 100 females, there were 97.3 males. For every 100 females age 18 and over, there were 94.3 males.
The median income for a household in the city was $37,500, and the median income for a family was $45,000. Males had a median income of $30,000 versus $21,250 for females. The per capita income for the city was $17,845. About 5.3% of families and 8.2% of the population were below the poverty line, including 10.2% of those under age 18 and 8.3% of those age 65 or over.
Common Questions
What is Per Capita Income in Sioux Rapids?
Per Capita income in Sioux Rapids is $30,621.
What is the Median Family Income in Sioux Rapids?
Median Family Income in Sioux Rapids is $78,194.
What is the Median Household income in Sioux Rapids?
Median Household Income in Sioux Rapids is $54,904.
What is Income or Wage Gap in Sioux Rapids?
Income or Wage Gap in Sioux Rapids is 52.2%.
Women in Sioux Rapids earn 47.8 cents for every dollar earned by a man.
What is Inequality or Gini Index in Sioux Rapids?
Inequality or Gini Index in Sioux Rapids is 0.38.
What is the Total Population of Sioux Rapids?
Total Population of Sioux Rapids is 812.
What is the Total Male Population of Sioux Rapids?
Total Male Population of Sioux Rapids is 421.
What is the Total Female Population of Sioux Rapids?
Total Female Population of Sioux Rapids is 391.
What is the Ratio of Males per 100 Females in Sioux Rapids?
There are 107.67 Males per 100 Females in Sioux Rapids.
What is the Ratio of Females per 100 Males in Sioux Rapids?
There are 92.87 Females per 100 Males in Sioux Rapids.
What is the Median Population Age in Sioux Rapids?
Median Population Age in Sioux Rapids is 45.7 Years.
What is the Average Family Size in Sioux Rapids
Average Family Size in Sioux Rapids is 3.5 People.
What is the Average Household Size in Sioux Rapids
Average Household Size in Sioux Rapids is 2.5 People.
How Large is the Labor Force in Sioux Rapids?
There are 400 People in the Labor Forcein in Sioux Rapids.
What is the Percentage of People in the Labor Force in Sioux Rapids?
63.3% of People are in the Labor Force in Sioux Rapids.
What is the Unemployment Rate in Sioux Rapids?
Unemployment Rate in Sioux Rapids is 2.0%.