Zip Codes with the Highest Percentage of Population Employed in Installation, Maintenance & Repair in Dubuque, IA
RELATED REPORTS & OPTIONS
Installation, Maintenance & Repair
Dubuque
Compare Zip Codes
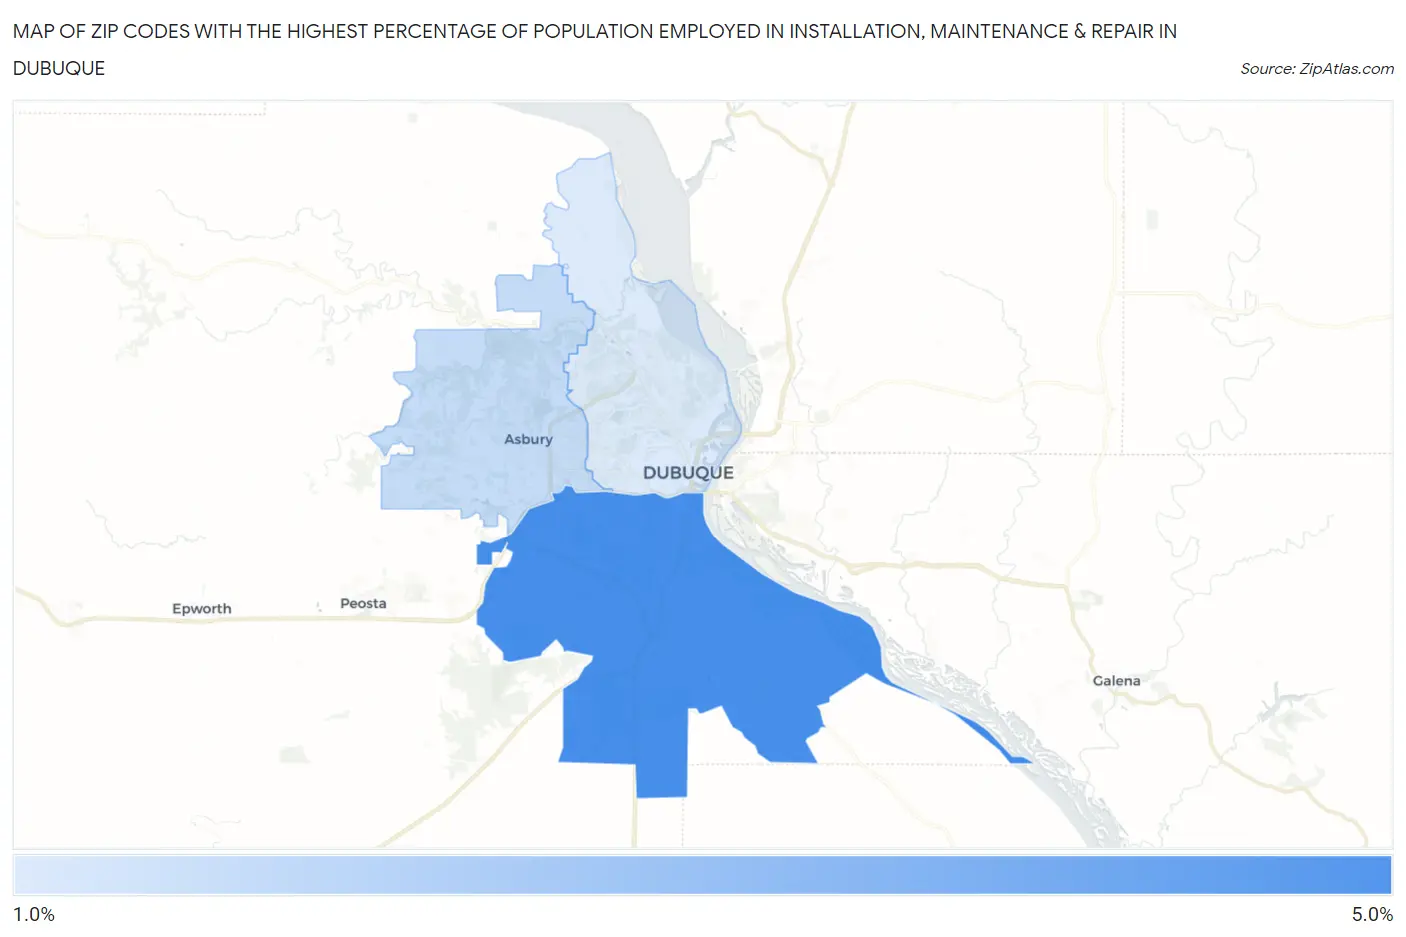
Map of Zip Codes with the Highest Percentage of Population Employed in Installation, Maintenance & Repair in Dubuque
1.7%
4.5%
Zip Codes with the Highest Percentage of Population Employed in Installation, Maintenance & Repair in Dubuque, IA
| Zip Code | % Employed | vs State | vs National | |
| 1. | 52003 | 4.5% | 3.5%(+1.01)#426 | 3.1%(+1.41)#10,502 |
| 2. | 52002 | 2.1% | 3.5%(-1.36)#740 | 3.1%(-0.957)#21,495 |
| 3. | 52001 | 1.7% | 3.5%(-1.78)#783 | 3.1%(-1.38)#23,390 |
1
Common Questions
What are the Top Zip Codes with the Highest Percentage of Population Employed in Installation, Maintenance & Repair in Dubuque, IA?
Top Zip Codes with the Highest Percentage of Population Employed in Installation, Maintenance & Repair in Dubuque, IA are:
What zip code has the Highest Percentage of Population Employed in Installation, Maintenance & Repair in Dubuque, IA?
52003 has the Highest Percentage of Population Employed in Installation, Maintenance & Repair in Dubuque, IA with 4.5%.
What is the Percentage of Population Employed in Installation, Maintenance & Repair in Dubuque, IA?
Percentage of Population Employed in Installation, Maintenance & Repair in Dubuque is 1.9%.
What is the Percentage of Population Employed in Installation, Maintenance & Repair in Iowa?
Percentage of Population Employed in Installation, Maintenance & Repair in Iowa is 3.5%.
What is the Percentage of Population Employed in Installation, Maintenance & Repair in the United States?
Percentage of Population Employed in Installation, Maintenance & Repair in the United States is 3.1%.