Centerville, IA Map & Demographics
Centerville Map
Centerville Overview
$23,999
PER CAPITA INCOME
$46,923
AVG FAMILY INCOME
$42,064
AVG HOUSEHOLD INCOME
36.3%
WAGE / INCOME GAP [ % ]
63.7¢/ $1
WAGE / INCOME GAP [ $ ]
0.44
INEQUALITY / GINI INDEX
5,393
TOTAL POPULATION
2,653
MALE POPULATION
2,740
FEMALE POPULATION
96.82
MALES / 100 FEMALES
103.28
FEMALES / 100 MALES
45.4
MEDIAN AGE
3.0
AVG FAMILY SIZE
2.3
AVG HOUSEHOLD SIZE
2,192
LABOR FORCE [ PEOPLE ]
50.7%
PERCENT IN LABOR FORCE
8.8%
UNEMPLOYMENT RATE
Centerville Zip Codes
Centerville Area Codes
Income in Centerville
Income Overview in Centerville
Per Capita Income in Centerville is $23,999, while median incomes of families and households are $46,923 and $42,064 respectively.
| Characteristic | Number | Measure |
| Per Capita Income | 5,393 | $23,999 |
| Median Family Income | 1,298 | $46,923 |
| Mean Family Income | 1,298 | $64,142 |
| Median Household Income | 2,299 | $42,064 |
| Mean Household Income | 2,299 | $53,310 |
| Income Deficit | 1,298 | $0 |
| Wage / Income Gap (%) | 5,393 | 36.32% |
| Wage / Income Gap ($) | 5,393 | 63.68¢ per $1 |
| Gini / Inequality Index | 5,393 | 0.44 |
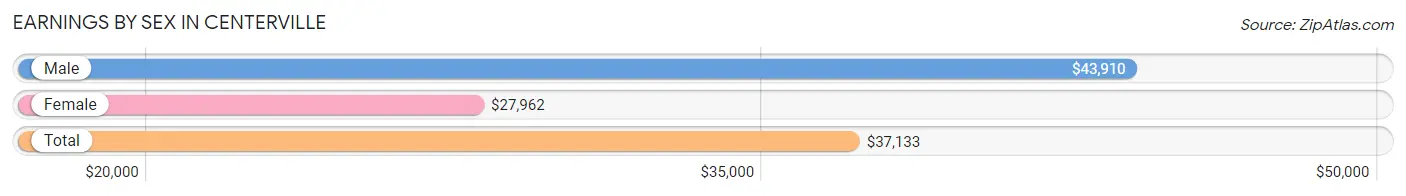
Earnings by Sex in Centerville
Average Earnings in Centerville are $37,133, $43,910 for men and $27,962 for women, a difference of 36.3%.
| Sex | Number | Average Earnings |
| Male | 1,092 (48.9%) | $43,910 |
| Female | 1,143 (51.1%) | $27,962 |
| Total | 2,235 (100.0%) | $37,133 |
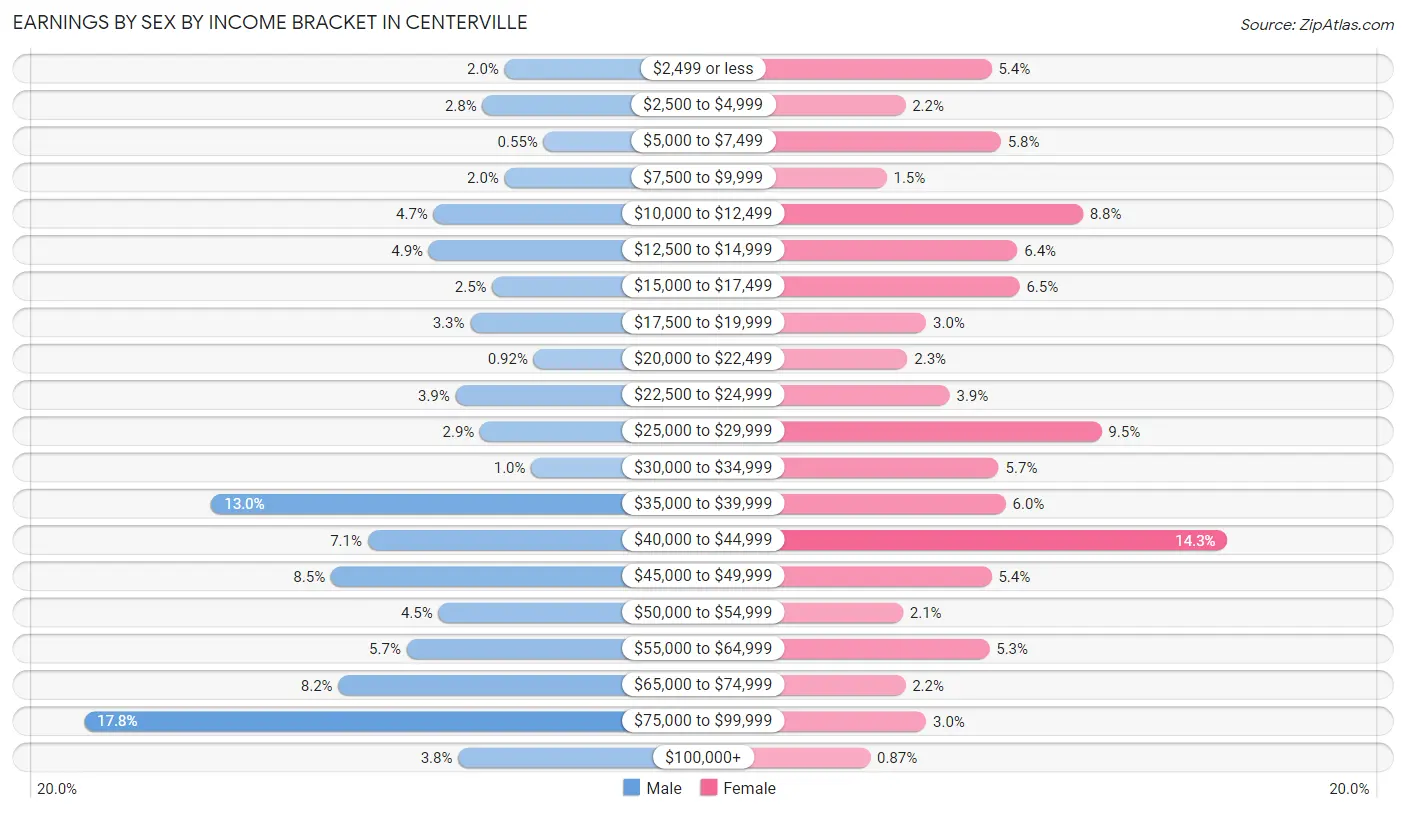
Earnings by Sex by Income Bracket in Centerville
The most common earnings brackets in Centerville are $75,000 to $99,999 for men (194 | 17.8%) and $40,000 to $44,999 for women (163 | 14.3%).
| Income | Male | Female |
| $2,499 or less | 22 (2.0%) | 62 (5.4%) |
| $2,500 to $4,999 | 31 (2.8%) | 25 (2.2%) |
| $5,000 to $7,499 | 6 (0.5%) | 66 (5.8%) |
| $7,500 to $9,999 | 22 (2.0%) | 17 (1.5%) |
| $10,000 to $12,499 | 51 (4.7%) | 101 (8.8%) |
| $12,500 to $14,999 | 53 (4.9%) | 73 (6.4%) |
| $15,000 to $17,499 | 27 (2.5%) | 74 (6.5%) |
| $17,500 to $19,999 | 36 (3.3%) | 34 (3.0%) |
| $20,000 to $22,499 | 10 (0.9%) | 26 (2.3%) |
| $22,500 to $24,999 | 42 (3.8%) | 44 (3.8%) |
| $25,000 to $29,999 | 32 (2.9%) | 109 (9.5%) |
| $30,000 to $34,999 | 11 (1.0%) | 65 (5.7%) |
| $35,000 to $39,999 | 142 (13.0%) | 68 (5.9%) |
| $40,000 to $44,999 | 78 (7.1%) | 163 (14.3%) |
| $45,000 to $49,999 | 93 (8.5%) | 62 (5.4%) |
| $50,000 to $54,999 | 49 (4.5%) | 24 (2.1%) |
| $55,000 to $64,999 | 62 (5.7%) | 61 (5.3%) |
| $65,000 to $74,999 | 90 (8.2%) | 25 (2.2%) |
| $75,000 to $99,999 | 194 (17.8%) | 34 (3.0%) |
| $100,000+ | 41 (3.7%) | 10 (0.9%) |
| Total | 1,092 (100.0%) | 1,143 (100.0%) |
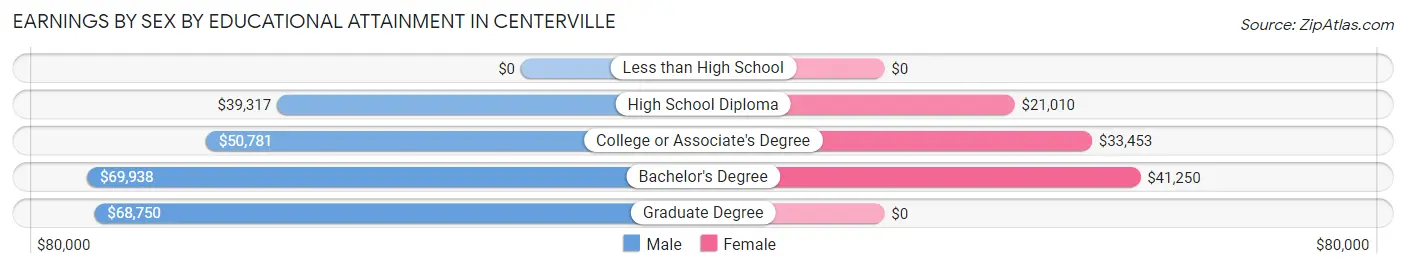
Earnings by Sex by Educational Attainment in Centerville
Average earnings in Centerville are $47,396 for men and $29,452 for women, a difference of 37.9%. Men with an educational attainment of bachelor's degree enjoy the highest average annual earnings of $69,938, while those with high school diploma education earn the least with $39,317. Women with an educational attainment of bachelor's degree earn the most with the average annual earnings of $41,250, while those with high school diploma education have the smallest earnings of $21,010.
| Educational Attainment | Male Income | Female Income |
| Less than High School | - | - |
| High School Diploma | $39,317 | $21,010 |
| College or Associate's Degree | $50,781 | $33,453 |
| Bachelor's Degree | $69,938 | $41,250 |
| Graduate Degree | $68,750 | $0 |
| Total | $47,396 | $29,452 |
Family Income in Centerville
Family Income Brackets in Centerville
According to the Centerville family income data, there are 299 families falling into the $35,000 to $49,999 income range, which is the most common income bracket and makes up 23.0% of all families. Conversely, the $200,000+ income bracket is the least frequent group with only 19 families (1.5%) belonging to this category.
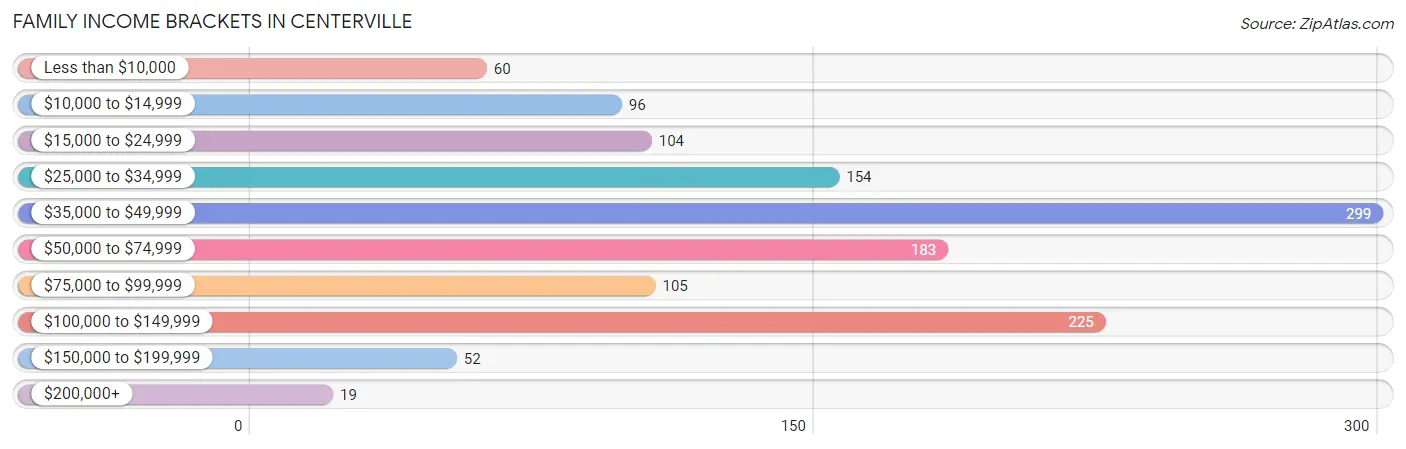
| Income Bracket | # Families | % Families |
| Less than $10,000 | 60 | 4.6% |
| $10,000 to $14,999 | 96 | 7.4% |
| $15,000 to $24,999 | 104 | 8.0% |
| $25,000 to $34,999 | 154 | 11.9% |
| $35,000 to $49,999 | 299 | 23.0% |
| $50,000 to $74,999 | 183 | 14.1% |
| $75,000 to $99,999 | 105 | 8.1% |
| $100,000 to $149,999 | 225 | 17.3% |
| $150,000 to $199,999 | 52 | 4.0% |
| $200,000+ | 19 | 1.5% |
Family Income by Famaliy Size in Centerville
2-person families (686 | 52.8%) account for the highest median family income in Centerville with $54,079 per family, while 2-person families (686 | 52.8%) have the highest median income of $27,040 per family member.
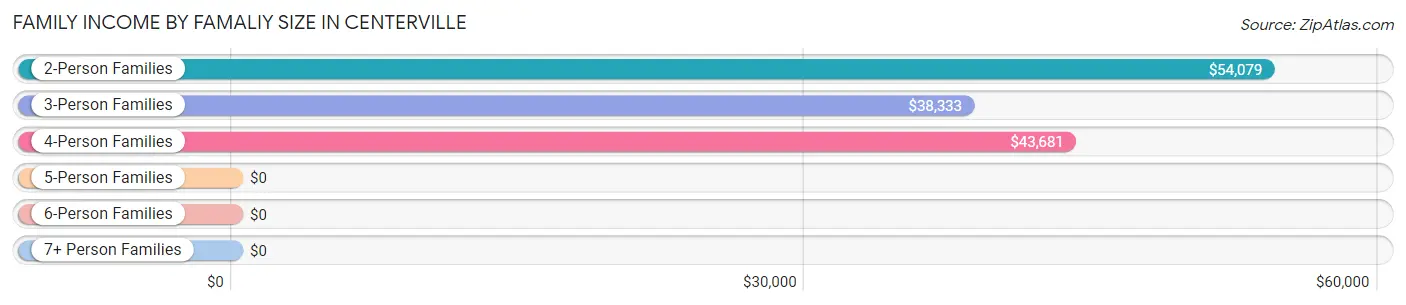
| Income Bracket | # Families | Median Income |
| 2-Person Families | 686 (52.8%) | $54,079 |
| 3-Person Families | 328 (25.3%) | $38,333 |
| 4-Person Families | 195 (15.0%) | $43,681 |
| 5-Person Families | 82 (6.3%) | $0 |
| 6-Person Families | 0 (0.0%) | $0 |
| 7+ Person Families | 7 (0.5%) | $0 |
| Total | 1,298 (100.0%) | $46,923 |
Family Income by Number of Earners in Centerville
The median family income in Centerville is $46,923, with families comprising 2 earners (446) having the highest median family income of $106,100, while families with no earners (361) have the lowest median family income of $18,926, accounting for 34.4% and 27.8% of families, respectively.
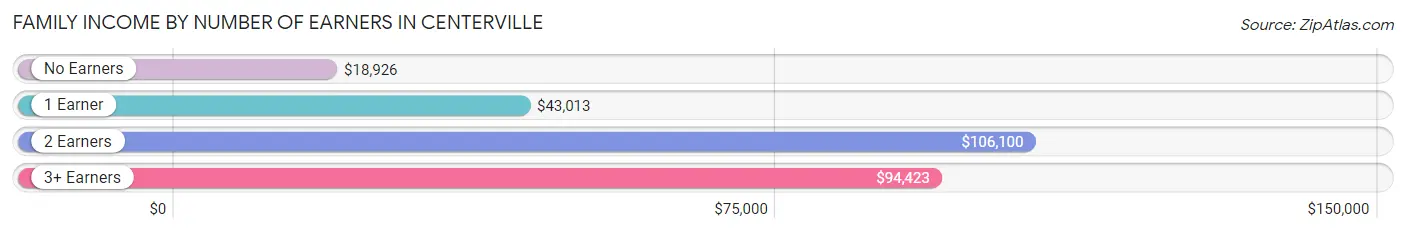
| Number of Earners | # Families | Median Income |
| No Earners | 361 (27.8%) | $18,926 |
| 1 Earner | 451 (34.7%) | $43,013 |
| 2 Earners | 446 (34.4%) | $106,100 |
| 3+ Earners | 40 (3.1%) | $94,423 |
| Total | 1,298 (100.0%) | $46,923 |
Household Income in Centerville
Household Income Brackets in Centerville
With 379 households falling in the category, the $35,000 to $49,999 income range is the most frequent in Centerville, accounting for 16.5% of all households. In contrast, only 18 households (0.8%) fall into the $200,000+ income bracket, making it the least populous group.
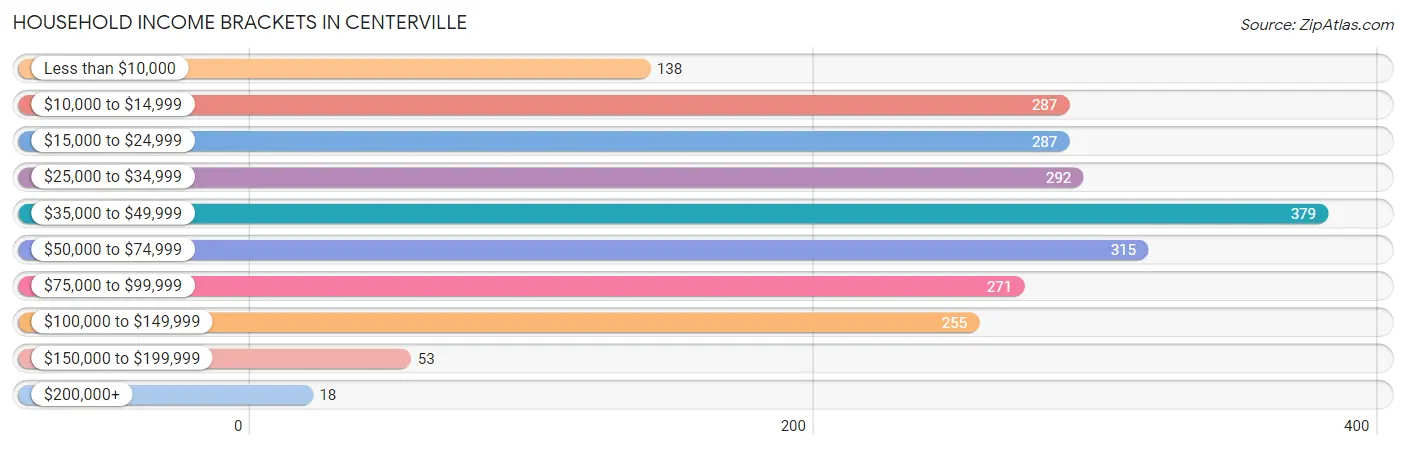
| Income Bracket | # Households | % Households |
| Less than $10,000 | 138 | 6.0% |
| $10,000 to $14,999 | 287 | 12.5% |
| $15,000 to $24,999 | 287 | 12.5% |
| $25,000 to $34,999 | 292 | 12.7% |
| $35,000 to $49,999 | 379 | 16.5% |
| $50,000 to $74,999 | 315 | 13.7% |
| $75,000 to $99,999 | 271 | 11.8% |
| $100,000 to $149,999 | 255 | 11.1% |
| $150,000 to $199,999 | 53 | 2.3% |
| $200,000+ | 18 | 0.8% |
Household Income by Householder Age in Centerville
The median household income in Centerville is $42,064, with the highest median household income of $56,855 found in the 25 to 44 years age bracket for the primary householder. A total of 590 households (25.7%) fall into this category. Meanwhile, the 15 to 24 years age bracket for the primary householder has the lowest median household income of $0, with 33 households (1.4%) in this group.
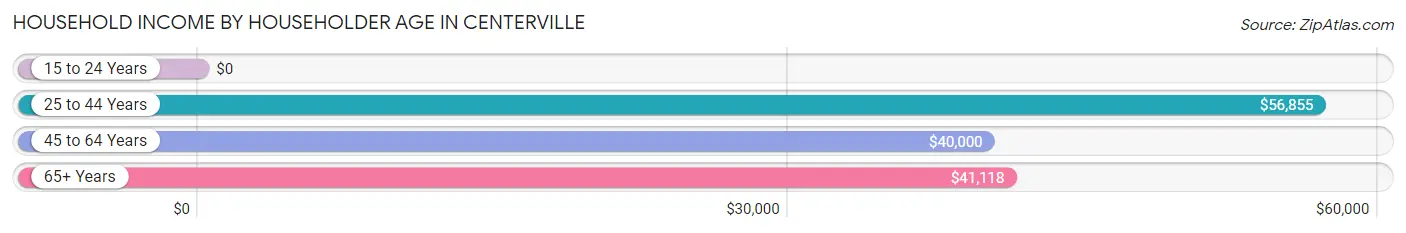
| Income Bracket | # Households | Median Income |
| 15 to 24 Years | 33 (1.4%) | $0 |
| 25 to 44 Years | 590 (25.7%) | $56,855 |
| 45 to 64 Years | 738 (32.1%) | $40,000 |
| 65+ Years | 938 (40.8%) | $41,118 |
| Total | 2,299 (100.0%) | $42,064 |
Poverty in Centerville
Income Below Poverty by Sex and Age in Centerville
With 25.9% poverty level for males and 24.6% for females among the residents of Centerville, 16 and 17 year old males and 5 year old females are the most vulnerable to poverty, with 12 males (100.0%) and 34 females (73.9%) in their respective age groups living below the poverty level.
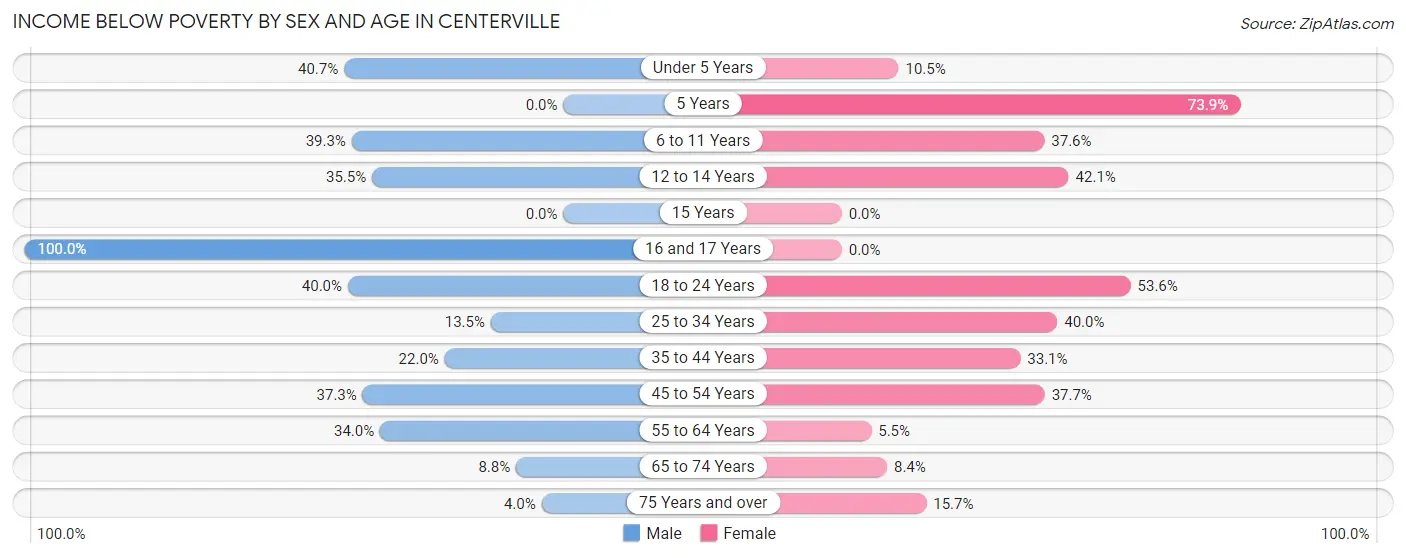
| Age Bracket | Male | Female |
| Under 5 Years | 46 (40.7%) | 10 (10.5%) |
| 5 Years | 0 (0.0%) | 34 (73.9%) |
| 6 to 11 Years | 88 (39.3%) | 94 (37.6%) |
| 12 to 14 Years | 49 (35.5%) | 40 (42.1%) |
| 15 Years | 0 (0.0%) | 0 (0.0%) |
| 16 and 17 Years | 12 (100.0%) | 0 (0.0%) |
| 18 to 24 Years | 94 (40.0%) | 52 (53.6%) |
| 25 to 34 Years | 26 (13.5%) | 100 (40.0%) |
| 35 to 44 Years | 87 (22.0%) | 114 (33.1%) |
| 45 to 54 Years | 98 (37.3%) | 116 (37.7%) |
| 55 to 64 Years | 131 (34.0%) | 24 (5.5%) |
| 65 to 74 Years | 28 (8.8%) | 32 (8.4%) |
| 75 Years and over | 9 (4.0%) | 48 (15.7%) |
| Total | 668 (25.9%) | 664 (24.6%) |
Income Above Poverty by Sex and Age in Centerville
According to the poverty statistics in Centerville, males aged 5 years and females aged 15 years are the age groups that are most secure financially, with 100.0% of males and 100.0% of females in these age groups living above the poverty line.
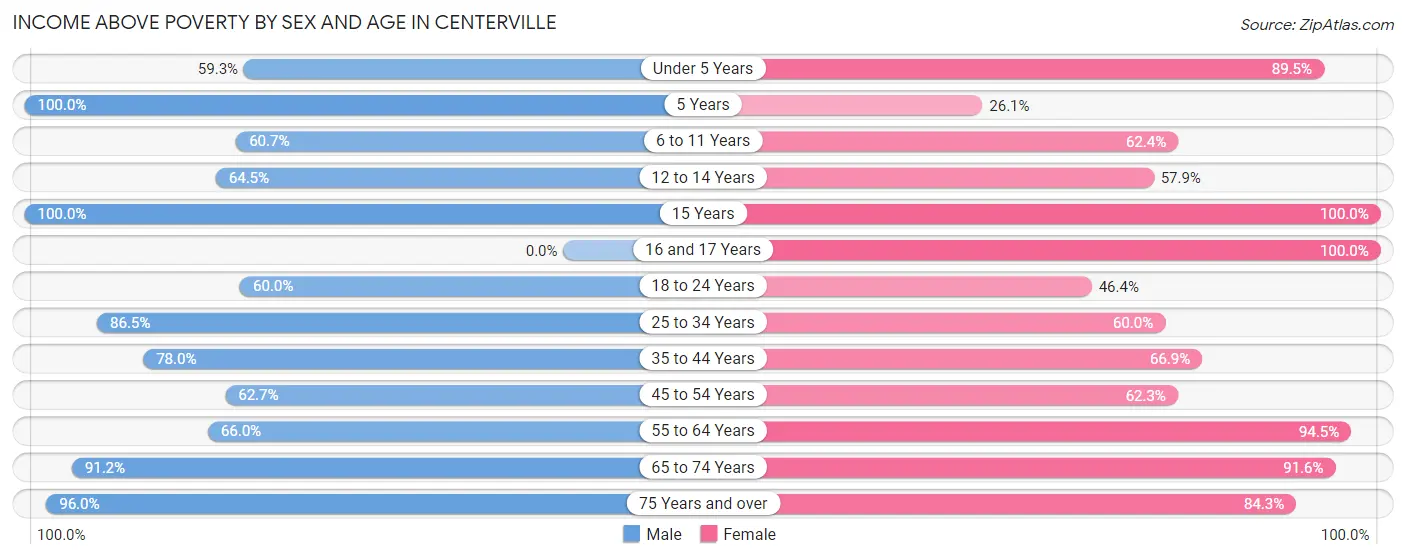
| Age Bracket | Male | Female |
| Under 5 Years | 67 (59.3%) | 85 (89.5%) |
| 5 Years | 25 (100.0%) | 12 (26.1%) |
| 6 to 11 Years | 136 (60.7%) | 156 (62.4%) |
| 12 to 14 Years | 89 (64.5%) | 55 (57.9%) |
| 15 Years | 50 (100.0%) | 33 (100.0%) |
| 16 and 17 Years | 0 (0.0%) | 53 (100.0%) |
| 18 to 24 Years | 141 (60.0%) | 45 (46.4%) |
| 25 to 34 Years | 167 (86.5%) | 150 (60.0%) |
| 35 to 44 Years | 308 (78.0%) | 230 (66.9%) |
| 45 to 54 Years | 165 (62.7%) | 192 (62.3%) |
| 55 to 64 Years | 254 (66.0%) | 415 (94.5%) |
| 65 to 74 Years | 291 (91.2%) | 349 (91.6%) |
| 75 Years and over | 214 (96.0%) | 258 (84.3%) |
| Total | 1,907 (74.1%) | 2,033 (75.4%) |
Income Below Poverty Among Married-Couple Families in Centerville
The poverty statistics for married-couple families in Centerville show that 17.1% or 160 of the total 938 families live below the poverty line. Families with 1 or 2 children have the highest poverty rate of 45.7%, comprising of 118 families. On the other hand, families with 3 or 4 children have the lowest poverty rate of 0.0%, which includes 0 families.
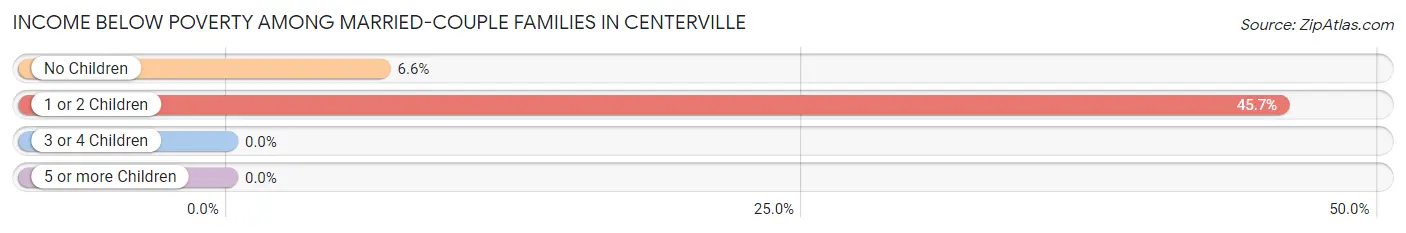
| Children | Above Poverty | Below Poverty |
| No Children | 591 (93.4%) | 42 (6.6%) |
| 1 or 2 Children | 140 (54.3%) | 118 (45.7%) |
| 3 or 4 Children | 47 (100.0%) | 0 (0.0%) |
| 5 or more Children | 0 (0.0%) | 0 (0.0%) |
| Total | 778 (82.9%) | 160 (17.1%) |
Income Below Poverty Among Single-Parent Households in Centerville
According to the poverty data in Centerville, 9.2% or 7 single-father households and 26.1% or 74 single-mother households are living below the poverty line. Among single-father households, those with no children have the highest poverty rate, with 7 households (24.1%) experiencing poverty. Likewise, among single-mother households, those with 3 or 4 children have the highest poverty rate, with 24 households (100.0%) falling below the poverty line.
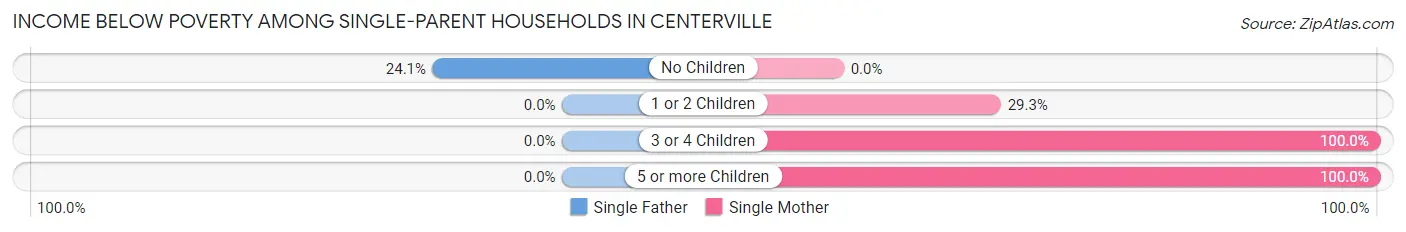
| Children | Single Father | Single Mother |
| No Children | 7 (24.1%) | 0 (0.0%) |
| 1 or 2 Children | 0 (0.0%) | 43 (29.2%) |
| 3 or 4 Children | 0 (0.0%) | 24 (100.0%) |
| 5 or more Children | 0 (0.0%) | 7 (100.0%) |
| Total | 7 (9.2%) | 74 (26.1%) |
Income Below Poverty Among Married-Couple vs Single-Parent Households in Centerville
The poverty data for Centerville shows that 160 of the married-couple family households (17.1%) and 81 of the single-parent households (22.5%) are living below the poverty level. Within the married-couple family households, those with 1 or 2 children have the highest poverty rate, with 118 households (45.7%) falling below the poverty line. Among the single-parent households, those with 3 or 4 children have the highest poverty rate, with 24 household (100.0%) living below poverty.
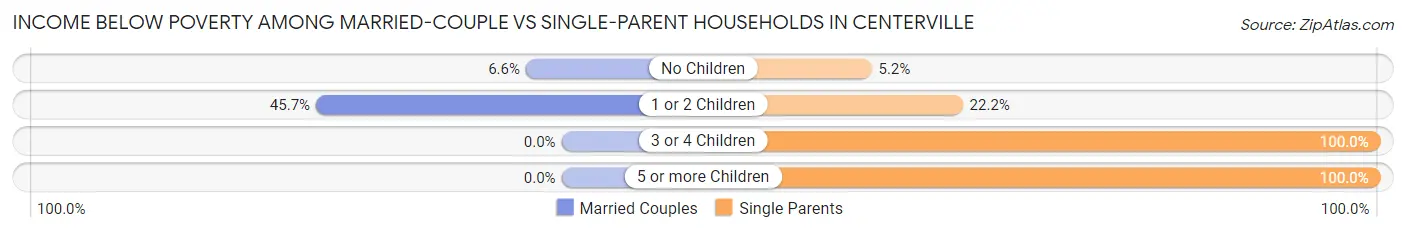
| Children | Married-Couple Families | Single-Parent Households |
| No Children | 42 (6.6%) | 7 (5.2%) |
| 1 or 2 Children | 118 (45.7%) | 43 (22.2%) |
| 3 or 4 Children | 0 (0.0%) | 24 (100.0%) |
| 5 or more Children | 0 (0.0%) | 7 (100.0%) |
| Total | 160 (17.1%) | 81 (22.5%) |
Race in Centerville
The most populous races in Centerville are White / Caucasian (5,017 | 93.0%), Two or more Races (349 | 6.5%), and Hispanic or Latino (242 | 4.5%).
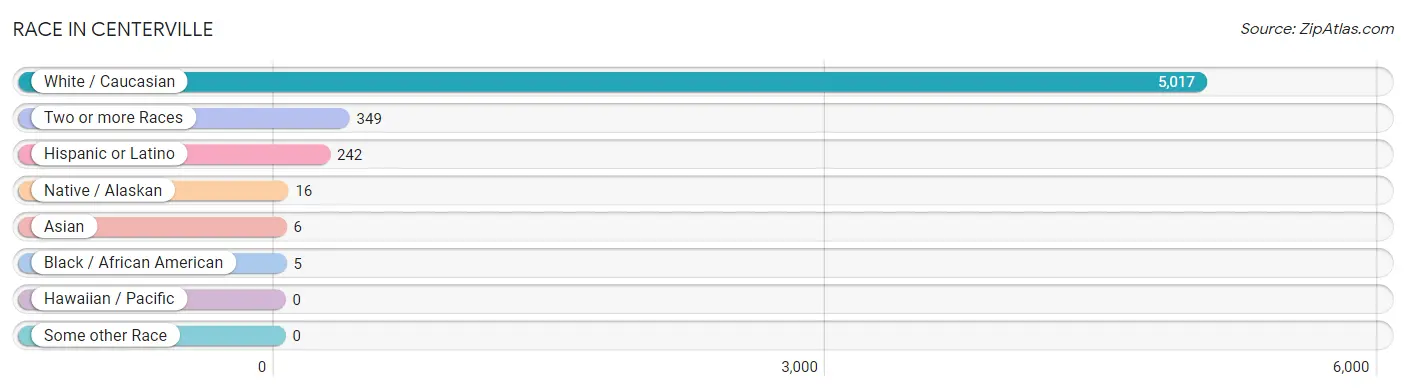
| Race | # Population | % Population |
| Asian | 6 | 0.1% |
| Black / African American | 5 | 0.1% |
| Hawaiian / Pacific | 0 | 0.0% |
| Hispanic or Latino | 242 | 4.5% |
| Native / Alaskan | 16 | 0.3% |
| White / Caucasian | 5,017 | 93.0% |
| Two or more Races | 349 | 6.5% |
| Some other Race | 0 | 0.0% |
| Total | 5,393 | 100.0% |
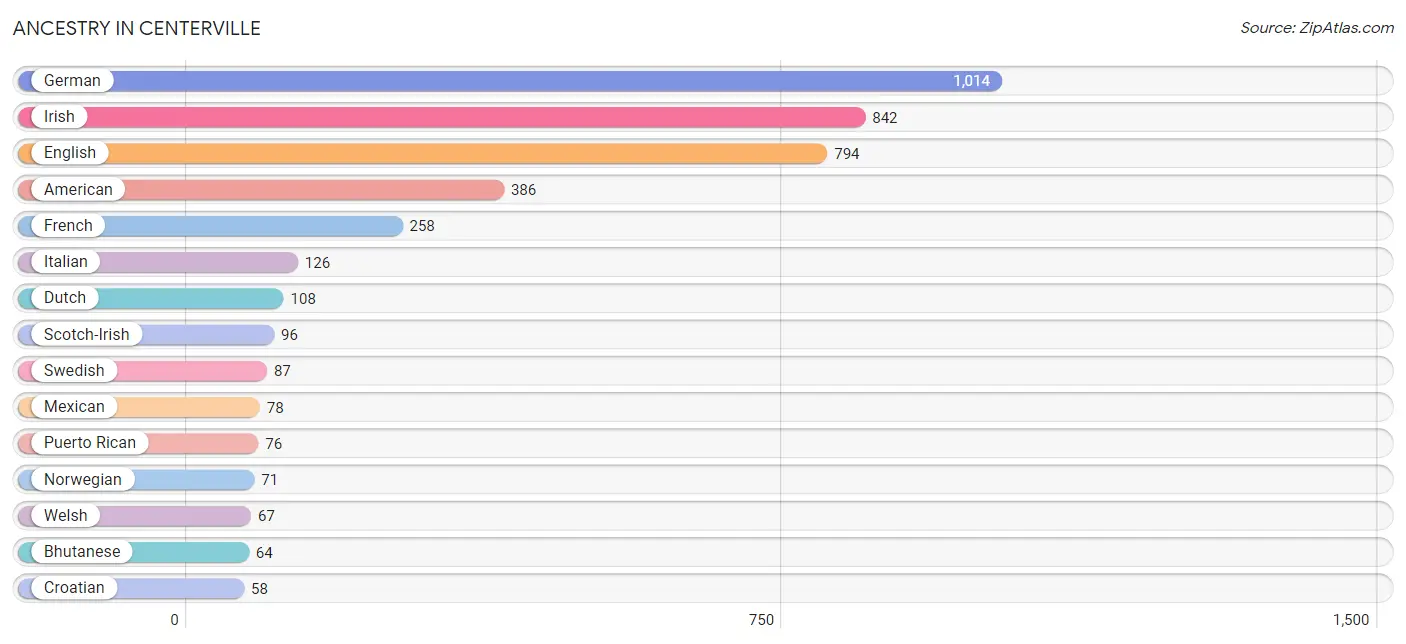
Ancestry in Centerville
The most populous ancestries reported in Centerville are German (1,014 | 18.8%), Irish (842 | 15.6%), English (794 | 14.7%), American (386 | 7.2%), and French (258 | 4.8%), together accounting for 61.1% of all Centerville residents.
| Ancestry | # Population | % Population |
| American | 386 | 7.2% |
| Apache | 16 | 0.3% |
| Bhutanese | 64 | 1.2% |
| British | 11 | 0.2% |
| Central American | 42 | 0.8% |
| Cherokee | 16 | 0.3% |
| Croatian | 58 | 1.1% |
| Czech | 33 | 0.6% |
| Dutch | 108 | 2.0% |
| English | 794 | 14.7% |
| European | 47 | 0.9% |
| French | 258 | 4.8% |
| French Canadian | 6 | 0.1% |
| German | 1,014 | 18.8% |
| Iranian | 26 | 0.5% |
| Irish | 842 | 15.6% |
| Italian | 126 | 2.3% |
| Korean | 19 | 0.4% |
| Mexican | 78 | 1.5% |
| Norwegian | 71 | 1.3% |
| Polish | 33 | 0.6% |
| Portuguese | 9 | 0.2% |
| Puerto Rican | 76 | 1.4% |
| Russian | 8 | 0.2% |
| Salvadoran | 42 | 0.8% |
| Scotch-Irish | 96 | 1.8% |
| Scottish | 41 | 0.8% |
| Spaniard | 46 | 0.9% |
| Swedish | 87 | 1.6% |
| Welsh | 67 | 1.2% | View All 30 Rows |
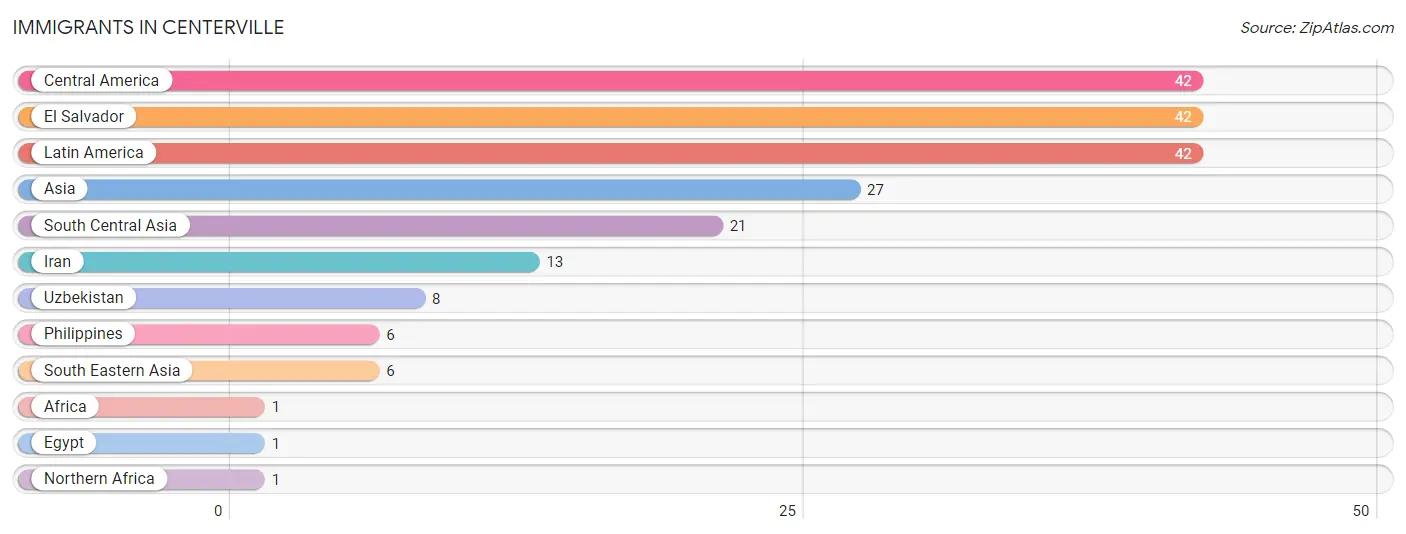
Immigrants in Centerville
The most numerous immigrant groups reported in Centerville came from Central America (42 | 0.8%), El Salvador (42 | 0.8%), Latin America (42 | 0.8%), Asia (27 | 0.5%), and South Central Asia (21 | 0.4%), together accounting for 3.2% of all Centerville residents.
| Immigration Origin | # Population | % Population |
| Africa | 1 | 0.0% |
| Asia | 27 | 0.5% |
| Central America | 42 | 0.8% |
| Egypt | 1 | 0.0% |
| El Salvador | 42 | 0.8% |
| Iran | 13 | 0.2% |
| Latin America | 42 | 0.8% |
| Northern Africa | 1 | 0.0% |
| Philippines | 6 | 0.1% |
| South Central Asia | 21 | 0.4% |
| South Eastern Asia | 6 | 0.1% |
| Uzbekistan | 8 | 0.2% | View All 12 Rows |
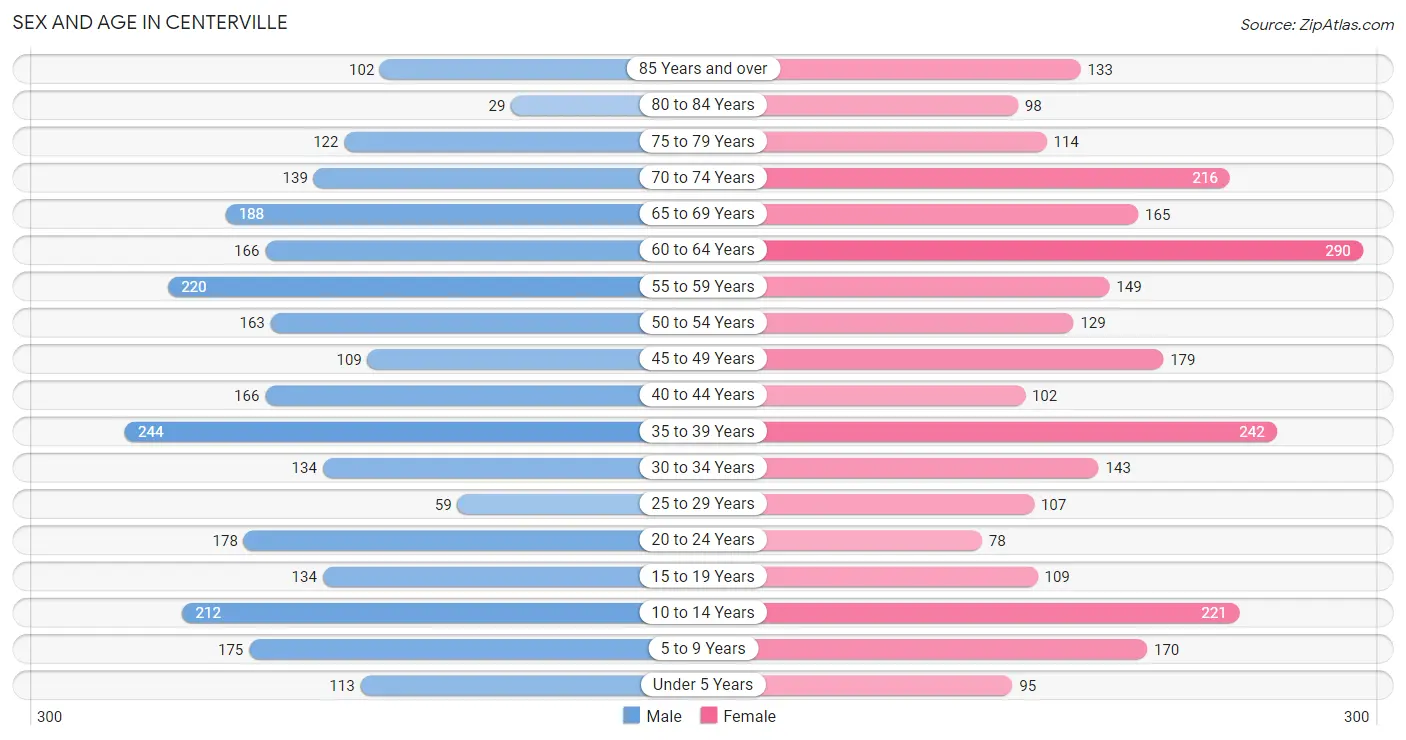
Sex and Age in Centerville
Sex and Age in Centerville
The most populous age groups in Centerville are 35 to 39 Years (244 | 9.2%) for men and 60 to 64 Years (290 | 10.6%) for women.
| Age Bracket | Male | Female |
| Under 5 Years | 113 (4.3%) | 95 (3.5%) |
| 5 to 9 Years | 175 (6.6%) | 170 (6.2%) |
| 10 to 14 Years | 212 (8.0%) | 221 (8.1%) |
| 15 to 19 Years | 134 (5.1%) | 109 (4.0%) |
| 20 to 24 Years | 178 (6.7%) | 78 (2.9%) |
| 25 to 29 Years | 59 (2.2%) | 107 (3.9%) |
| 30 to 34 Years | 134 (5.1%) | 143 (5.2%) |
| 35 to 39 Years | 244 (9.2%) | 242 (8.8%) |
| 40 to 44 Years | 166 (6.3%) | 102 (3.7%) |
| 45 to 49 Years | 109 (4.1%) | 179 (6.5%) |
| 50 to 54 Years | 163 (6.1%) | 129 (4.7%) |
| 55 to 59 Years | 220 (8.3%) | 149 (5.4%) |
| 60 to 64 Years | 166 (6.3%) | 290 (10.6%) |
| 65 to 69 Years | 188 (7.1%) | 165 (6.0%) |
| 70 to 74 Years | 139 (5.2%) | 216 (7.9%) |
| 75 to 79 Years | 122 (4.6%) | 114 (4.2%) |
| 80 to 84 Years | 29 (1.1%) | 98 (3.6%) |
| 85 Years and over | 102 (3.8%) | 133 (4.9%) |
| Total | 2,653 (100.0%) | 2,740 (100.0%) |
Families and Households in Centerville
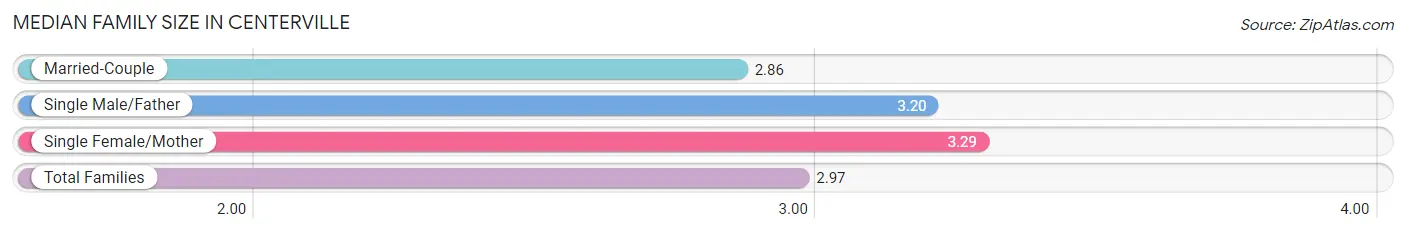
Median Family Size in Centerville
The median family size in Centerville is 2.97 persons per family, with single female/mother families (284 | 21.9%) accounting for the largest median family size of 3.29 persons per family. On the other hand, married-couple families (938 | 72.3%) represent the smallest median family size with 2.86 persons per family.
| Family Type | # Families | Family Size |
| Married-Couple | 938 (72.3%) | 2.86 |
| Single Male/Father | 76 (5.9%) | 3.20 |
| Single Female/Mother | 284 (21.9%) | 3.29 |
| Total Families | 1,298 (100.0%) | 2.97 |
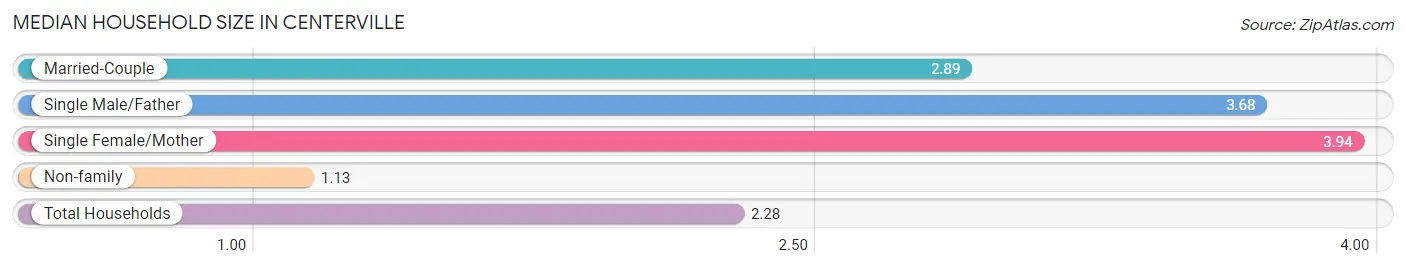
Median Household Size in Centerville
The median household size in Centerville is 2.28 persons per household, with single female/mother households (284 | 12.3%) accounting for the largest median household size of 3.94 persons per household. non-family households (1,001 | 43.5%) represent the smallest median household size with 1.13 persons per household.
| Household Type | # Households | Household Size |
| Married-Couple | 938 (40.8%) | 2.89 |
| Single Male/Father | 76 (3.3%) | 3.68 |
| Single Female/Mother | 284 (12.3%) | 3.94 |
| Non-family | 1,001 (43.5%) | 1.13 |
| Total Households | 2,299 (100.0%) | 2.28 |
Household Size by Marriage Status in Centerville
Out of a total of 2,299 households in Centerville, 1,298 (56.5%) are family households, while 1,001 (43.5%) are nonfamily households. The most numerous type of family households are 2-person households, comprising 602, and the most common type of nonfamily households are 1-person households, comprising 912.
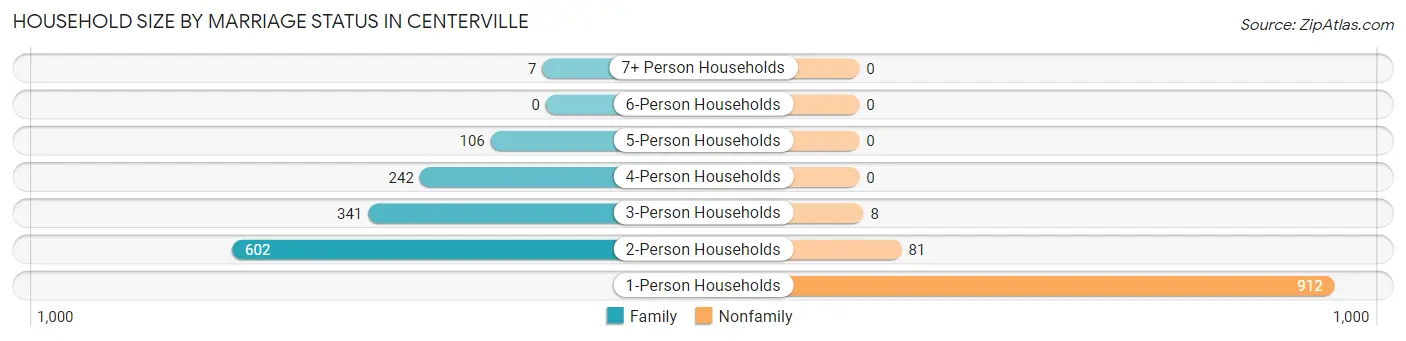
| Household Size | Family Households | Nonfamily Households |
| 1-Person Households | - | 912 (39.7%) |
| 2-Person Households | 602 (26.2%) | 81 (3.5%) |
| 3-Person Households | 341 (14.8%) | 8 (0.4%) |
| 4-Person Households | 242 (10.5%) | 0 (0.0%) |
| 5-Person Households | 106 (4.6%) | 0 (0.0%) |
| 6-Person Households | 0 (0.0%) | 0 (0.0%) |
| 7+ Person Households | 7 (0.3%) | 0 (0.0%) |
| Total | 1,298 (56.5%) | 1,001 (43.5%) |
Female Fertility in Centerville
Fertility by Age in Centerville
Average fertility rate in Centerville is 34.0 births per 1,000 women. Women in the age bracket of 20 to 34 years have the highest fertility rate with 104.0 births per 1,000 women. Women in the age bracket of 20 to 34 years acount for 100.0% of all women with births.
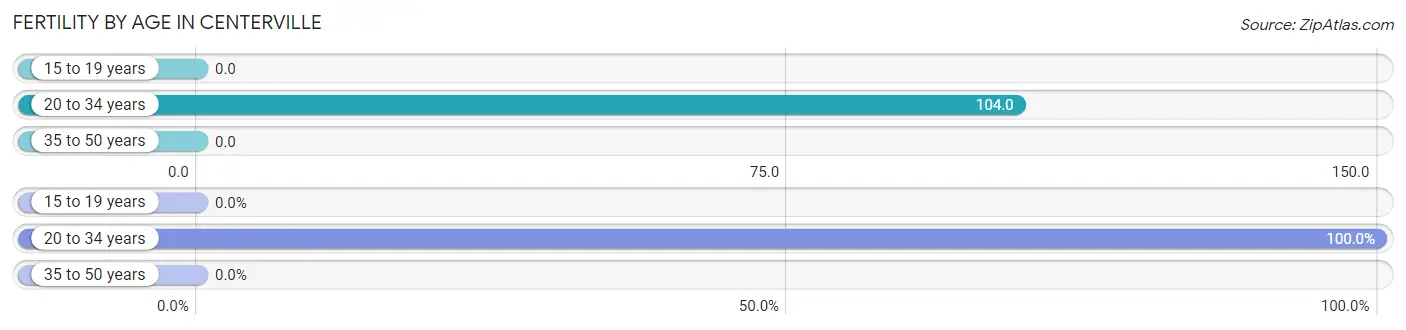
| Age Bracket | Women with Births | Births / 1,000 Women |
| 15 to 19 years | 0 (0.0%) | 0.0 |
| 20 to 34 years | 34 (100.0%) | 104.0 |
| 35 to 50 years | 0 (0.0%) | 0.0 |
| Total | 34 (100.0%) | 34.0 |
Fertility by Age by Marriage Status in Centerville

| Age Bracket | Married | Unmarried |
| 15 to 19 years | 0 (0.0%) | 0 (0.0%) |
| 20 to 34 years | 34 (100.0%) | 0 (0.0%) |
| 35 to 50 years | 0 (0.0%) | 0 (0.0%) |
| Total | 34 (100.0%) | 0 (0.0%) |
Fertility by Education in Centerville
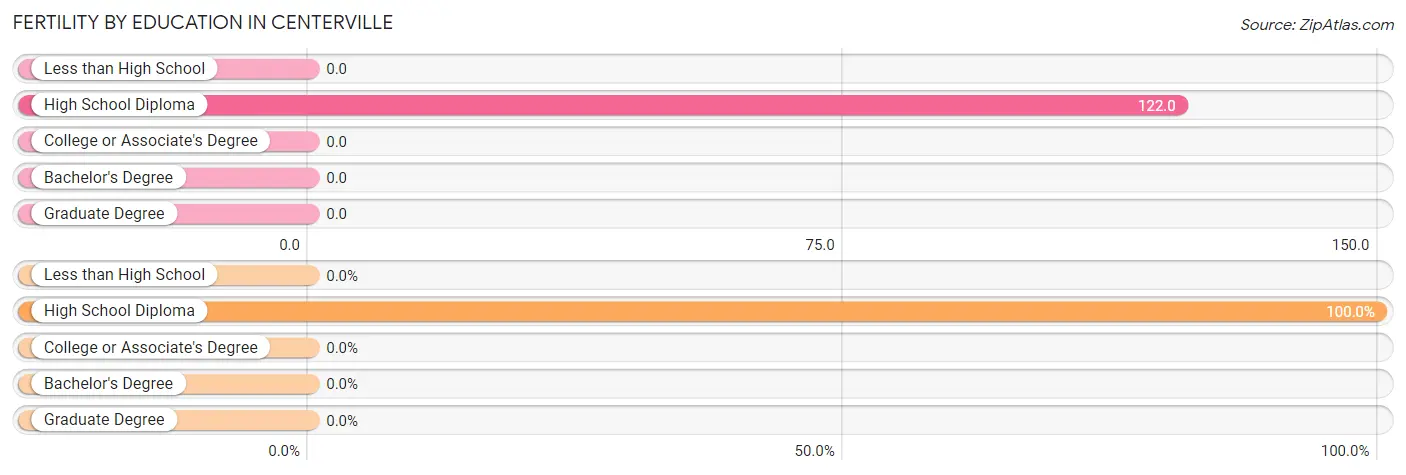
| Educational Attainment | Women with Births | Births / 1,000 Women |
| Less than High School | 0 (0.0%) | 0.0 |
| High School Diploma | 34 (100.0%) | 122.0 |
| College or Associate's Degree | 0 (0.0%) | 0.0 |
| Bachelor's Degree | 0 (0.0%) | 0.0 |
| Graduate Degree | 0 (0.0%) | 0.0 |
| Total | 34 (100.0%) | 34.0 |
Fertility by Education by Marriage Status in Centerville
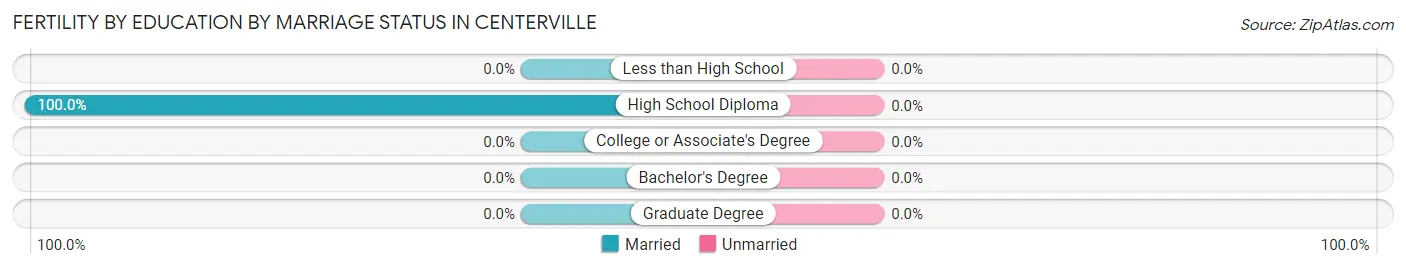
| Educational Attainment | Married | Unmarried |
| Less than High School | 0 (0.0%) | 0 (0.0%) |
| High School Diploma | 34 (100.0%) | 0 (0.0%) |
| College or Associate's Degree | 0 (0.0%) | 0 (0.0%) |
| Bachelor's Degree | 0 (0.0%) | 0 (0.0%) |
| Graduate Degree | 0 (0.0%) | 0 (0.0%) |
| Total | 34 (100.0%) | 0 (0.0%) |
Employment Characteristics in Centerville
Employment by Class of Employer in Centerville
Among the 1,991 employed individuals in Centerville, private company employees (1,357 | 68.2%), not-for-profit organizations (189 | 9.5%), and local government employees (138 | 6.9%) make up the most common classes of employment.
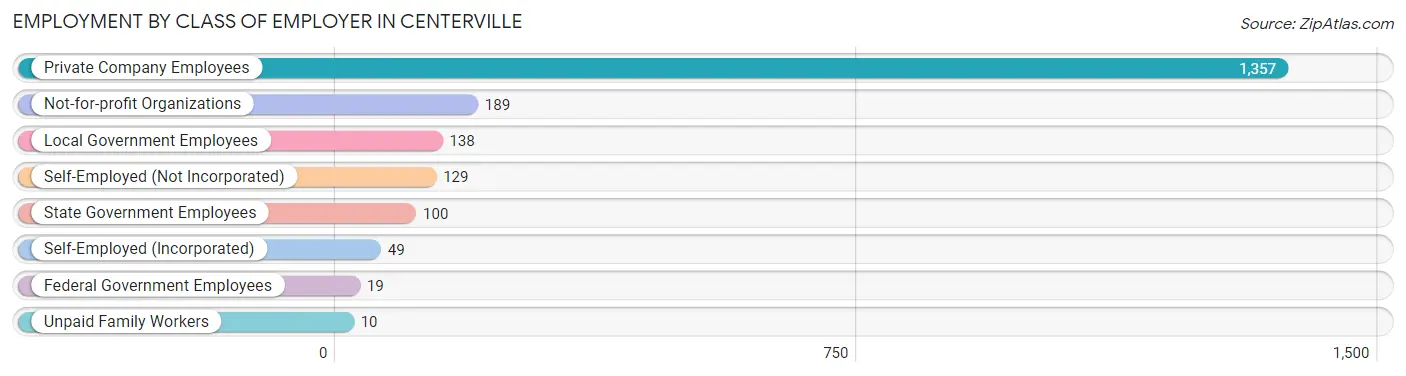
| Employer Class | # Employees | % Employees |
| Private Company Employees | 1,357 | 68.2% |
| Self-Employed (Incorporated) | 49 | 2.5% |
| Self-Employed (Not Incorporated) | 129 | 6.5% |
| Not-for-profit Organizations | 189 | 9.5% |
| Local Government Employees | 138 | 6.9% |
| State Government Employees | 100 | 5.0% |
| Federal Government Employees | 19 | 0.9% |
| Unpaid Family Workers | 10 | 0.5% |
| Total | 1,991 | 100.0% |
Employment Status by Age in Centerville
According to the labor force statistics for Centerville, out of the total population over 16 years of age (4,324), 50.7% or 2,192 individuals are in the labor force, with 8.8% or 193 of them unemployed. The age group with the highest labor force participation rate is 30 to 34 years, with 86.3% or 239 individuals in the labor force. Within the labor force, the 55 to 59 years age range has the highest percentage of unemployed individuals, with 29.6% or 61 of them being unemployed.
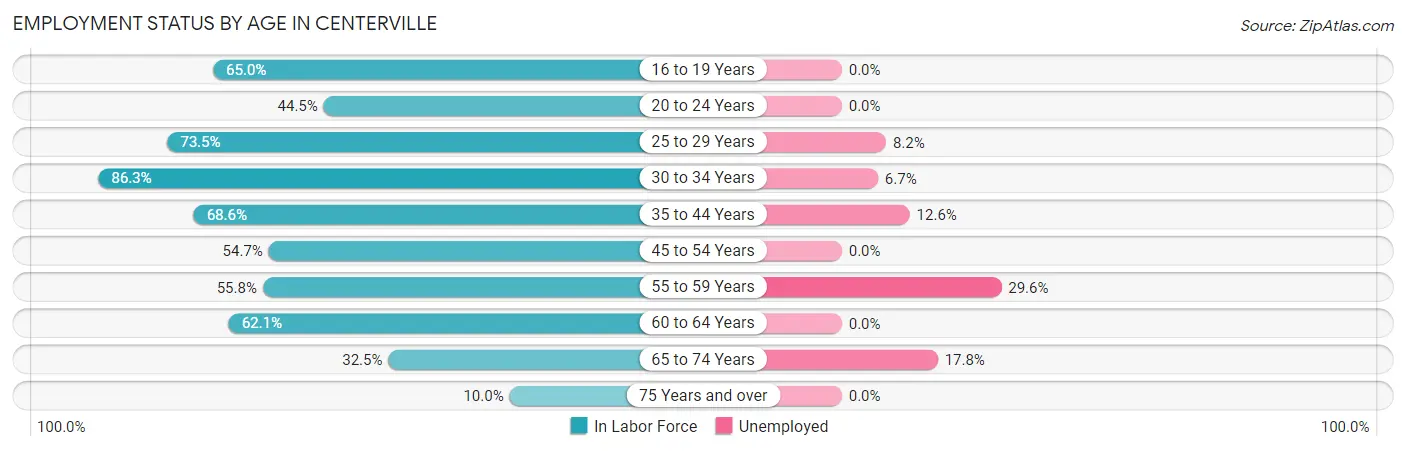
| Age Bracket | In Labor Force | Unemployed |
| 16 to 19 Years | 104 (65.0%) | 0 (0.0%) |
| 20 to 24 Years | 114 (44.5%) | 0 (0.0%) |
| 25 to 29 Years | 122 (73.5%) | 10 (8.2%) |
| 30 to 34 Years | 239 (86.3%) | 16 (6.7%) |
| 35 to 44 Years | 517 (68.6%) | 65 (12.6%) |
| 45 to 54 Years | 317 (54.7%) | 0 (0.0%) |
| 55 to 59 Years | 206 (55.8%) | 61 (29.6%) |
| 60 to 64 Years | 283 (62.1%) | 0 (0.0%) |
| 65 to 74 Years | 230 (32.5%) | 41 (17.8%) |
| 75 Years and over | 60 (10.0%) | 0 (0.0%) |
| Total | 2,192 (50.7%) | 193 (8.8%) |
Employment Status by Educational Attainment in Centerville
According to labor force statistics for Centerville, 64.7% of individuals (1,683) out of the total population between 25 and 64 years of age (2,602) are in the labor force, with 9.0% or 151 of them being unemployed. The group with the highest labor force participation rate are those with the educational attainment of bachelor's degree or higher, with 93.6% or 234 individuals in the labor force. Within the labor force, individuals with less than high school education have the highest percentage of unemployment, with 16.9% or 10 of them being unemployed.
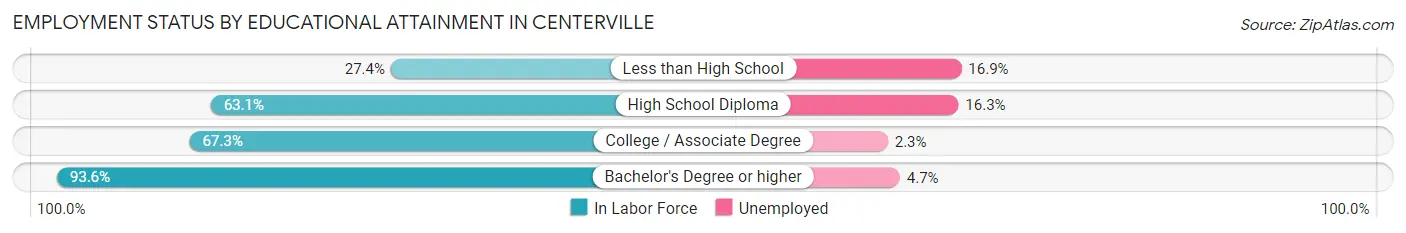
| Educational Attainment | In Labor Force | Unemployed |
| Less than High School | 59 (27.4%) | 36 (16.9%) |
| High School Diploma | 704 (63.1%) | 182 (16.3%) |
| College / Associate Degree | 687 (67.3%) | 23 (2.3%) |
| Bachelor's Degree or higher | 234 (93.6%) | 12 (4.7%) |
| Total | 1,683 (64.7%) | 234 (9.0%) |
Employment Occupations by Sex in Centerville
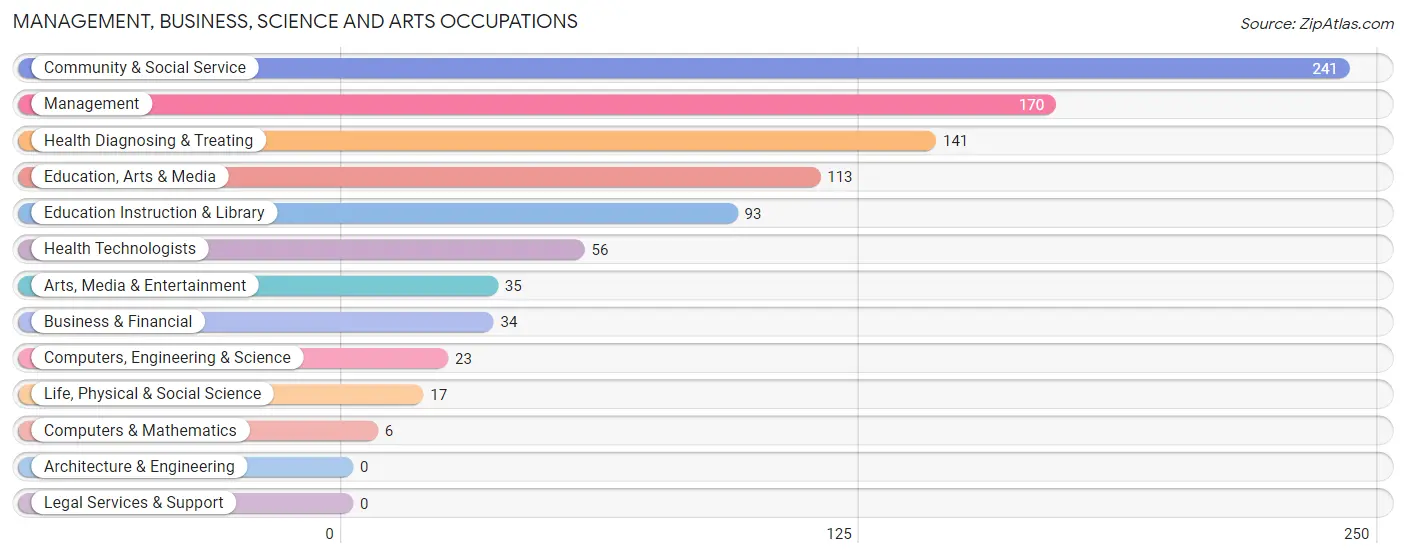
Management, Business, Science and Arts Occupations
The most common Management, Business, Science and Arts occupations in Centerville are Community & Social Service (241 | 12.1%), Management (170 | 8.5%), Health Diagnosing & Treating (141 | 7.0%), Education, Arts & Media (113 | 5.7%), and Education Instruction & Library (93 | 4.6%).
Management, Business, Science and Arts Occupations by Sex
Within the Management, Business, Science and Arts occupations in Centerville, the most male-oriented occupations are Life, Physical & Social Science (100.0%), Computers, Engineering & Science (73.9%), and Management (67.6%), while the most female-oriented occupations are Computers & Mathematics (100.0%), Education Instruction & Library (100.0%), and Health Diagnosing & Treating (100.0%).
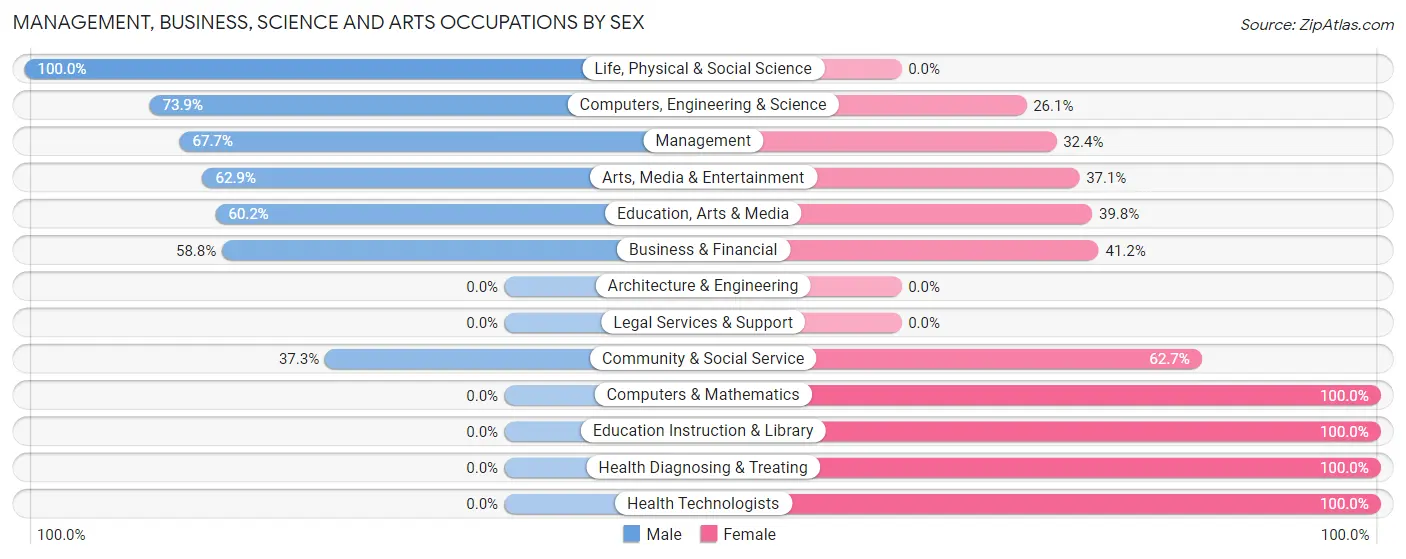
| Occupation | Male | Female |
| Management | 115 (67.6%) | 55 (32.4%) |
| Business & Financial | 20 (58.8%) | 14 (41.2%) |
| Computers, Engineering & Science | 17 (73.9%) | 6 (26.1%) |
| Computers & Mathematics | 0 (0.0%) | 6 (100.0%) |
| Architecture & Engineering | 0 (0.0%) | 0 (0.0%) |
| Life, Physical & Social Science | 17 (100.0%) | 0 (0.0%) |
| Community & Social Service | 90 (37.3%) | 151 (62.7%) |
| Education, Arts & Media | 68 (60.2%) | 45 (39.8%) |
| Legal Services & Support | 0 (0.0%) | 0 (0.0%) |
| Education Instruction & Library | 0 (0.0%) | 93 (100.0%) |
| Arts, Media & Entertainment | 22 (62.9%) | 13 (37.1%) |
| Health Diagnosing & Treating | 0 (0.0%) | 141 (100.0%) |
| Health Technologists | 0 (0.0%) | 56 (100.0%) |
| Total (Category) | 242 (39.7%) | 367 (60.3%) |
| Total (Overall) | 927 (46.4%) | 1,072 (53.6%) |
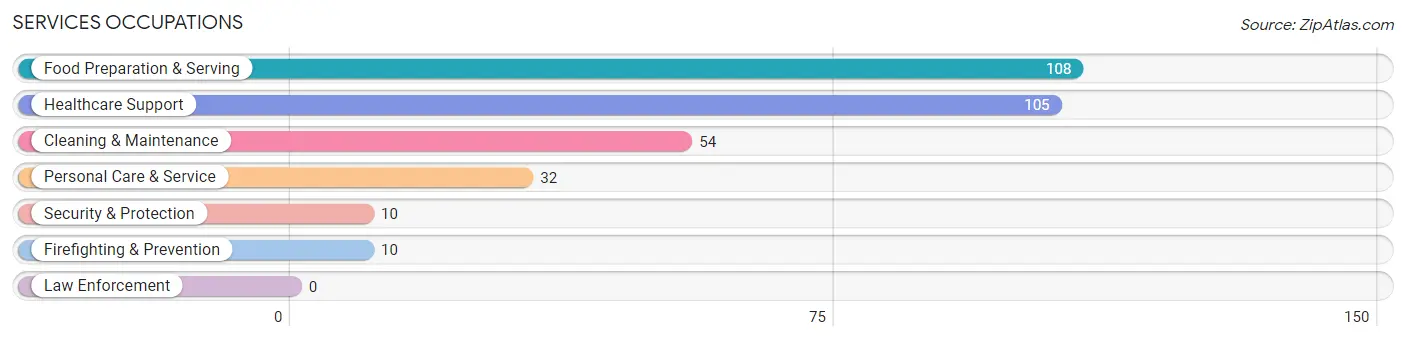
Services Occupations
The most common Services occupations in Centerville are Food Preparation & Serving (108 | 5.4%), Healthcare Support (105 | 5.2%), Cleaning & Maintenance (54 | 2.7%), Personal Care & Service (32 | 1.6%), and Security & Protection (10 | 0.5%).
Services Occupations by Sex
Within the Services occupations in Centerville, the most male-oriented occupations are Cleaning & Maintenance (88.9%), Food Preparation & Serving (23.2%), and Healthcare Support (14.3%), while the most female-oriented occupations are Security & Protection (100.0%), Firefighting & Prevention (100.0%), and Personal Care & Service (100.0%).
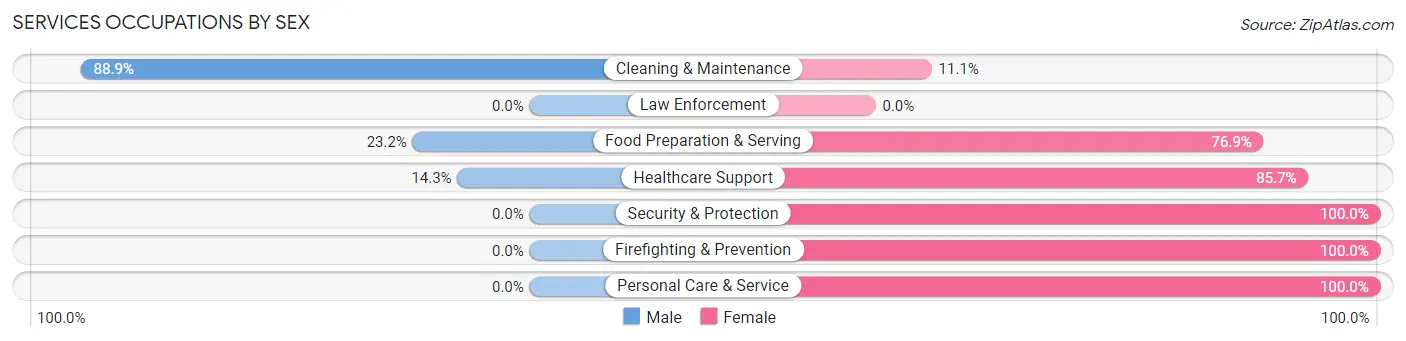
| Occupation | Male | Female |
| Healthcare Support | 15 (14.3%) | 90 (85.7%) |
| Security & Protection | 0 (0.0%) | 10 (100.0%) |
| Firefighting & Prevention | 0 (0.0%) | 10 (100.0%) |
| Law Enforcement | 0 (0.0%) | 0 (0.0%) |
| Food Preparation & Serving | 25 (23.2%) | 83 (76.8%) |
| Cleaning & Maintenance | 48 (88.9%) | 6 (11.1%) |
| Personal Care & Service | 0 (0.0%) | 32 (100.0%) |
| Total (Category) | 88 (28.5%) | 221 (71.5%) |
| Total (Overall) | 927 (46.4%) | 1,072 (53.6%) |
Sales and Office Occupations
The most common Sales and Office occupations in Centerville are Office & Administration (353 | 17.7%), and Sales & Related (173 | 8.6%).

Sales and Office Occupations by Sex

| Occupation | Male | Female |
| Sales & Related | 67 (38.7%) | 106 (61.3%) |
| Office & Administration | 68 (19.3%) | 285 (80.7%) |
| Total (Category) | 135 (25.7%) | 391 (74.3%) |
| Total (Overall) | 927 (46.4%) | 1,072 (53.6%) |
Natural Resources, Construction and Maintenance Occupations
The most common Natural Resources, Construction and Maintenance occupations in Centerville are Construction & Extraction (135 | 6.8%), and Installation, Maintenance & Repair (21 | 1.1%).

Natural Resources, Construction and Maintenance Occupations by Sex

| Occupation | Male | Female |
| Farming, Fishing & Forestry | 0 (0.0%) | 0 (0.0%) |
| Construction & Extraction | 135 (100.0%) | 0 (0.0%) |
| Installation, Maintenance & Repair | 21 (100.0%) | 0 (0.0%) |
| Total (Category) | 156 (100.0%) | 0 (0.0%) |
| Total (Overall) | 927 (46.4%) | 1,072 (53.6%) |
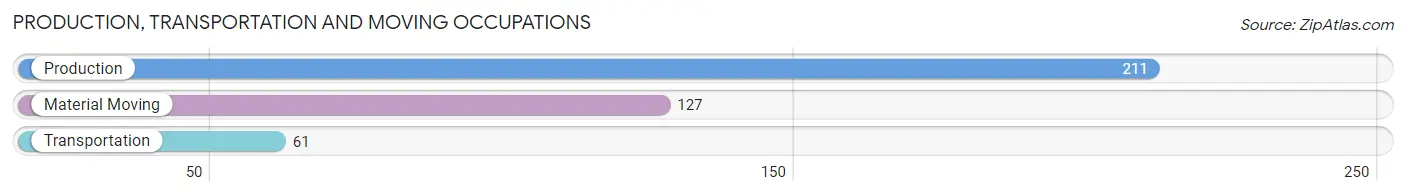
Production, Transportation and Moving Occupations
The most common Production, Transportation and Moving occupations in Centerville are Production (211 | 10.6%), Material Moving (127 | 6.4%), and Transportation (61 | 3.0%).
Production, Transportation and Moving Occupations by Sex
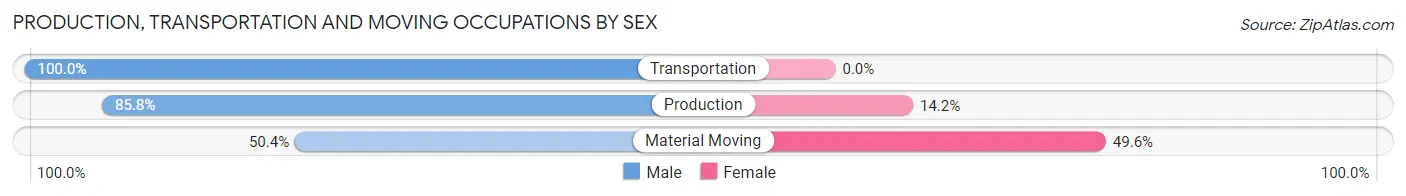
| Occupation | Male | Female |
| Production | 181 (85.8%) | 30 (14.2%) |
| Transportation | 61 (100.0%) | 0 (0.0%) |
| Material Moving | 64 (50.4%) | 63 (49.6%) |
| Total (Category) | 306 (76.7%) | 93 (23.3%) |
| Total (Overall) | 927 (46.4%) | 1,072 (53.6%) |
Employment Industries by Sex in Centerville
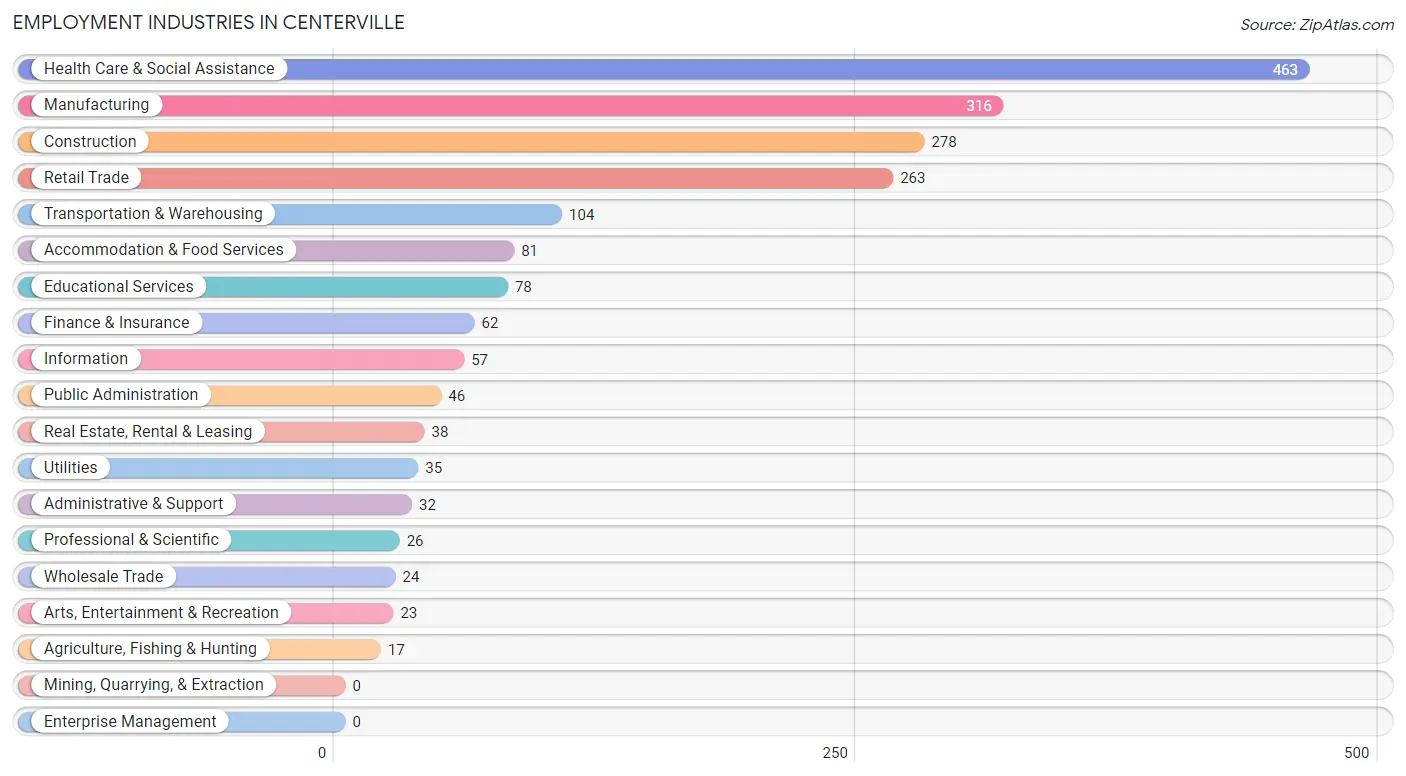
Employment Industries in Centerville
The major employment industries in Centerville include Health Care & Social Assistance (463 | 23.2%), Manufacturing (316 | 15.8%), Construction (278 | 13.9%), Retail Trade (263 | 13.2%), and Transportation & Warehousing (104 | 5.2%).
Employment Industries by Sex in Centerville
The Centerville industries that see more men than women are Agriculture, Fishing & Hunting (100.0%), Wholesale Trade (100.0%), and Finance & Insurance (100.0%), whereas the industries that tend to have a higher number of women are Real Estate, Rental & Leasing (100.0%), Professional & Scientific (100.0%), and Arts, Entertainment & Recreation (100.0%).
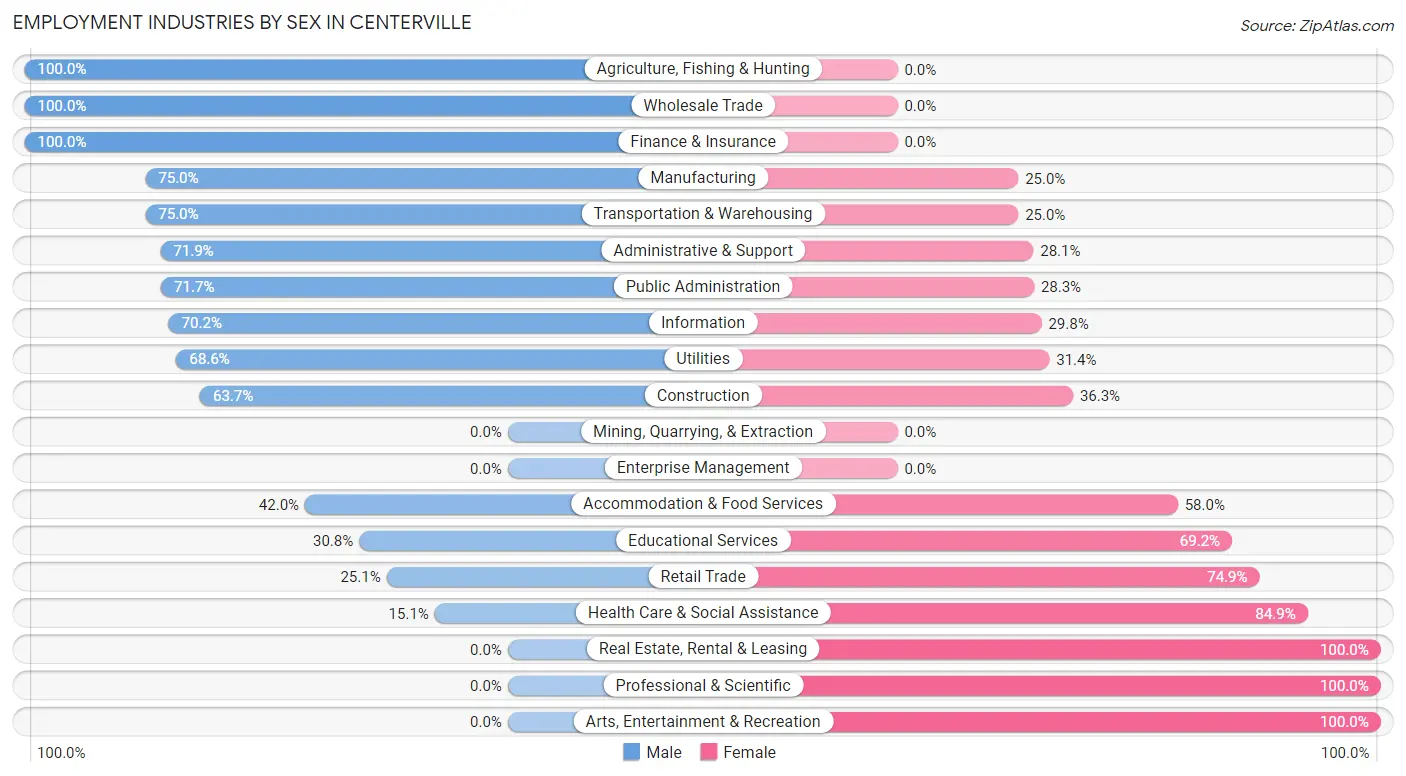
| Industry | Male | Female |
| Agriculture, Fishing & Hunting | 17 (100.0%) | 0 (0.0%) |
| Mining, Quarrying, & Extraction | 0 (0.0%) | 0 (0.0%) |
| Construction | 177 (63.7%) | 101 (36.3%) |
| Manufacturing | 237 (75.0%) | 79 (25.0%) |
| Wholesale Trade | 24 (100.0%) | 0 (0.0%) |
| Retail Trade | 66 (25.1%) | 197 (74.9%) |
| Transportation & Warehousing | 78 (75.0%) | 26 (25.0%) |
| Utilities | 24 (68.6%) | 11 (31.4%) |
| Information | 40 (70.2%) | 17 (29.8%) |
| Finance & Insurance | 62 (100.0%) | 0 (0.0%) |
| Real Estate, Rental & Leasing | 0 (0.0%) | 38 (100.0%) |
| Professional & Scientific | 0 (0.0%) | 26 (100.0%) |
| Enterprise Management | 0 (0.0%) | 0 (0.0%) |
| Administrative & Support | 23 (71.9%) | 9 (28.1%) |
| Educational Services | 24 (30.8%) | 54 (69.2%) |
| Health Care & Social Assistance | 70 (15.1%) | 393 (84.9%) |
| Arts, Entertainment & Recreation | 0 (0.0%) | 23 (100.0%) |
| Accommodation & Food Services | 34 (42.0%) | 47 (58.0%) |
| Public Administration | 33 (71.7%) | 13 (28.3%) |
| Total | 927 (46.4%) | 1,072 (53.6%) |
Education in Centerville
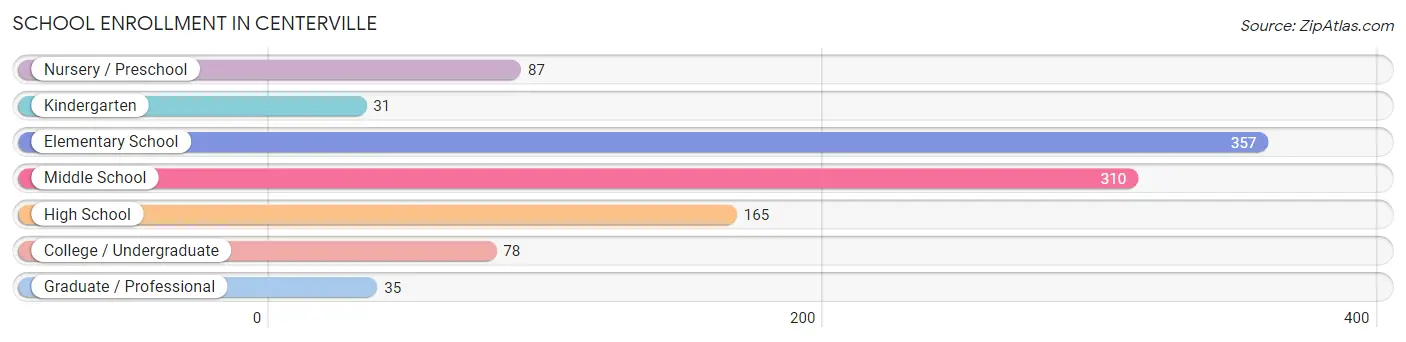
School Enrollment in Centerville
The most common levels of schooling among the 1,063 students in Centerville are elementary school (357 | 33.6%), middle school (310 | 29.2%), and high school (165 | 15.5%).
| School Level | # Students | % Students |
| Nursery / Preschool | 87 | 8.2% |
| Kindergarten | 31 | 2.9% |
| Elementary School | 357 | 33.6% |
| Middle School | 310 | 29.2% |
| High School | 165 | 15.5% |
| College / Undergraduate | 78 | 7.3% |
| Graduate / Professional | 35 | 3.3% |
| Total | 1,063 | 100.0% |
School Enrollment by Age by Funding Source in Centerville
Out of a total of 1,063 students who are enrolled in schools in Centerville, 102 (9.6%) attend a private institution, while the remaining 961 (90.4%) are enrolled in public schools. The age group of 3 to 4 year olds has the highest likelihood of being enrolled in private schools, with 28 (75.7% in the age bracket) enrolled. Conversely, the age group of 15 to 17 year olds has the lowest likelihood of being enrolled in a private school, with 115 (100.0% in the age bracket) attending a public institution.
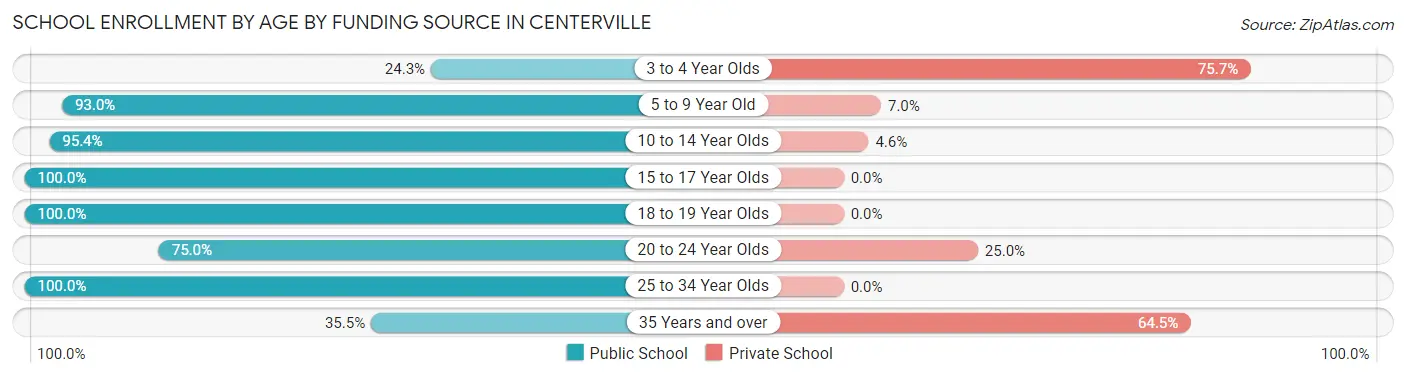
| Age Bracket | Public School | Private School |
| 3 to 4 Year Olds | 9 (24.3%) | 28 (75.7%) |
| 5 to 9 Year Old | 321 (93.0%) | 24 (7.0%) |
| 10 to 14 Year Olds | 413 (95.4%) | 20 (4.6%) |
| 15 to 17 Year Olds | 115 (100.0%) | 0 (0.0%) |
| 18 to 19 Year Olds | 39 (100.0%) | 0 (0.0%) |
| 20 to 24 Year Olds | 30 (75.0%) | 10 (25.0%) |
| 25 to 34 Year Olds | 23 (100.0%) | 0 (0.0%) |
| 35 Years and over | 11 (35.5%) | 20 (64.5%) |
| Total | 961 (90.4%) | 102 (9.6%) |
Educational Attainment by Field of Study in Centerville
Education (154 | 23.4%), arts & humanities (119 | 18.1%), business (87 | 13.2%), psychology (84 | 12.8%), and liberal arts & history (67 | 10.2%) are the most common fields of study among 657 individuals in Centerville who have obtained a bachelor's degree or higher.
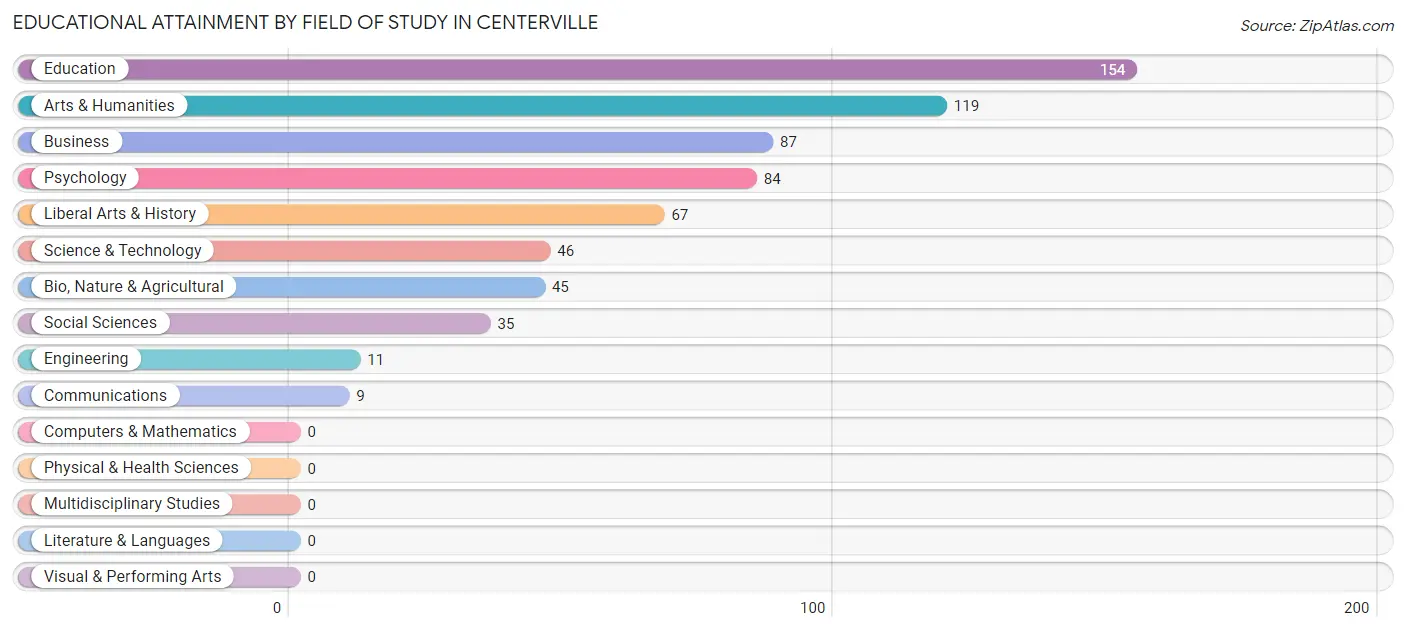
| Field of Study | # Graduates | % Graduates |
| Computers & Mathematics | 0 | 0.0% |
| Bio, Nature & Agricultural | 45 | 6.9% |
| Physical & Health Sciences | 0 | 0.0% |
| Psychology | 84 | 12.8% |
| Social Sciences | 35 | 5.3% |
| Engineering | 11 | 1.7% |
| Multidisciplinary Studies | 0 | 0.0% |
| Science & Technology | 46 | 7.0% |
| Business | 87 | 13.2% |
| Education | 154 | 23.4% |
| Literature & Languages | 0 | 0.0% |
| Liberal Arts & History | 67 | 10.2% |
| Visual & Performing Arts | 0 | 0.0% |
| Communications | 9 | 1.4% |
| Arts & Humanities | 119 | 18.1% |
| Total | 657 | 100.0% |
Transportation & Commute in Centerville
Vehicle Availability by Sex in Centerville
The most prevalent vehicle ownership categories in Centerville are males with 2 vehicles (473, accounting for 51.6%) and females with 2 vehicles (530, making up 44.5%).
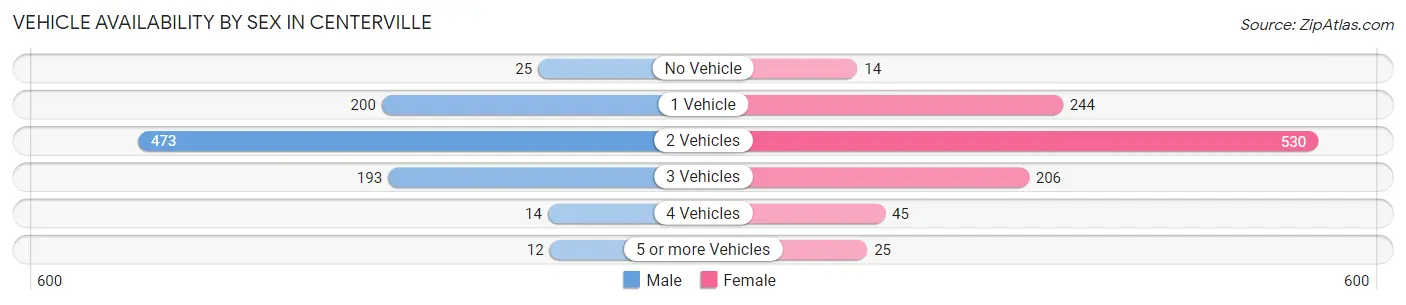
| Vehicles Available | Male | Female |
| No Vehicle | 25 (2.7%) | 14 (1.3%) |
| 1 Vehicle | 200 (21.8%) | 244 (22.9%) |
| 2 Vehicles | 473 (51.6%) | 530 (49.8%) |
| 3 Vehicles | 193 (21.0%) | 206 (19.4%) |
| 4 Vehicles | 14 (1.5%) | 45 (4.2%) |
| 5 or more Vehicles | 12 (1.3%) | 25 (2.4%) |
| Total | 917 (100.0%) | 1,064 (100.0%) |
Commute Time in Centerville
The most frequently occuring commute durations in Centerville are 5 to 9 minutes (605 commuters, 31.7%), 10 to 14 minutes (337 commuters, 17.7%), and less than 5 minutes (315 commuters, 16.5%).
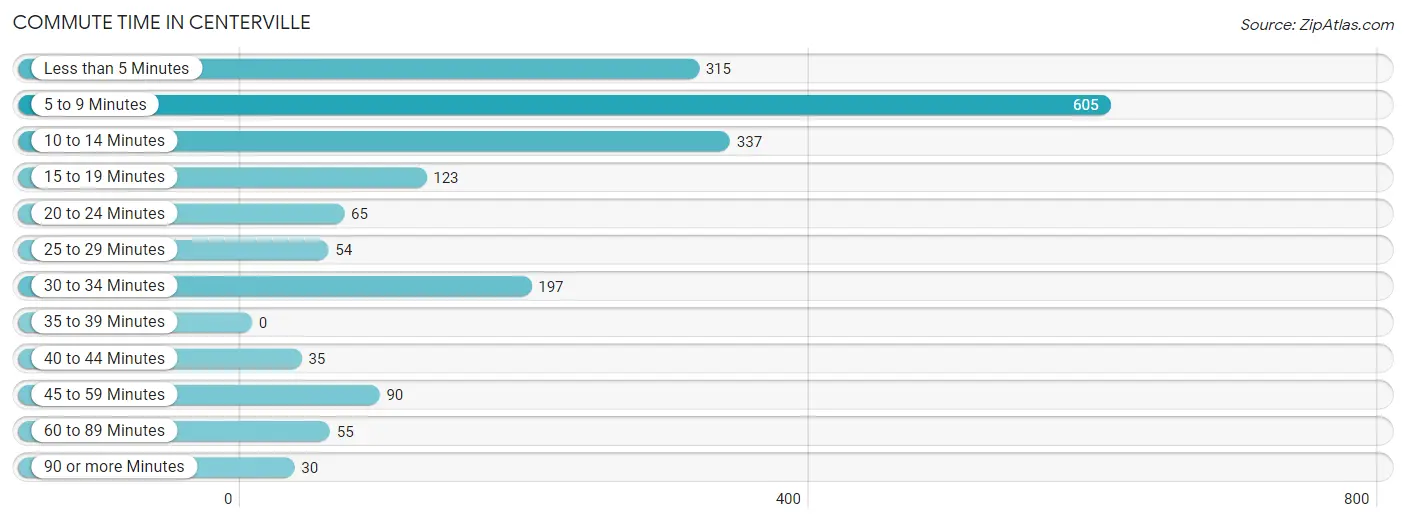
| Commute Time | # Commuters | % Commuters |
| Less than 5 Minutes | 315 | 16.5% |
| 5 to 9 Minutes | 605 | 31.7% |
| 10 to 14 Minutes | 337 | 17.7% |
| 15 to 19 Minutes | 123 | 6.5% |
| 20 to 24 Minutes | 65 | 3.4% |
| 25 to 29 Minutes | 54 | 2.8% |
| 30 to 34 Minutes | 197 | 10.3% |
| 35 to 39 Minutes | 0 | 0.0% |
| 40 to 44 Minutes | 35 | 1.8% |
| 45 to 59 Minutes | 90 | 4.7% |
| 60 to 89 Minutes | 55 | 2.9% |
| 90 or more Minutes | 30 | 1.6% |
Commute Time by Sex in Centerville
The most common commute times in Centerville are 5 to 9 minutes (312 commuters, 36.5%) for males and 5 to 9 minutes (293 commuters, 27.9%) for females.
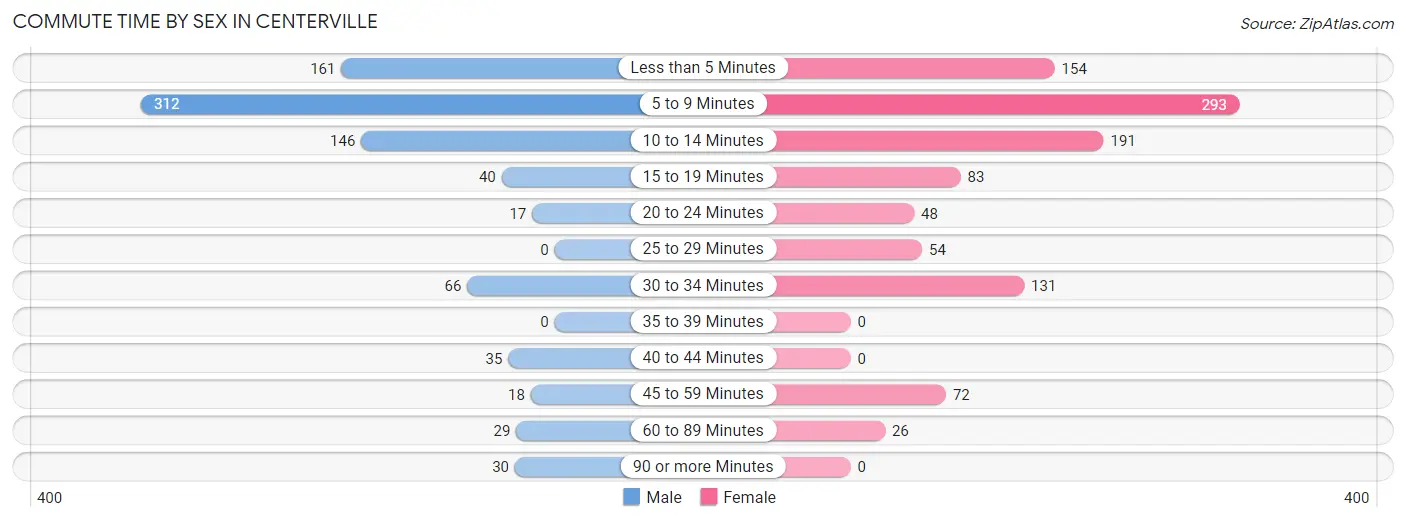
| Commute Time | Male | Female |
| Less than 5 Minutes | 161 (18.9%) | 154 (14.6%) |
| 5 to 9 Minutes | 312 (36.5%) | 293 (27.9%) |
| 10 to 14 Minutes | 146 (17.1%) | 191 (18.2%) |
| 15 to 19 Minutes | 40 (4.7%) | 83 (7.9%) |
| 20 to 24 Minutes | 17 (2.0%) | 48 (4.6%) |
| 25 to 29 Minutes | 0 (0.0%) | 54 (5.1%) |
| 30 to 34 Minutes | 66 (7.7%) | 131 (12.4%) |
| 35 to 39 Minutes | 0 (0.0%) | 0 (0.0%) |
| 40 to 44 Minutes | 35 (4.1%) | 0 (0.0%) |
| 45 to 59 Minutes | 18 (2.1%) | 72 (6.8%) |
| 60 to 89 Minutes | 29 (3.4%) | 26 (2.5%) |
| 90 or more Minutes | 30 (3.5%) | 0 (0.0%) |
Time of Departure to Work by Sex in Centerville
The most frequent times of departure to work in Centerville are 7:00 AM to 7:29 AM (126, 14.7%) for males and 7:30 AM to 7:59 AM (203, 19.3%) for females.
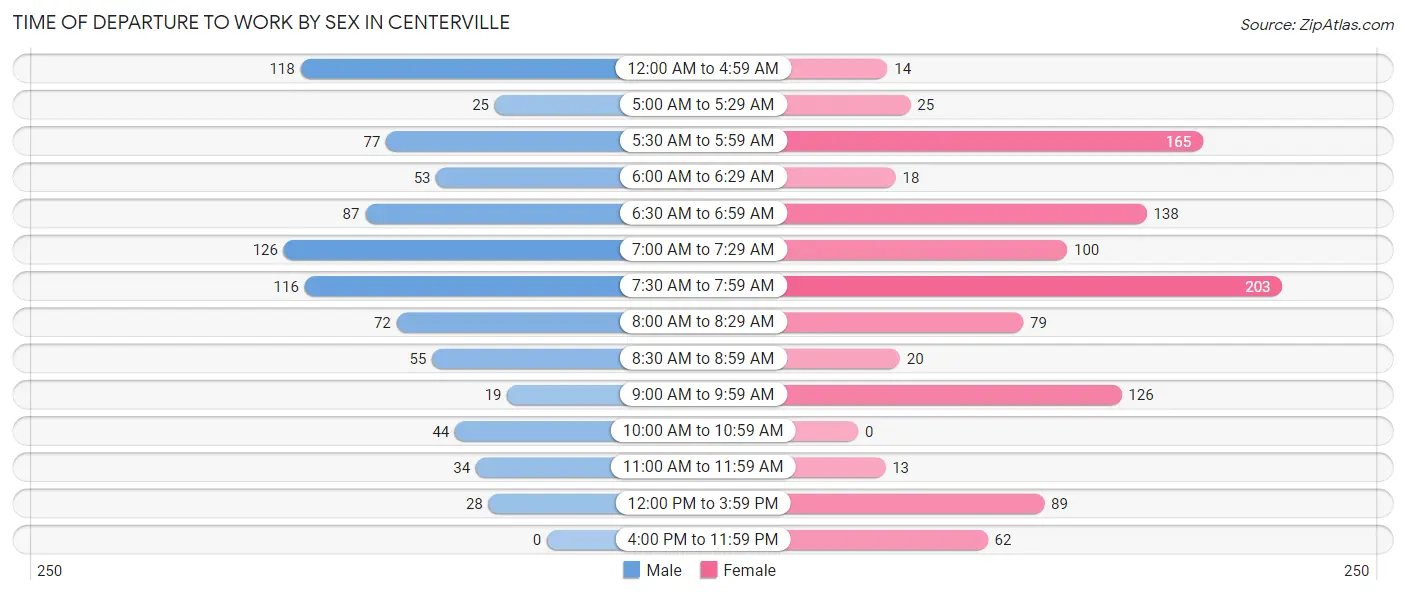
| Time of Departure | Male | Female |
| 12:00 AM to 4:59 AM | 118 (13.8%) | 14 (1.3%) |
| 5:00 AM to 5:29 AM | 25 (2.9%) | 25 (2.4%) |
| 5:30 AM to 5:59 AM | 77 (9.0%) | 165 (15.7%) |
| 6:00 AM to 6:29 AM | 53 (6.2%) | 18 (1.7%) |
| 6:30 AM to 6:59 AM | 87 (10.2%) | 138 (13.1%) |
| 7:00 AM to 7:29 AM | 126 (14.7%) | 100 (9.5%) |
| 7:30 AM to 7:59 AM | 116 (13.6%) | 203 (19.3%) |
| 8:00 AM to 8:29 AM | 72 (8.4%) | 79 (7.5%) |
| 8:30 AM to 8:59 AM | 55 (6.4%) | 20 (1.9%) |
| 9:00 AM to 9:59 AM | 19 (2.2%) | 126 (12.0%) |
| 10:00 AM to 10:59 AM | 44 (5.1%) | 0 (0.0%) |
| 11:00 AM to 11:59 AM | 34 (4.0%) | 13 (1.2%) |
| 12:00 PM to 3:59 PM | 28 (3.3%) | 89 (8.5%) |
| 4:00 PM to 11:59 PM | 0 (0.0%) | 62 (5.9%) |
| Total | 854 (100.0%) | 1,052 (100.0%) |
Housing Occupancy in Centerville
Occupancy by Ownership in Centerville
Of the total 2,299 dwellings in Centerville, owner-occupied units account for 1,312 (57.1%), while renter-occupied units make up 987 (42.9%).
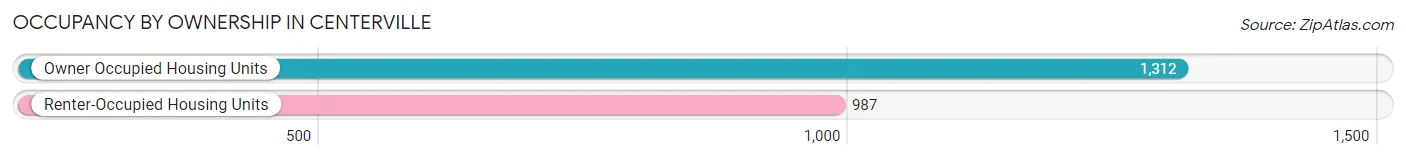
| Occupancy | # Housing Units | % Housing Units |
| Owner Occupied Housing Units | 1,312 | 57.1% |
| Renter-Occupied Housing Units | 987 | 42.9% |
| Total Occupied Housing Units | 2,299 | 100.0% |
Occupancy by Household Size in Centerville
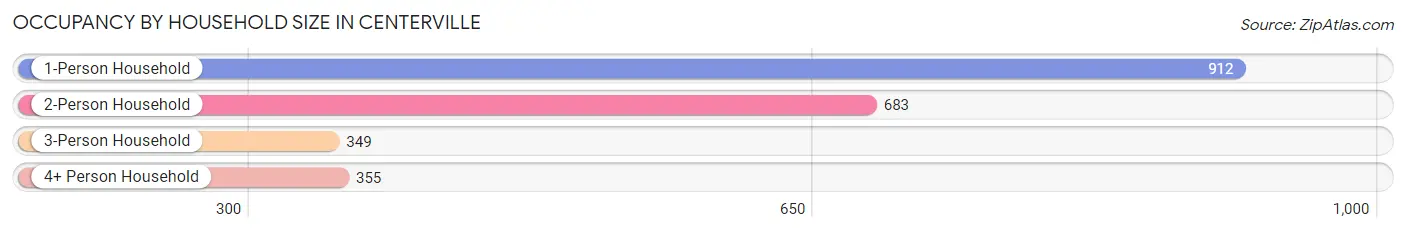
| Household Size | # Housing Units | % Housing Units |
| 1-Person Household | 912 | 39.7% |
| 2-Person Household | 683 | 29.7% |
| 3-Person Household | 349 | 15.2% |
| 4+ Person Household | 355 | 15.4% |
| Total Housing Units | 2,299 | 100.0% |
Occupancy by Ownership by Household Size in Centerville
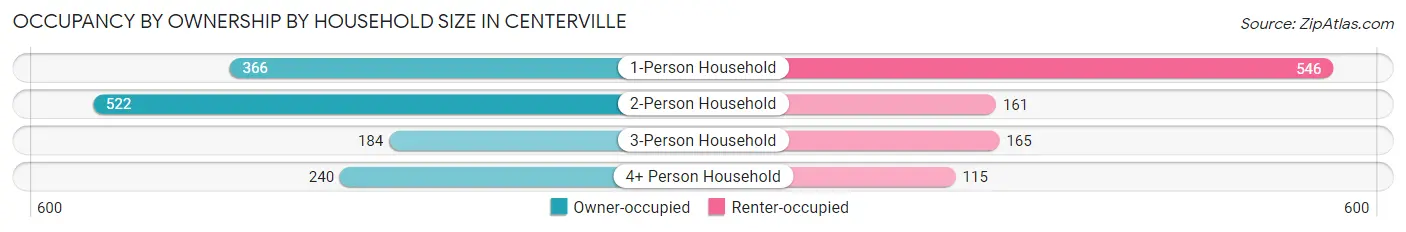
| Household Size | Owner-occupied | Renter-occupied |
| 1-Person Household | 366 (40.1%) | 546 (59.9%) |
| 2-Person Household | 522 (76.4%) | 161 (23.6%) |
| 3-Person Household | 184 (52.7%) | 165 (47.3%) |
| 4+ Person Household | 240 (67.6%) | 115 (32.4%) |
| Total Housing Units | 1,312 (57.1%) | 987 (42.9%) |
Occupancy by Educational Attainment in Centerville
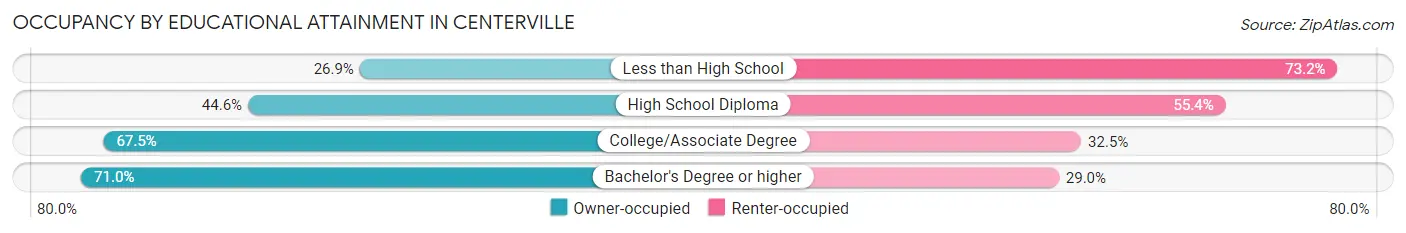
| Household Size | Owner-occupied | Renter-occupied |
| Less than High School | 29 (26.9%) | 79 (73.2%) |
| High School Diploma | 407 (44.6%) | 506 (55.4%) |
| College/Associate Degree | 604 (67.5%) | 291 (32.5%) |
| Bachelor's Degree or higher | 272 (71.0%) | 111 (29.0%) |
Occupancy by Age of Householder in Centerville
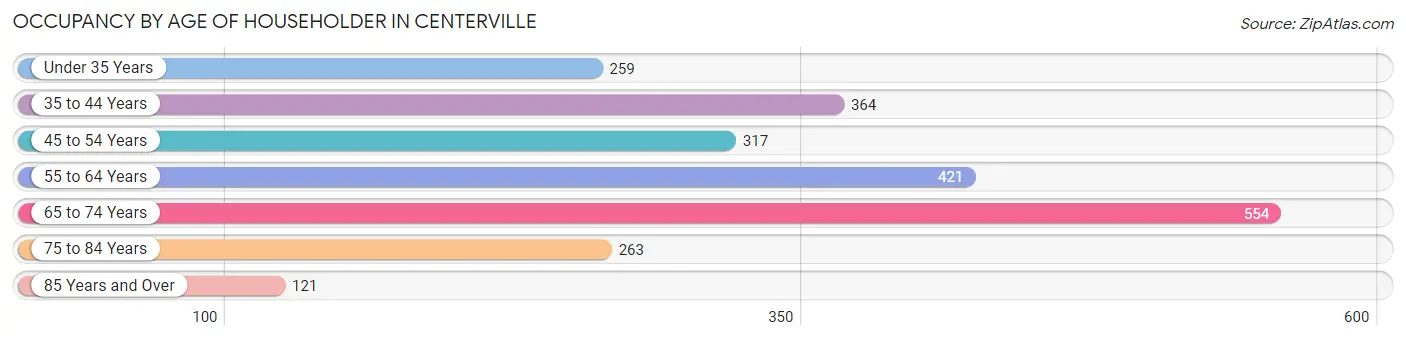
| Age Bracket | # Households | % Households |
| Under 35 Years | 259 | 11.3% |
| 35 to 44 Years | 364 | 15.8% |
| 45 to 54 Years | 317 | 13.8% |
| 55 to 64 Years | 421 | 18.3% |
| 65 to 74 Years | 554 | 24.1% |
| 75 to 84 Years | 263 | 11.4% |
| 85 Years and Over | 121 | 5.3% |
| Total | 2,299 | 100.0% |
Housing Finances in Centerville
Median Income by Occupancy in Centerville

| Occupancy Type | # Households | Median Income |
| Owner-Occupied | 1,312 (57.1%) | $55,242 |
| Renter-Occupied | 987 (42.9%) | $24,016 |
| Average | 2,299 (100.0%) | $42,064 |
Occupancy by Householder Income Bracket in Centerville
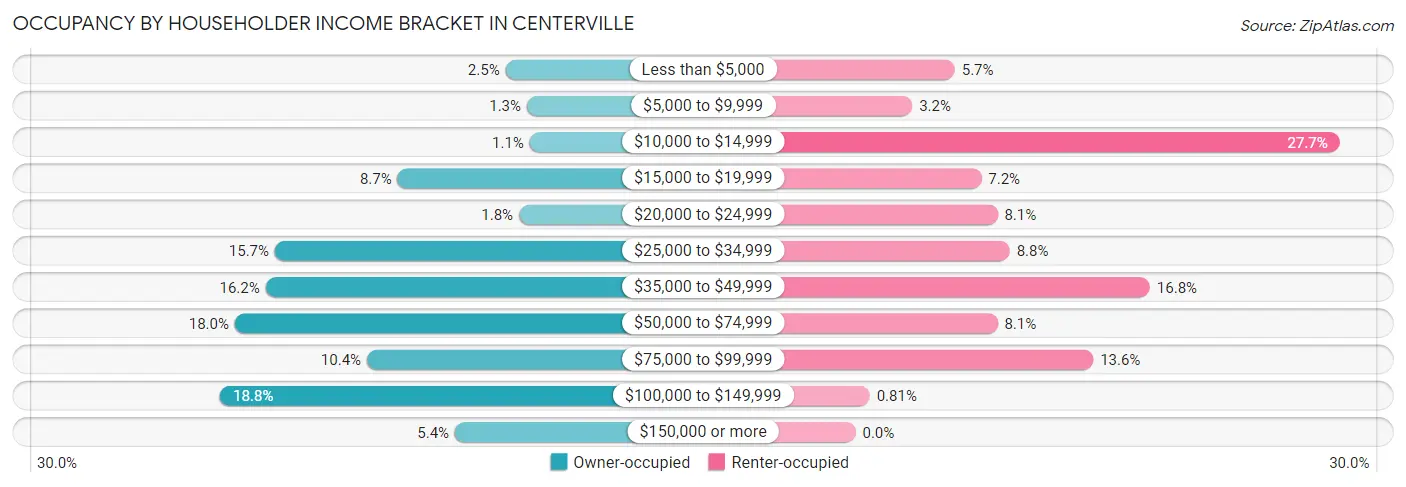
| Income Bracket | Owner-occupied | Renter-occupied |
| Less than $5,000 | 33 (2.5%) | 56 (5.7%) |
| $5,000 to $9,999 | 17 (1.3%) | 32 (3.2%) |
| $10,000 to $14,999 | 15 (1.1%) | 273 (27.7%) |
| $15,000 to $19,999 | 114 (8.7%) | 71 (7.2%) |
| $20,000 to $24,999 | 23 (1.8%) | 80 (8.1%) |
| $25,000 to $34,999 | 206 (15.7%) | 87 (8.8%) |
| $35,000 to $49,999 | 213 (16.2%) | 166 (16.8%) |
| $50,000 to $74,999 | 236 (18.0%) | 80 (8.1%) |
| $75,000 to $99,999 | 137 (10.4%) | 134 (13.6%) |
| $100,000 to $149,999 | 247 (18.8%) | 8 (0.8%) |
| $150,000 or more | 71 (5.4%) | 0 (0.0%) |
| Total | 1,312 (100.0%) | 987 (100.0%) |
Monthly Housing Cost Tiers in Centerville
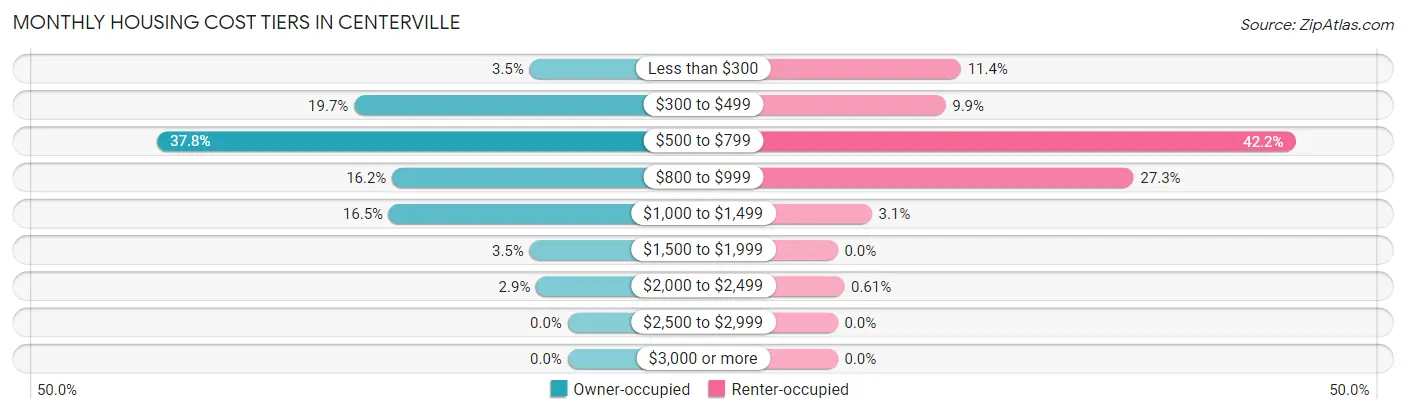
| Monthly Cost | Owner-occupied | Renter-occupied |
| Less than $300 | 46 (3.5%) | 112 (11.4%) |
| $300 to $499 | 258 (19.7%) | 98 (9.9%) |
| $500 to $799 | 496 (37.8%) | 416 (42.1%) |
| $800 to $999 | 212 (16.2%) | 269 (27.3%) |
| $1,000 to $1,499 | 216 (16.5%) | 31 (3.1%) |
| $1,500 to $1,999 | 46 (3.5%) | 0 (0.0%) |
| $2,000 to $2,499 | 38 (2.9%) | 6 (0.6%) |
| $2,500 to $2,999 | 0 (0.0%) | 0 (0.0%) |
| $3,000 or more | 0 (0.0%) | 0 (0.0%) |
| Total | 1,312 (100.0%) | 987 (100.0%) |
Physical Housing Characteristics in Centerville
Housing Structures in Centerville
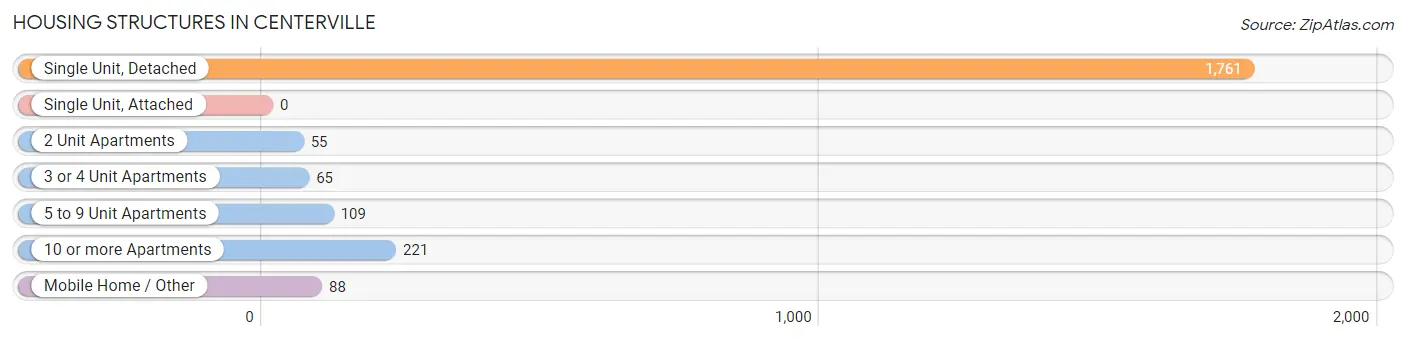
| Structure Type | # Housing Units | % Housing Units |
| Single Unit, Detached | 1,761 | 76.6% |
| Single Unit, Attached | 0 | 0.0% |
| 2 Unit Apartments | 55 | 2.4% |
| 3 or 4 Unit Apartments | 65 | 2.8% |
| 5 to 9 Unit Apartments | 109 | 4.7% |
| 10 or more Apartments | 221 | 9.6% |
| Mobile Home / Other | 88 | 3.8% |
| Total | 2,299 | 100.0% |
Housing Structures by Occupancy in Centerville
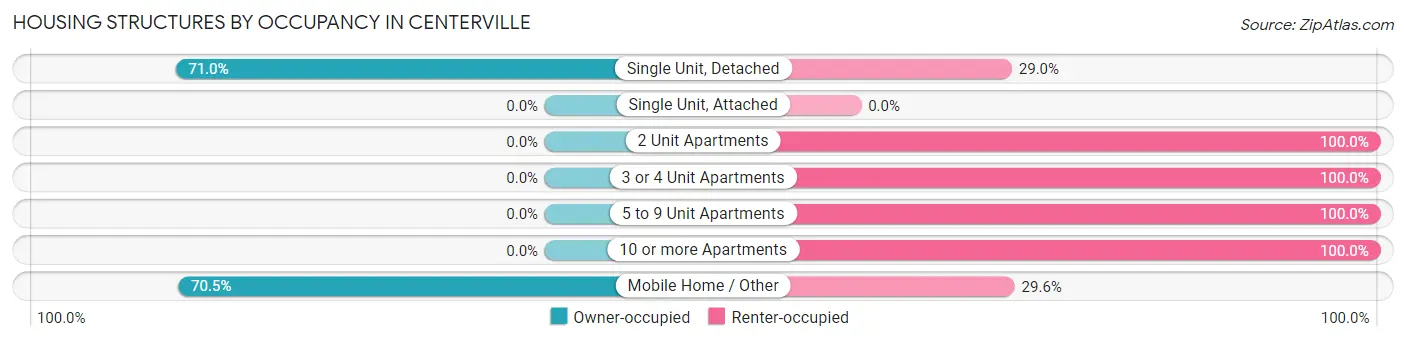
| Structure Type | Owner-occupied | Renter-occupied |
| Single Unit, Detached | 1,250 (71.0%) | 511 (29.0%) |
| Single Unit, Attached | 0 (0.0%) | 0 (0.0%) |
| 2 Unit Apartments | 0 (0.0%) | 55 (100.0%) |
| 3 or 4 Unit Apartments | 0 (0.0%) | 65 (100.0%) |
| 5 to 9 Unit Apartments | 0 (0.0%) | 109 (100.0%) |
| 10 or more Apartments | 0 (0.0%) | 221 (100.0%) |
| Mobile Home / Other | 62 (70.5%) | 26 (29.5%) |
| Total | 1,312 (57.1%) | 987 (42.9%) |
Housing Structures by Number of Rooms in Centerville
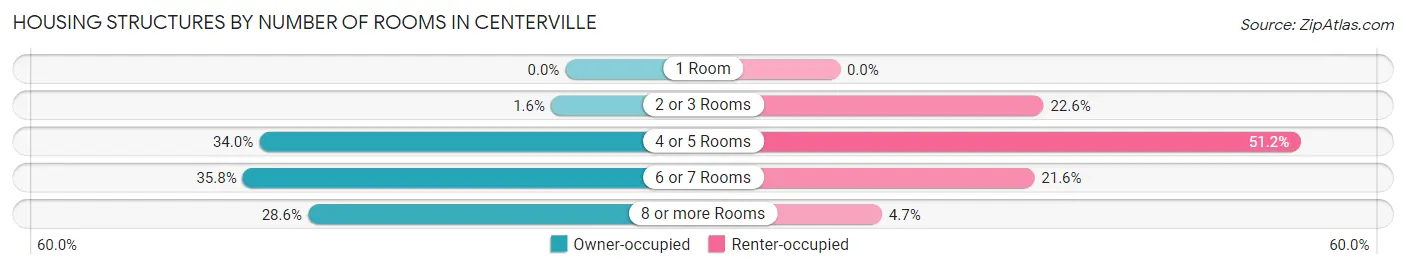
| Number of Rooms | Owner-occupied | Renter-occupied |
| 1 Room | 0 (0.0%) | 0 (0.0%) |
| 2 or 3 Rooms | 21 (1.6%) | 223 (22.6%) |
| 4 or 5 Rooms | 446 (34.0%) | 505 (51.2%) |
| 6 or 7 Rooms | 470 (35.8%) | 213 (21.6%) |
| 8 or more Rooms | 375 (28.6%) | 46 (4.7%) |
| Total | 1,312 (100.0%) | 987 (100.0%) |
Housing Structure by Heating Type in Centerville
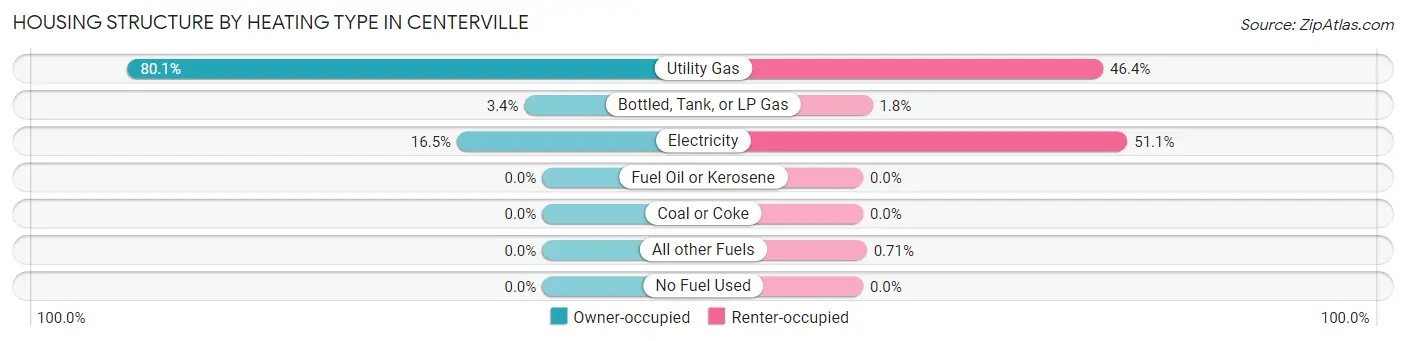
| Heating Type | Owner-occupied | Renter-occupied |
| Utility Gas | 1,051 (80.1%) | 458 (46.4%) |
| Bottled, Tank, or LP Gas | 45 (3.4%) | 18 (1.8%) |
| Electricity | 216 (16.5%) | 504 (51.1%) |
| Fuel Oil or Kerosene | 0 (0.0%) | 0 (0.0%) |
| Coal or Coke | 0 (0.0%) | 0 (0.0%) |
| All other Fuels | 0 (0.0%) | 7 (0.7%) |
| No Fuel Used | 0 (0.0%) | 0 (0.0%) |
| Total | 1,312 (100.0%) | 987 (100.0%) |
Household Vehicle Usage in Centerville
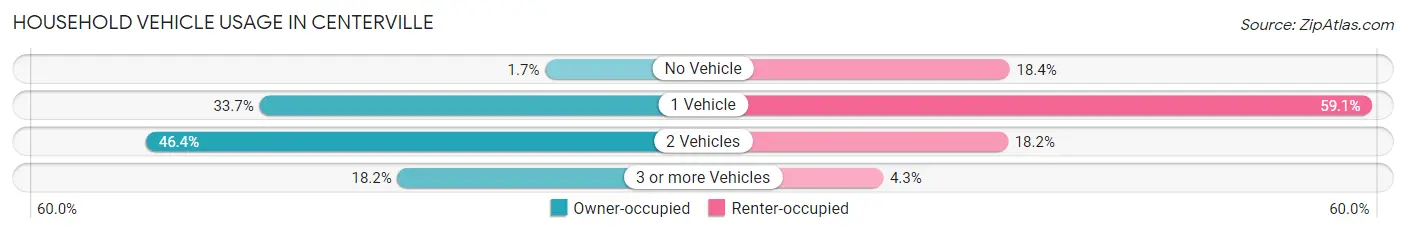
| Vehicles per Household | Owner-occupied | Renter-occupied |
| No Vehicle | 22 (1.7%) | 182 (18.4%) |
| 1 Vehicle | 442 (33.7%) | 583 (59.1%) |
| 2 Vehicles | 609 (46.4%) | 180 (18.2%) |
| 3 or more Vehicles | 239 (18.2%) | 42 (4.3%) |
| Total | 1,312 (100.0%) | 987 (100.0%) |
Real Estate & Mortgages in Centerville
Real Estate and Mortgage Overview in Centerville
| Characteristic | Without Mortgage | With Mortgage |
| Housing Units | 642 | 670 |
| Median Property Value | $85,100 | $103,300 |
| Median Household Income | $40,946 | $51 |
| Monthly Housing Costs | $510 | $0 |
| Real Estate Taxes | $1,339 | $30 |
Property Value by Mortgage Status in Centerville
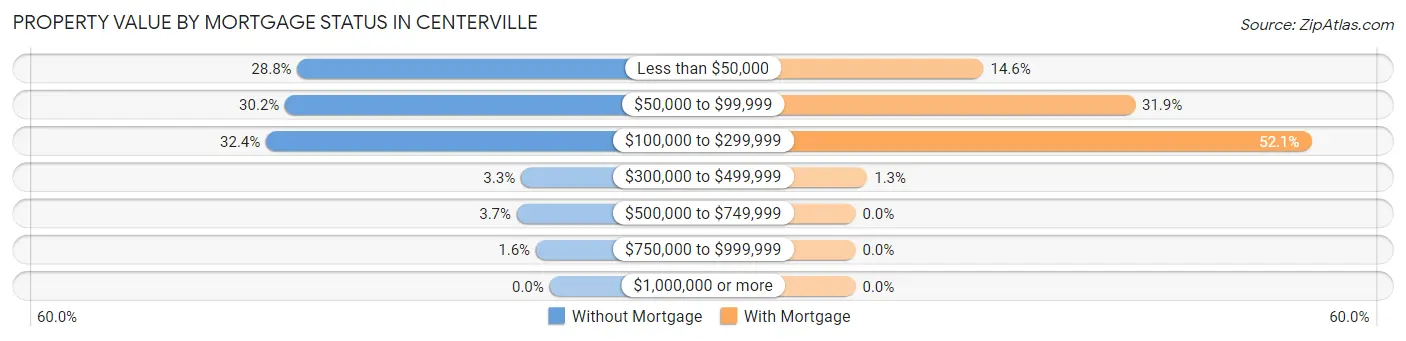
| Property Value | Without Mortgage | With Mortgage |
| Less than $50,000 | 185 (28.8%) | 98 (14.6%) |
| $50,000 to $99,999 | 194 (30.2%) | 214 (31.9%) |
| $100,000 to $299,999 | 208 (32.4%) | 349 (52.1%) |
| $300,000 to $499,999 | 21 (3.3%) | 9 (1.3%) |
| $500,000 to $749,999 | 24 (3.7%) | 0 (0.0%) |
| $750,000 to $999,999 | 10 (1.6%) | 0 (0.0%) |
| $1,000,000 or more | 0 (0.0%) | 0 (0.0%) |
| Total | 642 (100.0%) | 670 (100.0%) |
Household Income by Mortgage Status in Centerville
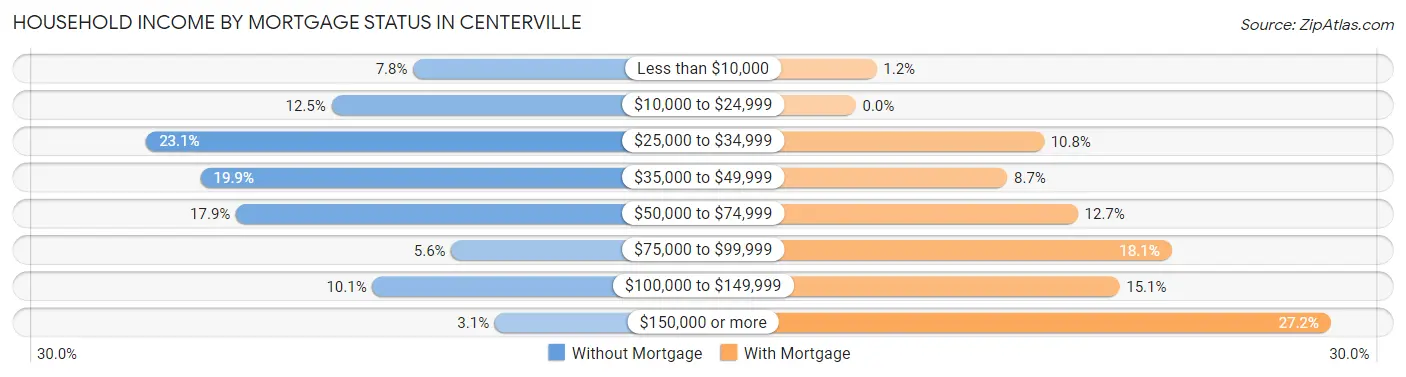
| Household Income | Without Mortgage | With Mortgage |
| Less than $10,000 | 50 (7.8%) | 8 (1.2%) |
| $10,000 to $24,999 | 80 (12.5%) | 0 (0.0%) |
| $25,000 to $34,999 | 148 (23.1%) | 72 (10.7%) |
| $35,000 to $49,999 | 128 (19.9%) | 58 (8.7%) |
| $50,000 to $74,999 | 115 (17.9%) | 85 (12.7%) |
| $75,000 to $99,999 | 36 (5.6%) | 121 (18.1%) |
| $100,000 to $149,999 | 65 (10.1%) | 101 (15.1%) |
| $150,000 or more | 20 (3.1%) | 182 (27.2%) |
| Total | 642 (100.0%) | 670 (100.0%) |
Property Value to Household Income Ratio in Centerville
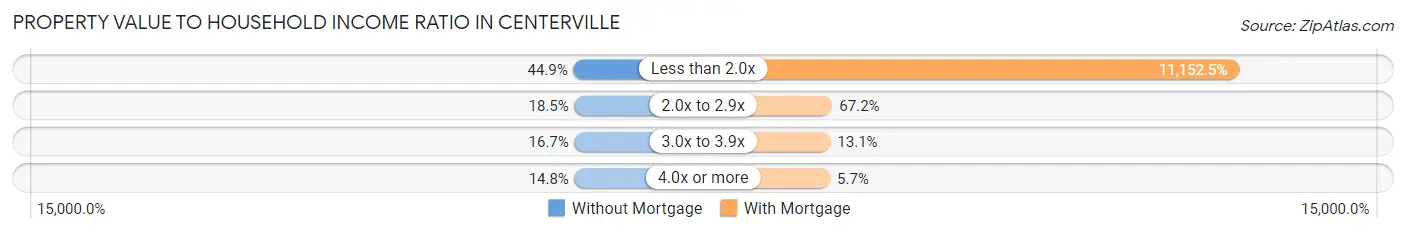
| Value-to-Income Ratio | Without Mortgage | With Mortgage |
| Less than 2.0x | 288 (44.9%) | 74,722 (11,152.5%) |
| 2.0x to 2.9x | 119 (18.5%) | 450 (67.2%) |
| 3.0x to 3.9x | 107 (16.7%) | 88 (13.1%) |
| 4.0x or more | 95 (14.8%) | 38 (5.7%) |
| Total | 642 (100.0%) | 670 (100.0%) |
Real Estate Taxes by Mortgage Status in Centerville
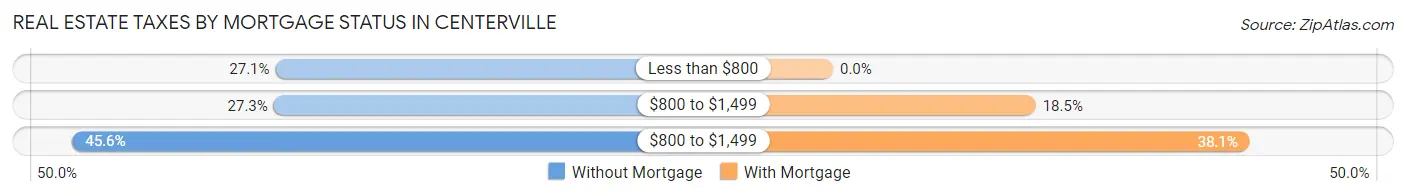
| Property Taxes | Without Mortgage | With Mortgage |
| Less than $800 | 174 (27.1%) | 0 (0.0%) |
| $800 to $1,499 | 175 (27.3%) | 124 (18.5%) |
| $800 to $1,499 | 293 (45.6%) | 255 (38.1%) |
| Total | 642 (100.0%) | 670 (100.0%) |
Health & Disability in Centerville
Health Insurance Coverage by Age in Centerville
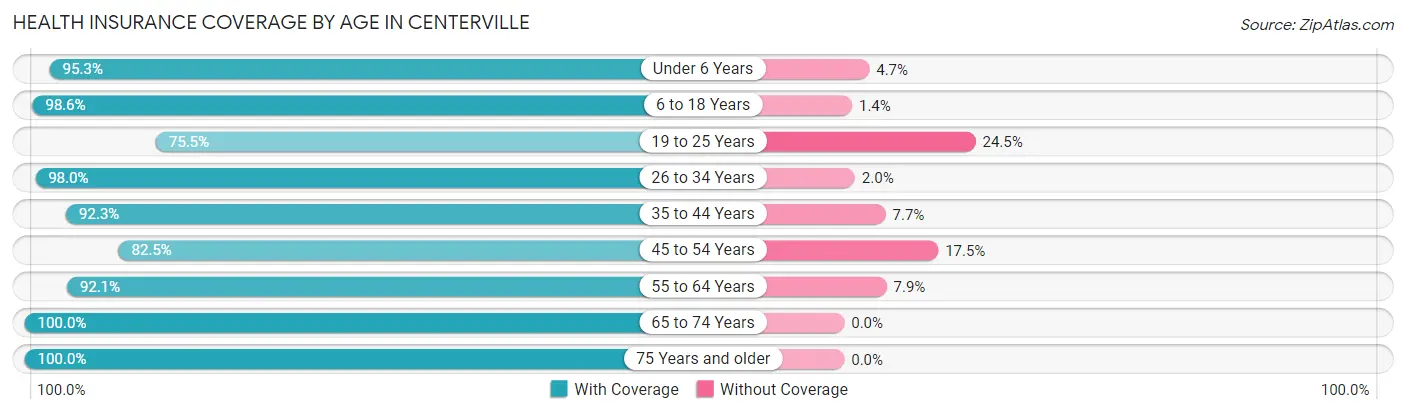
| Age Bracket | With Coverage | Without Coverage |
| Under 6 Years | 266 (95.3%) | 13 (4.7%) |
| 6 to 18 Years | 887 (98.6%) | 13 (1.4%) |
| 19 to 25 Years | 253 (75.5%) | 82 (24.5%) |
| 26 to 34 Years | 397 (98.0%) | 8 (2.0%) |
| 35 to 44 Years | 682 (92.3%) | 57 (7.7%) |
| 45 to 54 Years | 471 (82.5%) | 100 (17.5%) |
| 55 to 64 Years | 759 (92.1%) | 65 (7.9%) |
| 65 to 74 Years | 700 (100.0%) | 0 (0.0%) |
| 75 Years and older | 529 (100.0%) | 0 (0.0%) |
| Total | 4,944 (93.6%) | 338 (6.4%) |
Health Insurance Coverage by Citizenship Status in Centerville

| Citizenship Status | With Coverage | Without Coverage |
| Native Born | 266 (95.3%) | 13 (4.7%) |
| Foreign Born, Citizen | 887 (98.6%) | 13 (1.4%) |
| Foreign Born, not a Citizen | 253 (75.5%) | 82 (24.5%) |
Health Insurance Coverage by Household Income in Centerville
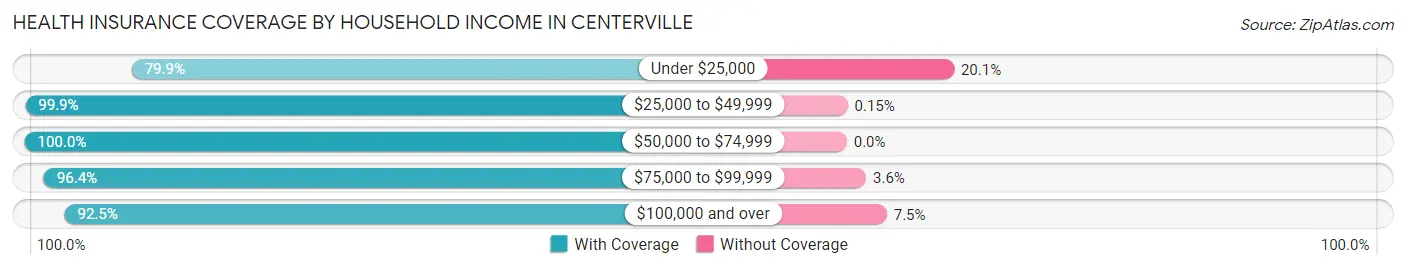
| Household Income | With Coverage | Without Coverage |
| Under $25,000 | 955 (79.9%) | 240 (20.1%) |
| $25,000 to $49,999 | 1,357 (99.9%) | 2 (0.2%) |
| $50,000 to $74,999 | 1,108 (100.0%) | 0 (0.0%) |
| $75,000 to $99,999 | 666 (96.4%) | 25 (3.6%) |
| $100,000 and over | 827 (92.5%) | 67 (7.5%) |
Public vs Private Health Insurance Coverage by Age in Centerville
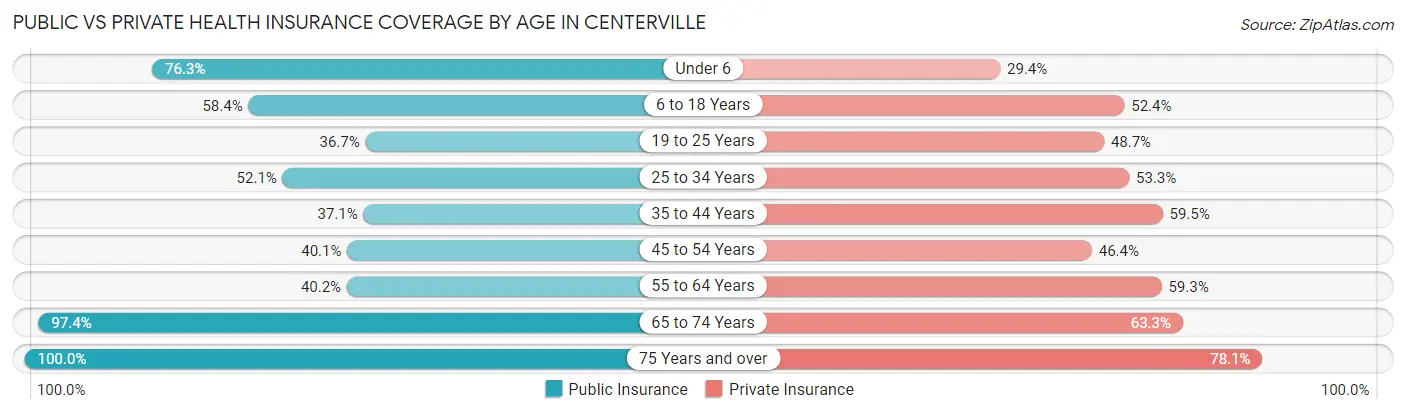
| Age Bracket | Public Insurance | Private Insurance |
| Under 6 | 213 (76.3%) | 82 (29.4%) |
| 6 to 18 Years | 526 (58.4%) | 472 (52.4%) |
| 19 to 25 Years | 123 (36.7%) | 163 (48.7%) |
| 25 to 34 Years | 211 (52.1%) | 216 (53.3%) |
| 35 to 44 Years | 274 (37.1%) | 440 (59.5%) |
| 45 to 54 Years | 229 (40.1%) | 265 (46.4%) |
| 55 to 64 Years | 331 (40.2%) | 489 (59.3%) |
| 65 to 74 Years | 682 (97.4%) | 443 (63.3%) |
| 75 Years and over | 529 (100.0%) | 413 (78.1%) |
| Total | 3,118 (59.0%) | 2,983 (56.5%) |
Disability Status by Sex by Age in Centerville
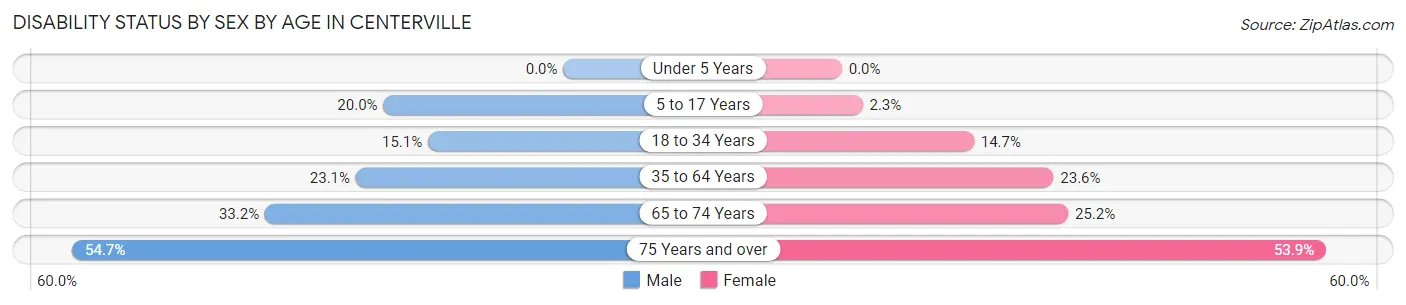
| Age Bracket | Male | Female |
| Under 5 Years | 0 (0.0%) | 0 (0.0%) |
| 5 to 17 Years | 90 (20.0%) | 11 (2.3%) |
| 18 to 34 Years | 66 (15.1%) | 51 (14.7%) |
| 35 to 64 Years | 241 (23.1%) | 257 (23.6%) |
| 65 to 74 Years | 106 (33.2%) | 96 (25.2%) |
| 75 Years and over | 122 (54.7%) | 165 (53.9%) |
Disability Class by Sex by Age in Centerville
Disability Class: Hearing Difficulty
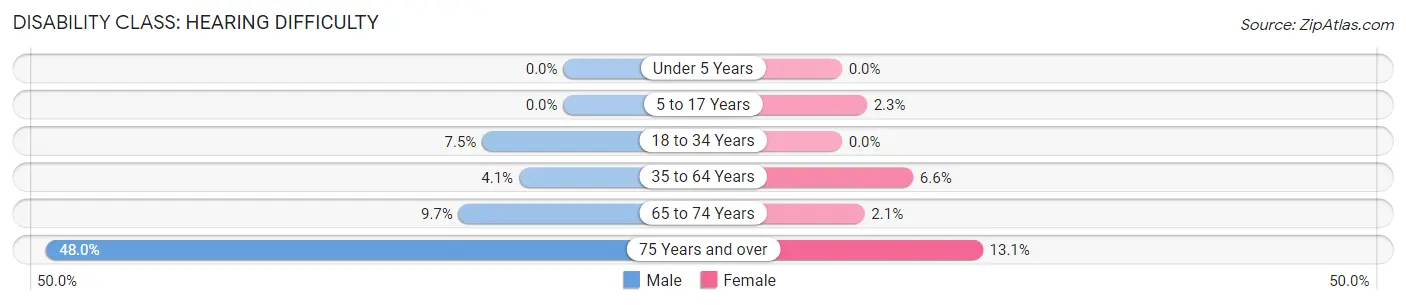
| Age Bracket | Male | Female |
| Under 5 Years | 0 (0.0%) | 0 (0.0%) |
| 5 to 17 Years | 0 (0.0%) | 11 (2.3%) |
| 18 to 34 Years | 33 (7.5%) | 0 (0.0%) |
| 35 to 64 Years | 43 (4.1%) | 72 (6.6%) |
| 65 to 74 Years | 31 (9.7%) | 8 (2.1%) |
| 75 Years and over | 107 (48.0%) | 40 (13.1%) |
Disability Class: Vision Difficulty
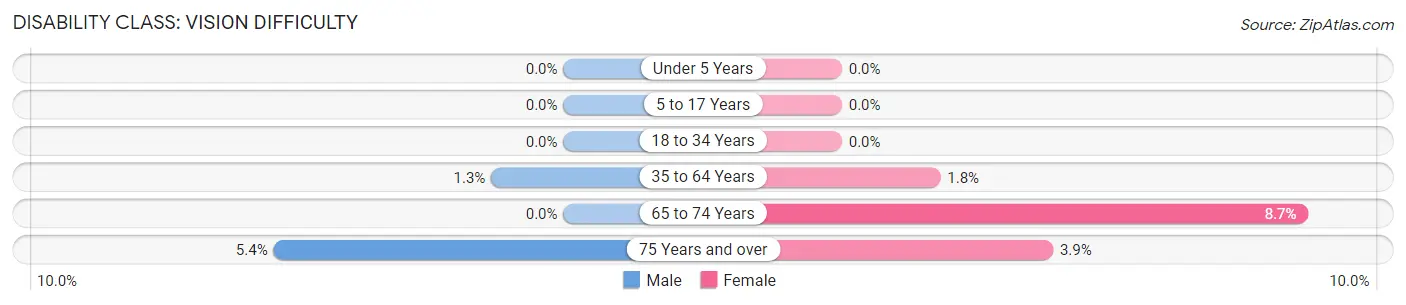
| Age Bracket | Male | Female |
| Under 5 Years | 0 (0.0%) | 0 (0.0%) |
| 5 to 17 Years | 0 (0.0%) | 0 (0.0%) |
| 18 to 34 Years | 0 (0.0%) | 0 (0.0%) |
| 35 to 64 Years | 14 (1.3%) | 20 (1.8%) |
| 65 to 74 Years | 0 (0.0%) | 33 (8.7%) |
| 75 Years and over | 12 (5.4%) | 12 (3.9%) |
Disability Class: Cognitive Difficulty
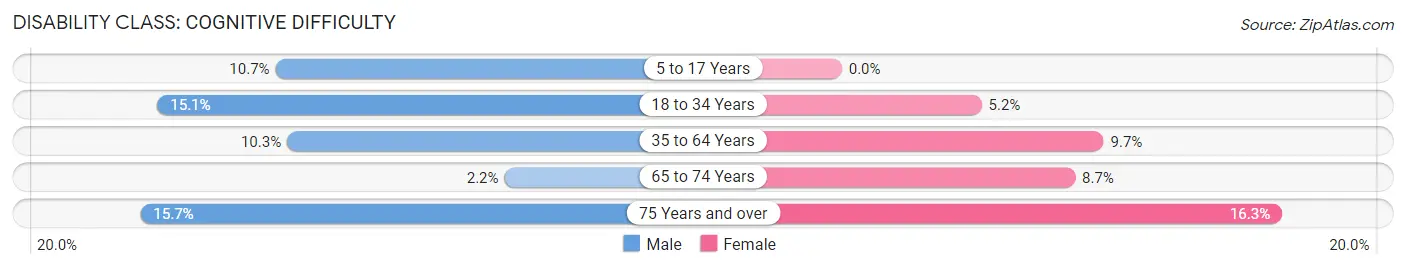
| Age Bracket | Male | Female |
| 5 to 17 Years | 48 (10.7%) | 0 (0.0%) |
| 18 to 34 Years | 66 (15.1%) | 18 (5.2%) |
| 35 to 64 Years | 107 (10.3%) | 106 (9.7%) |
| 65 to 74 Years | 7 (2.2%) | 33 (8.7%) |
| 75 Years and over | 35 (15.7%) | 50 (16.3%) |
Disability Class: Ambulatory Difficulty
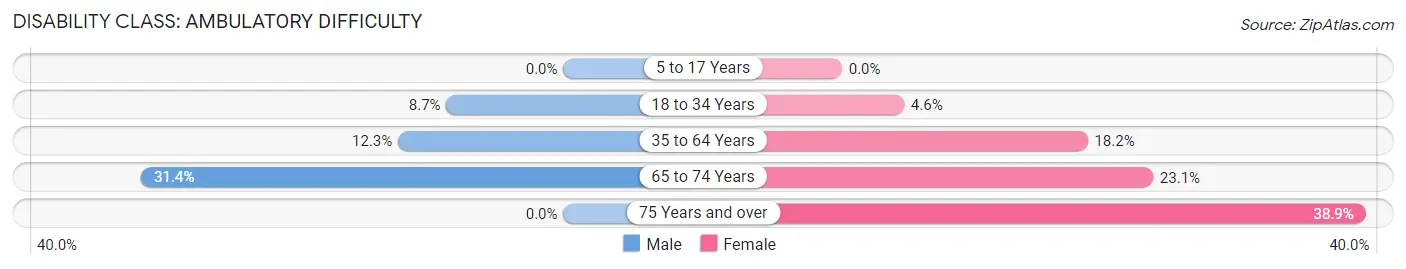
| Age Bracket | Male | Female |
| 5 to 17 Years | 0 (0.0%) | 0 (0.0%) |
| 18 to 34 Years | 38 (8.7%) | 16 (4.6%) |
| 35 to 64 Years | 128 (12.3%) | 199 (18.2%) |
| 65 to 74 Years | 100 (31.4%) | 88 (23.1%) |
| 75 Years and over | 0 (0.0%) | 119 (38.9%) |
Disability Class: Self-Care Difficulty
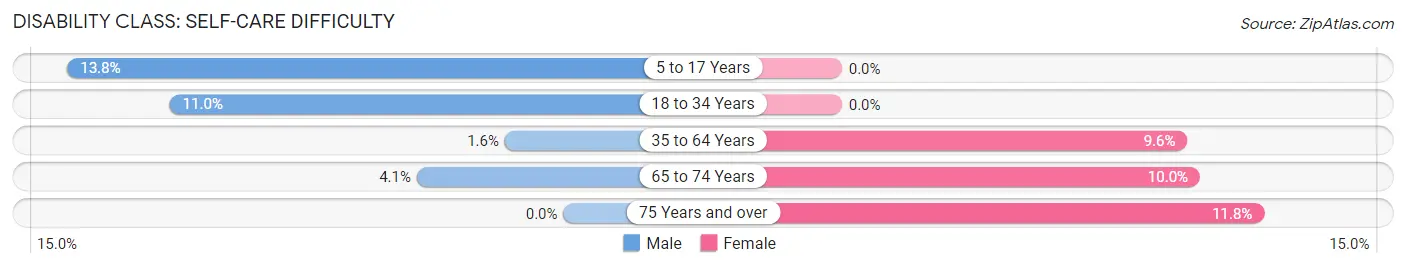
| Age Bracket | Male | Female |
| 5 to 17 Years | 62 (13.8%) | 0 (0.0%) |
| 18 to 34 Years | 48 (11.0%) | 0 (0.0%) |
| 35 to 64 Years | 17 (1.6%) | 105 (9.6%) |
| 65 to 74 Years | 13 (4.1%) | 38 (10.0%) |
| 75 Years and over | 0 (0.0%) | 36 (11.8%) |
Technology Access in Centerville
Computing Device Access in Centerville
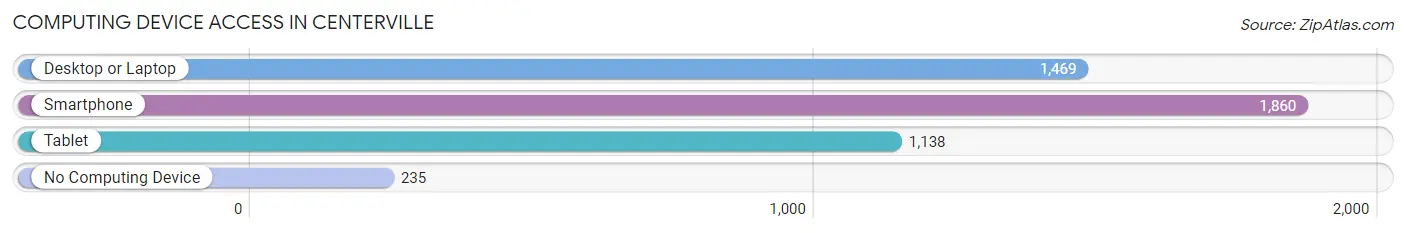
| Device Type | # Households | % Households |
| Desktop or Laptop | 1,469 | 63.9% |
| Smartphone | 1,860 | 80.9% |
| Tablet | 1,138 | 49.5% |
| No Computing Device | 235 | 10.2% |
| Total | 2,299 | 100.0% |
Internet Access in Centerville
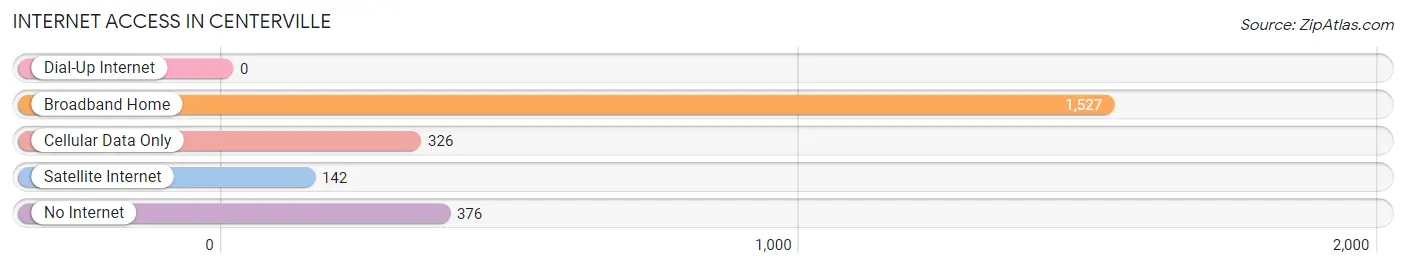
| Internet Type | # Households | % Households |
| Dial-Up Internet | 0 | 0.0% |
| Broadband Home | 1,527 | 66.4% |
| Cellular Data Only | 326 | 14.2% |
| Satellite Internet | 142 | 6.2% |
| No Internet | 376 | 16.4% |
| Total | 2,299 | 100.0% |
Centerville Summary
Centerville, Iowa is a small city located in Appanoose County in the south-central part of the state. It is situated along the South Skunk River and is the county seat of Appanoose County. The city has a population of 5,528 as of the 2010 census, making it the largest city in the county.
History
Centerville was founded in 1846 by a group of settlers from Ohio. The city was named after the nearby Centerville Township, which was named after the nearby Centerville Creek. The city was incorporated in 1851 and was the first city in Appanoose County.
The city was an important stop on the Underground Railroad, with many slaves escaping to freedom in Canada. The city was also an important stop on the Chicago, Burlington and Quincy Railroad, which was built in 1868.
Geography
Centerville is located at 40°45'N 92°53'W (40.75, -92.88). It is situated along the South Skunk River and is the county seat of Appanoose County. The city has a total area of 4.2 square miles, all of which is land.
The city is located in the Central Lowland region of the Midwest, which is characterized by rolling hills and fertile soil. The climate is humid continental, with hot summers and cold winters.
Economy
Centerville’s economy is largely based on agriculture and manufacturing. The city is home to several large agricultural companies, including Pioneer Hi-Bred International, Inc., which produces hybrid corn and soybeans. The city is also home to several manufacturing companies, including Centerville Manufacturing, which produces automotive parts.
The city is also home to several retail stores, including Walmart, Hy-Vee, and Dollar General. The city also has several restaurants, including Pizza Hut, McDonald’s, and Subway.
Demographics
As of the 2010 census, the population of Centerville was 5,528. The racial makeup of the city was 95.2% White, 0.7% African American, 0.3% Native American, 0.4% Asian, 0.1% Pacific Islander, 1.7% from other races, and 1.5% from two or more races. Hispanic or Latino of any race were 3.2% of the population.
The median income for a household in the city was $37,917, and the median income for a family was $45,938. The per capita income for the city was $19,845. About 11.2% of families and 14.2% of the population were below the poverty line, including 19.2% of those under age 18 and 8.2% of those age 65 or over.
Common Questions
What is Per Capita Income in Centerville?
Per Capita income in Centerville is $23,999.
What is the Median Family Income in Centerville?
Median Family Income in Centerville is $46,923.
What is the Median Household income in Centerville?
Median Household Income in Centerville is $42,064.
What is Income or Wage Gap in Centerville?
Income or Wage Gap in Centerville is 36.3%.
Women in Centerville earn 63.7 cents for every dollar earned by a man.
What is Inequality or Gini Index in Centerville?
Inequality or Gini Index in Centerville is 0.44.
What is the Total Population of Centerville?
Total Population of Centerville is 5,393.
What is the Total Male Population of Centerville?
Total Male Population of Centerville is 2,653.
What is the Total Female Population of Centerville?
Total Female Population of Centerville is 2,740.
What is the Ratio of Males per 100 Females in Centerville?
There are 96.82 Males per 100 Females in Centerville.
What is the Ratio of Females per 100 Males in Centerville?
There are 103.28 Females per 100 Males in Centerville.
What is the Median Population Age in Centerville?
Median Population Age in Centerville is 45.4 Years.
What is the Average Family Size in Centerville
Average Family Size in Centerville is 3.0 People.
What is the Average Household Size in Centerville
Average Household Size in Centerville is 2.3 People.
How Large is the Labor Force in Centerville?
There are 2,192 People in the Labor Forcein in Centerville.
What is the Percentage of People in the Labor Force in Centerville?
50.7% of People are in the Labor Force in Centerville.
What is the Unemployment Rate in Centerville?
Unemployment Rate in Centerville is 8.8%.