Cotter, IA Map & Demographics
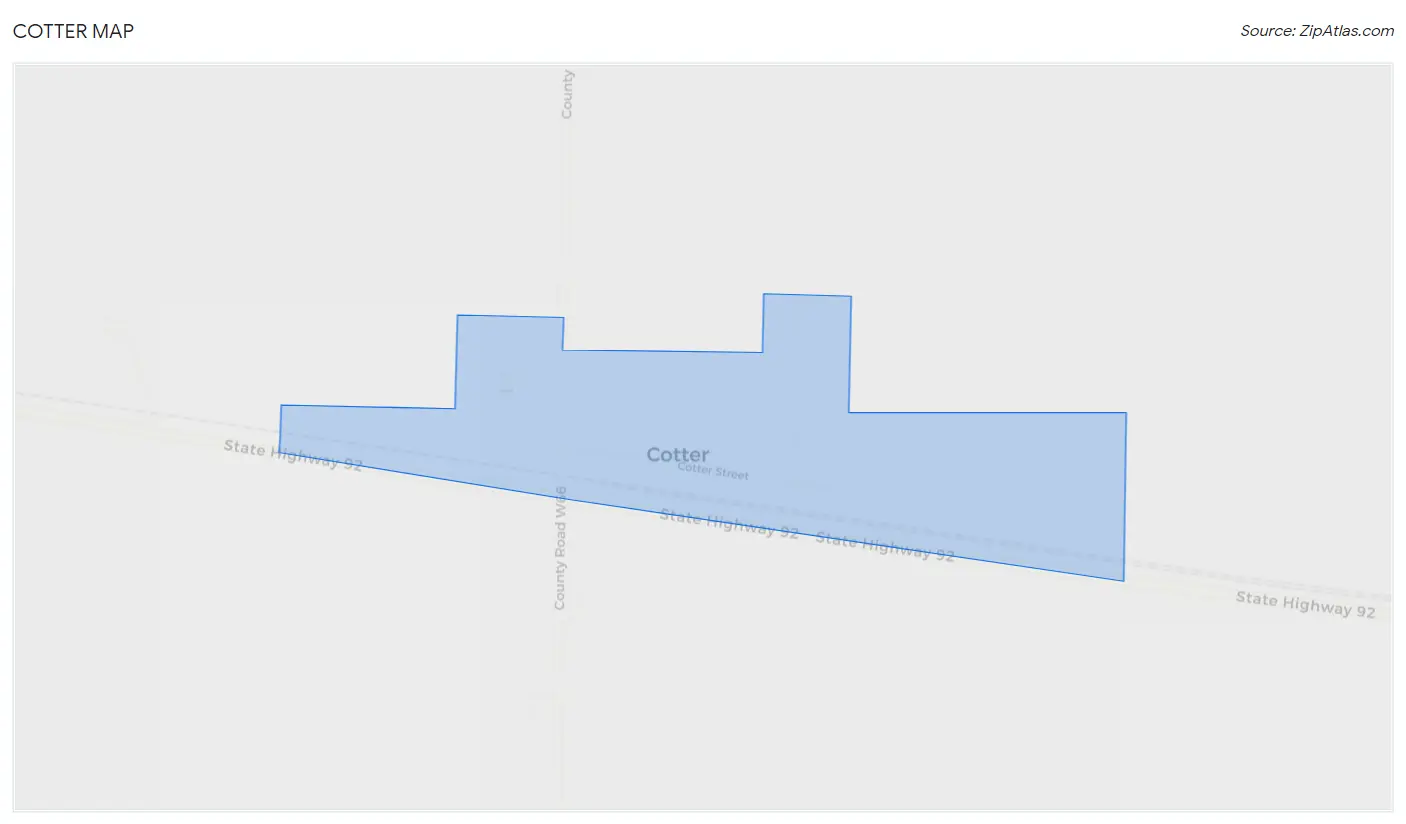
Cotter Map
Cotter Overview
$22,462
PER CAPITA INCOME
0.37
INEQUALITY / GINI INDEX
21
TOTAL POPULATION
7
MALE POPULATION
14
FEMALE POPULATION
50.00
MALES / 100 FEMALES
200.00
FEMALES / 100 MALES
54.5
MEDIAN AGE
2.8
AVG FAMILY SIZE
2.3
AVG HOUSEHOLD SIZE
8
LABOR FORCE [ PEOPLE ]
47.1%
PERCENT IN LABOR FORCE
Income in Cotter
Income Overview in Cotter
| Characteristic | Number | Measure |
| Per Capita Income | 21 | $22,462 |
| Median Family Income | 5 | $0 |
| Mean Family Income | 5 | $55,920 |
| Median Household Income | 9 | $0 |
| Mean Household Income | 9 | $52,311 |
| Income Deficit | 5 | $0 |
| Wage / Income Gap (%) | 21 | 0.00% |
| Wage / Income Gap ($) | 21 | 100.00¢ per $1 |
| Gini / Inequality Index | 21 | 0.37 |
Earnings by Sex in Cotter
| Sex | Number | Average Earnings |
| Male | 4 (40.0%) | $0 |
| Female | 6 (60.0%) | $0 |
| Total | 10 (100.0%) | $0 |
Earnings by Sex by Income Bracket in Cotter
The most common earnings brackets in Cotter are $2,500 to $4,999 for men (1 | 25.0%) and $2,499 or less for women (2 | 33.3%).
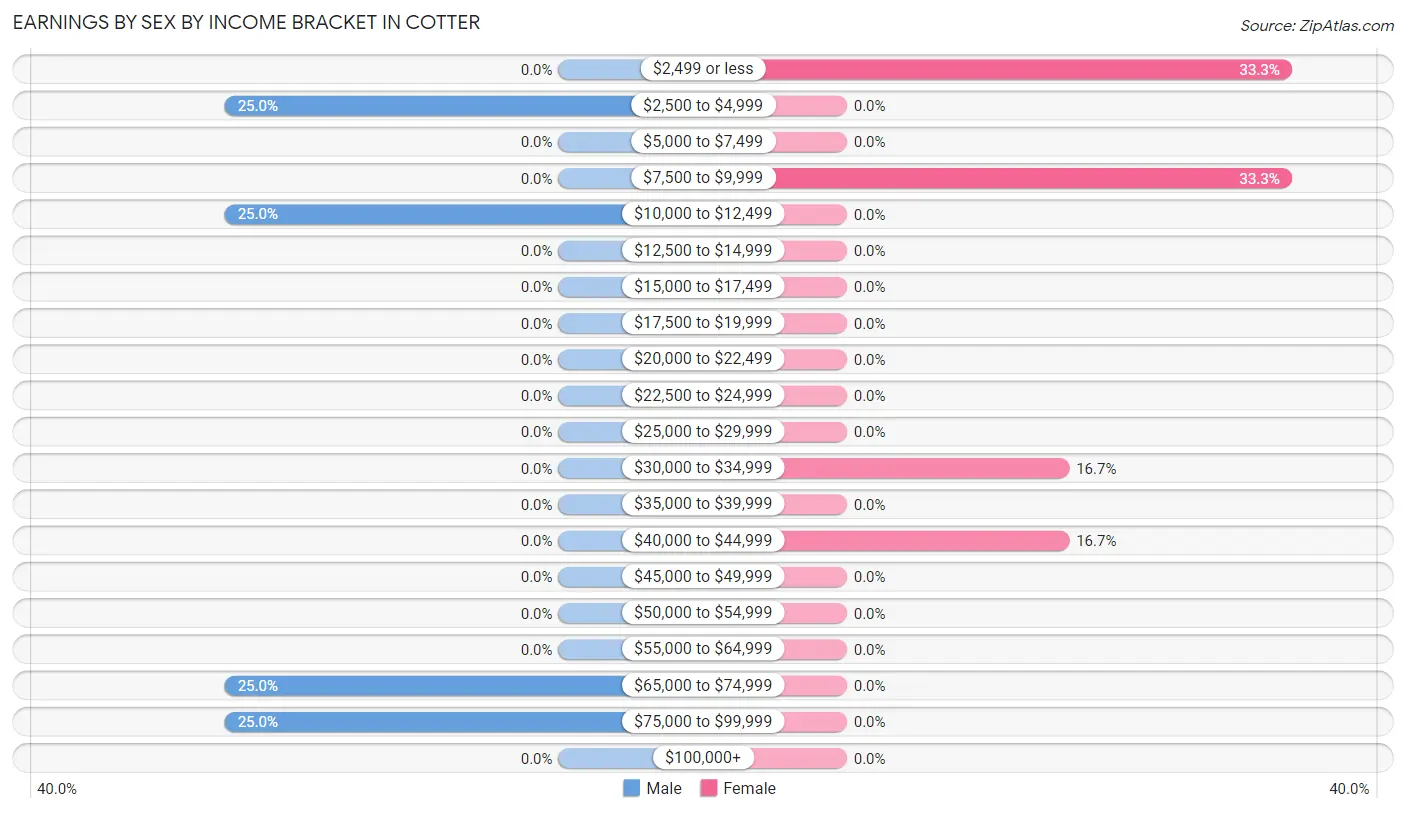
| Income | Male | Female |
| $2,499 or less | 0 (0.0%) | 2 (33.3%) |
| $2,500 to $4,999 | 1 (25.0%) | 0 (0.0%) |
| $5,000 to $7,499 | 0 (0.0%) | 0 (0.0%) |
| $7,500 to $9,999 | 0 (0.0%) | 2 (33.3%) |
| $10,000 to $12,499 | 1 (25.0%) | 0 (0.0%) |
| $12,500 to $14,999 | 0 (0.0%) | 0 (0.0%) |
| $15,000 to $17,499 | 0 (0.0%) | 0 (0.0%) |
| $17,500 to $19,999 | 0 (0.0%) | 0 (0.0%) |
| $20,000 to $22,499 | 0 (0.0%) | 0 (0.0%) |
| $22,500 to $24,999 | 0 (0.0%) | 0 (0.0%) |
| $25,000 to $29,999 | 0 (0.0%) | 0 (0.0%) |
| $30,000 to $34,999 | 0 (0.0%) | 1 (16.7%) |
| $35,000 to $39,999 | 0 (0.0%) | 0 (0.0%) |
| $40,000 to $44,999 | 0 (0.0%) | 1 (16.7%) |
| $45,000 to $49,999 | 0 (0.0%) | 0 (0.0%) |
| $50,000 to $54,999 | 0 (0.0%) | 0 (0.0%) |
| $55,000 to $64,999 | 0 (0.0%) | 0 (0.0%) |
| $65,000 to $74,999 | 1 (25.0%) | 0 (0.0%) |
| $75,000 to $99,999 | 1 (25.0%) | 0 (0.0%) |
| $100,000+ | 0 (0.0%) | 0 (0.0%) |
| Total | 4 (100.0%) | 6 (100.0%) |
Earnings by Sex by Educational Attainment in Cotter
| Educational Attainment | Male Income | Female Income |
| Less than High School | - | - |
| High School Diploma | - | - |
| College or Associate's Degree | - | - |
| Bachelor's Degree | - | - |
| Graduate Degree | - | - |
| Total | - | - |
Family Income in Cotter
Family Income Brackets in Cotter
According to the Cotter family income data, there are 2 families falling into the $35,000 to $49,999 income range, which is the most common income bracket and makes up 40.0% of all families.
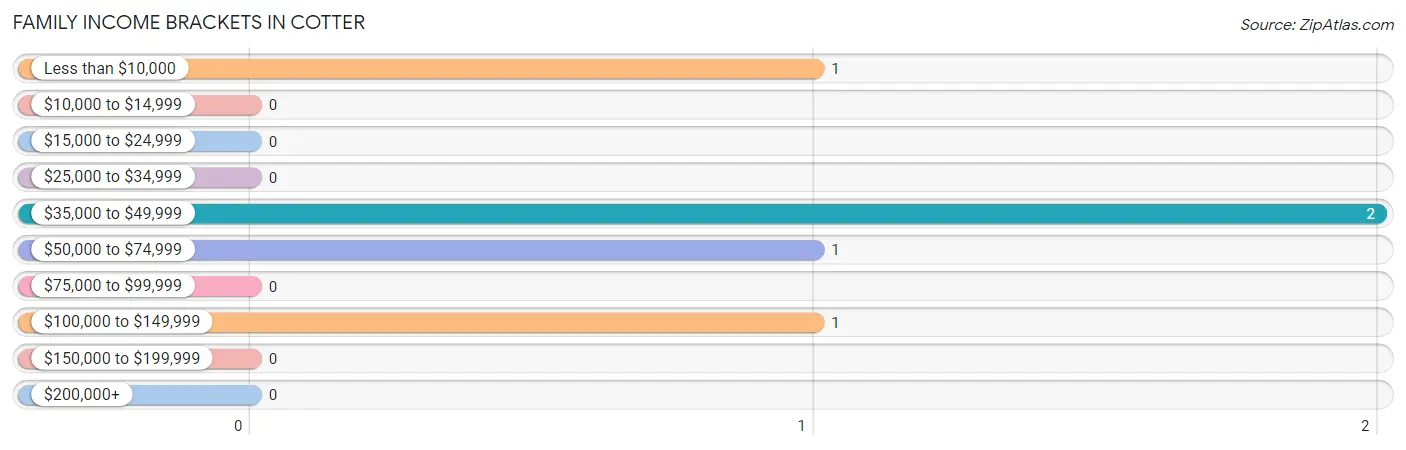
| Income Bracket | # Families | % Families |
| Less than $10,000 | 1 | 20.0% |
| $10,000 to $14,999 | 0 | 0.0% |
| $15,000 to $24,999 | 0 | 0.0% |
| $25,000 to $34,999 | 0 | 0.0% |
| $35,000 to $49,999 | 2 | 40.0% |
| $50,000 to $74,999 | 1 | 20.0% |
| $75,000 to $99,999 | 0 | 0.0% |
| $100,000 to $149,999 | 1 | 20.0% |
| $150,000 to $199,999 | 0 | 0.0% |
| $200,000+ | 0 | 0.0% |
Family Income by Famaliy Size in Cotter
| Income Bracket | # Families | Median Income |
| 2-Person Families | 3 (60.0%) | $0 |
| 3-Person Families | 1 (20.0%) | $0 |
| 4-Person Families | 1 (20.0%) | $0 |
| 5-Person Families | 0 (0.0%) | $0 |
| 6-Person Families | 0 (0.0%) | $0 |
| 7+ Person Families | 0 (0.0%) | $0 |
| Total | 5 (100.0%) | $0 |
Family Income by Number of Earners in Cotter
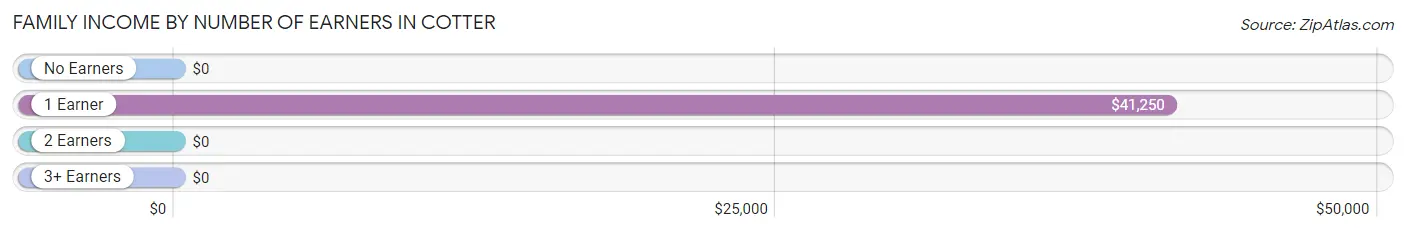
| Number of Earners | # Families | Median Income |
| No Earners | 0 (0.0%) | $0 |
| 1 Earner | 4 (80.0%) | $41,250 |
| 2 Earners | 0 (0.0%) | $0 |
| 3+ Earners | 1 (20.0%) | $0 |
| Total | 5 (100.0%) | $0 |
Household Income in Cotter
Household Income Brackets in Cotter
With 3 households falling in the category, the $15,000 to $24,999 income range is the most frequent in Cotter, accounting for 33.3% of all households.
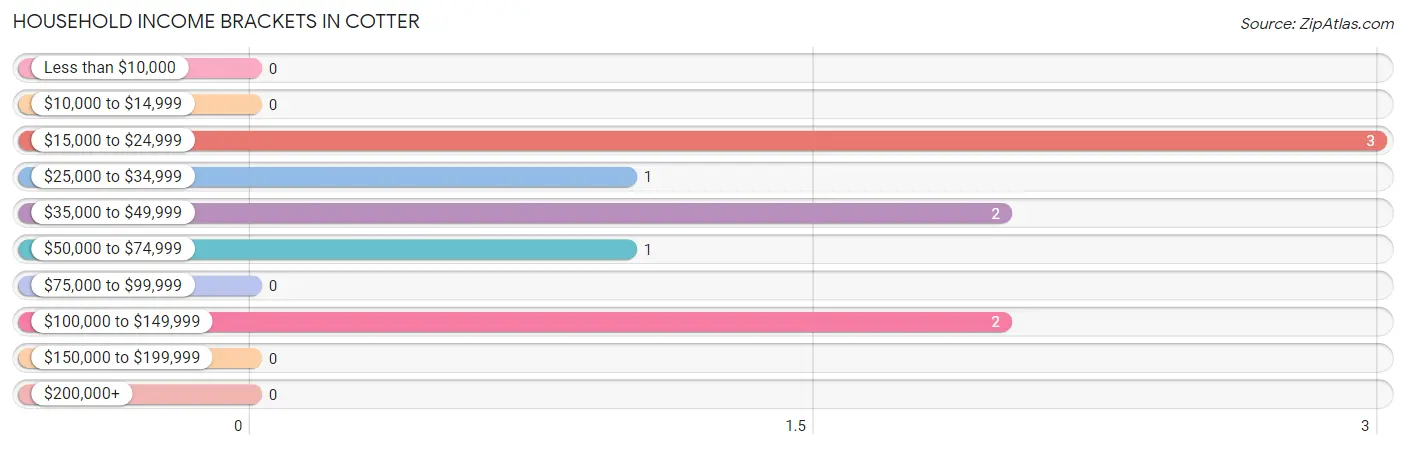
| Income Bracket | # Households | % Households |
| Less than $10,000 | 0 | 0.0% |
| $10,000 to $14,999 | 0 | 0.0% |
| $15,000 to $24,999 | 3 | 33.3% |
| $25,000 to $34,999 | 1 | 11.1% |
| $35,000 to $49,999 | 2 | 22.2% |
| $50,000 to $74,999 | 1 | 11.1% |
| $75,000 to $99,999 | 0 | 0.0% |
| $100,000 to $149,999 | 2 | 22.2% |
| $150,000 to $199,999 | 0 | 0.0% |
| $200,000+ | 0 | 0.0% |
Household Income by Householder Age in Cotter
The median household income in Cotter is $0, with the highest median household income of $111,250 found in the 45 to 64 years age bracket for the primary householder. A total of 3 households (33.3%) fall into this category.
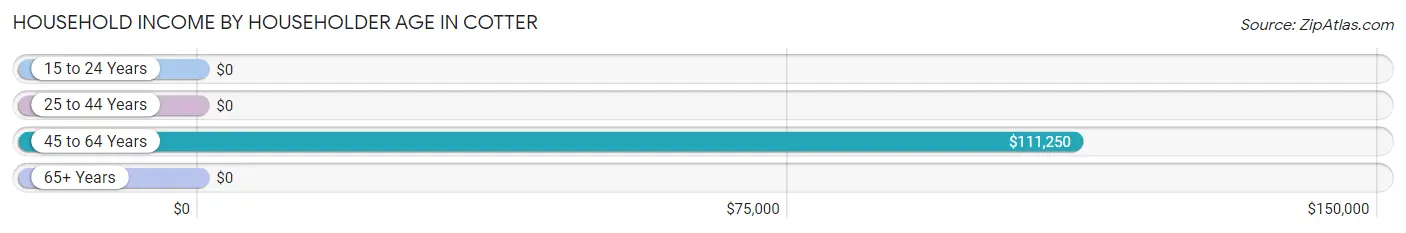
| Income Bracket | # Households | Median Income |
| 15 to 24 Years | 0 (0.0%) | $0 |
| 25 to 44 Years | 1 (11.1%) | $0 |
| 45 to 64 Years | 3 (33.3%) | $111,250 |
| 65+ Years | 5 (55.6%) | $0 |
| Total | 9 (100.0%) | $0 |
Poverty in Cotter
Income Below Poverty by Sex and Age in Cotter
With 16.7% poverty level for males and 21.4% for females among the residents of Cotter, 25 to 34 year old males and under 5 year old females are the most vulnerable to poverty, with 1 males (100.0%) and 1 females (100.0%) in their respective age groups living below the poverty level.
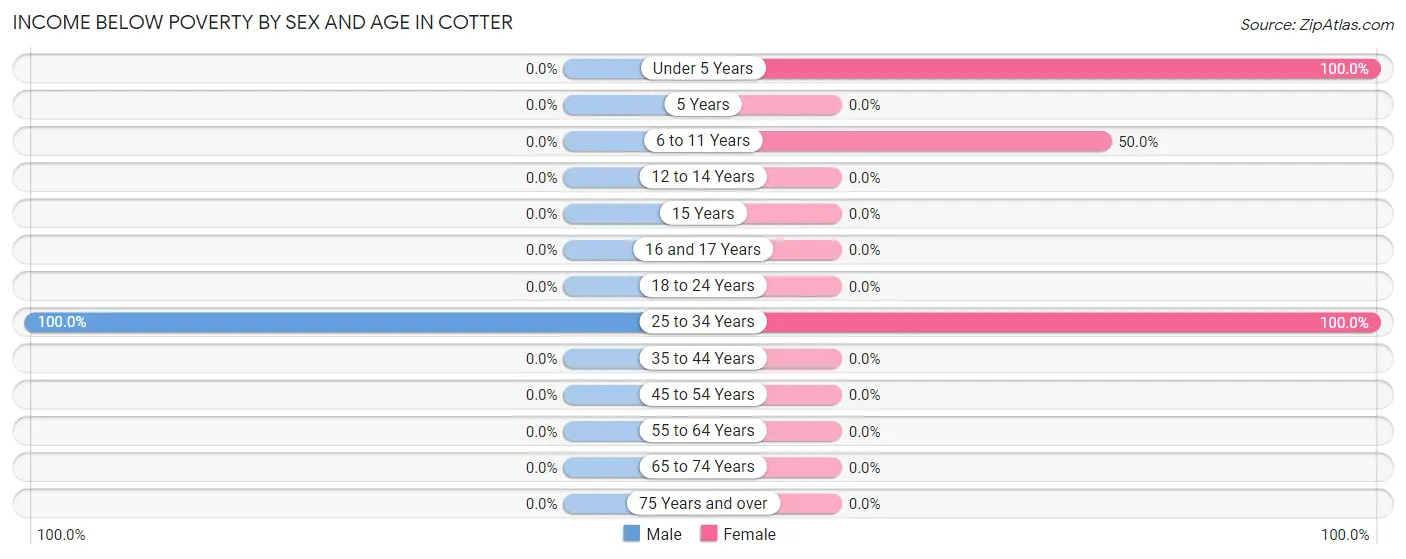
| Age Bracket | Male | Female |
| Under 5 Years | 0 (0.0%) | 1 (100.0%) |
| 5 Years | 0 (0.0%) | 0 (0.0%) |
| 6 to 11 Years | 0 (0.0%) | 1 (50.0%) |
| 12 to 14 Years | 0 (0.0%) | 0 (0.0%) |
| 15 Years | 0 (0.0%) | 0 (0.0%) |
| 16 and 17 Years | 0 (0.0%) | 0 (0.0%) |
| 18 to 24 Years | 0 (0.0%) | 0 (0.0%) |
| 25 to 34 Years | 1 (100.0%) | 1 (100.0%) |
| 35 to 44 Years | 0 (0.0%) | 0 (0.0%) |
| 45 to 54 Years | 0 (0.0%) | 0 (0.0%) |
| 55 to 64 Years | 0 (0.0%) | 0 (0.0%) |
| 65 to 74 Years | 0 (0.0%) | 0 (0.0%) |
| 75 Years and over | 0 (0.0%) | 0 (0.0%) |
| Total | 1 (16.7%) | 3 (21.4%) |
Income Above Poverty by Sex and Age in Cotter
According to the poverty statistics in Cotter, males aged 45 to 54 years and females aged 16 and 17 years are the age groups that are most secure financially, with 100.0% of males and 100.0% of females in these age groups living above the poverty line.
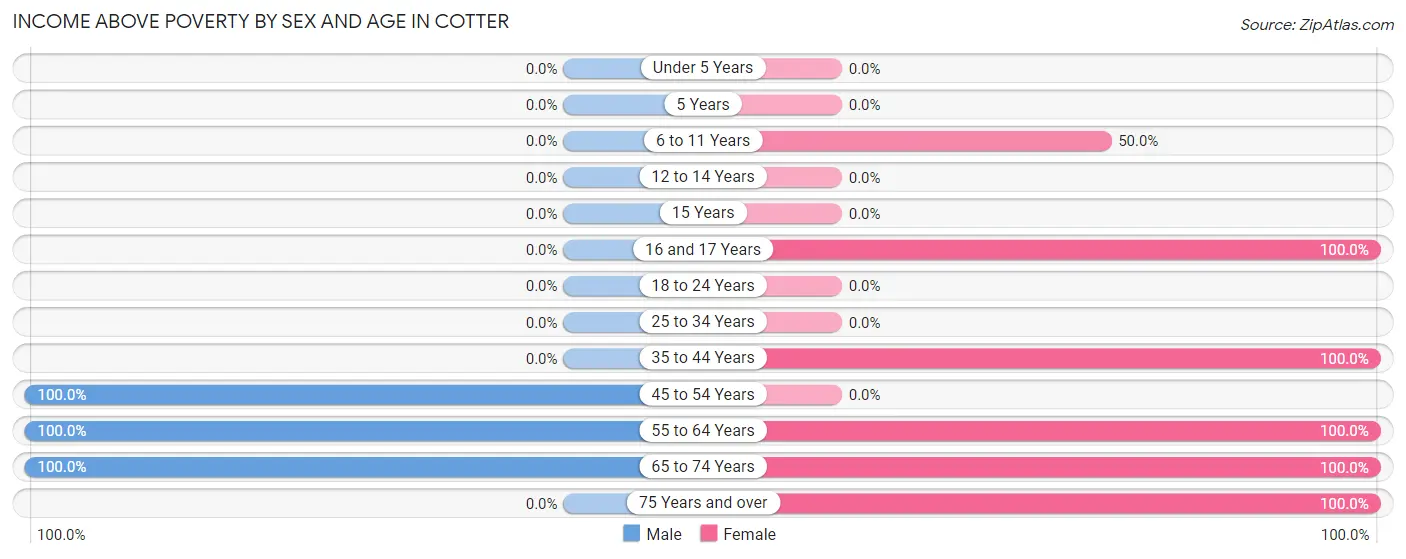
| Age Bracket | Male | Female |
| Under 5 Years | 0 (0.0%) | 0 (0.0%) |
| 5 Years | 0 (0.0%) | 0 (0.0%) |
| 6 to 11 Years | 0 (0.0%) | 1 (50.0%) |
| 12 to 14 Years | 0 (0.0%) | 0 (0.0%) |
| 15 Years | 0 (0.0%) | 0 (0.0%) |
| 16 and 17 Years | 0 (0.0%) | 2 (100.0%) |
| 18 to 24 Years | 0 (0.0%) | 0 (0.0%) |
| 25 to 34 Years | 0 (0.0%) | 0 (0.0%) |
| 35 to 44 Years | 0 (0.0%) | 1 (100.0%) |
| 45 to 54 Years | 2 (100.0%) | 0 (0.0%) |
| 55 to 64 Years | 1 (100.0%) | 2 (100.0%) |
| 65 to 74 Years | 2 (100.0%) | 4 (100.0%) |
| 75 Years and over | 0 (0.0%) | 1 (100.0%) |
| Total | 5 (83.3%) | 11 (78.6%) |
Income Below Poverty Among Married-Couple Families in Cotter
| Children | Above Poverty | Below Poverty |
| No Children | 3 (100.0%) | 0 (0.0%) |
| 1 or 2 Children | 1 (100.0%) | 0 (0.0%) |
| 3 or 4 Children | 0 (0.0%) | 0 (0.0%) |
| 5 or more Children | 0 (0.0%) | 0 (0.0%) |
| Total | 4 (100.0%) | 0 (0.0%) |
Income Below Poverty Among Single-Parent Households in Cotter
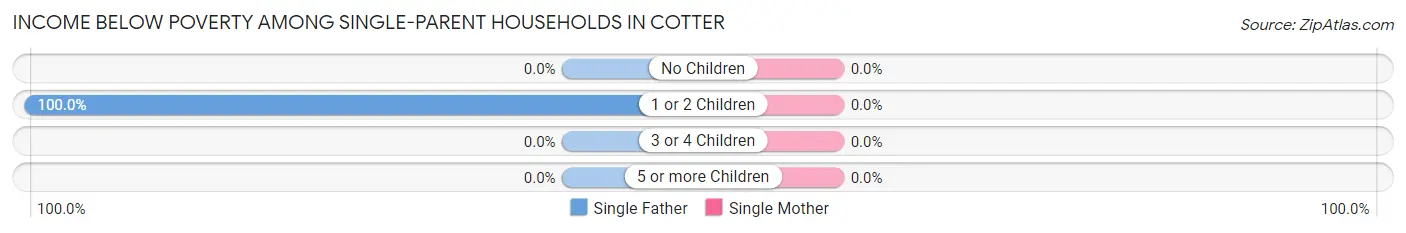
| Children | Single Father | Single Mother |
| No Children | 0 (0.0%) | 0 (0.0%) |
| 1 or 2 Children | 1 (100.0%) | 0 (0.0%) |
| 3 or 4 Children | 0 (0.0%) | 0 (0.0%) |
| 5 or more Children | 0 (0.0%) | 0 (0.0%) |
| Total | 1 (100.0%) | 0 (0.0%) |
Income Below Poverty Among Married-Couple vs Single-Parent Households in Cotter
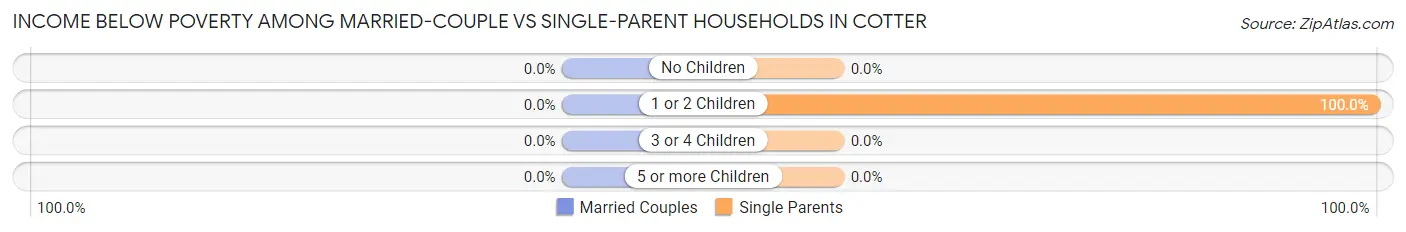
| Children | Married-Couple Families | Single-Parent Households |
| No Children | 0 (0.0%) | 0 (0.0%) |
| 1 or 2 Children | 0 (0.0%) | 1 (100.0%) |
| 3 or 4 Children | 0 (0.0%) | 0 (0.0%) |
| 5 or more Children | 0 (0.0%) | 0 (0.0%) |
| Total | 0 (0.0%) | 1 (100.0%) |
Race in Cotter
The most populous races in Cotter are White / Caucasian (21 | 100.0%), and Hispanic or Latino (2 | 9.5%).
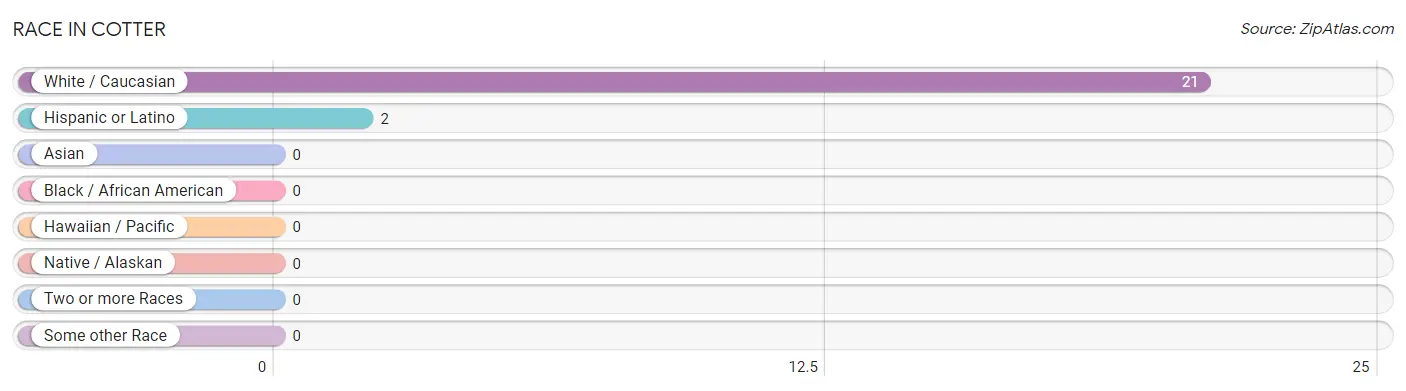
| Race | # Population | % Population |
| Asian | 0 | 0.0% |
| Black / African American | 0 | 0.0% |
| Hawaiian / Pacific | 0 | 0.0% |
| Hispanic or Latino | 2 | 9.5% |
| Native / Alaskan | 0 | 0.0% |
| White / Caucasian | 21 | 100.0% |
| Two or more Races | 0 | 0.0% |
| Some other Race | 0 | 0.0% |
| Total | 21 | 100.0% |
Ancestry in Cotter
The most populous ancestries reported in Cotter are American (7 | 33.3%), English (4 | 19.1%), European (4 | 19.1%), Dutch (2 | 9.5%), and Mexican (2 | 9.5%), together accounting for 90.5% of all Cotter residents.
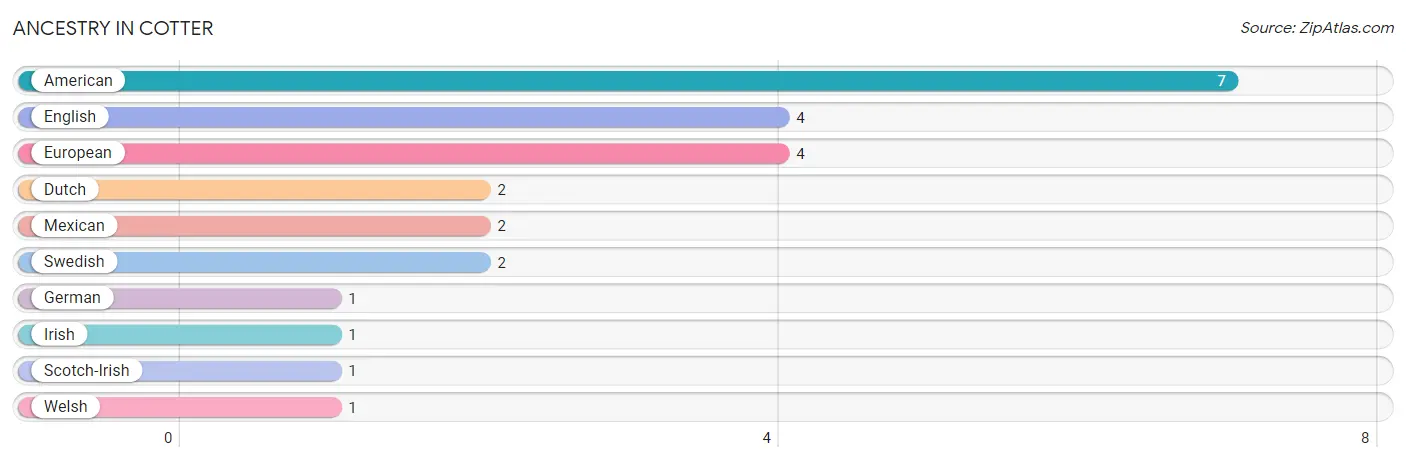
| Ancestry | # Population | % Population |
| American | 7 | 33.3% |
| Dutch | 2 | 9.5% |
| English | 4 | 19.1% |
| European | 4 | 19.1% |
| German | 1 | 4.8% |
| Irish | 1 | 4.8% |
| Mexican | 2 | 9.5% |
| Scotch-Irish | 1 | 4.8% |
| Swedish | 2 | 9.5% |
| Welsh | 1 | 4.8% | View All 10 Rows |
Immigrants in Cotter
The most numerous immigrant groups reported in Cotter came from Central America (2 | 9.5%), Latin America (2 | 9.5%), and Mexico (2 | 9.5%), together accounting for 28.6% of all Cotter residents.
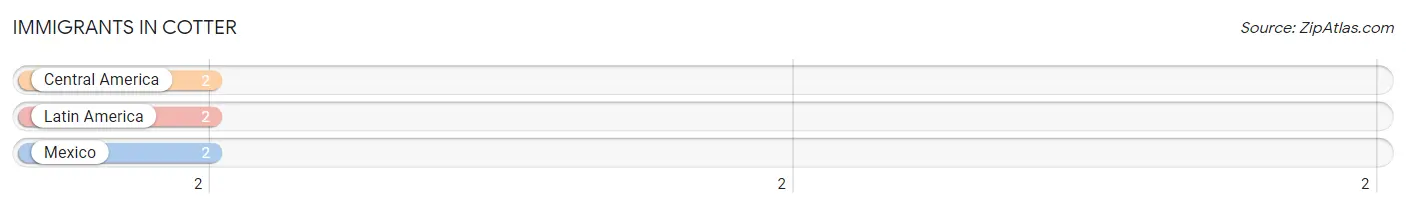
| Immigration Origin | # Population | % Population |
| Central America | 2 | 9.5% |
| Latin America | 2 | 9.5% |
| Mexico | 2 | 9.5% | View All 3 Rows |
Sex and Age in Cotter
Sex and Age in Cotter
The most populous age groups in Cotter are 50 to 54 Years (2 | 28.6%) for men and 65 to 69 Years (4 | 28.6%) for women.
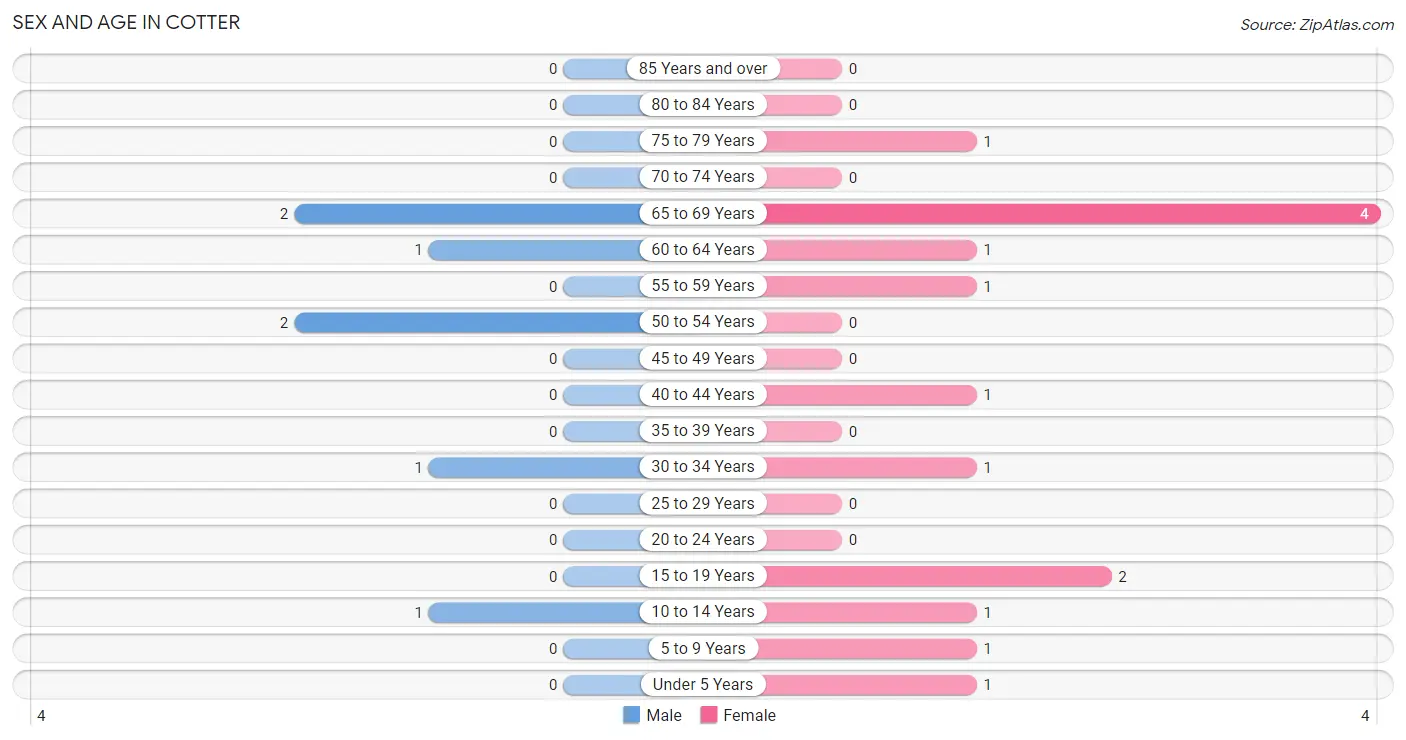
| Age Bracket | Male | Female |
| Under 5 Years | 0 (0.0%) | 1 (7.1%) |
| 5 to 9 Years | 0 (0.0%) | 1 (7.1%) |
| 10 to 14 Years | 1 (14.3%) | 1 (7.1%) |
| 15 to 19 Years | 0 (0.0%) | 2 (14.3%) |
| 20 to 24 Years | 0 (0.0%) | 0 (0.0%) |
| 25 to 29 Years | 0 (0.0%) | 0 (0.0%) |
| 30 to 34 Years | 1 (14.3%) | 1 (7.1%) |
| 35 to 39 Years | 0 (0.0%) | 0 (0.0%) |
| 40 to 44 Years | 0 (0.0%) | 1 (7.1%) |
| 45 to 49 Years | 0 (0.0%) | 0 (0.0%) |
| 50 to 54 Years | 2 (28.6%) | 0 (0.0%) |
| 55 to 59 Years | 0 (0.0%) | 1 (7.1%) |
| 60 to 64 Years | 1 (14.3%) | 1 (7.1%) |
| 65 to 69 Years | 2 (28.6%) | 4 (28.6%) |
| 70 to 74 Years | 0 (0.0%) | 0 (0.0%) |
| 75 to 79 Years | 0 (0.0%) | 1 (7.1%) |
| 80 to 84 Years | 0 (0.0%) | 0 (0.0%) |
| 85 Years and over | 0 (0.0%) | 0 (0.0%) |
| Total | 7 (100.0%) | 14 (100.0%) |
Families and Households in Cotter
Median Family Size in Cotter
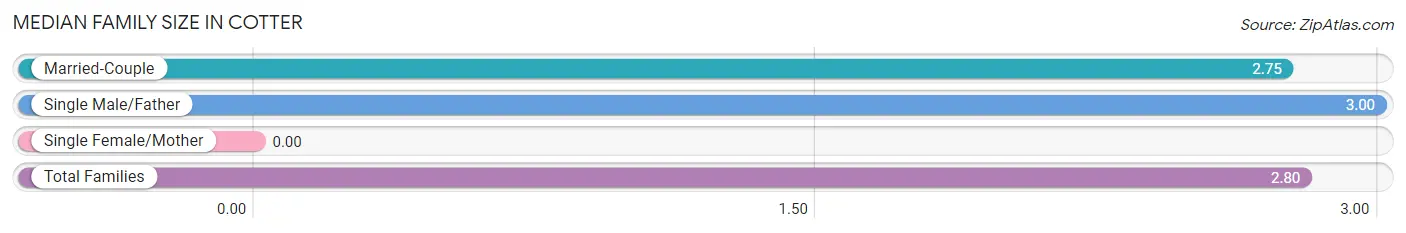
| Family Type | # Families | Family Size |
| Married-Couple | 4 (80.0%) | 2.75 |
| Single Male/Father | 1 (20.0%) | 3.00 |
| Single Female/Mother | 0 (0.0%) | - |
| Total Families | 5 (100.0%) | 2.80 |
Median Household Size in Cotter
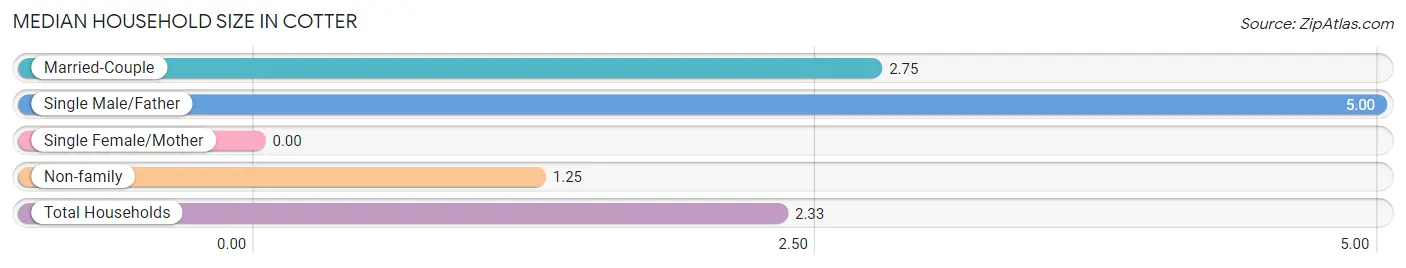
| Household Type | # Households | Household Size |
| Married-Couple | 4 (44.4%) | 2.75 |
| Single Male/Father | 1 (11.1%) | 5.00 |
| Single Female/Mother | 0 (0.0%) | - |
| Non-family | 4 (44.4%) | 1.25 |
| Total Households | 9 (100.0%) | 2.33 |
Household Size by Marriage Status in Cotter
Out of a total of 9 households in Cotter, 5 (55.6%) are family households, while 4 (44.4%) are nonfamily households. The most numerous type of family households are 2-person households, comprising 3, and the most common type of nonfamily households are 1-person households, comprising 3.
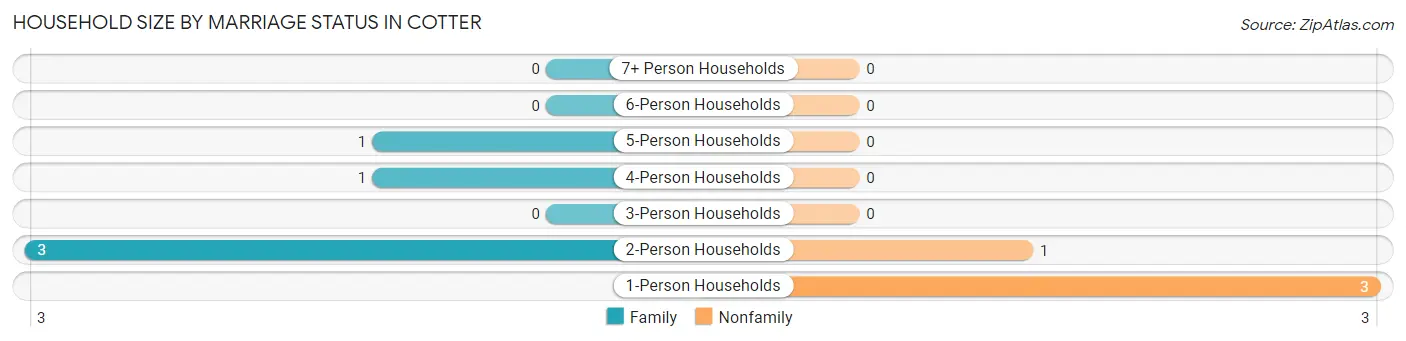
| Household Size | Family Households | Nonfamily Households |
| 1-Person Households | - | 3 (33.3%) |
| 2-Person Households | 3 (33.3%) | 1 (11.1%) |
| 3-Person Households | 0 (0.0%) | 0 (0.0%) |
| 4-Person Households | 1 (11.1%) | 0 (0.0%) |
| 5-Person Households | 1 (11.1%) | 0 (0.0%) |
| 6-Person Households | 0 (0.0%) | 0 (0.0%) |
| 7+ Person Households | 0 (0.0%) | 0 (0.0%) |
| Total | 5 (55.6%) | 4 (44.4%) |
Female Fertility in Cotter
Fertility by Age in Cotter
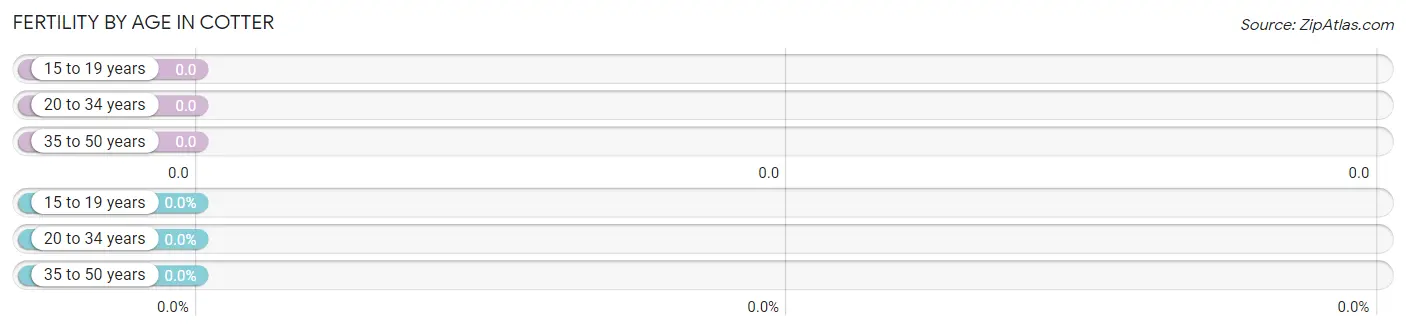
| Age Bracket | Women with Births | Births / 1,000 Women |
| 15 to 19 years | 0 (0.0%) | 0.0 |
| 20 to 34 years | 0 (0.0%) | 0.0 |
| 35 to 50 years | 0 (0.0%) | 0.0 |
| Total | 0 (0.0%) | 0.0 |
Fertility by Age by Marriage Status in Cotter
| Age Bracket | Married | Unmarried |
| 15 to 19 years | 0 (0.0%) | 0 (0.0%) |
| 20 to 34 years | 0 (0.0%) | 0 (0.0%) |
| 35 to 50 years | 0 (0.0%) | 0 (0.0%) |
| Total | 0 (0.0%) | 0 (0.0%) |
Fertility by Education in Cotter
| Educational Attainment | Women with Births | Births / 1,000 Women |
| Less than High School | 0 (0.0%) | 0.0 |
| High School Diploma | 0 (0.0%) | 0.0 |
| College or Associate's Degree | 0 (0.0%) | 0.0 |
| Bachelor's Degree | 0 (0.0%) | 0.0 |
| Graduate Degree | 0 (0.0%) | 0.0 |
| Total | 0 (0.0%) | 0.0 |
Fertility by Education by Marriage Status in Cotter
| Educational Attainment | Married | Unmarried |
| Less than High School | 0 (0.0%) | 0 (0.0%) |
| High School Diploma | 0 (0.0%) | 0 (0.0%) |
| College or Associate's Degree | 0 (0.0%) | 0 (0.0%) |
| Bachelor's Degree | 0 (0.0%) | 0 (0.0%) |
| Graduate Degree | 0 (0.0%) | 0 (0.0%) |
| Total | 0 (0.0%) | 0 (0.0%) |
Employment Characteristics in Cotter
Employment by Class of Employer in Cotter
Among the 8 employed individuals in Cotter, private company employees (5 | 62.5%), federal government employees (2 | 25.0%), and self-employed (incorporated) (1 | 12.5%) make up the most common classes of employment.
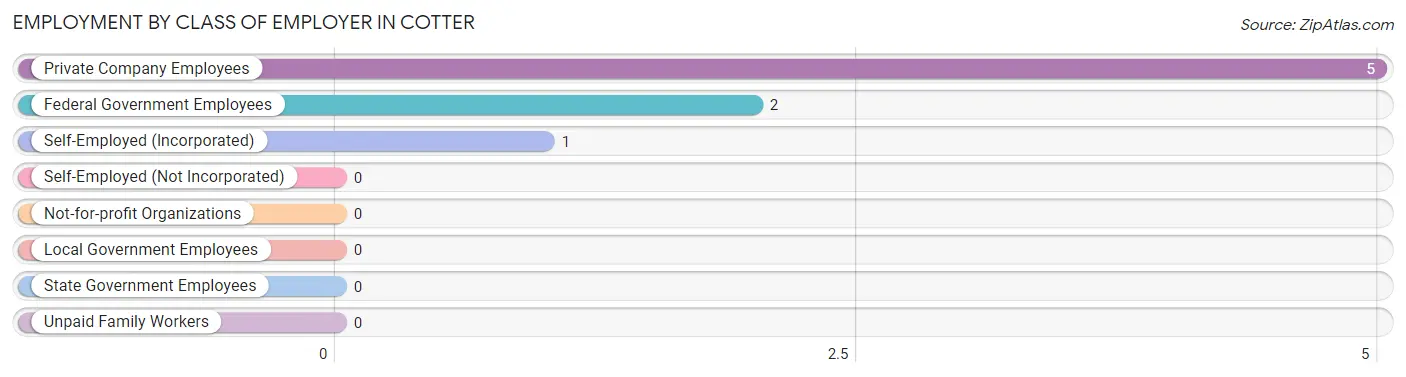
| Employer Class | # Employees | % Employees |
| Private Company Employees | 5 | 62.5% |
| Self-Employed (Incorporated) | 1 | 12.5% |
| Self-Employed (Not Incorporated) | 0 | 0.0% |
| Not-for-profit Organizations | 0 | 0.0% |
| Local Government Employees | 0 | 0.0% |
| State Government Employees | 0 | 0.0% |
| Federal Government Employees | 2 | 25.0% |
| Unpaid Family Workers | 0 | 0.0% |
| Total | 8 | 100.0% |
Employment Status by Age in Cotter
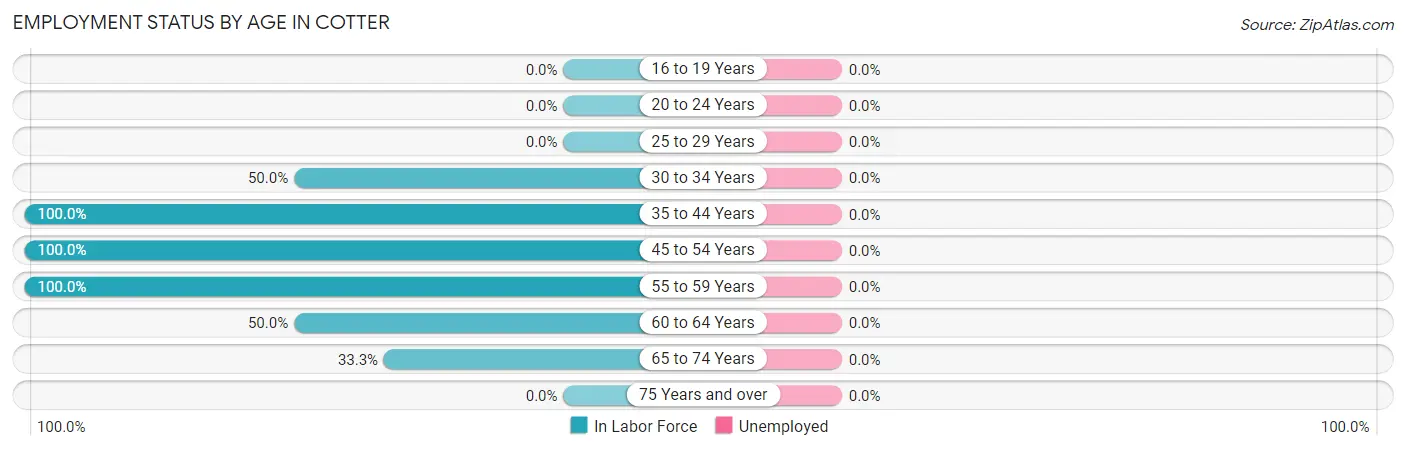
| Age Bracket | In Labor Force | Unemployed |
| 16 to 19 Years | 0 (0.0%) | 0 (0.0%) |
| 20 to 24 Years | 0 (0.0%) | 0 (0.0%) |
| 25 to 29 Years | 0 (0.0%) | 0 (0.0%) |
| 30 to 34 Years | 1 (50.0%) | 0 (0.0%) |
| 35 to 44 Years | 1 (100.0%) | 0 (0.0%) |
| 45 to 54 Years | 2 (100.0%) | 0 (0.0%) |
| 55 to 59 Years | 1 (100.0%) | 0 (0.0%) |
| 60 to 64 Years | 1 (50.0%) | 0 (0.0%) |
| 65 to 74 Years | 2 (33.3%) | 0 (0.0%) |
| 75 Years and over | 0 (0.0%) | 0 (0.0%) |
| Total | 8 (47.1%) | 0 (0.0%) |
Employment Status by Educational Attainment in Cotter
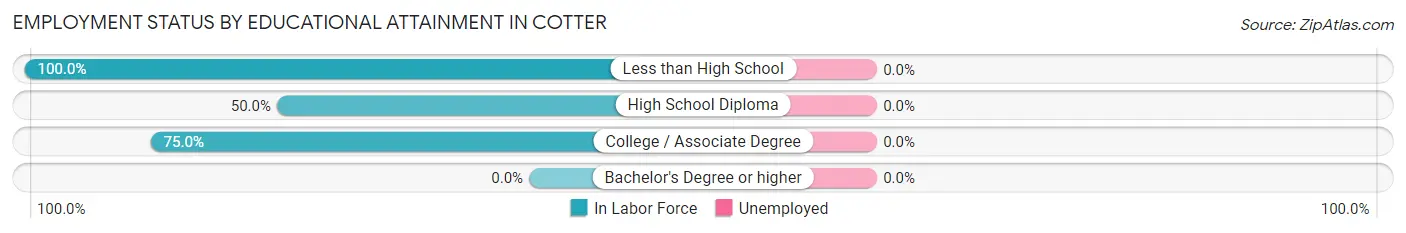
| Educational Attainment | In Labor Force | Unemployed |
| Less than High School | 2 (100.0%) | 0 (0.0%) |
| High School Diploma | 1 (50.0%) | 0 (0.0%) |
| College / Associate Degree | 3 (75.0%) | 0 (0.0%) |
| Bachelor's Degree or higher | 0 (0.0%) | 0 (0.0%) |
| Total | 6 (75.0%) | 0 (0.0%) |
Employment Occupations by Sex in Cotter
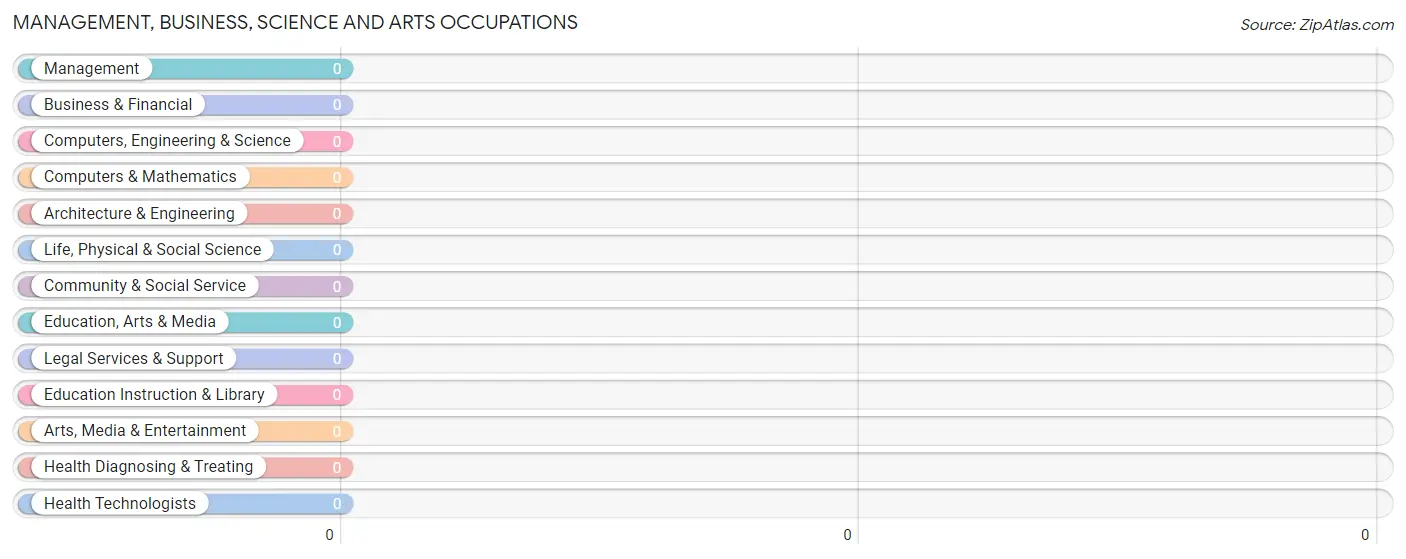
Management, Business, Science and Arts Occupations
Management, Business, Science and Arts Occupations by Sex
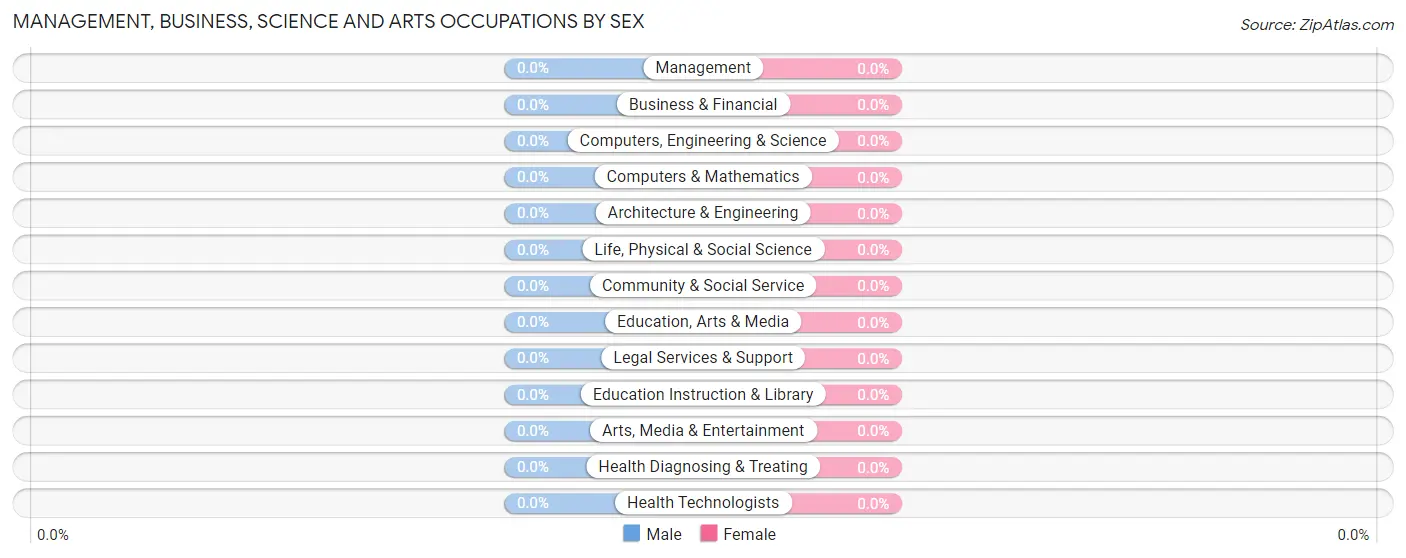
| Occupation | Male | Female |
| Management | 0 (0.0%) | 0 (0.0%) |
| Business & Financial | 0 (0.0%) | 0 (0.0%) |
| Computers, Engineering & Science | 0 (0.0%) | 0 (0.0%) |
| Computers & Mathematics | 0 (0.0%) | 0 (0.0%) |
| Architecture & Engineering | 0 (0.0%) | 0 (0.0%) |
| Life, Physical & Social Science | 0 (0.0%) | 0 (0.0%) |
| Community & Social Service | 0 (0.0%) | 0 (0.0%) |
| Education, Arts & Media | 0 (0.0%) | 0 (0.0%) |
| Legal Services & Support | 0 (0.0%) | 0 (0.0%) |
| Education Instruction & Library | 0 (0.0%) | 0 (0.0%) |
| Arts, Media & Entertainment | 0 (0.0%) | 0 (0.0%) |
| Health Diagnosing & Treating | 0 (0.0%) | 0 (0.0%) |
| Health Technologists | 0 (0.0%) | 0 (0.0%) |
| Total (Category) | 0 (0.0%) | 0 (0.0%) |
| Total (Overall) | 4 (50.0%) | 4 (50.0%) |
Services Occupations
The most common Services occupations in Cotter are , and Food Preparation & Serving (1 | 12.5%).
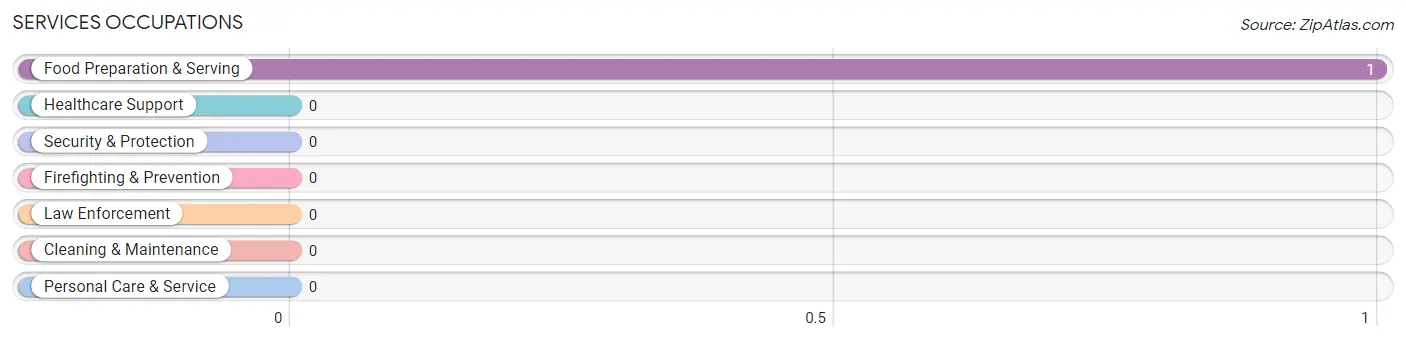
Services Occupations by Sex
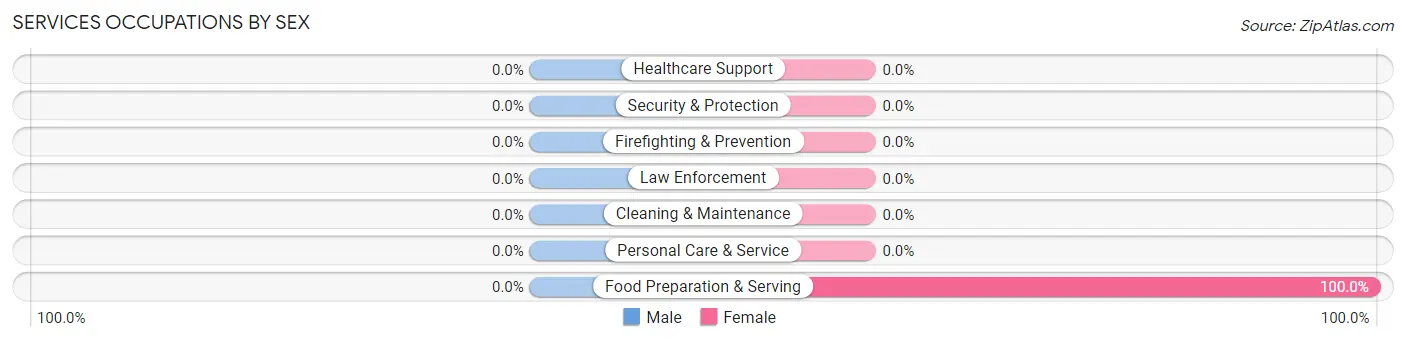
| Occupation | Male | Female |
| Healthcare Support | 0 (0.0%) | 0 (0.0%) |
| Security & Protection | 0 (0.0%) | 0 (0.0%) |
| Firefighting & Prevention | 0 (0.0%) | 0 (0.0%) |
| Law Enforcement | 0 (0.0%) | 0 (0.0%) |
| Food Preparation & Serving | 0 (0.0%) | 1 (100.0%) |
| Cleaning & Maintenance | 0 (0.0%) | 0 (0.0%) |
| Personal Care & Service | 0 (0.0%) | 0 (0.0%) |
| Total (Category) | 0 (0.0%) | 1 (100.0%) |
| Total (Overall) | 4 (50.0%) | 4 (50.0%) |
Sales and Office Occupations
The most common Sales and Office occupations in Cotter are , and Office & Administration (4 | 50.0%).
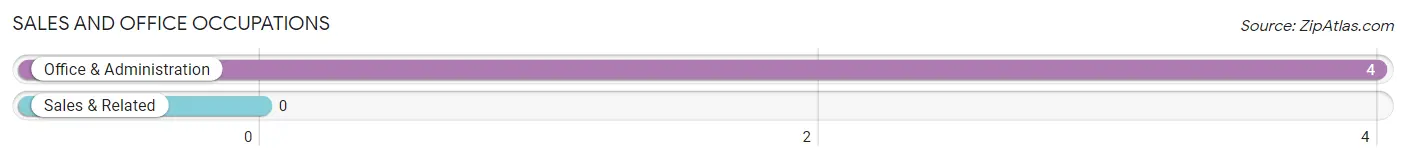
Sales and Office Occupations by Sex
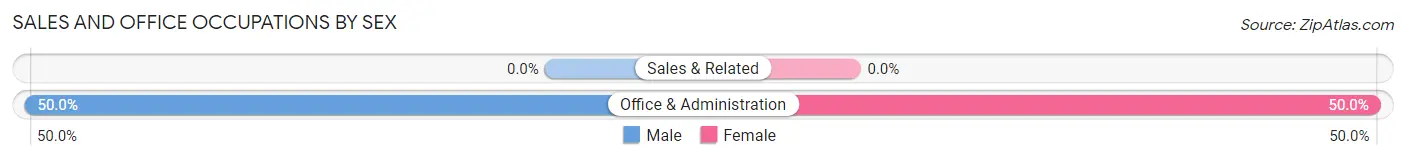
| Occupation | Male | Female |
| Sales & Related | 0 (0.0%) | 0 (0.0%) |
| Office & Administration | 2 (50.0%) | 2 (50.0%) |
| Total (Category) | 2 (50.0%) | 2 (50.0%) |
| Total (Overall) | 4 (50.0%) | 4 (50.0%) |
Natural Resources, Construction and Maintenance Occupations
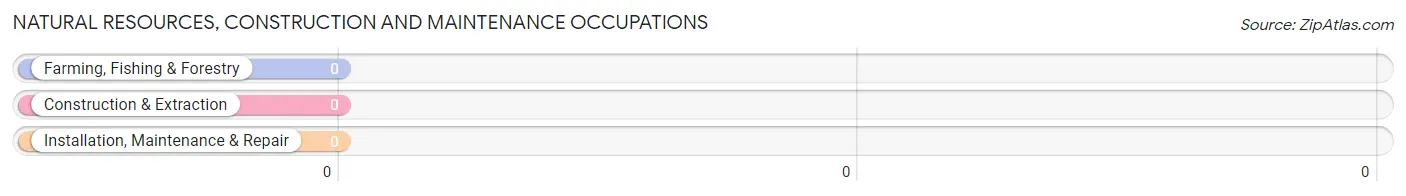
Natural Resources, Construction and Maintenance Occupations by Sex
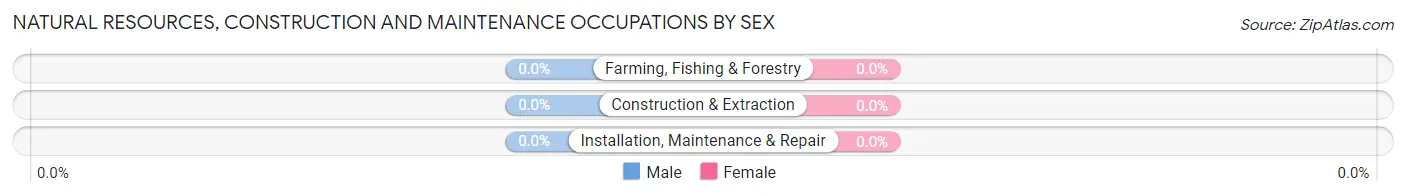
| Occupation | Male | Female |
| Farming, Fishing & Forestry | 0 (0.0%) | 0 (0.0%) |
| Construction & Extraction | 0 (0.0%) | 0 (0.0%) |
| Installation, Maintenance & Repair | 0 (0.0%) | 0 (0.0%) |
| Total (Category) | 0 (0.0%) | 0 (0.0%) |
| Total (Overall) | 4 (50.0%) | 4 (50.0%) |
Production, Transportation and Moving Occupations
The most common Production, Transportation and Moving occupations in Cotter are Production (2 | 25.0%), and Transportation (1 | 12.5%).
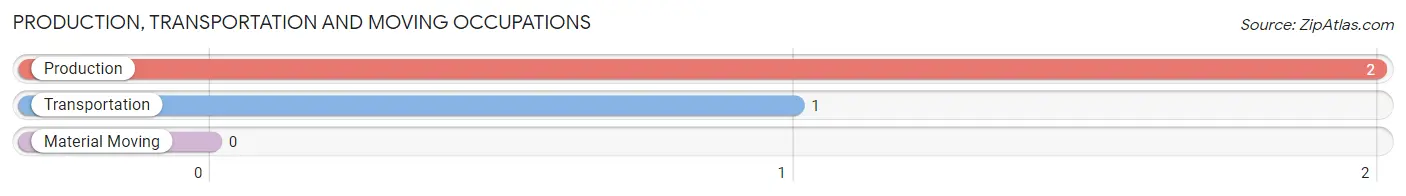
Production, Transportation and Moving Occupations by Sex
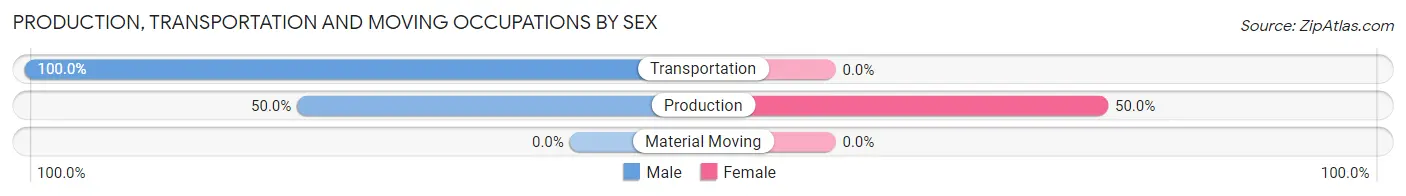
| Occupation | Male | Female |
| Production | 1 (50.0%) | 1 (50.0%) |
| Transportation | 1 (100.0%) | 0 (0.0%) |
| Material Moving | 0 (0.0%) | 0 (0.0%) |
| Total (Category) | 2 (66.7%) | 1 (33.3%) |
| Total (Overall) | 4 (50.0%) | 4 (50.0%) |
Employment Industries by Sex in Cotter
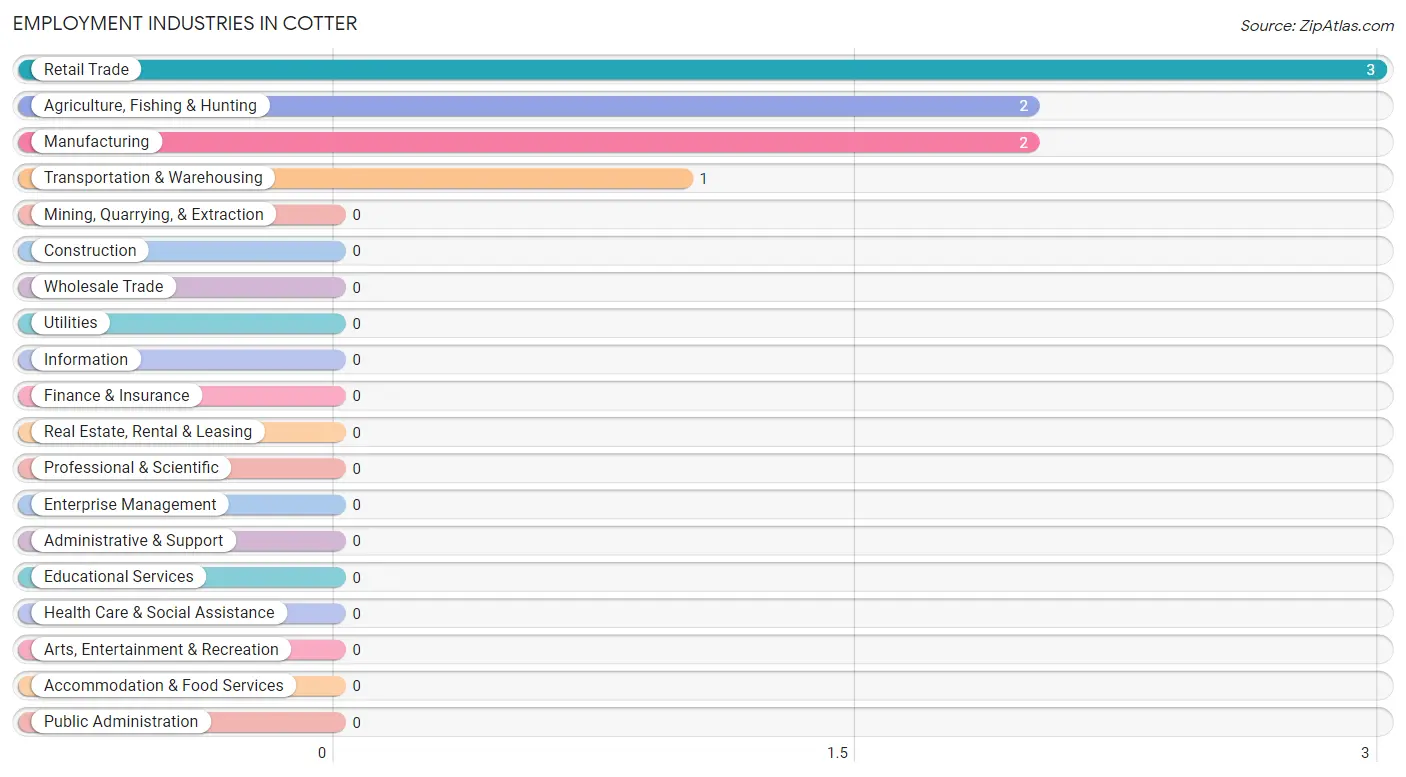
Employment Industries in Cotter
The major employment industries in Cotter include Retail Trade (3 | 37.5%), Agriculture, Fishing & Hunting (2 | 25.0%), Manufacturing (2 | 25.0%), and Transportation & Warehousing (1 | 12.5%).
Employment Industries by Sex in Cotter
The Cotter industries that see more men than women are Transportation & Warehousing (100.0%), Retail Trade (66.7%), and Manufacturing (50.0%), whereas the industries that tend to have a higher number of women are Agriculture, Fishing & Hunting (100.0%), Manufacturing (50.0%), and Retail Trade (33.3%).
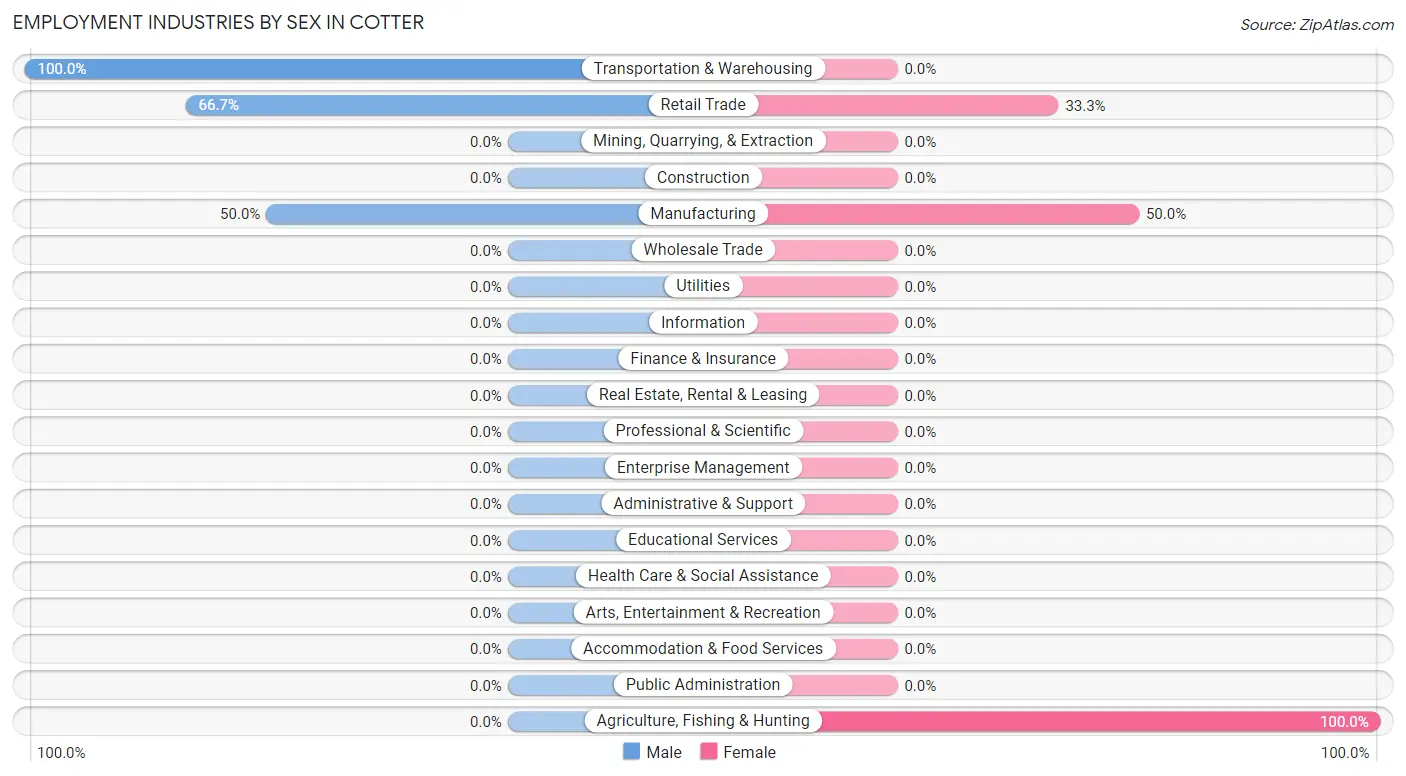
| Industry | Male | Female |
| Agriculture, Fishing & Hunting | 0 (0.0%) | 2 (100.0%) |
| Mining, Quarrying, & Extraction | 0 (0.0%) | 0 (0.0%) |
| Construction | 0 (0.0%) | 0 (0.0%) |
| Manufacturing | 1 (50.0%) | 1 (50.0%) |
| Wholesale Trade | 0 (0.0%) | 0 (0.0%) |
| Retail Trade | 2 (66.7%) | 1 (33.3%) |
| Transportation & Warehousing | 1 (100.0%) | 0 (0.0%) |
| Utilities | 0 (0.0%) | 0 (0.0%) |
| Information | 0 (0.0%) | 0 (0.0%) |
| Finance & Insurance | 0 (0.0%) | 0 (0.0%) |
| Real Estate, Rental & Leasing | 0 (0.0%) | 0 (0.0%) |
| Professional & Scientific | 0 (0.0%) | 0 (0.0%) |
| Enterprise Management | 0 (0.0%) | 0 (0.0%) |
| Administrative & Support | 0 (0.0%) | 0 (0.0%) |
| Educational Services | 0 (0.0%) | 0 (0.0%) |
| Health Care & Social Assistance | 0 (0.0%) | 0 (0.0%) |
| Arts, Entertainment & Recreation | 0 (0.0%) | 0 (0.0%) |
| Accommodation & Food Services | 0 (0.0%) | 0 (0.0%) |
| Public Administration | 0 (0.0%) | 0 (0.0%) |
| Total | 4 (50.0%) | 4 (50.0%) |
Education in Cotter
School Enrollment in Cotter
The most common levels of schooling among the 5 students in Cotter are high school (3 | 60.0%), and elementary school (2 | 40.0%).
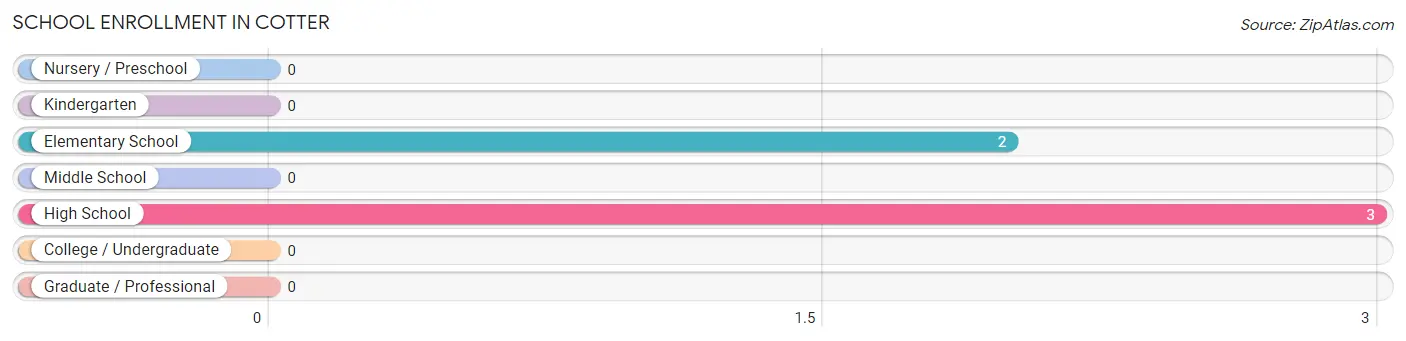
| School Level | # Students | % Students |
| Nursery / Preschool | 0 | 0.0% |
| Kindergarten | 0 | 0.0% |
| Elementary School | 2 | 40.0% |
| Middle School | 0 | 0.0% |
| High School | 3 | 60.0% |
| College / Undergraduate | 0 | 0.0% |
| Graduate / Professional | 0 | 0.0% |
| Total | 5 | 100.0% |
School Enrollment by Age by Funding Source in Cotter
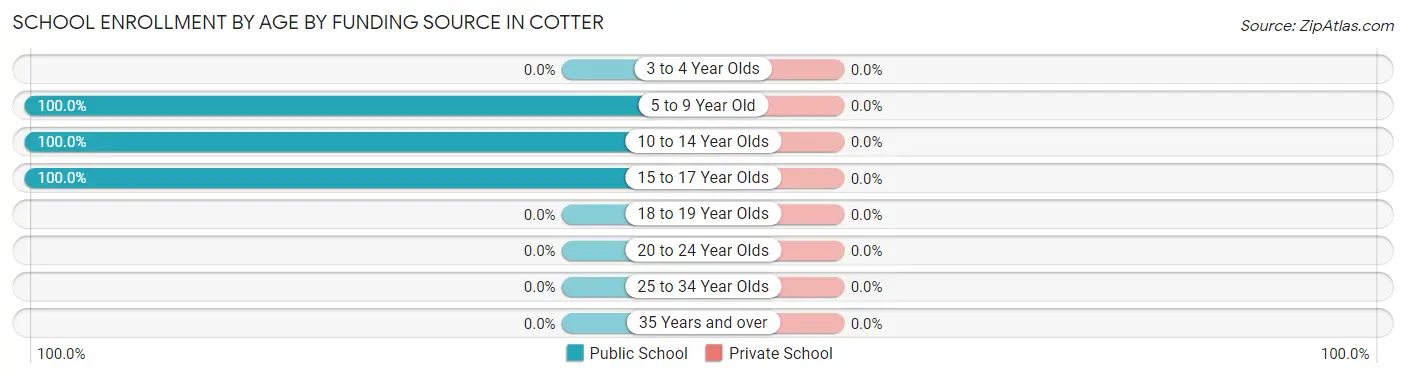
| Age Bracket | Public School | Private School |
| 3 to 4 Year Olds | 0 (0.0%) | 0 (0.0%) |
| 5 to 9 Year Old | 1 (100.0%) | 0 (0.0%) |
| 10 to 14 Year Olds | 2 (100.0%) | 0 (0.0%) |
| 15 to 17 Year Olds | 2 (100.0%) | 0 (0.0%) |
| 18 to 19 Year Olds | 0 (0.0%) | 0 (0.0%) |
| 20 to 24 Year Olds | 0 (0.0%) | 0 (0.0%) |
| 25 to 34 Year Olds | 0 (0.0%) | 0 (0.0%) |
| 35 Years and over | 0 (0.0%) | 0 (0.0%) |
| Total | 5 (100.0%) | 0 (0.0%) |
Educational Attainment by Field of Study in Cotter
| Field of Study | # Graduates | % Graduates |
| Computers & Mathematics | 0 | 0.0% |
| Bio, Nature & Agricultural | 0 | 0.0% |
| Physical & Health Sciences | 0 | 0.0% |
| Psychology | 0 | 0.0% |
| Social Sciences | 0 | 0.0% |
| Engineering | 0 | 0.0% |
| Multidisciplinary Studies | 0 | 0.0% |
| Science & Technology | 0 | 0.0% |
| Business | 0 | 0.0% |
| Education | 0 | 0.0% |
| Literature & Languages | 0 | 0.0% |
| Liberal Arts & History | 0 | 0.0% |
| Visual & Performing Arts | 0 | 0.0% |
| Communications | 0 | 0.0% |
| Arts & Humanities | 0 | 0.0% |
| Total | 0 | 0.0% |
Transportation & Commute in Cotter
Vehicle Availability by Sex in Cotter
The most prevalent vehicle ownership categories in Cotter are males with 3 vehicles (2, accounting for 50.0%) and females with 3 vehicles (1, making up 50.0%).
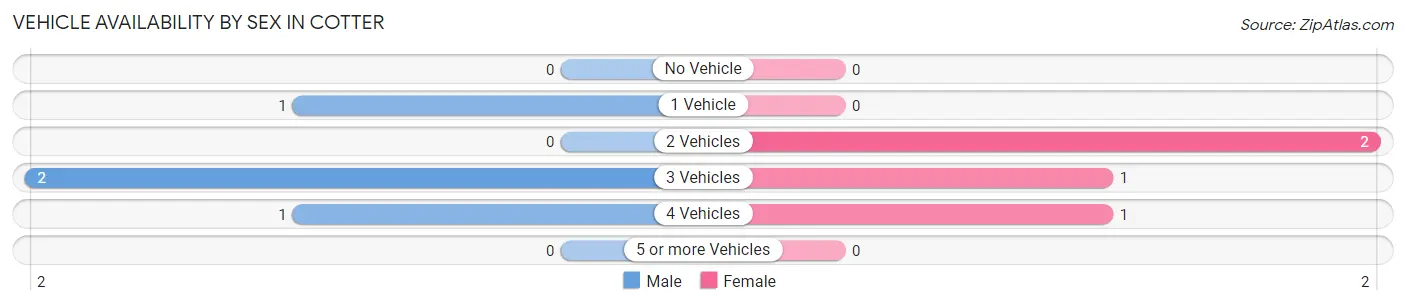
| Vehicles Available | Male | Female |
| No Vehicle | 0 (0.0%) | 0 (0.0%) |
| 1 Vehicle | 1 (25.0%) | 0 (0.0%) |
| 2 Vehicles | 0 (0.0%) | 2 (50.0%) |
| 3 Vehicles | 2 (50.0%) | 1 (25.0%) |
| 4 Vehicles | 1 (25.0%) | 1 (25.0%) |
| 5 or more Vehicles | 0 (0.0%) | 0 (0.0%) |
| Total | 4 (100.0%) | 4 (100.0%) |
Commute Time in Cotter
The most frequently occuring commute durations in Cotter are 10 to 14 minutes (2 commuters, 25.0%), 15 to 19 minutes (2 commuters, 25.0%), and 20 to 24 minutes (2 commuters, 25.0%).
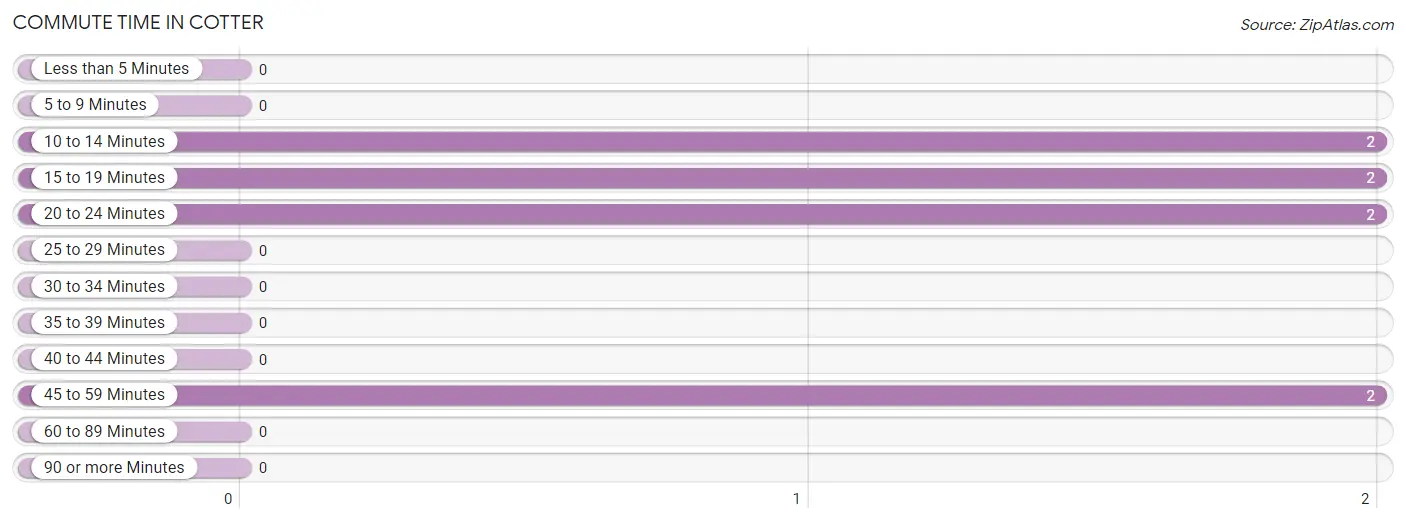
| Commute Time | # Commuters | % Commuters |
| Less than 5 Minutes | 0 | 0.0% |
| 5 to 9 Minutes | 0 | 0.0% |
| 10 to 14 Minutes | 2 | 25.0% |
| 15 to 19 Minutes | 2 | 25.0% |
| 20 to 24 Minutes | 2 | 25.0% |
| 25 to 29 Minutes | 0 | 0.0% |
| 30 to 34 Minutes | 0 | 0.0% |
| 35 to 39 Minutes | 0 | 0.0% |
| 40 to 44 Minutes | 0 | 0.0% |
| 45 to 59 Minutes | 2 | 25.0% |
| 60 to 89 Minutes | 0 | 0.0% |
| 90 or more Minutes | 0 | 0.0% |
Commute Time by Sex in Cotter
The most common commute times in Cotter are 45 to 59 minutes (2 commuters, 50.0%) for males and 20 to 24 minutes (2 commuters, 50.0%) for females.
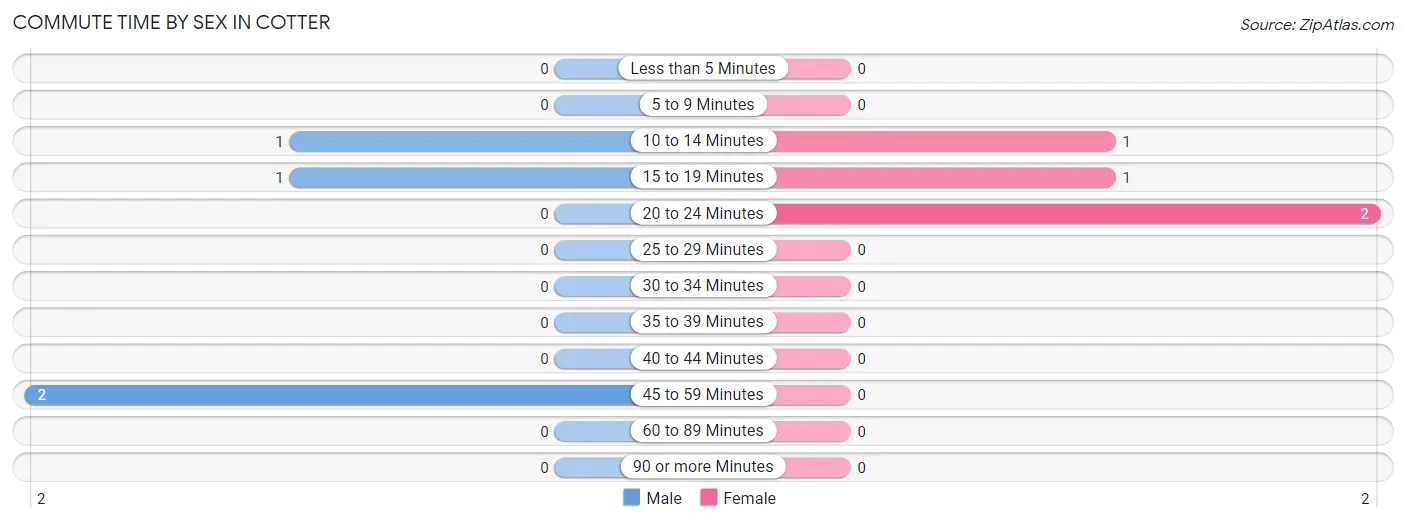
| Commute Time | Male | Female |
| Less than 5 Minutes | 0 (0.0%) | 0 (0.0%) |
| 5 to 9 Minutes | 0 (0.0%) | 0 (0.0%) |
| 10 to 14 Minutes | 1 (25.0%) | 1 (25.0%) |
| 15 to 19 Minutes | 1 (25.0%) | 1 (25.0%) |
| 20 to 24 Minutes | 0 (0.0%) | 2 (50.0%) |
| 25 to 29 Minutes | 0 (0.0%) | 0 (0.0%) |
| 30 to 34 Minutes | 0 (0.0%) | 0 (0.0%) |
| 35 to 39 Minutes | 0 (0.0%) | 0 (0.0%) |
| 40 to 44 Minutes | 0 (0.0%) | 0 (0.0%) |
| 45 to 59 Minutes | 2 (50.0%) | 0 (0.0%) |
| 60 to 89 Minutes | 0 (0.0%) | 0 (0.0%) |
| 90 or more Minutes | 0 (0.0%) | 0 (0.0%) |
Time of Departure to Work by Sex in Cotter
The most frequent times of departure to work in Cotter are 12:00 AM to 4:59 AM (1, 25.0%) for males and 6:00 AM to 6:29 AM (2, 50.0%) for females.
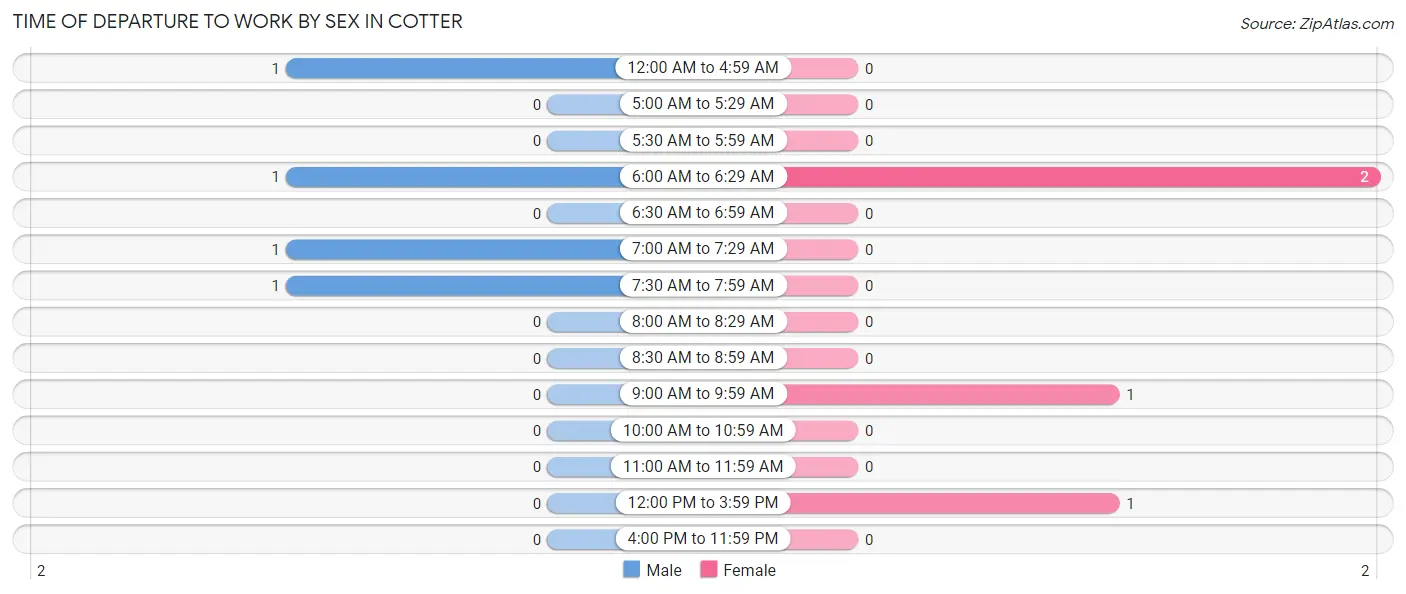
| Time of Departure | Male | Female |
| 12:00 AM to 4:59 AM | 1 (25.0%) | 0 (0.0%) |
| 5:00 AM to 5:29 AM | 0 (0.0%) | 0 (0.0%) |
| 5:30 AM to 5:59 AM | 0 (0.0%) | 0 (0.0%) |
| 6:00 AM to 6:29 AM | 1 (25.0%) | 2 (50.0%) |
| 6:30 AM to 6:59 AM | 0 (0.0%) | 0 (0.0%) |
| 7:00 AM to 7:29 AM | 1 (25.0%) | 0 (0.0%) |
| 7:30 AM to 7:59 AM | 1 (25.0%) | 0 (0.0%) |
| 8:00 AM to 8:29 AM | 0 (0.0%) | 0 (0.0%) |
| 8:30 AM to 8:59 AM | 0 (0.0%) | 0 (0.0%) |
| 9:00 AM to 9:59 AM | 0 (0.0%) | 1 (25.0%) |
| 10:00 AM to 10:59 AM | 0 (0.0%) | 0 (0.0%) |
| 11:00 AM to 11:59 AM | 0 (0.0%) | 0 (0.0%) |
| 12:00 PM to 3:59 PM | 0 (0.0%) | 1 (25.0%) |
| 4:00 PM to 11:59 PM | 0 (0.0%) | 0 (0.0%) |
| Total | 4 (100.0%) | 4 (100.0%) |
Housing Occupancy in Cotter
Occupancy by Ownership in Cotter
Of the total 9 dwellings in Cotter, owner-occupied units account for 8 (88.9%), while renter-occupied units make up 1 (11.1%).
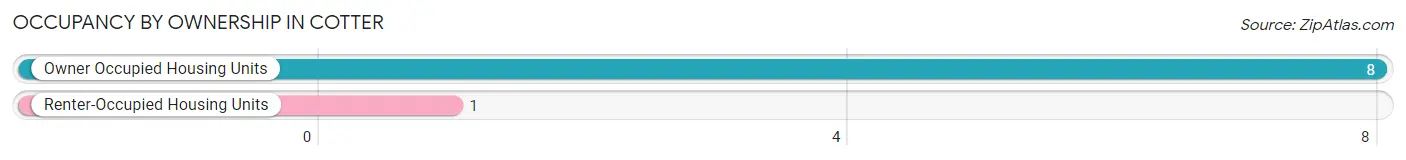
| Occupancy | # Housing Units | % Housing Units |
| Owner Occupied Housing Units | 8 | 88.9% |
| Renter-Occupied Housing Units | 1 | 11.1% |
| Total Occupied Housing Units | 9 | 100.0% |
Occupancy by Household Size in Cotter
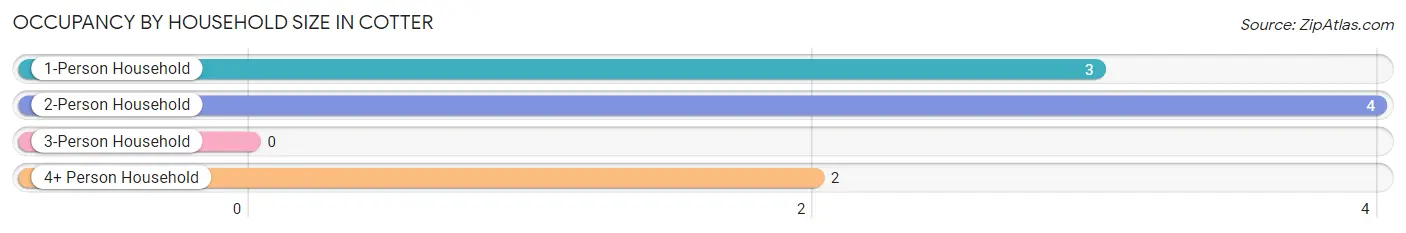
| Household Size | # Housing Units | % Housing Units |
| 1-Person Household | 3 | 33.3% |
| 2-Person Household | 4 | 44.4% |
| 3-Person Household | 0 | 0.0% |
| 4+ Person Household | 2 | 22.2% |
| Total Housing Units | 9 | 100.0% |
Occupancy by Ownership by Household Size in Cotter
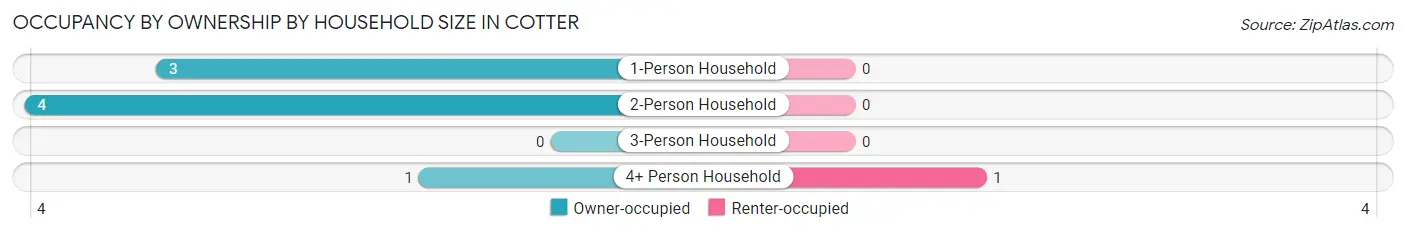
| Household Size | Owner-occupied | Renter-occupied |
| 1-Person Household | 3 (100.0%) | 0 (0.0%) |
| 2-Person Household | 4 (100.0%) | 0 (0.0%) |
| 3-Person Household | 0 (0.0%) | 0 (0.0%) |
| 4+ Person Household | 1 (50.0%) | 1 (50.0%) |
| Total Housing Units | 8 (88.9%) | 1 (11.1%) |
Occupancy by Educational Attainment in Cotter
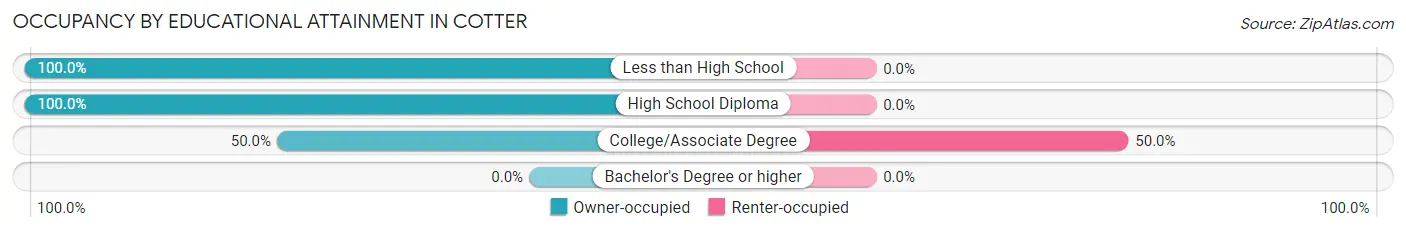
| Household Size | Owner-occupied | Renter-occupied |
| Less than High School | 1 (100.0%) | 0 (0.0%) |
| High School Diploma | 6 (100.0%) | 0 (0.0%) |
| College/Associate Degree | 1 (50.0%) | 1 (50.0%) |
| Bachelor's Degree or higher | 0 (0.0%) | 0 (0.0%) |
Occupancy by Age of Householder in Cotter
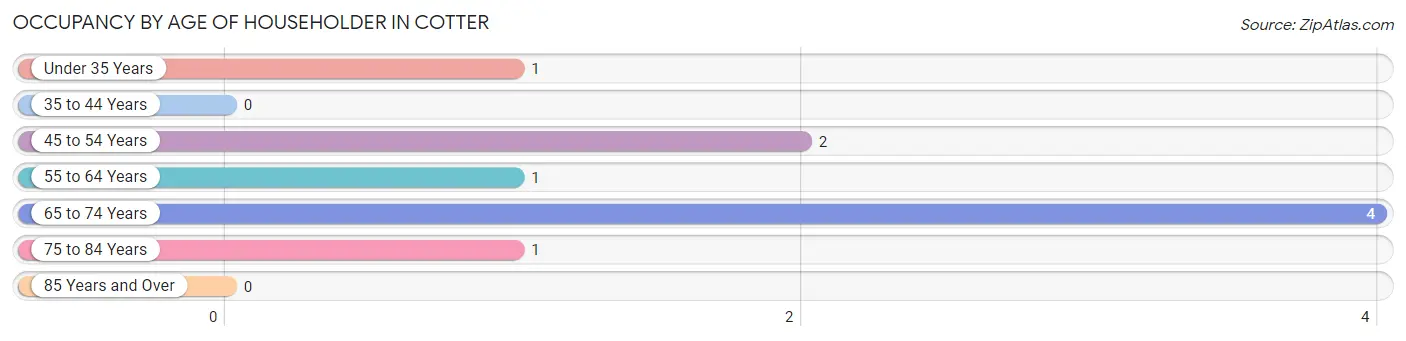
| Age Bracket | # Households | % Households |
| Under 35 Years | 1 | 11.1% |
| 35 to 44 Years | 0 | 0.0% |
| 45 to 54 Years | 2 | 22.2% |
| 55 to 64 Years | 1 | 11.1% |
| 65 to 74 Years | 4 | 44.4% |
| 75 to 84 Years | 1 | 11.1% |
| 85 Years and Over | 0 | 0.0% |
| Total | 9 | 100.0% |
Housing Finances in Cotter
Median Income by Occupancy in Cotter
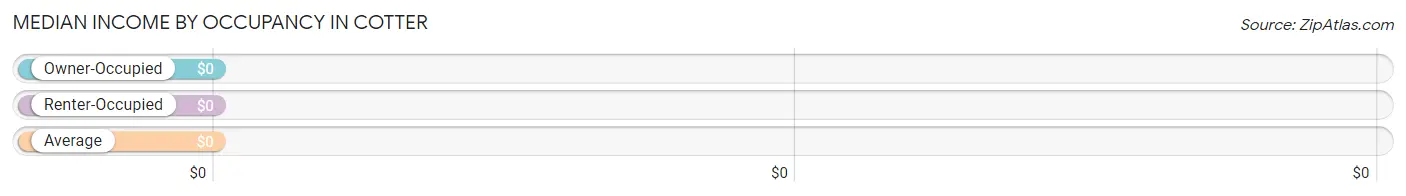
| Occupancy Type | # Households | Median Income |
| Owner-Occupied | 8 (88.9%) | $0 |
| Renter-Occupied | 1 (11.1%) | $0 |
| Average | 9 (100.0%) | $0 |
Occupancy by Householder Income Bracket in Cotter
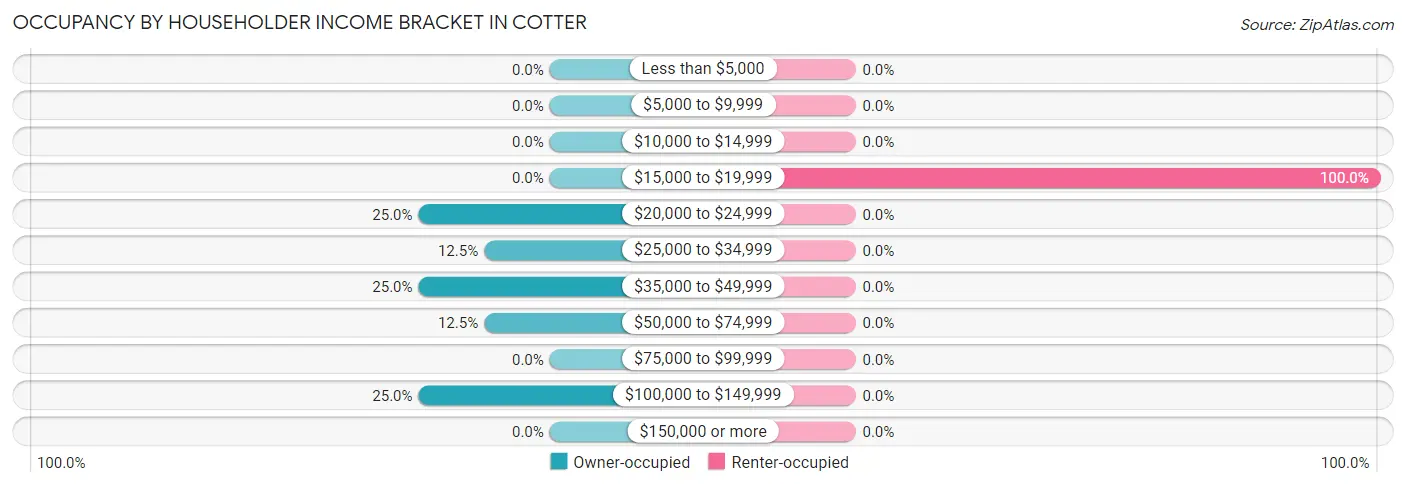
| Income Bracket | Owner-occupied | Renter-occupied |
| Less than $5,000 | 0 (0.0%) | 0 (0.0%) |
| $5,000 to $9,999 | 0 (0.0%) | 0 (0.0%) |
| $10,000 to $14,999 | 0 (0.0%) | 0 (0.0%) |
| $15,000 to $19,999 | 0 (0.0%) | 1 (100.0%) |
| $20,000 to $24,999 | 2 (25.0%) | 0 (0.0%) |
| $25,000 to $34,999 | 1 (12.5%) | 0 (0.0%) |
| $35,000 to $49,999 | 2 (25.0%) | 0 (0.0%) |
| $50,000 to $74,999 | 1 (12.5%) | 0 (0.0%) |
| $75,000 to $99,999 | 0 (0.0%) | 0 (0.0%) |
| $100,000 to $149,999 | 2 (25.0%) | 0 (0.0%) |
| $150,000 or more | 0 (0.0%) | 0 (0.0%) |
| Total | 8 (100.0%) | 1 (100.0%) |
Monthly Housing Cost Tiers in Cotter
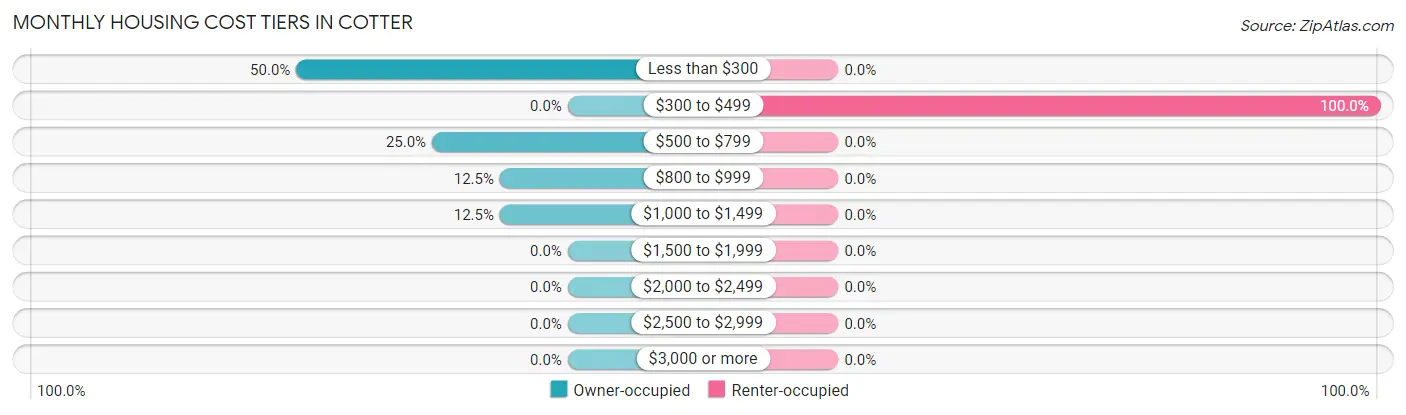
| Monthly Cost | Owner-occupied | Renter-occupied |
| Less than $300 | 4 (50.0%) | 0 (0.0%) |
| $300 to $499 | 0 (0.0%) | 1 (100.0%) |
| $500 to $799 | 2 (25.0%) | 0 (0.0%) |
| $800 to $999 | 1 (12.5%) | 0 (0.0%) |
| $1,000 to $1,499 | 1 (12.5%) | 0 (0.0%) |
| $1,500 to $1,999 | 0 (0.0%) | 0 (0.0%) |
| $2,000 to $2,499 | 0 (0.0%) | 0 (0.0%) |
| $2,500 to $2,999 | 0 (0.0%) | 0 (0.0%) |
| $3,000 or more | 0 (0.0%) | 0 (0.0%) |
| Total | 8 (100.0%) | 1 (100.0%) |
Physical Housing Characteristics in Cotter
Housing Structures in Cotter
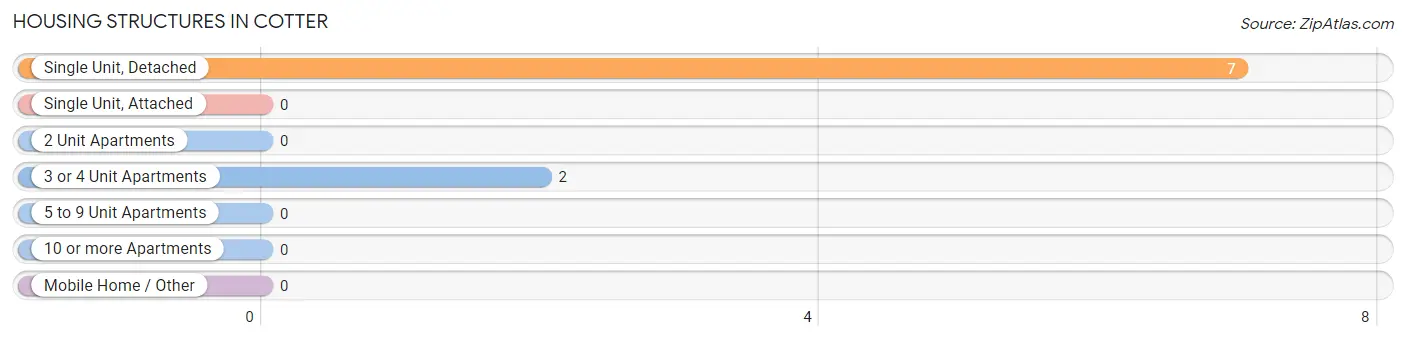
| Structure Type | # Housing Units | % Housing Units |
| Single Unit, Detached | 7 | 77.8% |
| Single Unit, Attached | 0 | 0.0% |
| 2 Unit Apartments | 0 | 0.0% |
| 3 or 4 Unit Apartments | 2 | 22.2% |
| 5 to 9 Unit Apartments | 0 | 0.0% |
| 10 or more Apartments | 0 | 0.0% |
| Mobile Home / Other | 0 | 0.0% |
| Total | 9 | 100.0% |
Housing Structures by Occupancy in Cotter
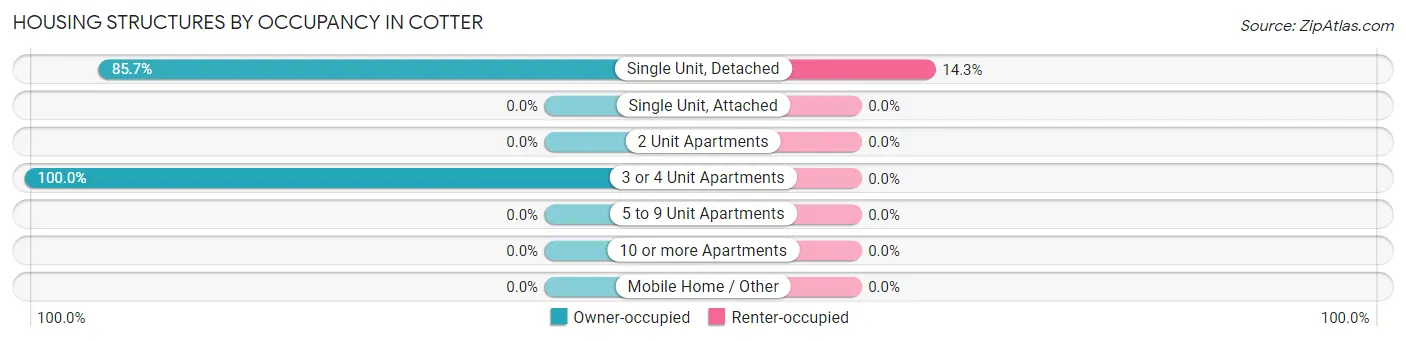
| Structure Type | Owner-occupied | Renter-occupied |
| Single Unit, Detached | 6 (85.7%) | 1 (14.3%) |
| Single Unit, Attached | 0 (0.0%) | 0 (0.0%) |
| 2 Unit Apartments | 0 (0.0%) | 0 (0.0%) |
| 3 or 4 Unit Apartments | 2 (100.0%) | 0 (0.0%) |
| 5 to 9 Unit Apartments | 0 (0.0%) | 0 (0.0%) |
| 10 or more Apartments | 0 (0.0%) | 0 (0.0%) |
| Mobile Home / Other | 0 (0.0%) | 0 (0.0%) |
| Total | 8 (88.9%) | 1 (11.1%) |
Housing Structures by Number of Rooms in Cotter
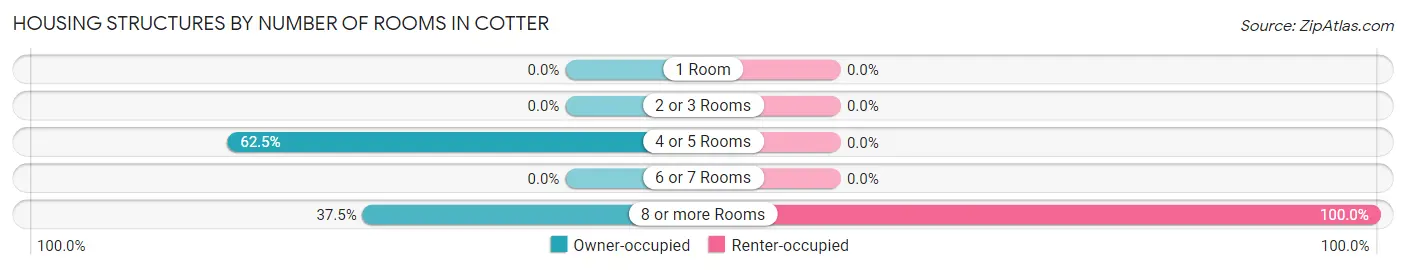
| Number of Rooms | Owner-occupied | Renter-occupied |
| 1 Room | 0 (0.0%) | 0 (0.0%) |
| 2 or 3 Rooms | 0 (0.0%) | 0 (0.0%) |
| 4 or 5 Rooms | 5 (62.5%) | 0 (0.0%) |
| 6 or 7 Rooms | 0 (0.0%) | 0 (0.0%) |
| 8 or more Rooms | 3 (37.5%) | 1 (100.0%) |
| Total | 8 (100.0%) | 1 (100.0%) |
Housing Structure by Heating Type in Cotter
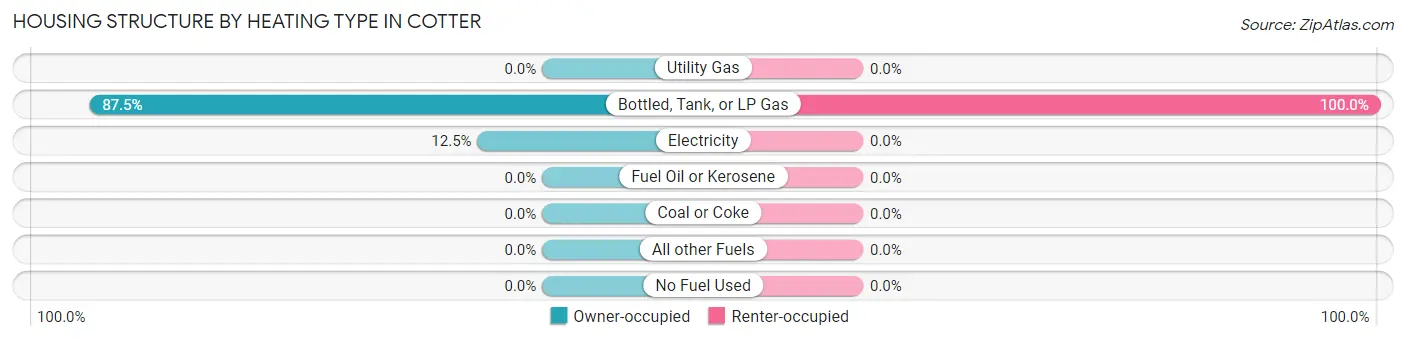
| Heating Type | Owner-occupied | Renter-occupied |
| Utility Gas | 0 (0.0%) | 0 (0.0%) |
| Bottled, Tank, or LP Gas | 7 (87.5%) | 1 (100.0%) |
| Electricity | 1 (12.5%) | 0 (0.0%) |
| Fuel Oil or Kerosene | 0 (0.0%) | 0 (0.0%) |
| Coal or Coke | 0 (0.0%) | 0 (0.0%) |
| All other Fuels | 0 (0.0%) | 0 (0.0%) |
| No Fuel Used | 0 (0.0%) | 0 (0.0%) |
| Total | 8 (100.0%) | 1 (100.0%) |
Household Vehicle Usage in Cotter
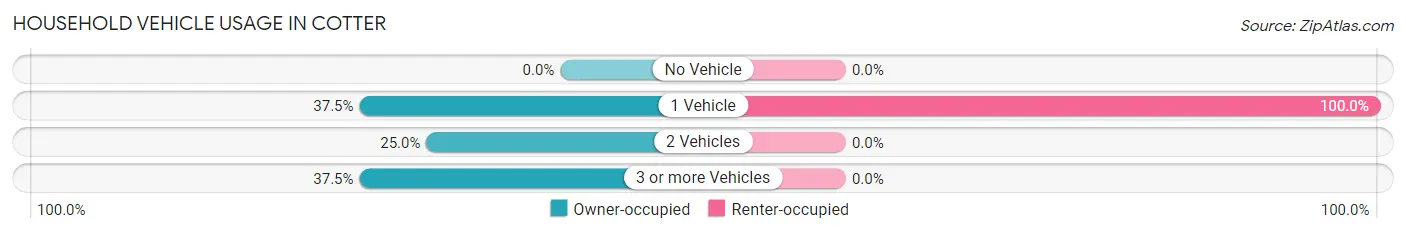
| Vehicles per Household | Owner-occupied | Renter-occupied |
| No Vehicle | 0 (0.0%) | 0 (0.0%) |
| 1 Vehicle | 3 (37.5%) | 1 (100.0%) |
| 2 Vehicles | 2 (25.0%) | 0 (0.0%) |
| 3 or more Vehicles | 3 (37.5%) | 0 (0.0%) |
| Total | 8 (100.0%) | 1 (100.0%) |
Real Estate & Mortgages in Cotter
Real Estate and Mortgage Overview in Cotter
| Characteristic | Without Mortgage | With Mortgage |
| Housing Units | 8 | 0 |
| Median Property Value | $108,300 | $0 |
| Median Household Income | - | - |
| Monthly Housing Costs | - | - |
| Real Estate Taxes | $1,750 | $0 |
Property Value by Mortgage Status in Cotter
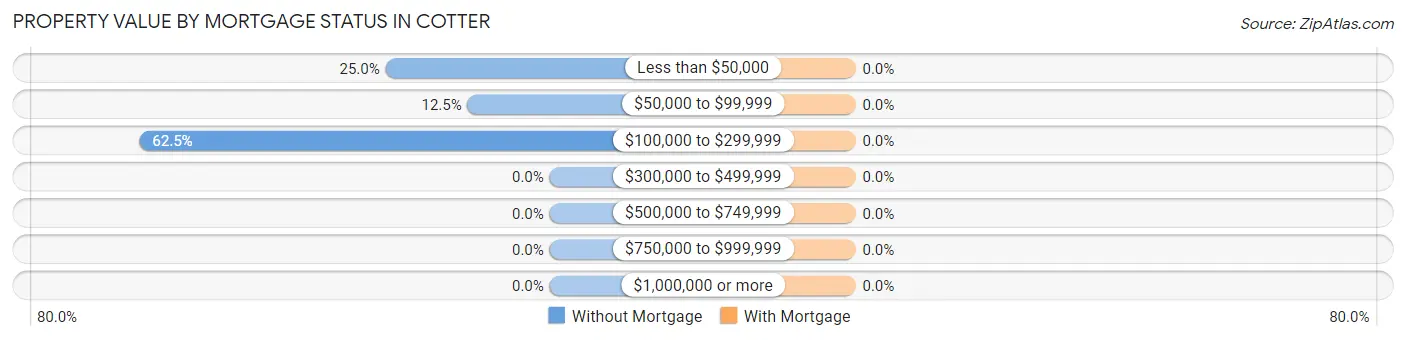
| Property Value | Without Mortgage | With Mortgage |
| Less than $50,000 | 2 (25.0%) | 0 (0.0%) |
| $50,000 to $99,999 | 1 (12.5%) | 0 (0.0%) |
| $100,000 to $299,999 | 5 (62.5%) | 0 (0.0%) |
| $300,000 to $499,999 | 0 (0.0%) | 0 (0.0%) |
| $500,000 to $749,999 | 0 (0.0%) | 0 (0.0%) |
| $750,000 to $999,999 | 0 (0.0%) | 0 (0.0%) |
| $1,000,000 or more | 0 (0.0%) | 0 (0.0%) |
| Total | 8 (100.0%) | 0 (0.0%) |
Household Income by Mortgage Status in Cotter
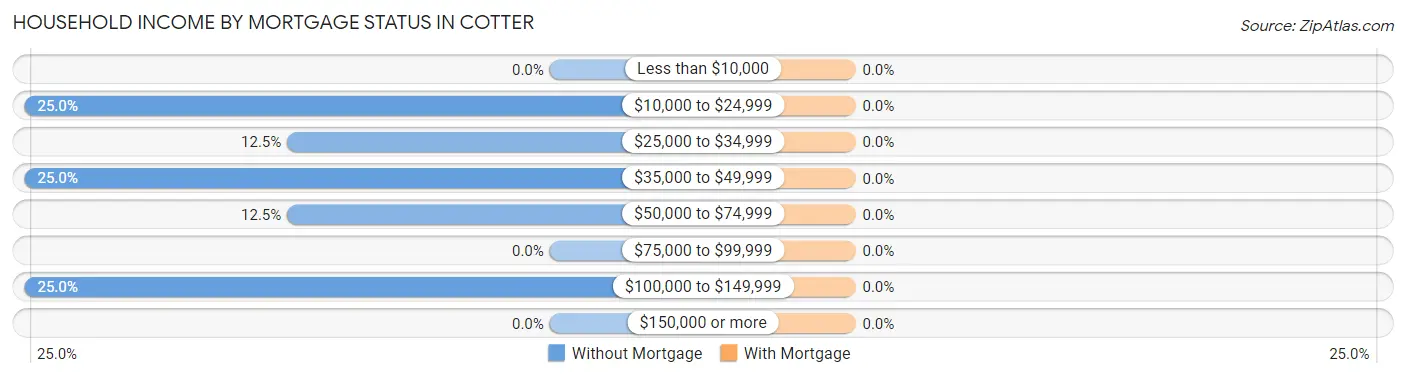
| Household Income | Without Mortgage | With Mortgage |
| Less than $10,000 | 0 (0.0%) | 0 (0.0%) |
| $10,000 to $24,999 | 2 (25.0%) | 0 (0.0%) |
| $25,000 to $34,999 | 1 (12.5%) | 0 (0.0%) |
| $35,000 to $49,999 | 2 (25.0%) | 0 (0.0%) |
| $50,000 to $74,999 | 1 (12.5%) | 0 (0.0%) |
| $75,000 to $99,999 | 0 (0.0%) | 0 (0.0%) |
| $100,000 to $149,999 | 2 (25.0%) | 0 (0.0%) |
| $150,000 or more | 0 (0.0%) | 0 (0.0%) |
| Total | 8 (100.0%) | 0 (0.0%) |
Property Value to Household Income Ratio in Cotter
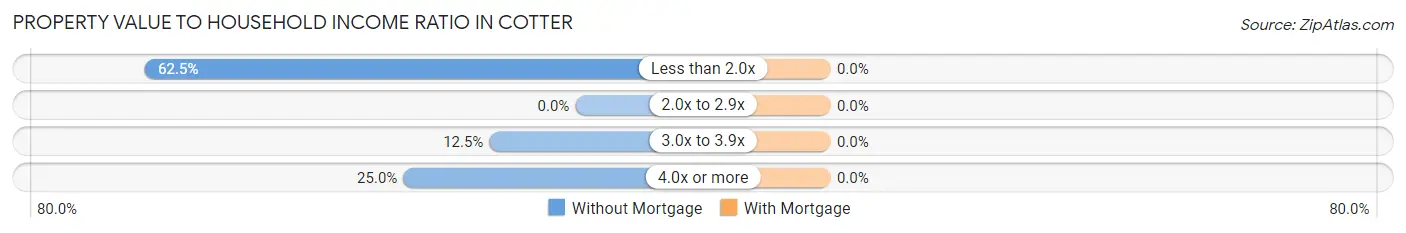
| Value-to-Income Ratio | Without Mortgage | With Mortgage |
| Less than 2.0x | 5 (62.5%) | 0 (0.0%) |
| 2.0x to 2.9x | 0 (0.0%) | 0 (0.0%) |
| 3.0x to 3.9x | 1 (12.5%) | 0 (0.0%) |
| 4.0x or more | 2 (25.0%) | 0 (0.0%) |
| Total | 8 (100.0%) | 0 (0.0%) |
Real Estate Taxes by Mortgage Status in Cotter
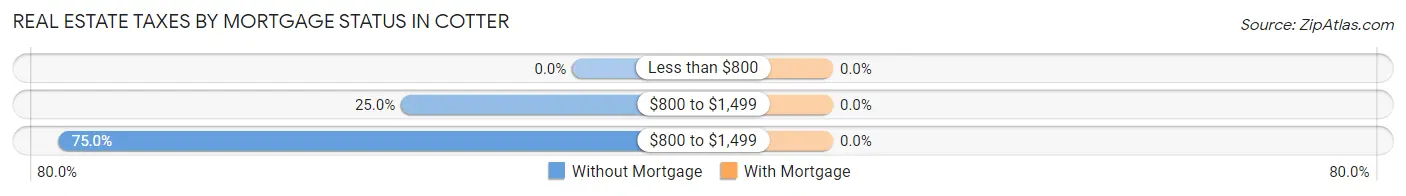
| Property Taxes | Without Mortgage | With Mortgage |
| Less than $800 | 0 (0.0%) | 0 (0.0%) |
| $800 to $1,499 | 2 (25.0%) | 0 (0.0%) |
| $800 to $1,499 | 6 (75.0%) | 0 (0.0%) |
| Total | 8 (100.0%) | 0 (0.0%) |
Health & Disability in Cotter
Health Insurance Coverage by Age in Cotter
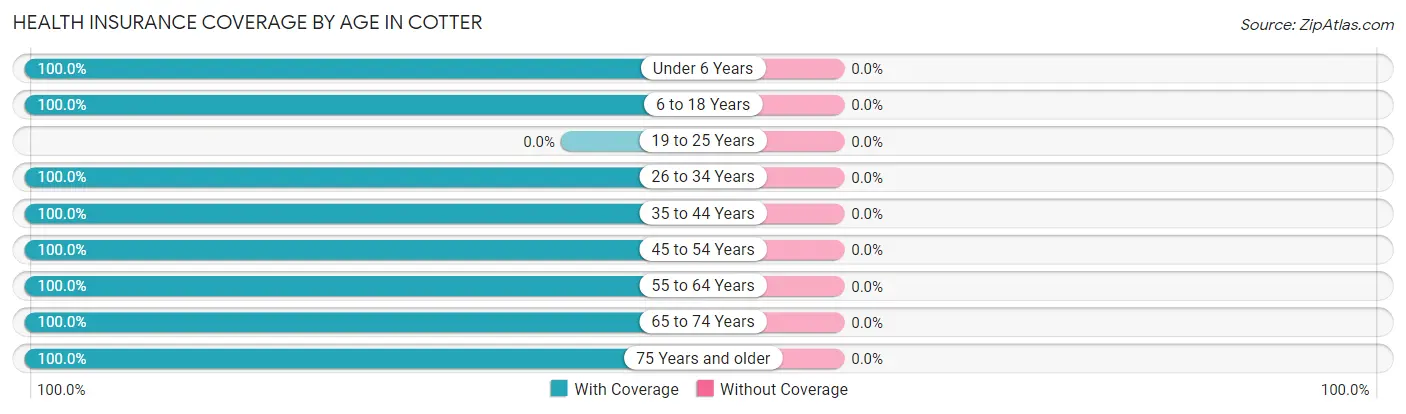
| Age Bracket | With Coverage | Without Coverage |
| Under 6 Years | 1 (100.0%) | 0 (0.0%) |
| 6 to 18 Years | 5 (100.0%) | 0 (0.0%) |
| 19 to 25 Years | 0 (0.0%) | 0 (0.0%) |
| 26 to 34 Years | 2 (100.0%) | 0 (0.0%) |
| 35 to 44 Years | 1 (100.0%) | 0 (0.0%) |
| 45 to 54 Years | 2 (100.0%) | 0 (0.0%) |
| 55 to 64 Years | 3 (100.0%) | 0 (0.0%) |
| 65 to 74 Years | 6 (100.0%) | 0 (0.0%) |
| 75 Years and older | 1 (100.0%) | 0 (0.0%) |
| Total | 21 (100.0%) | 0 (0.0%) |
Health Insurance Coverage by Citizenship Status in Cotter
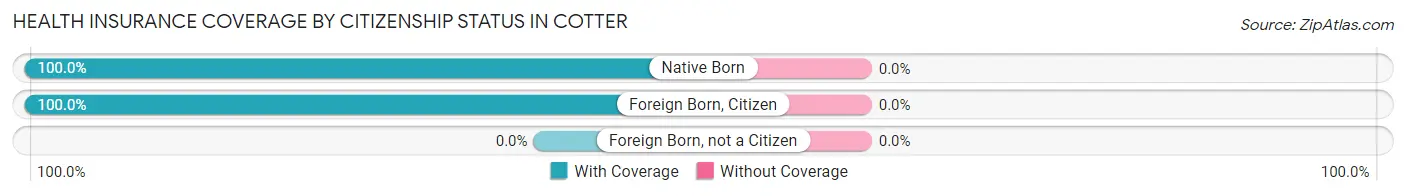
| Citizenship Status | With Coverage | Without Coverage |
| Native Born | 1 (100.0%) | 0 (0.0%) |
| Foreign Born, Citizen | 5 (100.0%) | 0 (0.0%) |
| Foreign Born, not a Citizen | 0 (0.0%) | 0 (0.0%) |
Health Insurance Coverage by Household Income in Cotter
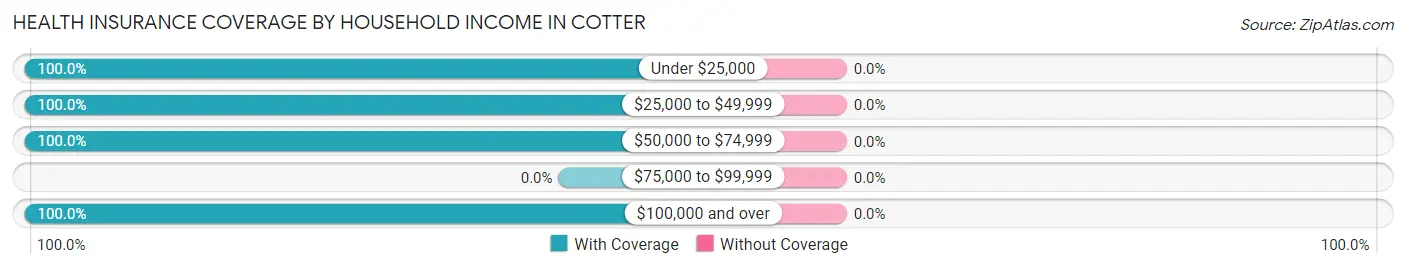
| Household Income | With Coverage | Without Coverage |
| Under $25,000 | 7 (100.0%) | 0 (0.0%) |
| $25,000 to $49,999 | 5 (100.0%) | 0 (0.0%) |
| $50,000 to $74,999 | 2 (100.0%) | 0 (0.0%) |
| $75,000 to $99,999 | 0 (0.0%) | 0 (0.0%) |
| $100,000 and over | 7 (100.0%) | 0 (0.0%) |
Public vs Private Health Insurance Coverage by Age in Cotter
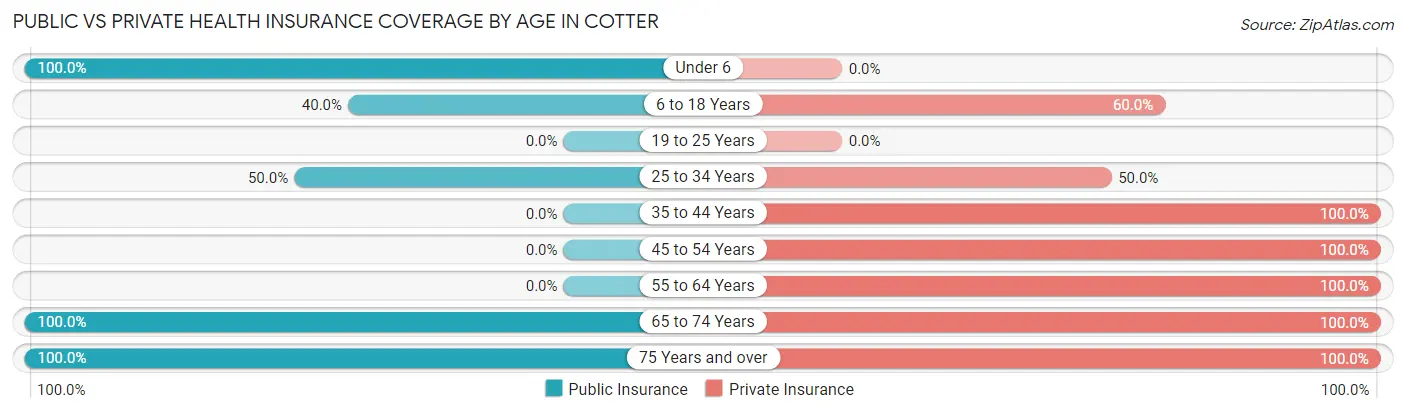
| Age Bracket | Public Insurance | Private Insurance |
| Under 6 | 1 (100.0%) | 0 (0.0%) |
| 6 to 18 Years | 2 (40.0%) | 3 (60.0%) |
| 19 to 25 Years | 0 (0.0%) | 0 (0.0%) |
| 25 to 34 Years | 1 (50.0%) | 1 (50.0%) |
| 35 to 44 Years | 0 (0.0%) | 1 (100.0%) |
| 45 to 54 Years | 0 (0.0%) | 2 (100.0%) |
| 55 to 64 Years | 0 (0.0%) | 3 (100.0%) |
| 65 to 74 Years | 6 (100.0%) | 6 (100.0%) |
| 75 Years and over | 1 (100.0%) | 1 (100.0%) |
| Total | 11 (52.4%) | 17 (80.9%) |
Disability Status by Sex by Age in Cotter
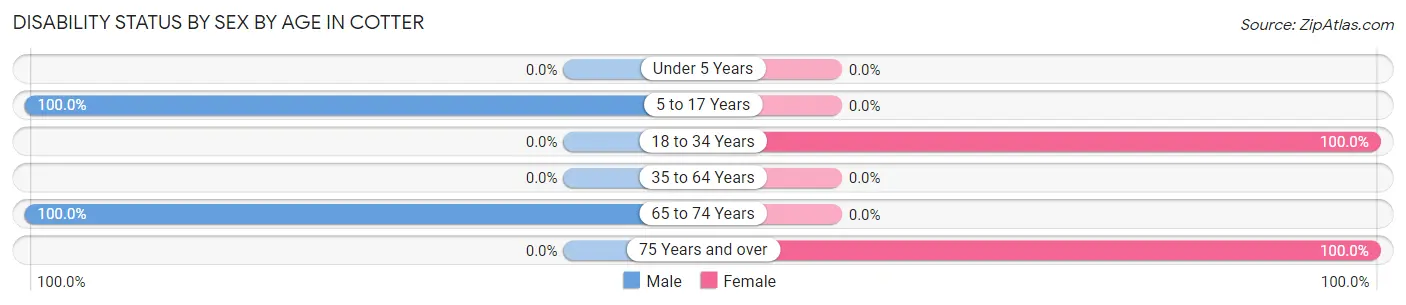
| Age Bracket | Male | Female |
| Under 5 Years | 0 (0.0%) | 0 (0.0%) |
| 5 to 17 Years | 1 (100.0%) | 0 (0.0%) |
| 18 to 34 Years | 0 (0.0%) | 1 (100.0%) |
| 35 to 64 Years | 0 (0.0%) | 0 (0.0%) |
| 65 to 74 Years | 2 (100.0%) | 0 (0.0%) |
| 75 Years and over | 0 (0.0%) | 1 (100.0%) |
Disability Class by Sex by Age in Cotter
Disability Class: Hearing Difficulty
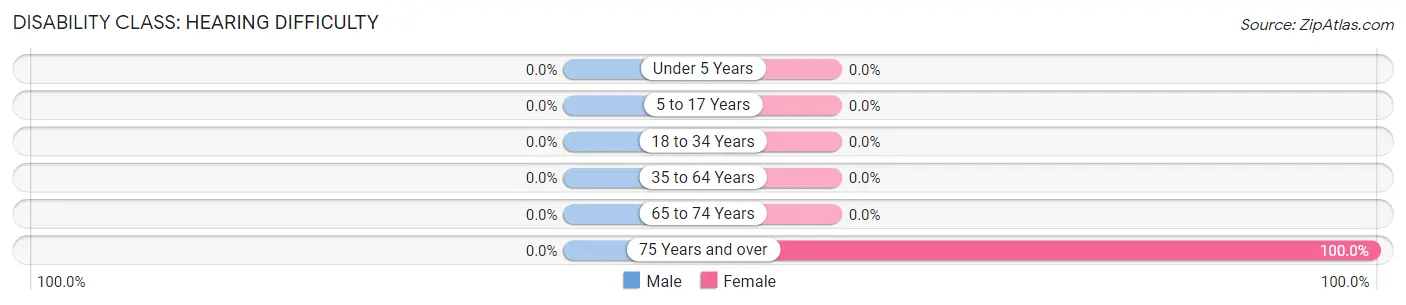
| Age Bracket | Male | Female |
| Under 5 Years | 0 (0.0%) | 0 (0.0%) |
| 5 to 17 Years | 0 (0.0%) | 0 (0.0%) |
| 18 to 34 Years | 0 (0.0%) | 0 (0.0%) |
| 35 to 64 Years | 0 (0.0%) | 0 (0.0%) |
| 65 to 74 Years | 0 (0.0%) | 0 (0.0%) |
| 75 Years and over | 0 (0.0%) | 1 (100.0%) |
Disability Class: Vision Difficulty
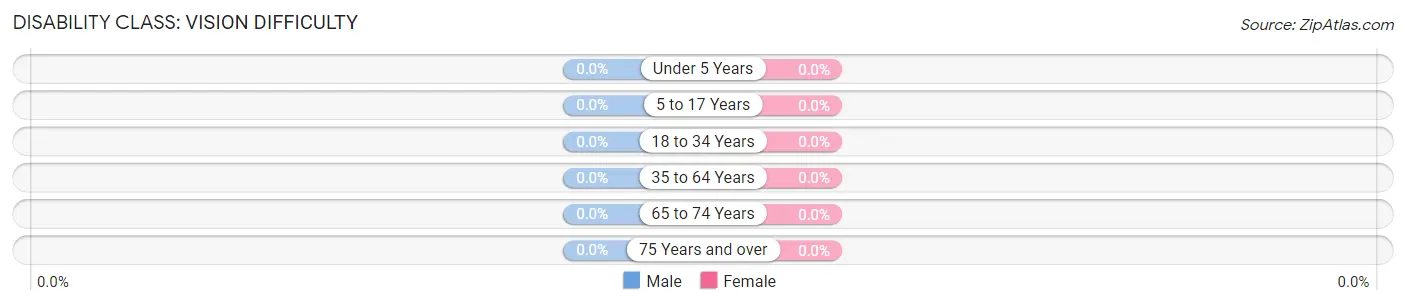
| Age Bracket | Male | Female |
| Under 5 Years | 0 (0.0%) | 0 (0.0%) |
| 5 to 17 Years | 0 (0.0%) | 0 (0.0%) |
| 18 to 34 Years | 0 (0.0%) | 0 (0.0%) |
| 35 to 64 Years | 0 (0.0%) | 0 (0.0%) |
| 65 to 74 Years | 0 (0.0%) | 0 (0.0%) |
| 75 Years and over | 0 (0.0%) | 0 (0.0%) |
Disability Class: Cognitive Difficulty
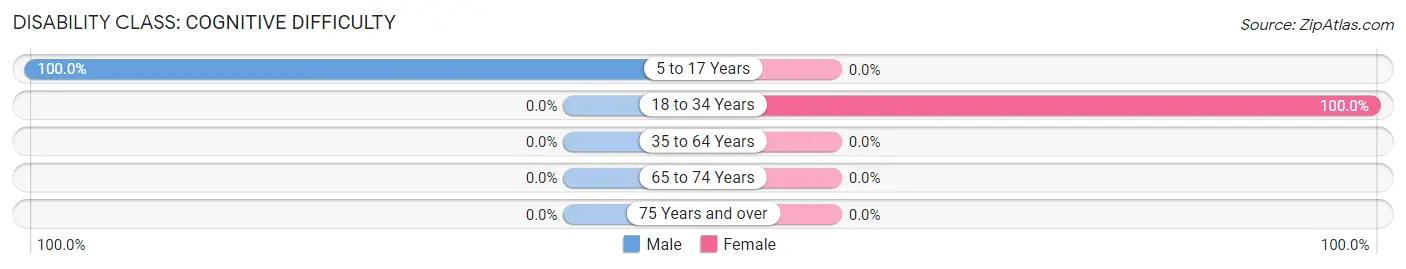
| Age Bracket | Male | Female |
| 5 to 17 Years | 1 (100.0%) | 0 (0.0%) |
| 18 to 34 Years | 0 (0.0%) | 1 (100.0%) |
| 35 to 64 Years | 0 (0.0%) | 0 (0.0%) |
| 65 to 74 Years | 0 (0.0%) | 0 (0.0%) |
| 75 Years and over | 0 (0.0%) | 0 (0.0%) |
Disability Class: Ambulatory Difficulty
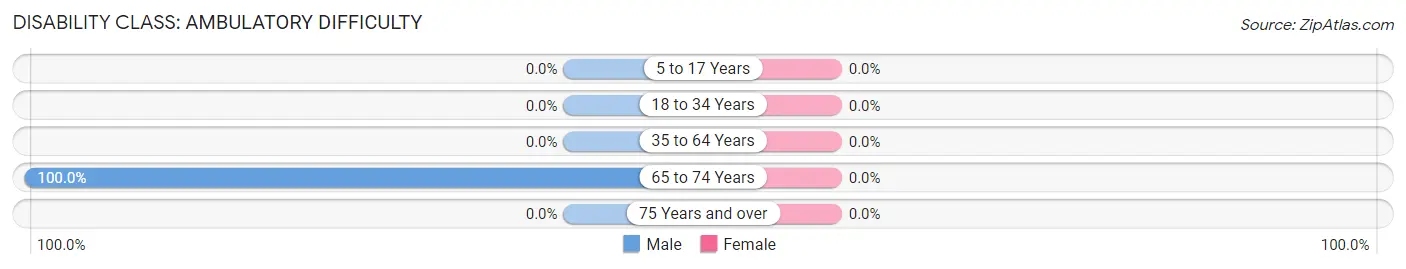
| Age Bracket | Male | Female |
| 5 to 17 Years | 0 (0.0%) | 0 (0.0%) |
| 18 to 34 Years | 0 (0.0%) | 0 (0.0%) |
| 35 to 64 Years | 0 (0.0%) | 0 (0.0%) |
| 65 to 74 Years | 2 (100.0%) | 0 (0.0%) |
| 75 Years and over | 0 (0.0%) | 0 (0.0%) |
Disability Class: Self-Care Difficulty
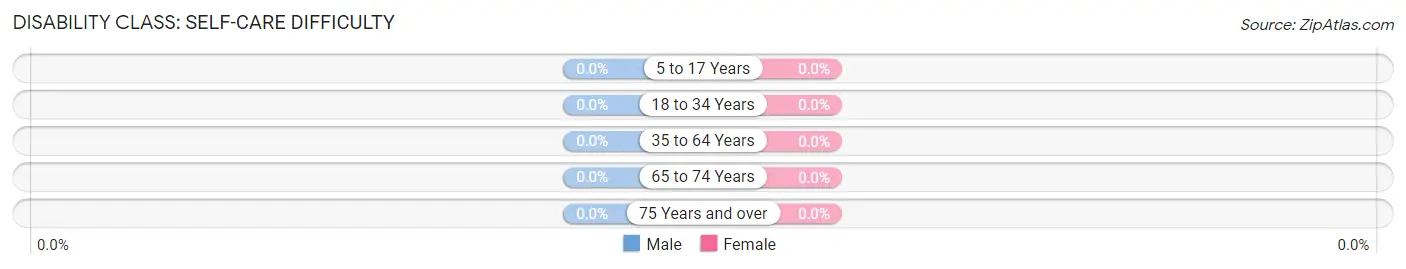
| Age Bracket | Male | Female |
| 5 to 17 Years | 0 (0.0%) | 0 (0.0%) |
| 18 to 34 Years | 0 (0.0%) | 0 (0.0%) |
| 35 to 64 Years | 0 (0.0%) | 0 (0.0%) |
| 65 to 74 Years | 0 (0.0%) | 0 (0.0%) |
| 75 Years and over | 0 (0.0%) | 0 (0.0%) |
Technology Access in Cotter
Computing Device Access in Cotter
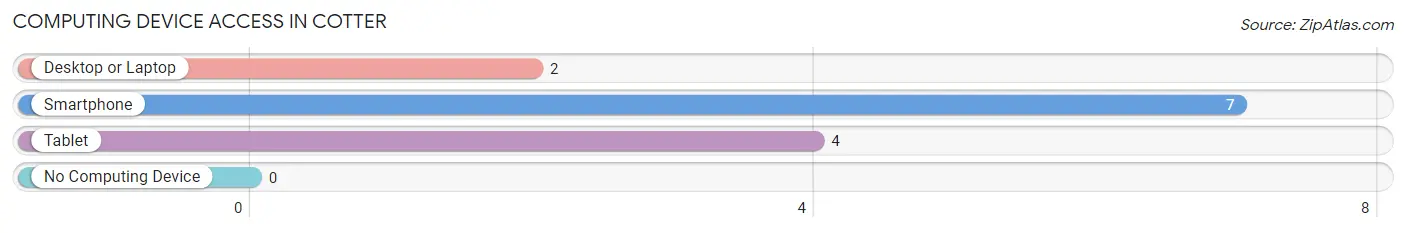
| Device Type | # Households | % Households |
| Desktop or Laptop | 2 | 22.2% |
| Smartphone | 7 | 77.8% |
| Tablet | 4 | 44.4% |
| No Computing Device | 0 | 0.0% |
| Total | 9 | 100.0% |
Internet Access in Cotter
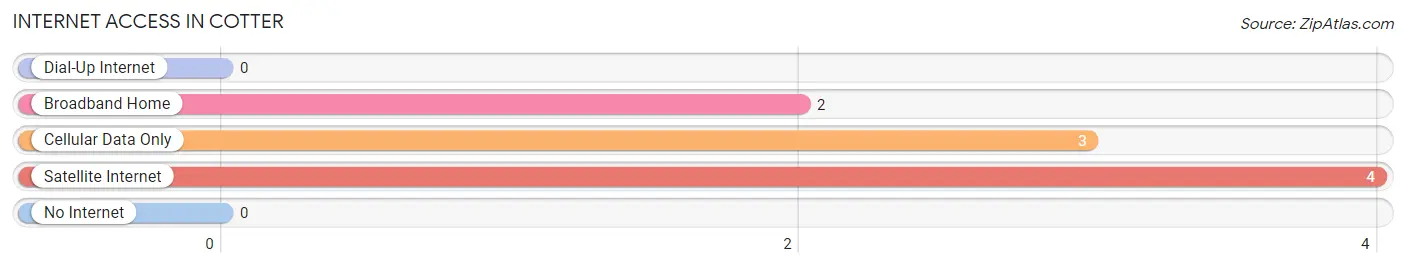
| Internet Type | # Households | % Households |
| Dial-Up Internet | 0 | 0.0% |
| Broadband Home | 2 | 22.2% |
| Cellular Data Only | 3 | 33.3% |
| Satellite Internet | 4 | 44.4% |
| No Internet | 0 | 0.0% |
| Total | 9 | 100.0% |
Cotter Summary
Cotter is a small town located in the state of Iowa, in the United States. It is situated in the county of Winneshiek, and is part of the Decorah Micropolitan Statistical Area. The town has a population of around 500 people, and is located on the banks of the Upper Iowa River.
History
Cotter was founded in 1856 by a group of settlers from Norway. The town was named after the Norwegian word for “cottage”, and was originally intended to be a farming community. The first settlers built a sawmill and a gristmill, and the town quickly grew. By the late 19th century, Cotter had become a thriving community, with a variety of businesses, including a hotel, a bank, a general store, and a post office.
In the early 20th century, Cotter experienced a period of decline, as many of its businesses closed down. However, the town was revitalized in the 1950s, when a new dam was built on the Upper Iowa River. This provided the town with a reliable source of water, and allowed for the development of a new hydroelectric power plant. The power plant provided electricity to the town, and helped to attract new businesses and residents.
Geography
Cotter is located in the northeast corner of Iowa, in the county of Winneshiek. The town is situated on the banks of the Upper Iowa River, and is surrounded by rolling hills and farmland. The town is located approximately 25 miles from the city of Decorah, and is about an hour’s drive from the state capital of Des Moines.
The climate in Cotter is typical of the Midwest, with hot summers and cold winters. The average temperature in the summer is around 75 degrees Fahrenheit, while the average temperature in the winter is around 25 degrees Fahrenheit. The town receives an average of around 30 inches of precipitation each year.
Economy
The economy of Cotter is largely based on agriculture and tourism. The town is home to several farms, which produce a variety of crops, including corn, soybeans, and hay. The town is also home to several small businesses, including a grocery store, a hardware store, and a restaurant.
Tourism is an important part of the economy of Cotter. The town is home to several attractions, including the Upper Iowa River, which is popular for fishing and canoeing. The town is also home to several historic sites, including the Old Stone Church, which was built in 1856.
Demographics
As of the 2010 census, the population of Cotter was 498 people. The racial makeup of the town was 97.2% White, 0.2% African American, 0.2% Native American, 0.4% Asian, 0.2% from other races, and 1.9% from two or more races. The median household income in Cotter was $41,250, and the median family income was $50,000. The per capita income in Cotter was $20,845.
Common Questions
What is Per Capita Income in Cotter?
Per Capita income in Cotter is $22,462.
What is Inequality or Gini Index in Cotter?
Inequality or Gini Index in Cotter is 0.37.
What is the Total Population of Cotter?
Total Population of Cotter is 21.
What is the Total Male Population of Cotter?
Total Male Population of Cotter is 7.
What is the Total Female Population of Cotter?
Total Female Population of Cotter is 14.
What is the Ratio of Males per 100 Females in Cotter?
There are 50.00 Males per 100 Females in Cotter.
What is the Ratio of Females per 100 Males in Cotter?
There are 200.00 Females per 100 Males in Cotter.
What is the Median Population Age in Cotter?
Median Population Age in Cotter is 54.5 Years.
What is the Average Family Size in Cotter
Average Family Size in Cotter is 2.8 People.
What is the Average Household Size in Cotter
Average Household Size in Cotter is 2.3 People.
How Large is the Labor Force in Cotter?
There are 8 People in the Labor Forcein in Cotter.
What is the Percentage of People in the Labor Force in Cotter?
47.1% of People are in the Labor Force in Cotter.