Toronto, IA Map & Demographics
Toronto Map
Toronto Overview
$26,579
PER CAPITA INCOME
$41,250
AVG HOUSEHOLD INCOME
50.8%
WAGE / INCOME GAP [ % ]
49.2¢/ $1
WAGE / INCOME GAP [ $ ]
0.34
INEQUALITY / GINI INDEX
76
TOTAL POPULATION
39
MALE POPULATION
37
FEMALE POPULATION
105.41
MALES / 100 FEMALES
94.87
FEMALES / 100 MALES
62.5
MEDIAN AGE
2.3
AVG FAMILY SIZE
1.9
AVG HOUSEHOLD SIZE
33
LABOR FORCE [ PEOPLE ]
43.4%
PERCENT IN LABOR FORCE
18.2%
UNEMPLOYMENT RATE
Toronto Area Codes
Income in Toronto
Income Overview in Toronto
| Characteristic | Number | Measure |
| Per Capita Income | 76 | $26,579 |
| Median Family Income | 19 | $0 |
| Mean Family Income | 19 | $57,947 |
| Median Household Income | 39 | $41,250 |
| Mean Household Income | 39 | $51,674 |
| Income Deficit | 19 | $0 |
| Wage / Income Gap (%) | 76 | 50.78% |
| Wage / Income Gap ($) | 76 | 49.22¢ per $1 |
| Gini / Inequality Index | 76 | 0.34 |
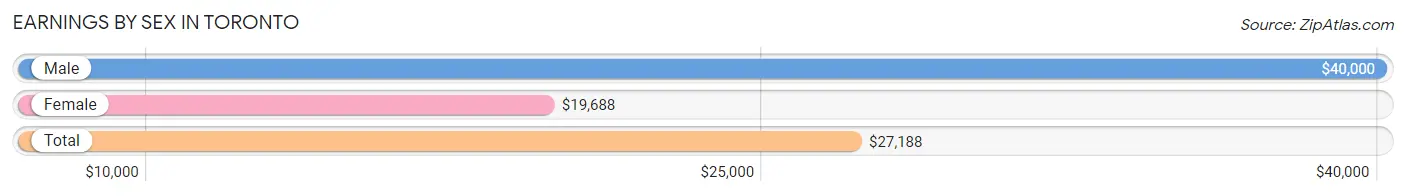
Earnings by Sex in Toronto
Average Earnings in Toronto are $27,188, $40,000 for men and $19,688 for women, a difference of 50.8%.
| Sex | Number | Average Earnings |
| Male | 18 (48.6%) | $40,000 |
| Female | 19 (51.3%) | $19,688 |
| Total | 37 (100.0%) | $27,188 |
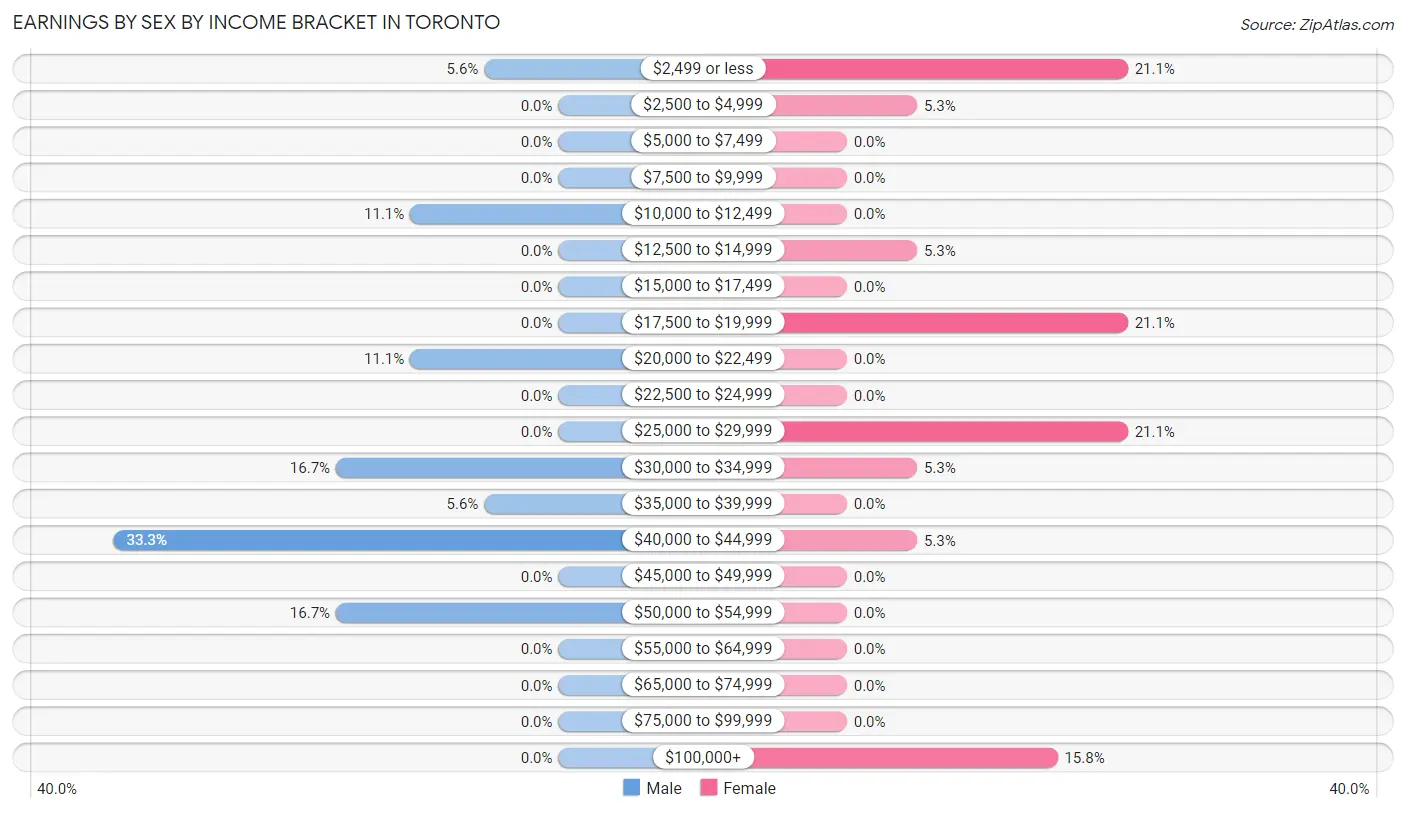
Earnings by Sex by Income Bracket in Toronto
The most common earnings brackets in Toronto are $40,000 to $44,999 for men (6 | 33.3%) and $2,499 or less for women (4 | 21.0%).
| Income | Male | Female |
| $2,499 or less | 1 (5.6%) | 4 (21.0%) |
| $2,500 to $4,999 | 0 (0.0%) | 1 (5.3%) |
| $5,000 to $7,499 | 0 (0.0%) | 0 (0.0%) |
| $7,500 to $9,999 | 0 (0.0%) | 0 (0.0%) |
| $10,000 to $12,499 | 2 (11.1%) | 0 (0.0%) |
| $12,500 to $14,999 | 0 (0.0%) | 1 (5.3%) |
| $15,000 to $17,499 | 0 (0.0%) | 0 (0.0%) |
| $17,500 to $19,999 | 0 (0.0%) | 4 (21.0%) |
| $20,000 to $22,499 | 2 (11.1%) | 0 (0.0%) |
| $22,500 to $24,999 | 0 (0.0%) | 0 (0.0%) |
| $25,000 to $29,999 | 0 (0.0%) | 4 (21.0%) |
| $30,000 to $34,999 | 3 (16.7%) | 1 (5.3%) |
| $35,000 to $39,999 | 1 (5.6%) | 0 (0.0%) |
| $40,000 to $44,999 | 6 (33.3%) | 1 (5.3%) |
| $45,000 to $49,999 | 0 (0.0%) | 0 (0.0%) |
| $50,000 to $54,999 | 3 (16.7%) | 0 (0.0%) |
| $55,000 to $64,999 | 0 (0.0%) | 0 (0.0%) |
| $65,000 to $74,999 | 0 (0.0%) | 0 (0.0%) |
| $75,000 to $99,999 | 0 (0.0%) | 0 (0.0%) |
| $100,000+ | 0 (0.0%) | 3 (15.8%) |
| Total | 18 (100.0%) | 19 (100.0%) |
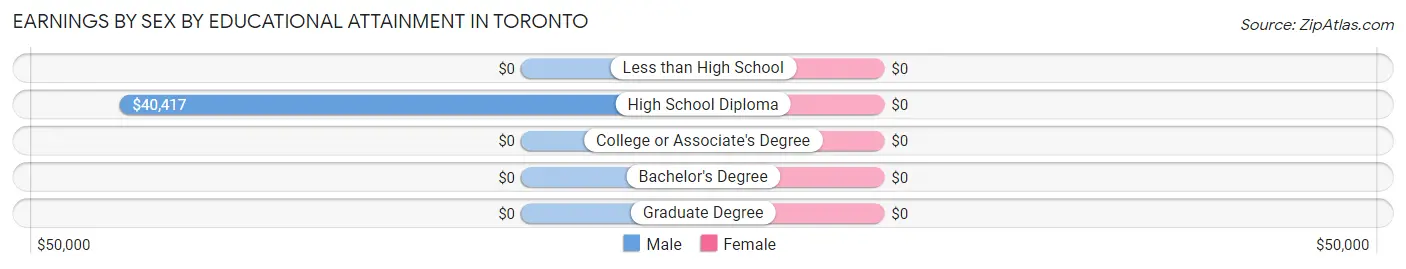
Earnings by Sex by Educational Attainment in Toronto
| Educational Attainment | Male Income | Female Income |
| Less than High School | - | - |
| High School Diploma | $40,417 | $0 |
| College or Associate's Degree | - | - |
| Bachelor's Degree | - | - |
| Graduate Degree | - | - |
| Total | $40,000 | $19,688 |
Family Income in Toronto
Family Income Brackets in Toronto
According to the Toronto family income data, there are 5 families falling into the $50,000 to $74,999 income range, which is the most common income bracket and makes up 26.3% of all families.
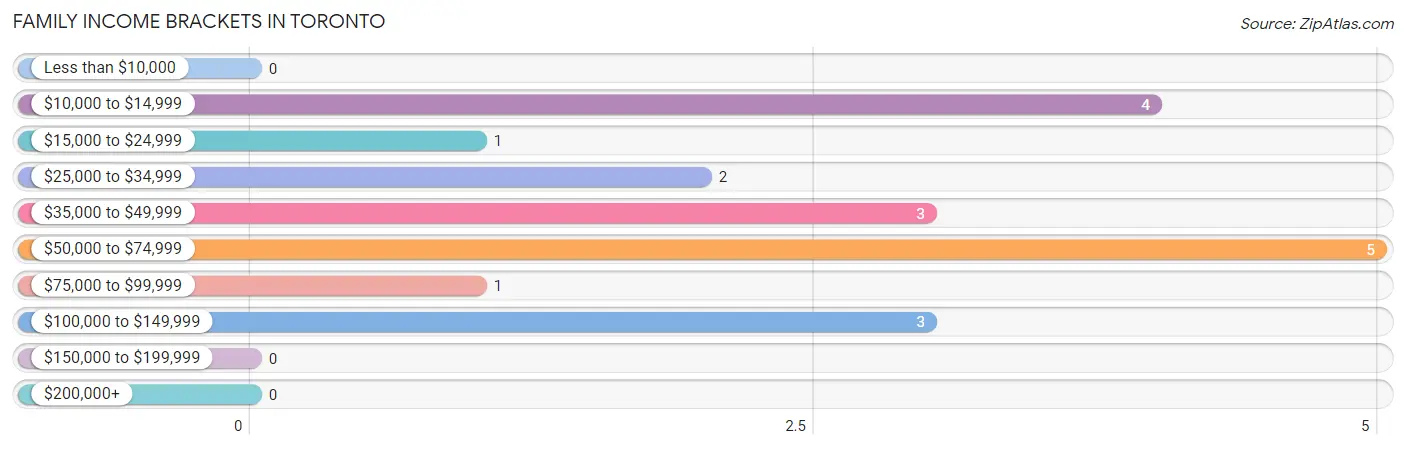
| Income Bracket | # Families | % Families |
| Less than $10,000 | 0 | 0.0% |
| $10,000 to $14,999 | 4 | 21.1% |
| $15,000 to $24,999 | 1 | 5.3% |
| $25,000 to $34,999 | 2 | 10.5% |
| $35,000 to $49,999 | 3 | 15.8% |
| $50,000 to $74,999 | 5 | 26.3% |
| $75,000 to $99,999 | 1 | 5.3% |
| $100,000 to $149,999 | 3 | 15.8% |
| $150,000 to $199,999 | 0 | 0.0% |
| $200,000+ | 0 | 0.0% |
Family Income by Famaliy Size in Toronto
2-person families (17 | 89.5%) account for the highest median family income in Toronto with $55,625 per family, while 2-person families (17 | 89.5%) have the highest median income of $27,812 per family member.
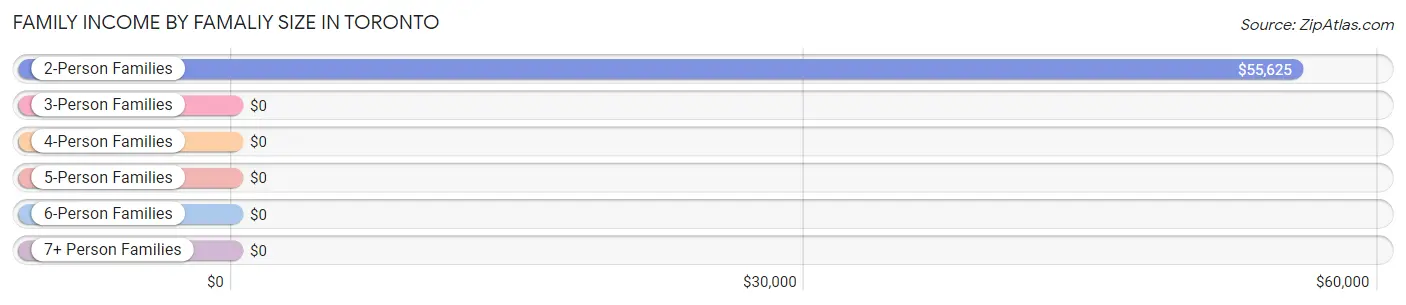
| Income Bracket | # Families | Median Income |
| 2-Person Families | 17 (89.5%) | $55,625 |
| 3-Person Families | 0 (0.0%) | $0 |
| 4-Person Families | 2 (10.5%) | $0 |
| 5-Person Families | 0 (0.0%) | $0 |
| 6-Person Families | 0 (0.0%) | $0 |
| 7+ Person Families | 0 (0.0%) | $0 |
| Total | 19 (100.0%) | $0 |
Family Income by Number of Earners in Toronto
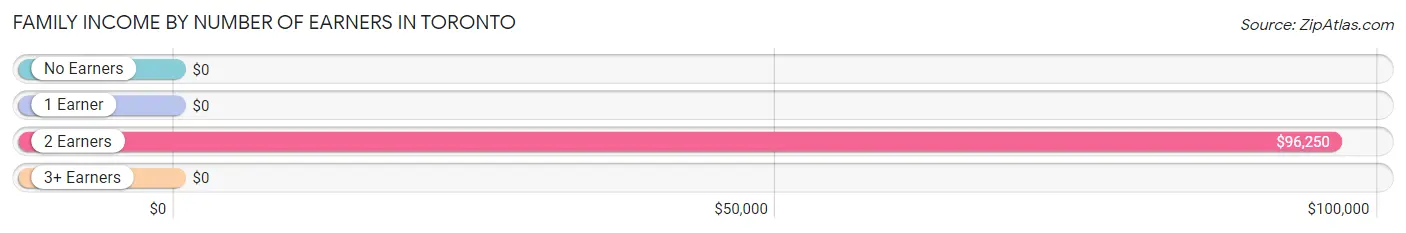
| Number of Earners | # Families | Median Income |
| No Earners | 10 (52.6%) | $0 |
| 1 Earner | 2 (10.5%) | $0 |
| 2 Earners | 7 (36.8%) | $96,250 |
| 3+ Earners | 0 (0.0%) | $0 |
| Total | 19 (100.0%) | $0 |
Household Income in Toronto
Household Income Brackets in Toronto
With 13 households falling in the category, the $35,000 to $49,999 income range is the most frequent in Toronto, accounting for 33.3% of all households.
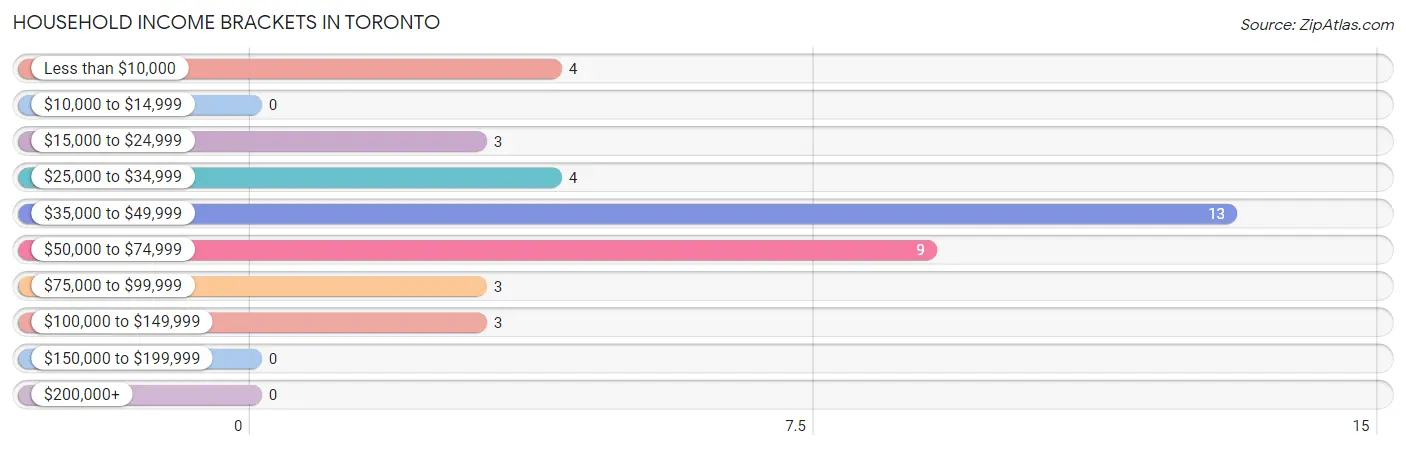
| Income Bracket | # Households | % Households |
| Less than $10,000 | 4 | 10.3% |
| $10,000 to $14,999 | 0 | 0.0% |
| $15,000 to $24,999 | 3 | 7.7% |
| $25,000 to $34,999 | 4 | 10.3% |
| $35,000 to $49,999 | 13 | 33.3% |
| $50,000 to $74,999 | 9 | 23.1% |
| $75,000 to $99,999 | 3 | 7.7% |
| $100,000 to $149,999 | 3 | 7.7% |
| $150,000 to $199,999 | 0 | 0.0% |
| $200,000+ | 0 | 0.0% |
Household Income by Householder Age in Toronto
The median household income in Toronto is $41,250, with the highest median household income of $55,625 found in the 65+ years age bracket for the primary householder. A total of 21 households (53.8%) fall into this category.
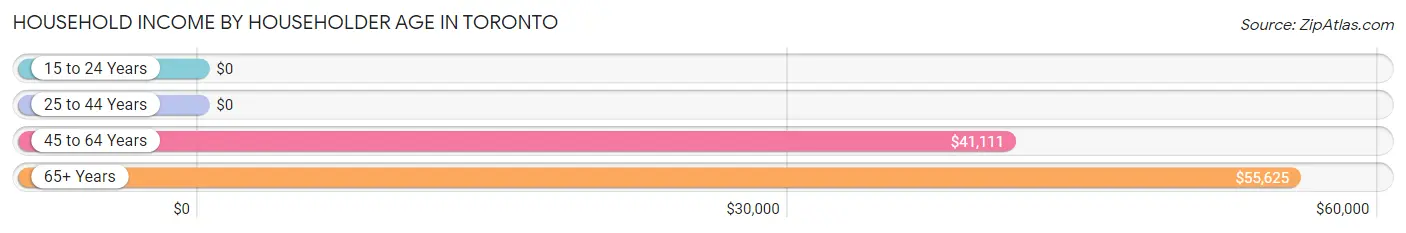
| Income Bracket | # Households | Median Income |
| 15 to 24 Years | 0 (0.0%) | $0 |
| 25 to 44 Years | 0 (0.0%) | $0 |
| 45 to 64 Years | 18 (46.2%) | $41,111 |
| 65+ Years | 21 (53.8%) | $55,625 |
| Total | 39 (100.0%) | $41,250 |
Poverty in Toronto
Income Below Poverty by Sex and Age in Toronto
With 30.8% poverty level for males and 18.9% for females among the residents of Toronto, 18 to 24 year old males and 25 to 34 year old females are the most vulnerable to poverty, with 6 males (100.0%) and 5 females (100.0%) in their respective age groups living below the poverty level.
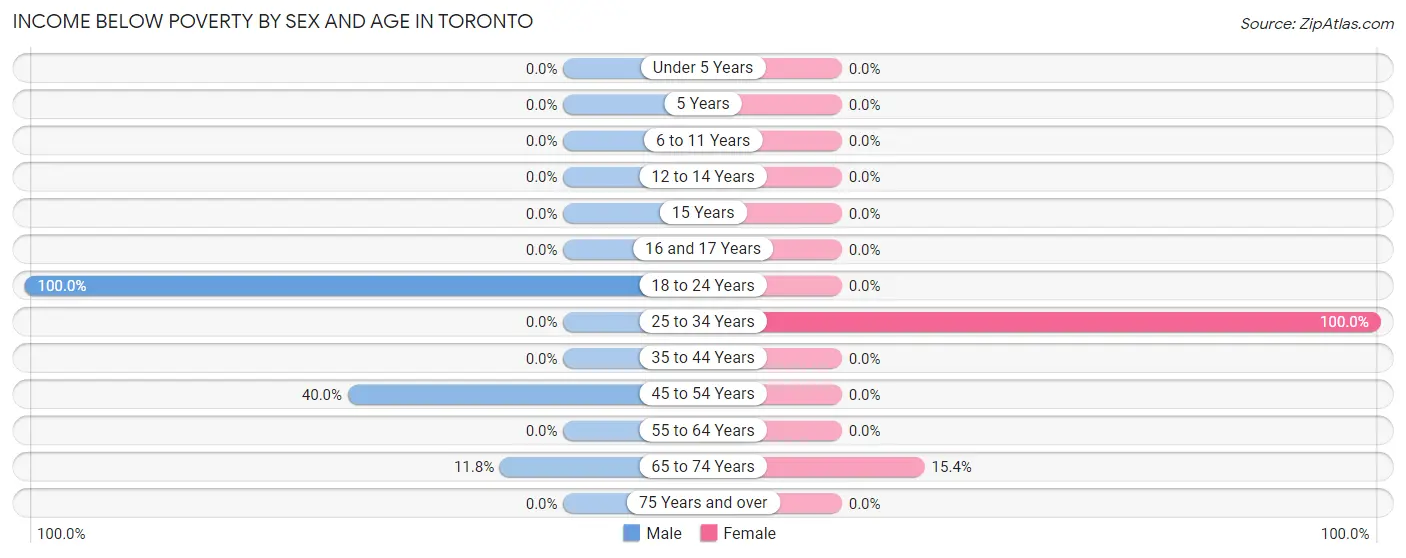
| Age Bracket | Male | Female |
| Under 5 Years | 0 (0.0%) | 0 (0.0%) |
| 5 Years | 0 (0.0%) | 0 (0.0%) |
| 6 to 11 Years | 0 (0.0%) | 0 (0.0%) |
| 12 to 14 Years | 0 (0.0%) | 0 (0.0%) |
| 15 Years | 0 (0.0%) | 0 (0.0%) |
| 16 and 17 Years | 0 (0.0%) | 0 (0.0%) |
| 18 to 24 Years | 6 (100.0%) | 0 (0.0%) |
| 25 to 34 Years | 0 (0.0%) | 5 (100.0%) |
| 35 to 44 Years | 0 (0.0%) | 0 (0.0%) |
| 45 to 54 Years | 4 (40.0%) | 0 (0.0%) |
| 55 to 64 Years | 0 (0.0%) | 0 (0.0%) |
| 65 to 74 Years | 2 (11.8%) | 2 (15.4%) |
| 75 Years and over | 0 (0.0%) | 0 (0.0%) |
| Total | 12 (30.8%) | 7 (18.9%) |
Income Above Poverty by Sex and Age in Toronto
According to the poverty statistics in Toronto, males aged 35 to 44 years and females aged 35 to 44 years are the age groups that are most secure financially, with 100.0% of males and 100.0% of females in these age groups living above the poverty line.
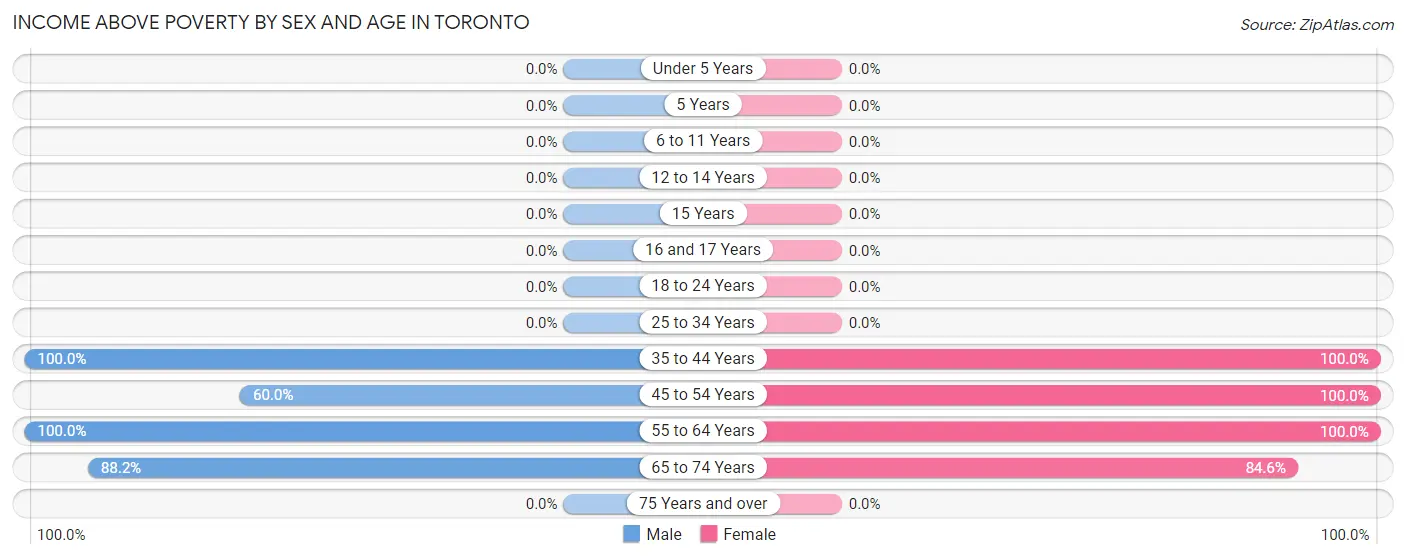
| Age Bracket | Male | Female |
| Under 5 Years | 0 (0.0%) | 0 (0.0%) |
| 5 Years | 0 (0.0%) | 0 (0.0%) |
| 6 to 11 Years | 0 (0.0%) | 0 (0.0%) |
| 12 to 14 Years | 0 (0.0%) | 0 (0.0%) |
| 15 Years | 0 (0.0%) | 0 (0.0%) |
| 16 and 17 Years | 0 (0.0%) | 0 (0.0%) |
| 18 to 24 Years | 0 (0.0%) | 0 (0.0%) |
| 25 to 34 Years | 0 (0.0%) | 0 (0.0%) |
| 35 to 44 Years | 2 (100.0%) | 2 (100.0%) |
| 45 to 54 Years | 6 (60.0%) | 8 (100.0%) |
| 55 to 64 Years | 4 (100.0%) | 9 (100.0%) |
| 65 to 74 Years | 15 (88.2%) | 11 (84.6%) |
| 75 Years and over | 0 (0.0%) | 0 (0.0%) |
| Total | 27 (69.2%) | 30 (81.1%) |
Income Below Poverty Among Married-Couple Families in Toronto
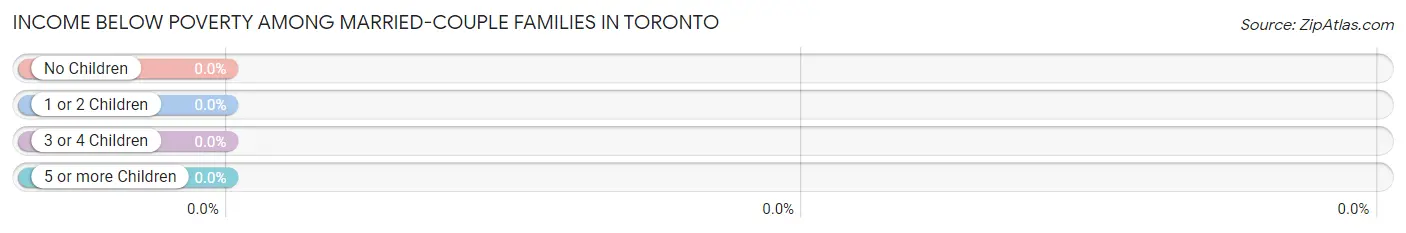
| Children | Above Poverty | Below Poverty |
| No Children | 15 (100.0%) | 0 (0.0%) |
| 1 or 2 Children | 0 (0.0%) | 0 (0.0%) |
| 3 or 4 Children | 0 (0.0%) | 0 (0.0%) |
| 5 or more Children | 0 (0.0%) | 0 (0.0%) |
| Total | 15 (100.0%) | 0 (0.0%) |
Income Below Poverty Among Single-Parent Households in Toronto
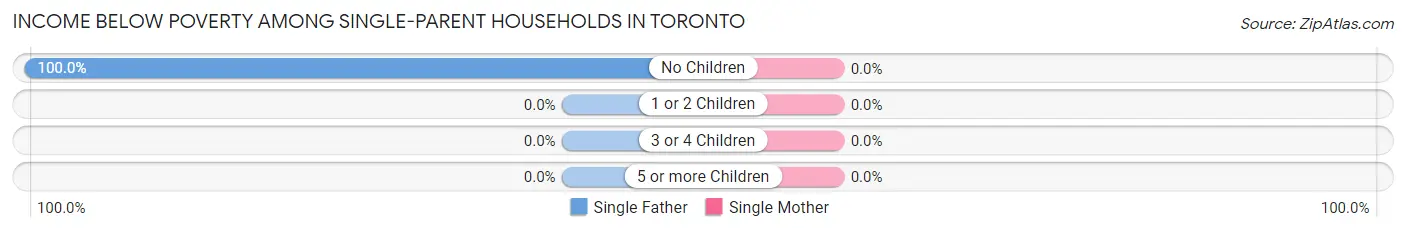
| Children | Single Father | Single Mother |
| No Children | 4 (100.0%) | 0 (0.0%) |
| 1 or 2 Children | 0 (0.0%) | 0 (0.0%) |
| 3 or 4 Children | 0 (0.0%) | 0 (0.0%) |
| 5 or more Children | 0 (0.0%) | 0 (0.0%) |
| Total | 4 (100.0%) | 0 (0.0%) |
Income Below Poverty Among Married-Couple vs Single-Parent Households in Toronto
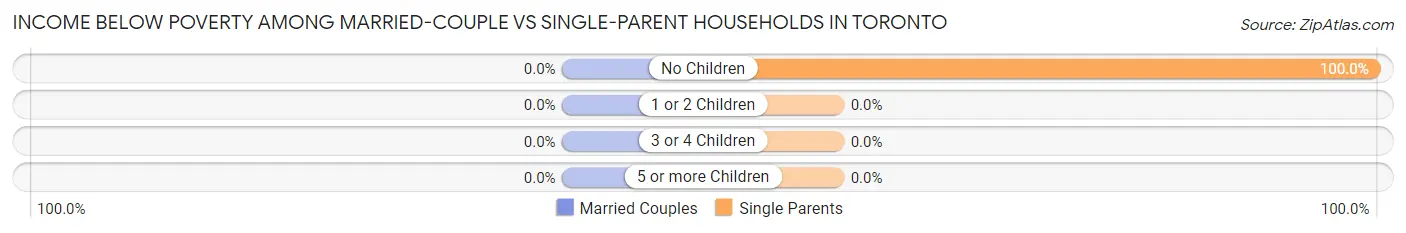
| Children | Married-Couple Families | Single-Parent Households |
| No Children | 0 (0.0%) | 4 (100.0%) |
| 1 or 2 Children | 0 (0.0%) | 0 (0.0%) |
| 3 or 4 Children | 0 (0.0%) | 0 (0.0%) |
| 5 or more Children | 0 (0.0%) | 0 (0.0%) |
| Total | 0 (0.0%) | 4 (100.0%) |
Race in Toronto
The most populous races in Toronto are White / Caucasian (74 | 97.4%), Hispanic or Latino (3 | 4.0%), and Two or more Races (2 | 2.6%).
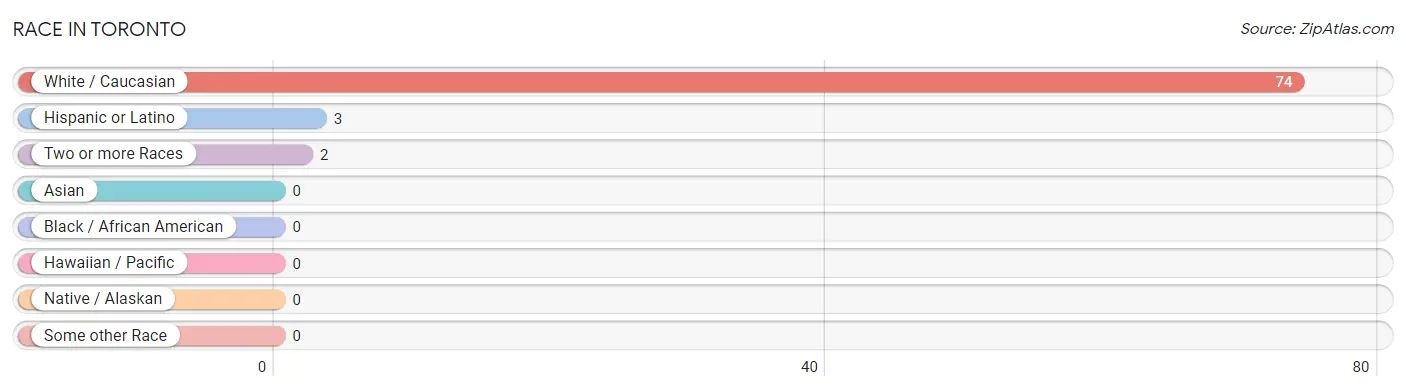
| Race | # Population | % Population |
| Asian | 0 | 0.0% |
| Black / African American | 0 | 0.0% |
| Hawaiian / Pacific | 0 | 0.0% |
| Hispanic or Latino | 3 | 4.0% |
| Native / Alaskan | 0 | 0.0% |
| White / Caucasian | 74 | 97.4% |
| Two or more Races | 2 | 2.6% |
| Some other Race | 0 | 0.0% |
| Total | 76 | 100.0% |
Ancestry in Toronto
The most populous ancestries reported in Toronto are German (20 | 26.3%), English (9 | 11.8%), Irish (8 | 10.5%), Cuban (2 | 2.6%), and American (1 | 1.3%), together accounting for 52.6% of all Toronto residents.
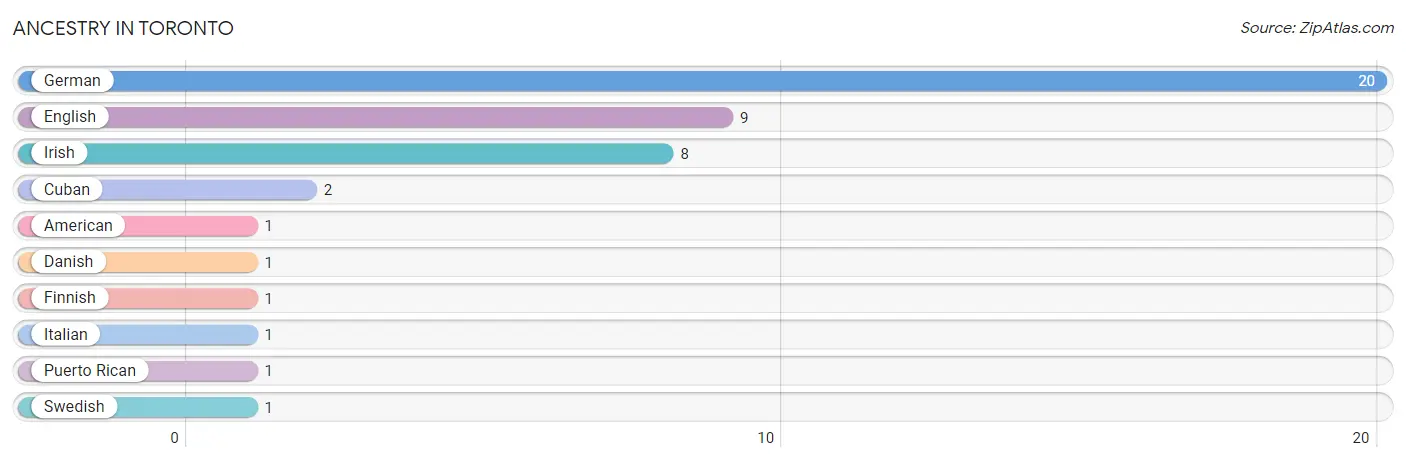
| Ancestry | # Population | % Population |
| American | 1 | 1.3% |
| Cuban | 2 | 2.6% |
| Danish | 1 | 1.3% |
| English | 9 | 11.8% |
| Finnish | 1 | 1.3% |
| German | 20 | 26.3% |
| Irish | 8 | 10.5% |
| Italian | 1 | 1.3% |
| Puerto Rican | 1 | 1.3% |
| Swedish | 1 | 1.3% | View All 10 Rows |
Immigrants in Toronto

| Immigration Origin | # Population | % Population | View All 0 Rows |
Sex and Age in Toronto
Sex and Age in Toronto
The most populous age groups in Toronto are 70 to 74 Years (12 | 30.8%) for men and 60 to 64 Years (9 | 24.3%) for women.
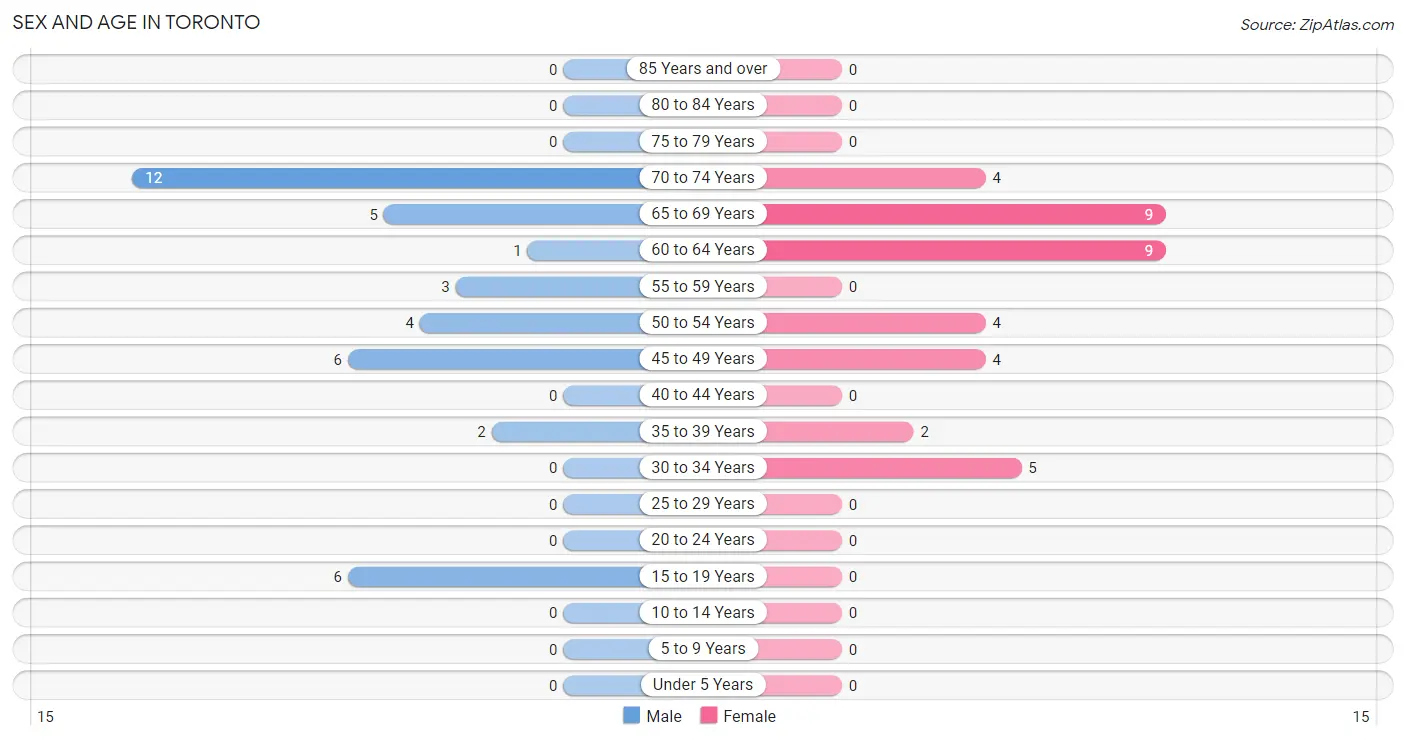
| Age Bracket | Male | Female |
| Under 5 Years | 0 (0.0%) | 0 (0.0%) |
| 5 to 9 Years | 0 (0.0%) | 0 (0.0%) |
| 10 to 14 Years | 0 (0.0%) | 0 (0.0%) |
| 15 to 19 Years | 6 (15.4%) | 0 (0.0%) |
| 20 to 24 Years | 0 (0.0%) | 0 (0.0%) |
| 25 to 29 Years | 0 (0.0%) | 0 (0.0%) |
| 30 to 34 Years | 0 (0.0%) | 5 (13.5%) |
| 35 to 39 Years | 2 (5.1%) | 2 (5.4%) |
| 40 to 44 Years | 0 (0.0%) | 0 (0.0%) |
| 45 to 49 Years | 6 (15.4%) | 4 (10.8%) |
| 50 to 54 Years | 4 (10.3%) | 4 (10.8%) |
| 55 to 59 Years | 3 (7.7%) | 0 (0.0%) |
| 60 to 64 Years | 1 (2.6%) | 9 (24.3%) |
| 65 to 69 Years | 5 (12.8%) | 9 (24.3%) |
| 70 to 74 Years | 12 (30.8%) | 4 (10.8%) |
| 75 to 79 Years | 0 (0.0%) | 0 (0.0%) |
| 80 to 84 Years | 0 (0.0%) | 0 (0.0%) |
| 85 Years and over | 0 (0.0%) | 0 (0.0%) |
| Total | 39 (100.0%) | 37 (100.0%) |
Families and Households in Toronto
Median Family Size in Toronto
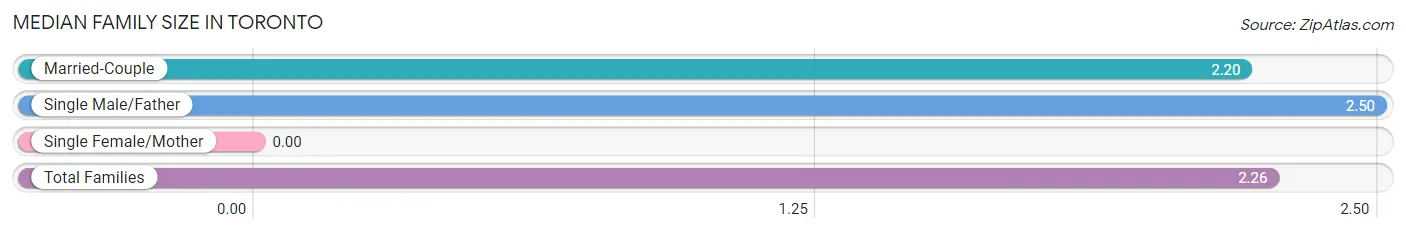
| Family Type | # Families | Family Size |
| Married-Couple | 15 (78.9%) | 2.20 |
| Single Male/Father | 4 (21.0%) | 2.50 |
| Single Female/Mother | 0 (0.0%) | - |
| Total Families | 19 (100.0%) | 2.26 |
Median Household Size in Toronto
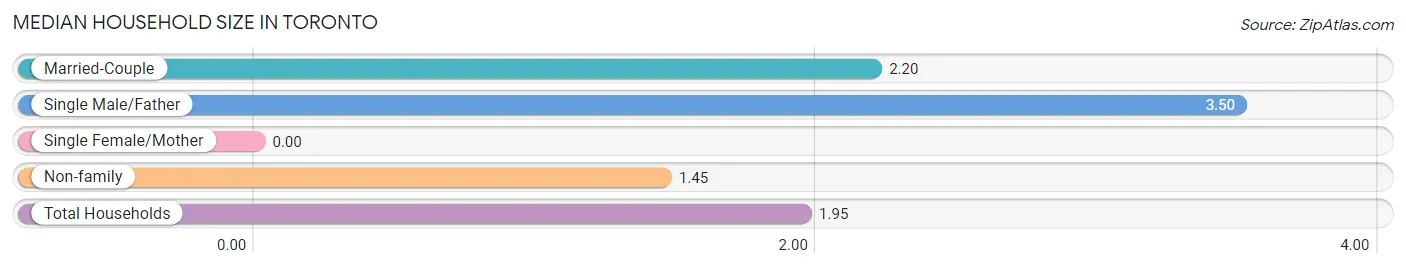
| Household Type | # Households | Household Size |
| Married-Couple | 15 (38.5%) | 2.20 |
| Single Male/Father | 4 (10.3%) | 3.50 |
| Single Female/Mother | 0 (0.0%) | - |
| Non-family | 20 (51.3%) | 1.45 |
| Total Households | 39 (100.0%) | 1.95 |
Household Size by Marriage Status in Toronto
Out of a total of 39 households in Toronto, 19 (48.7%) are family households, while 20 (51.3%) are nonfamily households. The most numerous type of family households are 2-person households, comprising 13, and the most common type of nonfamily households are 1-person households, comprising 11.
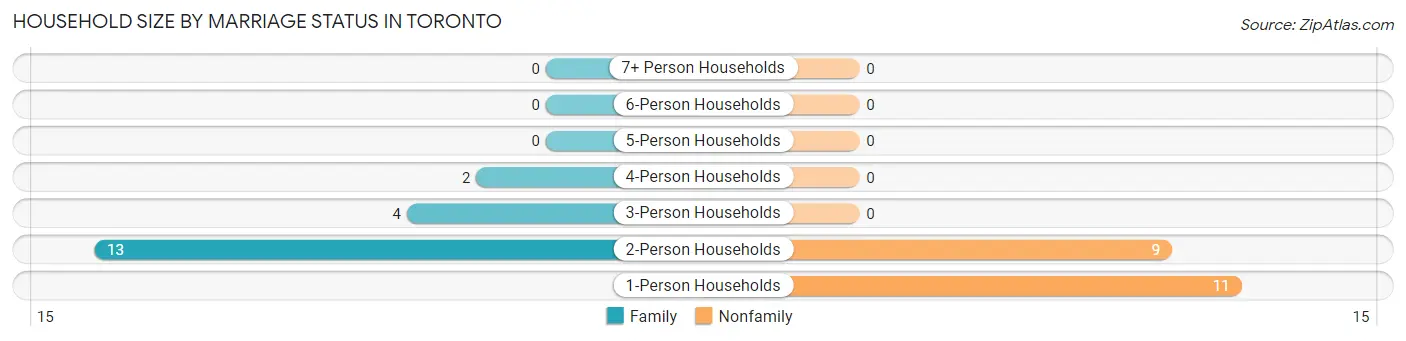
| Household Size | Family Households | Nonfamily Households |
| 1-Person Households | - | 11 (28.2%) |
| 2-Person Households | 13 (33.3%) | 9 (23.1%) |
| 3-Person Households | 4 (10.3%) | 0 (0.0%) |
| 4-Person Households | 2 (5.1%) | 0 (0.0%) |
| 5-Person Households | 0 (0.0%) | 0 (0.0%) |
| 6-Person Households | 0 (0.0%) | 0 (0.0%) |
| 7+ Person Households | 0 (0.0%) | 0 (0.0%) |
| Total | 19 (48.7%) | 20 (51.3%) |
Female Fertility in Toronto
Fertility by Age in Toronto
| Age Bracket | Women with Births | Births / 1,000 Women |
| 15 to 19 years | 0 (0.0%) | 0.0 |
| 20 to 34 years | 0 (0.0%) | 0.0 |
| 35 to 50 years | 0 (0.0%) | 0.0 |
| Total | 0 (0.0%) | 0.0 |
Fertility by Age by Marriage Status in Toronto
| Age Bracket | Married | Unmarried |
| 15 to 19 years | 0 (0.0%) | 0 (0.0%) |
| 20 to 34 years | 0 (0.0%) | 0 (0.0%) |
| 35 to 50 years | 0 (0.0%) | 0 (0.0%) |
| Total | 0 (0.0%) | 0 (0.0%) |
Fertility by Education in Toronto
| Educational Attainment | Women with Births | Births / 1,000 Women |
| Less than High School | 0 (0.0%) | 0.0 |
| High School Diploma | 0 (0.0%) | 0.0 |
| College or Associate's Degree | 0 (0.0%) | 0.0 |
| Bachelor's Degree | 0 (0.0%) | 0.0 |
| Graduate Degree | 0 (0.0%) | 0.0 |
| Total | 0 (0.0%) | 0.0 |
Fertility by Education by Marriage Status in Toronto
| Educational Attainment | Married | Unmarried |
| Less than High School | 0 (0.0%) | 0 (0.0%) |
| High School Diploma | 0 (0.0%) | 0 (0.0%) |
| College or Associate's Degree | 0 (0.0%) | 0 (0.0%) |
| Bachelor's Degree | 0 (0.0%) | 0 (0.0%) |
| Graduate Degree | 0 (0.0%) | 0 (0.0%) |
| Total | 0 (0.0%) | 0 (0.0%) |
Employment Characteristics in Toronto
Employment by Class of Employer in Toronto
Among the 27 employed individuals in Toronto, private company employees (22 | 81.5%), self-employed (incorporated) (3 | 11.1%), and local government employees (2 | 7.4%) make up the most common classes of employment.
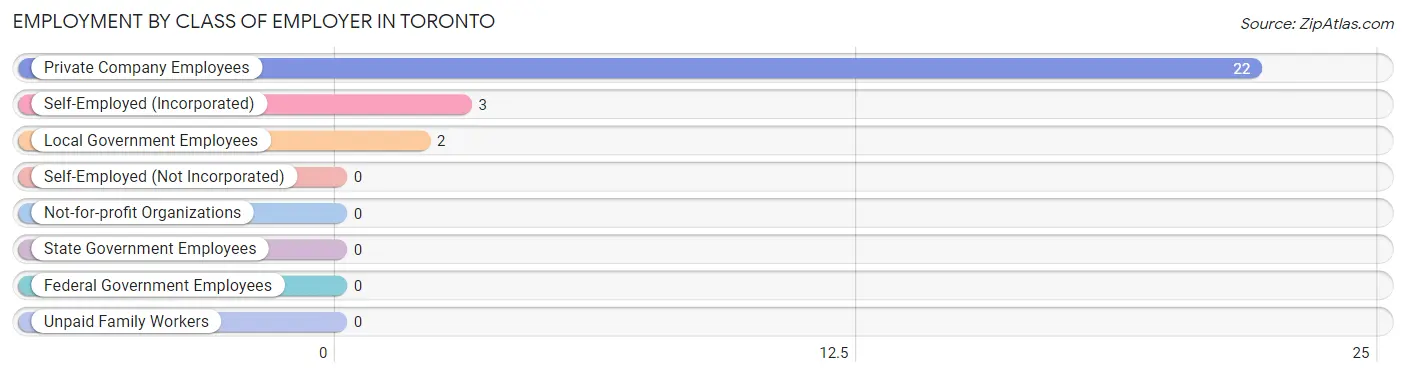
| Employer Class | # Employees | % Employees |
| Private Company Employees | 22 | 81.5% |
| Self-Employed (Incorporated) | 3 | 11.1% |
| Self-Employed (Not Incorporated) | 0 | 0.0% |
| Not-for-profit Organizations | 0 | 0.0% |
| Local Government Employees | 2 | 7.4% |
| State Government Employees | 0 | 0.0% |
| Federal Government Employees | 0 | 0.0% |
| Unpaid Family Workers | 0 | 0.0% |
| Total | 27 | 100.0% |
Employment Status by Age in Toronto
According to the labor force statistics for Toronto, out of the total population over 16 years of age (76), 43.4% or 33 individuals are in the labor force, with 18.2% or 6 of them unemployed. The age group with the highest labor force participation rate is 60 to 64 years, with 80.0% or 8 individuals in the labor force. Within the labor force, the 45 to 54 years age range has the highest percentage of unemployed individuals, with 42.9% or 6 of them being unemployed.
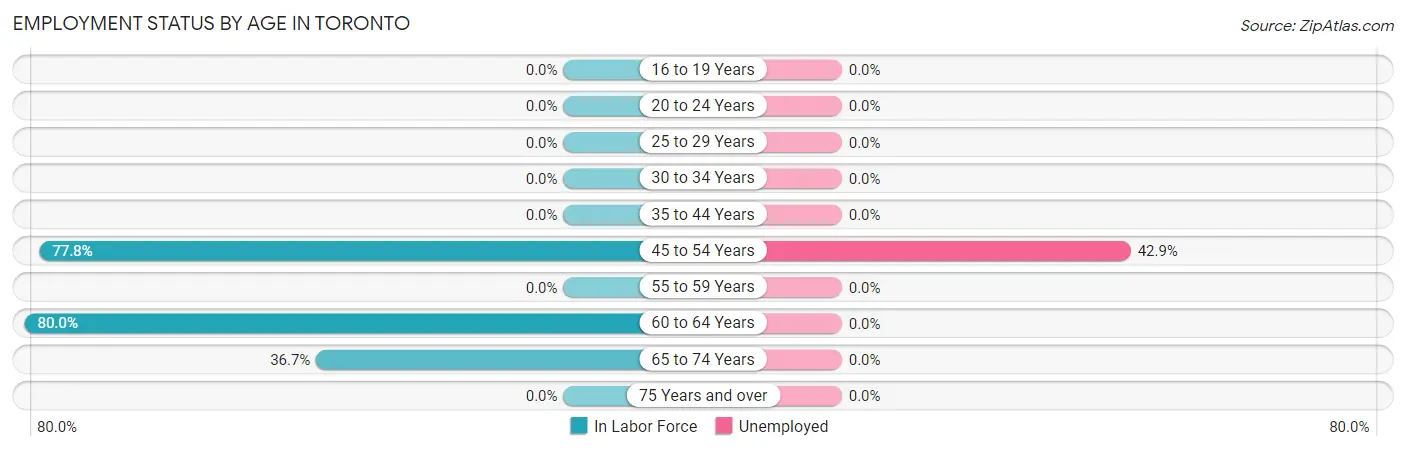
| Age Bracket | In Labor Force | Unemployed |
| 16 to 19 Years | 0 (0.0%) | 0 (0.0%) |
| 20 to 24 Years | 0 (0.0%) | 0 (0.0%) |
| 25 to 29 Years | 0 (0.0%) | 0 (0.0%) |
| 30 to 34 Years | 0 (0.0%) | 0 (0.0%) |
| 35 to 44 Years | 0 (0.0%) | 0 (0.0%) |
| 45 to 54 Years | 14 (77.8%) | 6 (42.9%) |
| 55 to 59 Years | 0 (0.0%) | 0 (0.0%) |
| 60 to 64 Years | 8 (80.0%) | 0 (0.0%) |
| 65 to 74 Years | 11 (36.7%) | 0 (0.0%) |
| 75 Years and over | 0 (0.0%) | 0 (0.0%) |
| Total | 33 (43.4%) | 6 (18.2%) |
Employment Status by Educational Attainment in Toronto
According to labor force statistics for Toronto, 55.0% of individuals (22) out of the total population between 25 and 64 years of age (40) are in the labor force, with 27.3% or 6 of them being unemployed. The group with the highest labor force participation rate are those with the educational attainment of college / associate degree, with 83.3% or 5 individuals in the labor force. Within the labor force, individuals with high school diploma education have the highest percentage of unemployment, with 37.5% or 6 of them being unemployed.
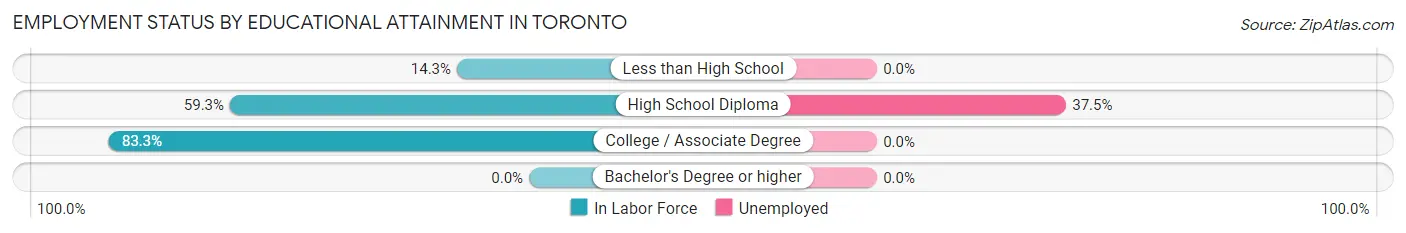
| Educational Attainment | In Labor Force | Unemployed |
| Less than High School | 1 (14.3%) | 0 (0.0%) |
| High School Diploma | 16 (59.3%) | 10 (37.5%) |
| College / Associate Degree | 5 (83.3%) | 0 (0.0%) |
| Bachelor's Degree or higher | 0 (0.0%) | 0 (0.0%) |
| Total | 22 (55.0%) | 11 (27.3%) |
Employment Occupations by Sex in Toronto
Management, Business, Science and Arts Occupations
The most common Management, Business, Science and Arts occupations in Toronto are Management (3 | 11.1%), Community & Social Service (2 | 7.4%), and Education Instruction & Library (2 | 7.4%).
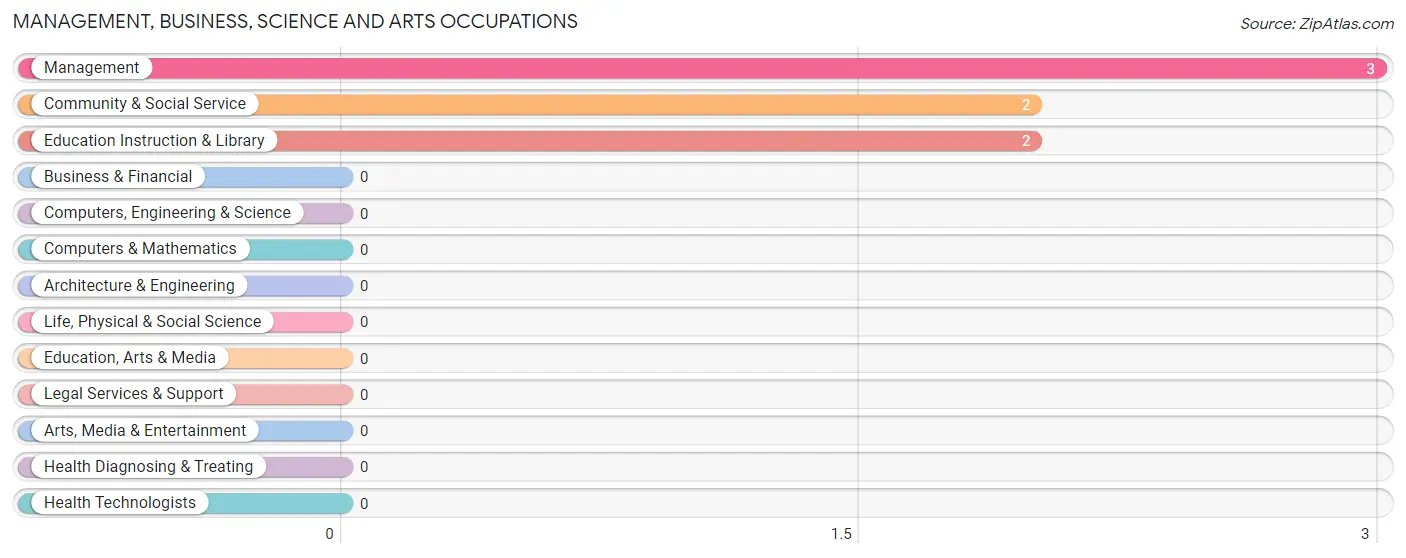
Management, Business, Science and Arts Occupations by Sex
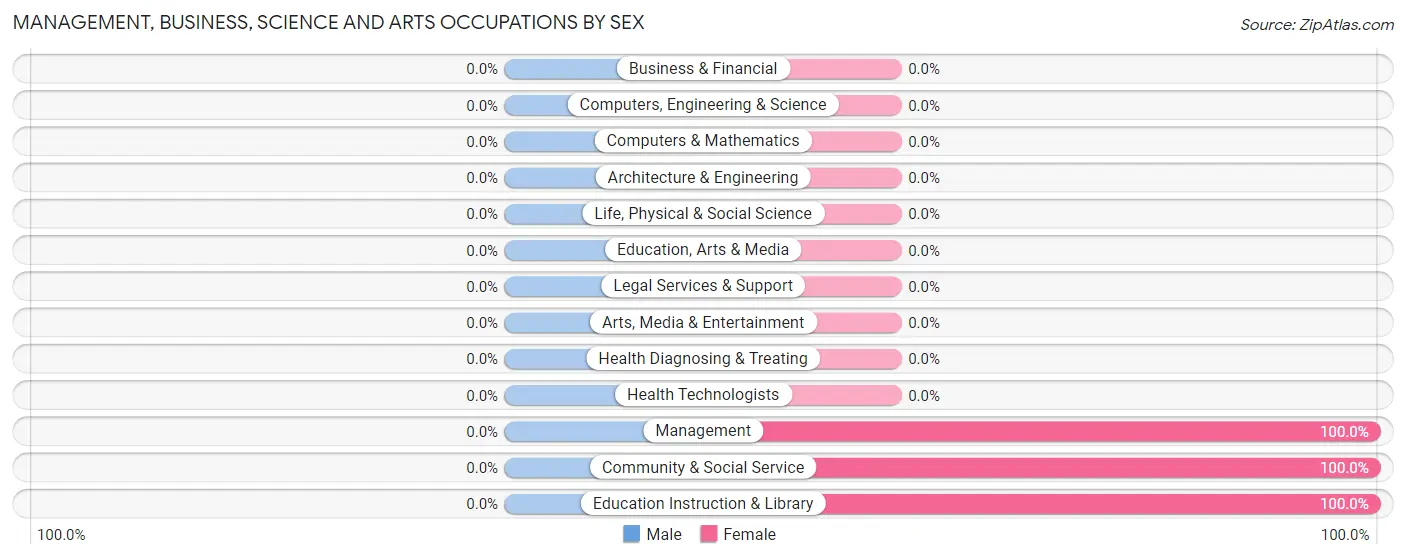
| Occupation | Male | Female |
| Management | 0 (0.0%) | 3 (100.0%) |
| Business & Financial | 0 (0.0%) | 0 (0.0%) |
| Computers, Engineering & Science | 0 (0.0%) | 0 (0.0%) |
| Computers & Mathematics | 0 (0.0%) | 0 (0.0%) |
| Architecture & Engineering | 0 (0.0%) | 0 (0.0%) |
| Life, Physical & Social Science | 0 (0.0%) | 0 (0.0%) |
| Community & Social Service | 0 (0.0%) | 2 (100.0%) |
| Education, Arts & Media | 0 (0.0%) | 0 (0.0%) |
| Legal Services & Support | 0 (0.0%) | 0 (0.0%) |
| Education Instruction & Library | 0 (0.0%) | 2 (100.0%) |
| Arts, Media & Entertainment | 0 (0.0%) | 0 (0.0%) |
| Health Diagnosing & Treating | 0 (0.0%) | 0 (0.0%) |
| Health Technologists | 0 (0.0%) | 0 (0.0%) |
| Total (Category) | 0 (0.0%) | 5 (100.0%) |
| Total (Overall) | 8 (29.6%) | 19 (70.4%) |
Services Occupations
The most common Services occupations in Toronto are , and Food Preparation & Serving (6 | 22.2%).
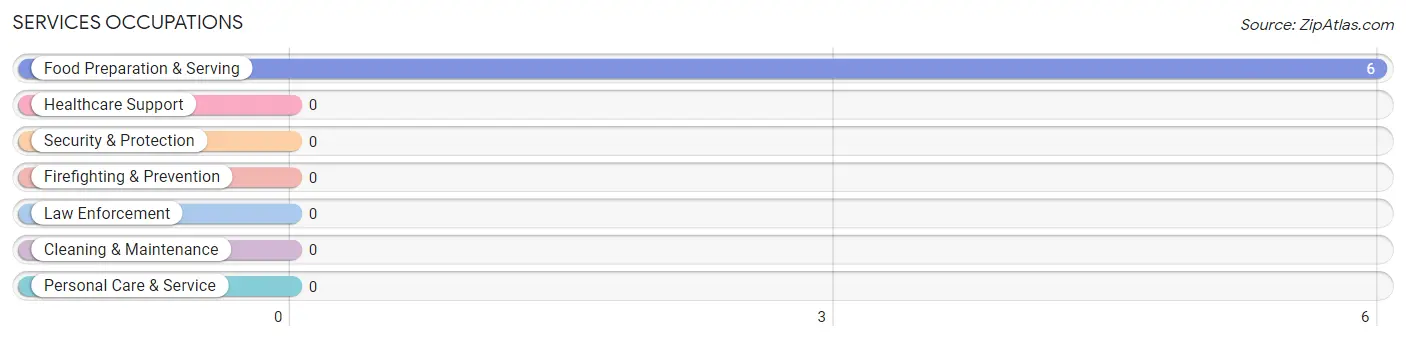
Services Occupations by Sex
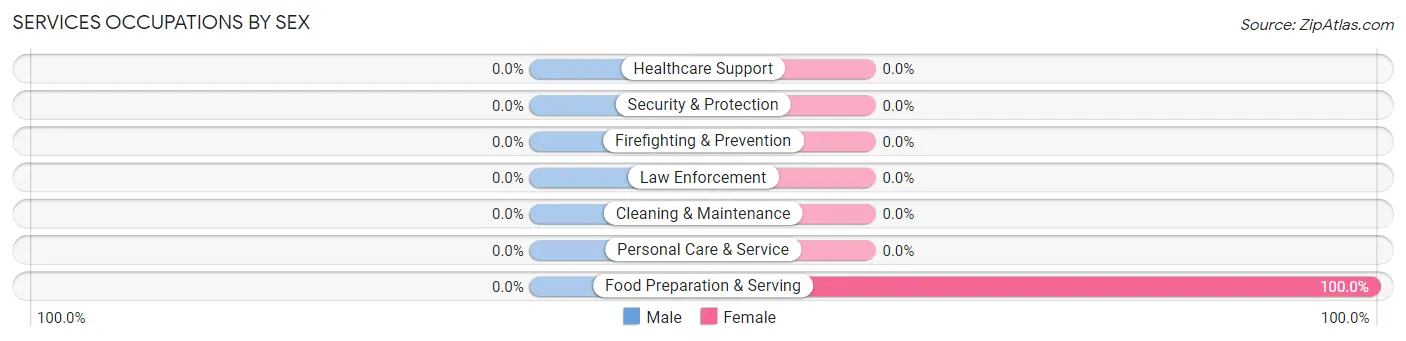
| Occupation | Male | Female |
| Healthcare Support | 0 (0.0%) | 0 (0.0%) |
| Security & Protection | 0 (0.0%) | 0 (0.0%) |
| Firefighting & Prevention | 0 (0.0%) | 0 (0.0%) |
| Law Enforcement | 0 (0.0%) | 0 (0.0%) |
| Food Preparation & Serving | 0 (0.0%) | 6 (100.0%) |
| Cleaning & Maintenance | 0 (0.0%) | 0 (0.0%) |
| Personal Care & Service | 0 (0.0%) | 0 (0.0%) |
| Total (Category) | 0 (0.0%) | 6 (100.0%) |
| Total (Overall) | 8 (29.6%) | 19 (70.4%) |
Sales and Office Occupations
The most common Sales and Office occupations in Toronto are Sales & Related (7 | 25.9%), and Office & Administration (4 | 14.8%).

Sales and Office Occupations by Sex

| Occupation | Male | Female |
| Sales & Related | 3 (42.9%) | 4 (57.1%) |
| Office & Administration | 0 (0.0%) | 4 (100.0%) |
| Total (Category) | 3 (27.3%) | 8 (72.7%) |
| Total (Overall) | 8 (29.6%) | 19 (70.4%) |
Natural Resources, Construction and Maintenance Occupations
The most common Natural Resources, Construction and Maintenance occupations in Toronto are , and Installation, Maintenance & Repair (1 | 3.7%).
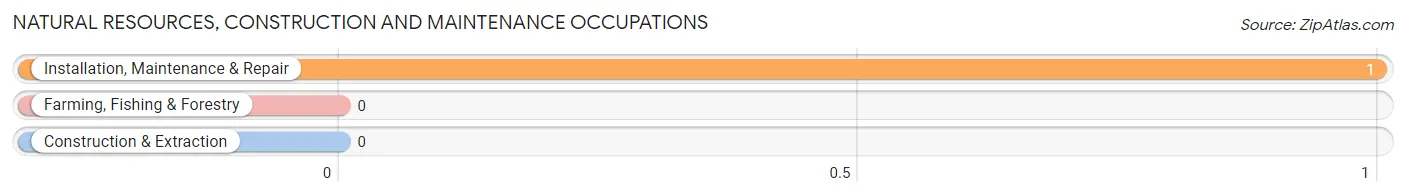
Natural Resources, Construction and Maintenance Occupations by Sex
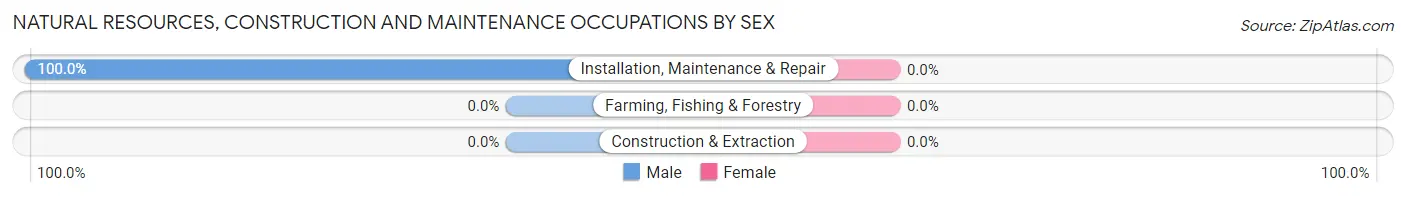
| Occupation | Male | Female |
| Farming, Fishing & Forestry | 0 (0.0%) | 0 (0.0%) |
| Construction & Extraction | 0 (0.0%) | 0 (0.0%) |
| Installation, Maintenance & Repair | 1 (100.0%) | 0 (0.0%) |
| Total (Category) | 1 (100.0%) | 0 (0.0%) |
| Total (Overall) | 8 (29.6%) | 19 (70.4%) |
Production, Transportation and Moving Occupations
The most common Production, Transportation and Moving occupations in Toronto are Production (2 | 7.4%), and Transportation (2 | 7.4%).
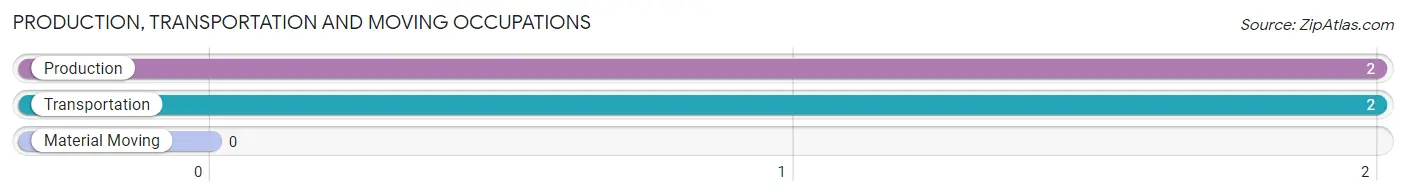
Production, Transportation and Moving Occupations by Sex
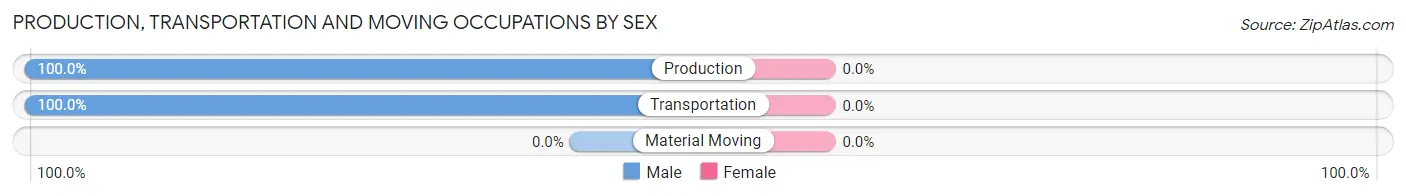
| Occupation | Male | Female |
| Production | 2 (100.0%) | 0 (0.0%) |
| Transportation | 2 (100.0%) | 0 (0.0%) |
| Material Moving | 0 (0.0%) | 0 (0.0%) |
| Total (Category) | 4 (100.0%) | 0 (0.0%) |
| Total (Overall) | 8 (29.6%) | 19 (70.4%) |
Employment Industries by Sex in Toronto
Employment Industries in Toronto
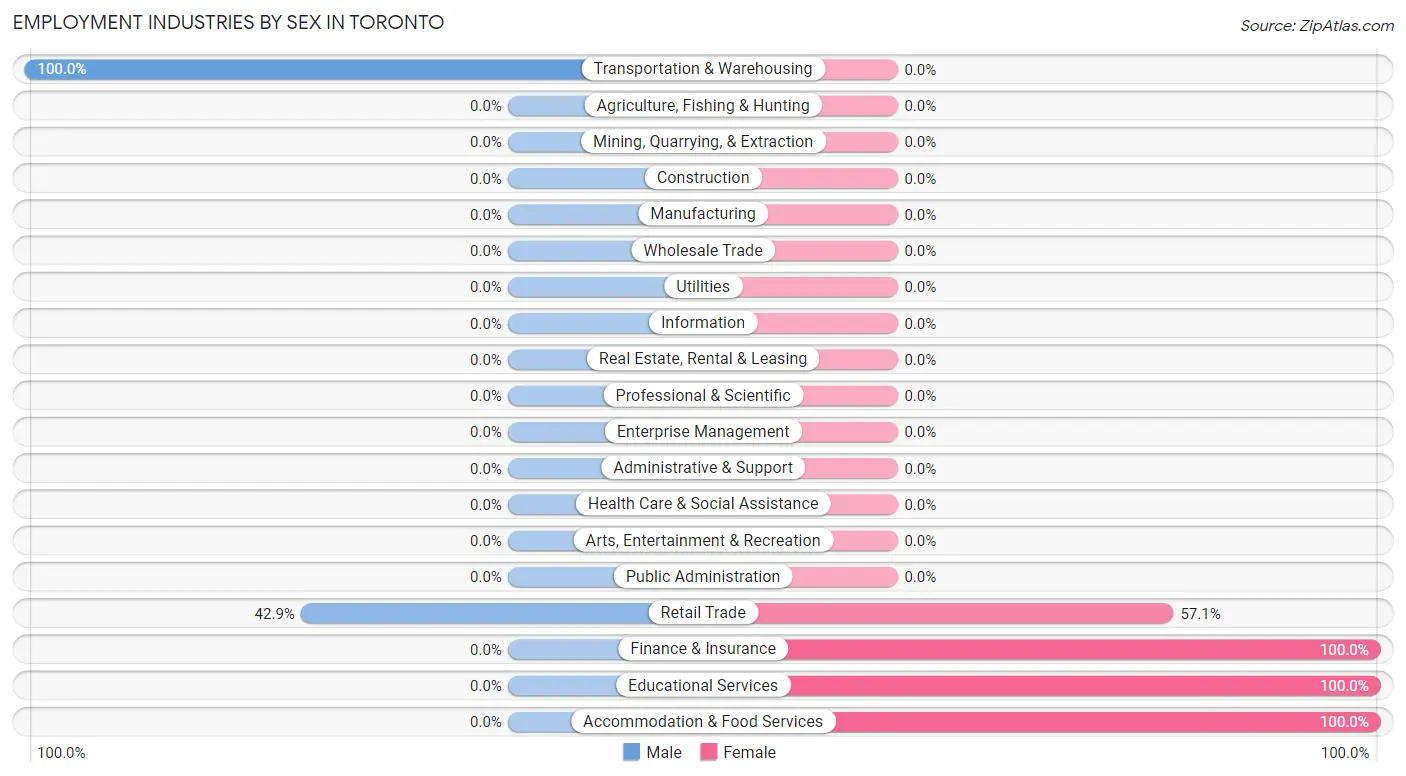
The major employment industries in Toronto include Retail Trade (14 | 51.8%), Finance & Insurance (4 | 14.8%), Transportation & Warehousing (2 | 7.4%), Educational Services (2 | 7.4%), and Accommodation & Food Services (2 | 7.4%).
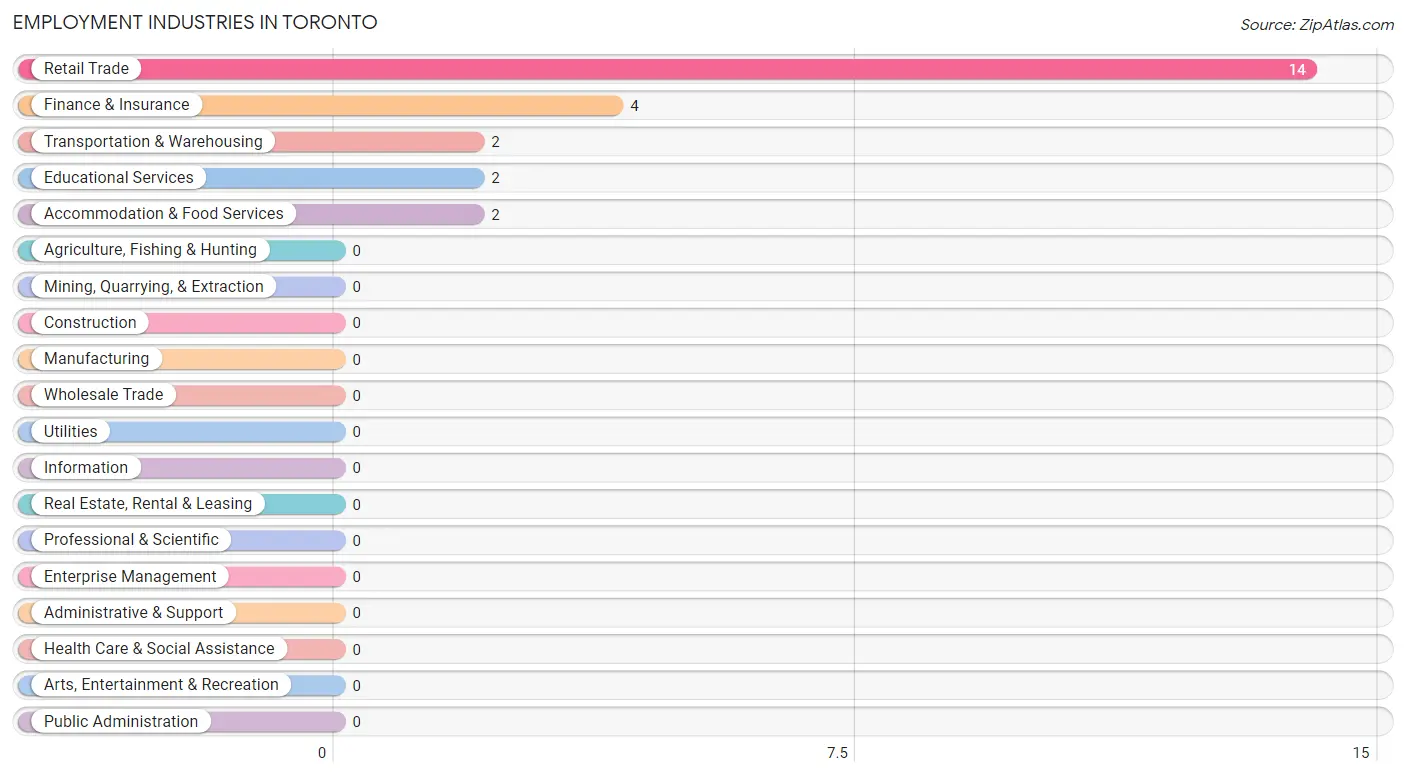
Employment Industries by Sex in Toronto
The Toronto industries that see more men than women are Transportation & Warehousing (100.0%), and Retail Trade (42.9%), whereas the industries that tend to have a higher number of women are Finance & Insurance (100.0%), Educational Services (100.0%), and Accommodation & Food Services (100.0%).
| Industry | Male | Female |
| Agriculture, Fishing & Hunting | 0 (0.0%) | 0 (0.0%) |
| Mining, Quarrying, & Extraction | 0 (0.0%) | 0 (0.0%) |
| Construction | 0 (0.0%) | 0 (0.0%) |
| Manufacturing | 0 (0.0%) | 0 (0.0%) |
| Wholesale Trade | 0 (0.0%) | 0 (0.0%) |
| Retail Trade | 6 (42.9%) | 8 (57.1%) |
| Transportation & Warehousing | 2 (100.0%) | 0 (0.0%) |
| Utilities | 0 (0.0%) | 0 (0.0%) |
| Information | 0 (0.0%) | 0 (0.0%) |
| Finance & Insurance | 0 (0.0%) | 4 (100.0%) |
| Real Estate, Rental & Leasing | 0 (0.0%) | 0 (0.0%) |
| Professional & Scientific | 0 (0.0%) | 0 (0.0%) |
| Enterprise Management | 0 (0.0%) | 0 (0.0%) |
| Administrative & Support | 0 (0.0%) | 0 (0.0%) |
| Educational Services | 0 (0.0%) | 2 (100.0%) |
| Health Care & Social Assistance | 0 (0.0%) | 0 (0.0%) |
| Arts, Entertainment & Recreation | 0 (0.0%) | 0 (0.0%) |
| Accommodation & Food Services | 0 (0.0%) | 2 (100.0%) |
| Public Administration | 0 (0.0%) | 0 (0.0%) |
| Total | 8 (29.6%) | 19 (70.4%) |
Education in Toronto
School Enrollment in Toronto
| School Level | # Students | % Students |
| Nursery / Preschool | 0 | 0.0% |
| Kindergarten | 0 | 0.0% |
| Elementary School | 0 | 0.0% |
| Middle School | 0 | 0.0% |
| High School | 0 | 0.0% |
| College / Undergraduate | 0 | 0.0% |
| Graduate / Professional | 0 | 0.0% |
| Total | 0 | 0.0% |
School Enrollment by Age by Funding Source in Toronto
| Age Bracket | Public School | Private School |
| 3 to 4 Year Olds | 0 (0.0%) | 0 (0.0%) |
| 5 to 9 Year Old | 0 (0.0%) | 0 (0.0%) |
| 10 to 14 Year Olds | 0 (0.0%) | 0 (0.0%) |
| 15 to 17 Year Olds | 0 (0.0%) | 0 (0.0%) |
| 18 to 19 Year Olds | 0 (0.0%) | 0 (0.0%) |
| 20 to 24 Year Olds | 0 (0.0%) | 0 (0.0%) |
| 25 to 34 Year Olds | 0 (0.0%) | 0 (0.0%) |
| 35 Years and over | 0 (0.0%) | 0 (0.0%) |
| Total | 0 (0.0%) | 0 (0.0%) |
Educational Attainment by Field of Study in Toronto
, and social sciences (2 | 100.0%) are the most common fields of study among 2 individuals in Toronto who have obtained a bachelor's degree or higher.
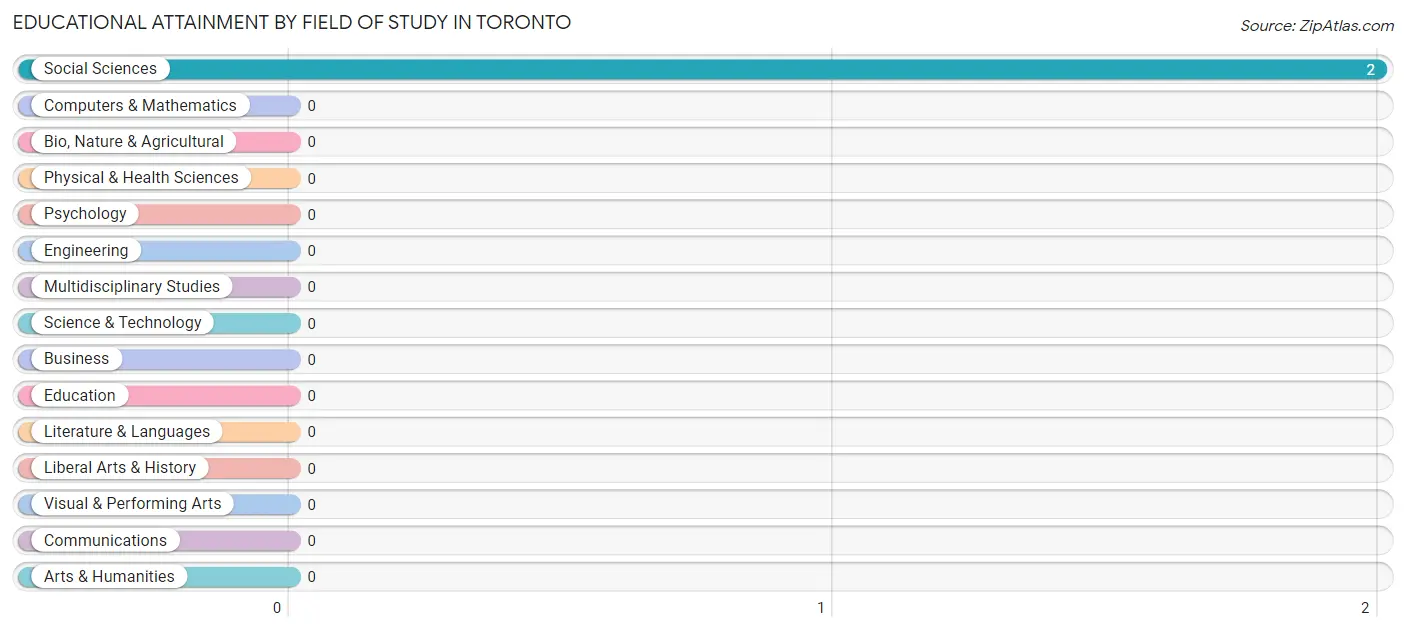
| Field of Study | # Graduates | % Graduates |
| Computers & Mathematics | 0 | 0.0% |
| Bio, Nature & Agricultural | 0 | 0.0% |
| Physical & Health Sciences | 0 | 0.0% |
| Psychology | 0 | 0.0% |
| Social Sciences | 2 | 100.0% |
| Engineering | 0 | 0.0% |
| Multidisciplinary Studies | 0 | 0.0% |
| Science & Technology | 0 | 0.0% |
| Business | 0 | 0.0% |
| Education | 0 | 0.0% |
| Literature & Languages | 0 | 0.0% |
| Liberal Arts & History | 0 | 0.0% |
| Visual & Performing Arts | 0 | 0.0% |
| Communications | 0 | 0.0% |
| Arts & Humanities | 0 | 0.0% |
| Total | 2 | 100.0% |
Transportation & Commute in Toronto
Vehicle Availability by Sex in Toronto
The most prevalent vehicle ownership categories in Toronto are males with 3 vehicles (5, accounting for 62.5%) and females with 3 vehicles (5, making up 26.3%).
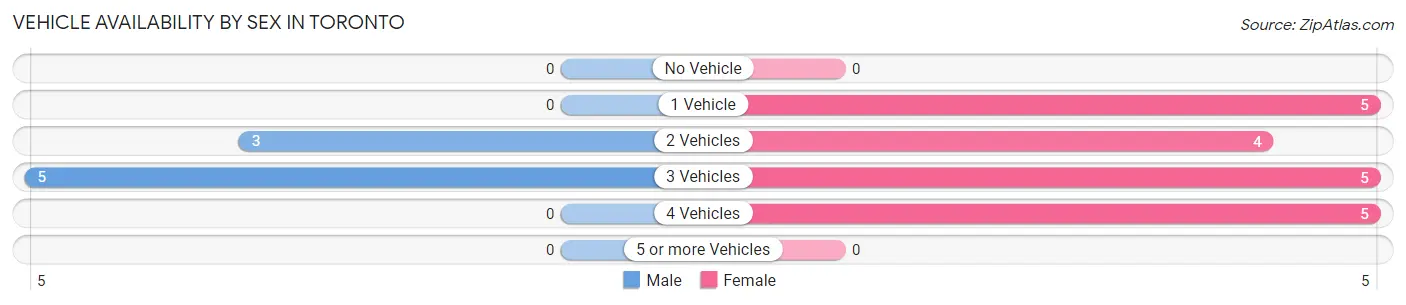
| Vehicles Available | Male | Female |
| No Vehicle | 0 (0.0%) | 0 (0.0%) |
| 1 Vehicle | 0 (0.0%) | 5 (26.3%) |
| 2 Vehicles | 3 (37.5%) | 4 (21.0%) |
| 3 Vehicles | 5 (62.5%) | 5 (26.3%) |
| 4 Vehicles | 0 (0.0%) | 5 (26.3%) |
| 5 or more Vehicles | 0 (0.0%) | 0 (0.0%) |
| Total | 8 (100.0%) | 19 (100.0%) |
Commute Time in Toronto
The most frequently occuring commute durations in Toronto are 45 to 59 minutes (7 commuters, 29.2%), 5 to 9 minutes (5 commuters, 20.8%), and 40 to 44 minutes (5 commuters, 20.8%).
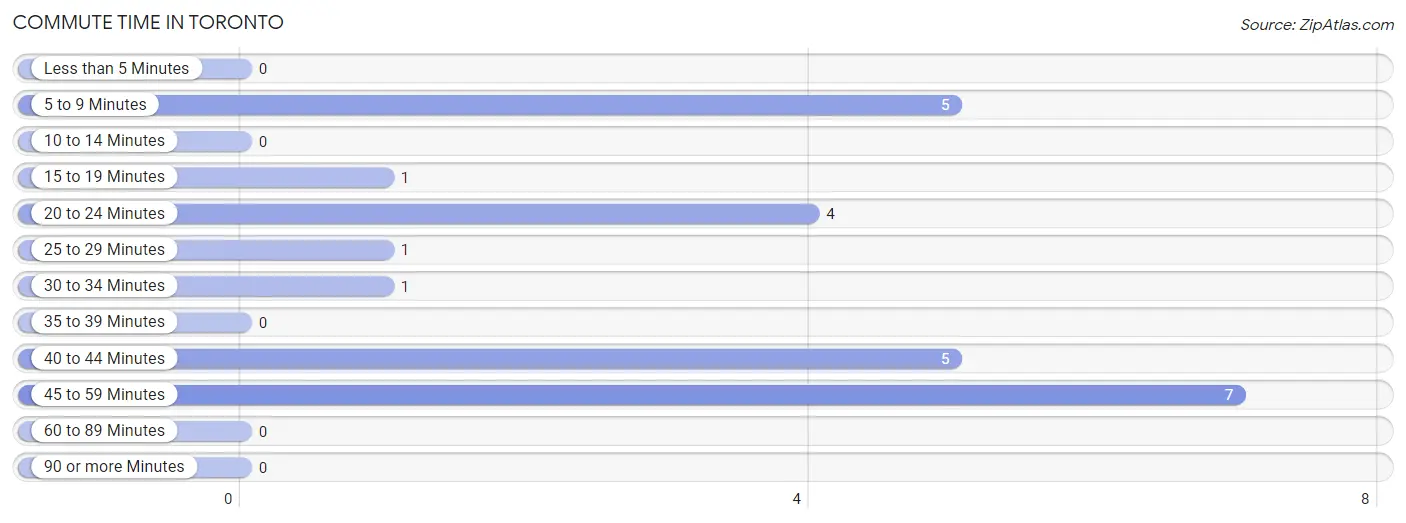
| Commute Time | # Commuters | % Commuters |
| Less than 5 Minutes | 0 | 0.0% |
| 5 to 9 Minutes | 5 | 20.8% |
| 10 to 14 Minutes | 0 | 0.0% |
| 15 to 19 Minutes | 1 | 4.2% |
| 20 to 24 Minutes | 4 | 16.7% |
| 25 to 29 Minutes | 1 | 4.2% |
| 30 to 34 Minutes | 1 | 4.2% |
| 35 to 39 Minutes | 0 | 0.0% |
| 40 to 44 Minutes | 5 | 20.8% |
| 45 to 59 Minutes | 7 | 29.2% |
| 60 to 89 Minutes | 0 | 0.0% |
| 90 or more Minutes | 0 | 0.0% |
Commute Time by Sex in Toronto
The most common commute times in Toronto are 40 to 44 minutes (5 commuters, 62.5%) for males and 5 to 9 minutes (5 commuters, 31.2%) for females.
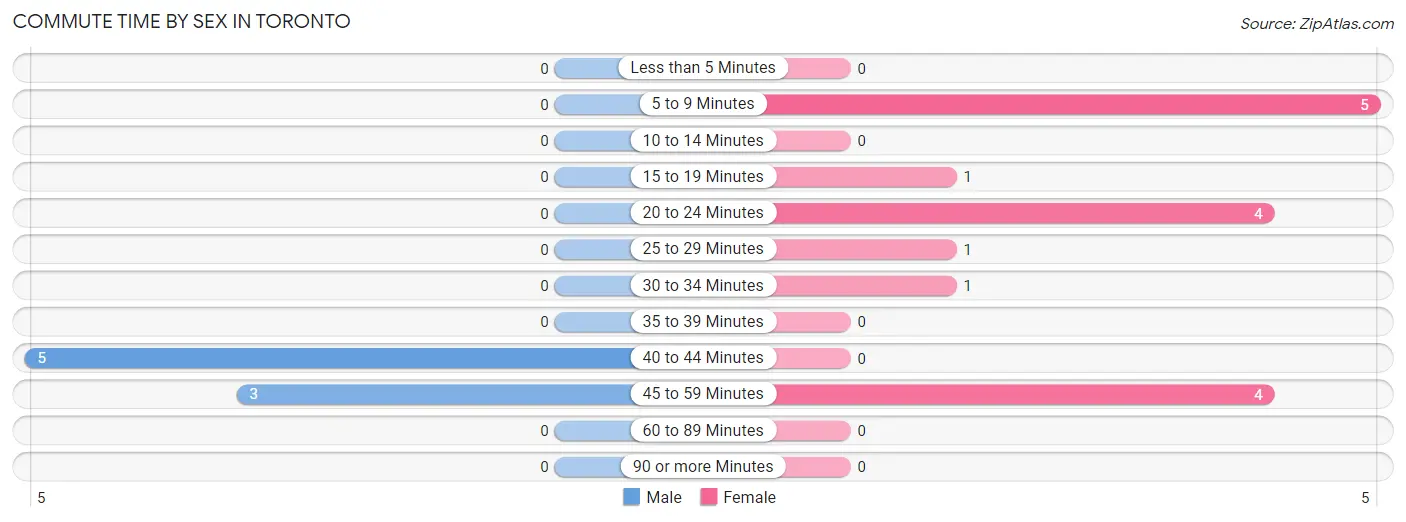
| Commute Time | Male | Female |
| Less than 5 Minutes | 0 (0.0%) | 0 (0.0%) |
| 5 to 9 Minutes | 0 (0.0%) | 5 (31.2%) |
| 10 to 14 Minutes | 0 (0.0%) | 0 (0.0%) |
| 15 to 19 Minutes | 0 (0.0%) | 1 (6.2%) |
| 20 to 24 Minutes | 0 (0.0%) | 4 (25.0%) |
| 25 to 29 Minutes | 0 (0.0%) | 1 (6.2%) |
| 30 to 34 Minutes | 0 (0.0%) | 1 (6.2%) |
| 35 to 39 Minutes | 0 (0.0%) | 0 (0.0%) |
| 40 to 44 Minutes | 5 (62.5%) | 0 (0.0%) |
| 45 to 59 Minutes | 3 (37.5%) | 4 (25.0%) |
| 60 to 89 Minutes | 0 (0.0%) | 0 (0.0%) |
| 90 or more Minutes | 0 (0.0%) | 0 (0.0%) |
Time of Departure to Work by Sex in Toronto
The most frequent times of departure to work in Toronto are 9:00 AM to 9:59 AM (5, 62.5%) for males and 6:00 AM to 6:29 AM (5, 31.2%) for females.
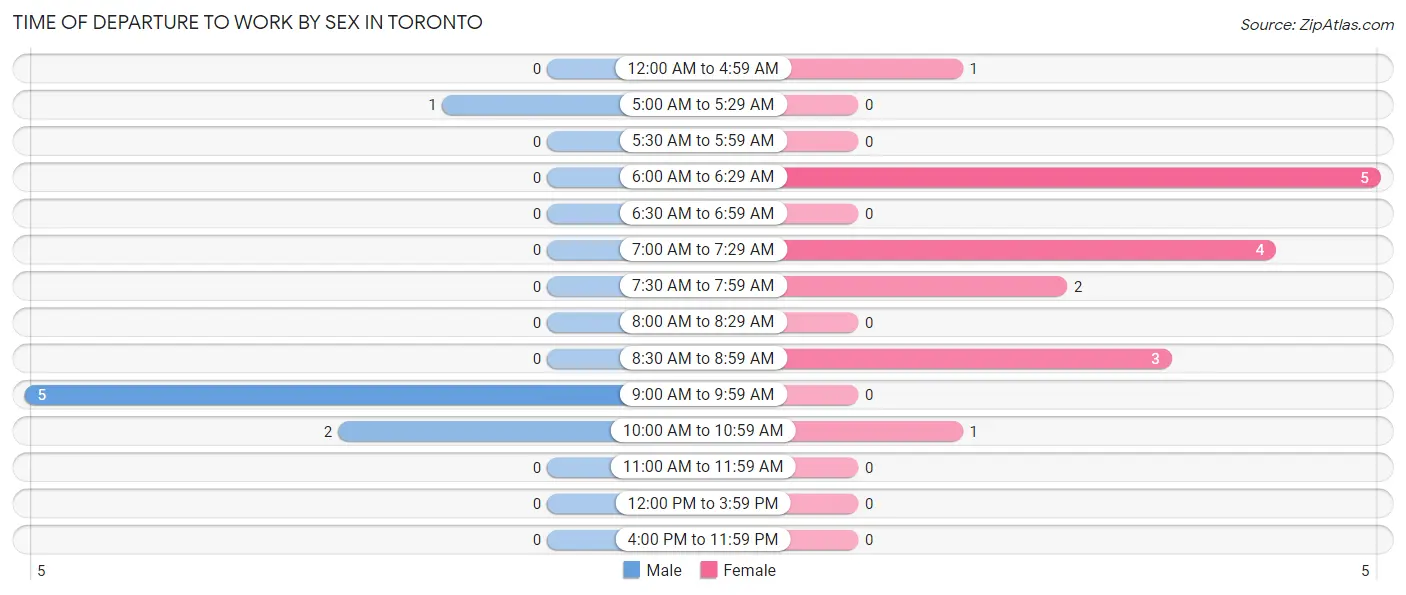
| Time of Departure | Male | Female |
| 12:00 AM to 4:59 AM | 0 (0.0%) | 1 (6.2%) |
| 5:00 AM to 5:29 AM | 1 (12.5%) | 0 (0.0%) |
| 5:30 AM to 5:59 AM | 0 (0.0%) | 0 (0.0%) |
| 6:00 AM to 6:29 AM | 0 (0.0%) | 5 (31.2%) |
| 6:30 AM to 6:59 AM | 0 (0.0%) | 0 (0.0%) |
| 7:00 AM to 7:29 AM | 0 (0.0%) | 4 (25.0%) |
| 7:30 AM to 7:59 AM | 0 (0.0%) | 2 (12.5%) |
| 8:00 AM to 8:29 AM | 0 (0.0%) | 0 (0.0%) |
| 8:30 AM to 8:59 AM | 0 (0.0%) | 3 (18.8%) |
| 9:00 AM to 9:59 AM | 5 (62.5%) | 0 (0.0%) |
| 10:00 AM to 10:59 AM | 2 (25.0%) | 1 (6.2%) |
| 11:00 AM to 11:59 AM | 0 (0.0%) | 0 (0.0%) |
| 12:00 PM to 3:59 PM | 0 (0.0%) | 0 (0.0%) |
| 4:00 PM to 11:59 PM | 0 (0.0%) | 0 (0.0%) |
| Total | 8 (100.0%) | 16 (100.0%) |
Housing Occupancy in Toronto
Occupancy by Ownership in Toronto
Of the total 39 dwellings in Toronto, owner-occupied units account for 35 (89.7%), while renter-occupied units make up 4 (10.3%).
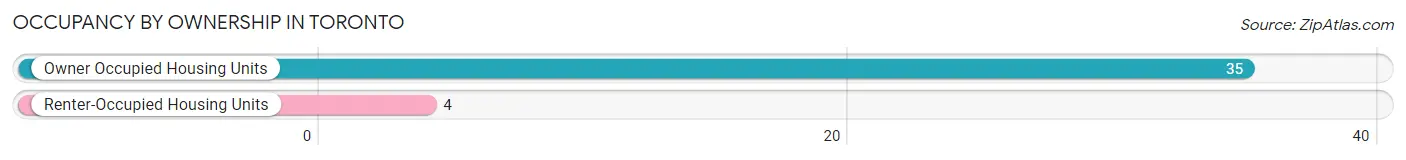
| Occupancy | # Housing Units | % Housing Units |
| Owner Occupied Housing Units | 35 | 89.7% |
| Renter-Occupied Housing Units | 4 | 10.3% |
| Total Occupied Housing Units | 39 | 100.0% |
Occupancy by Household Size in Toronto
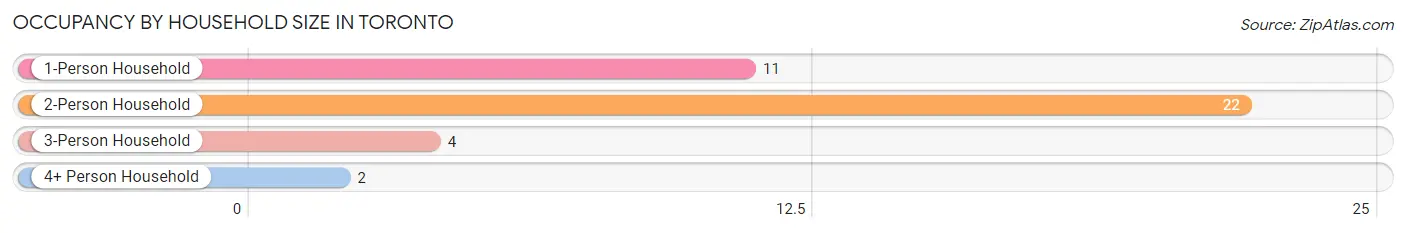
| Household Size | # Housing Units | % Housing Units |
| 1-Person Household | 11 | 28.2% |
| 2-Person Household | 22 | 56.4% |
| 3-Person Household | 4 | 10.3% |
| 4+ Person Household | 2 | 5.1% |
| Total Housing Units | 39 | 100.0% |
Occupancy by Ownership by Household Size in Toronto
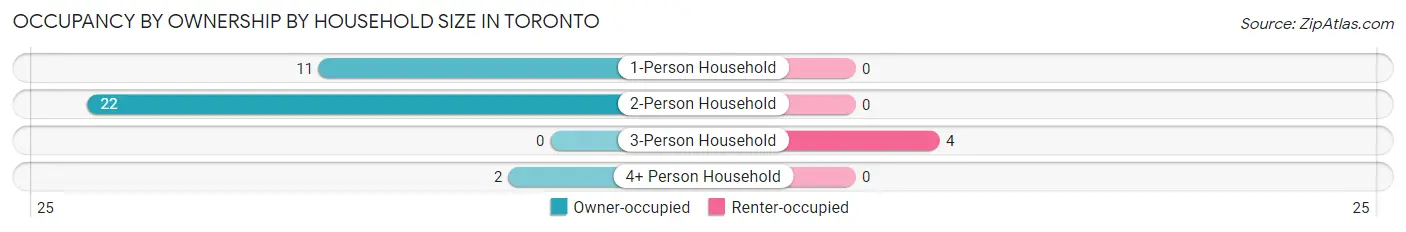
| Household Size | Owner-occupied | Renter-occupied |
| 1-Person Household | 11 (100.0%) | 0 (0.0%) |
| 2-Person Household | 22 (100.0%) | 0 (0.0%) |
| 3-Person Household | 0 (0.0%) | 4 (100.0%) |
| 4+ Person Household | 2 (100.0%) | 0 (0.0%) |
| Total Housing Units | 35 (89.7%) | 4 (10.3%) |
Occupancy by Educational Attainment in Toronto
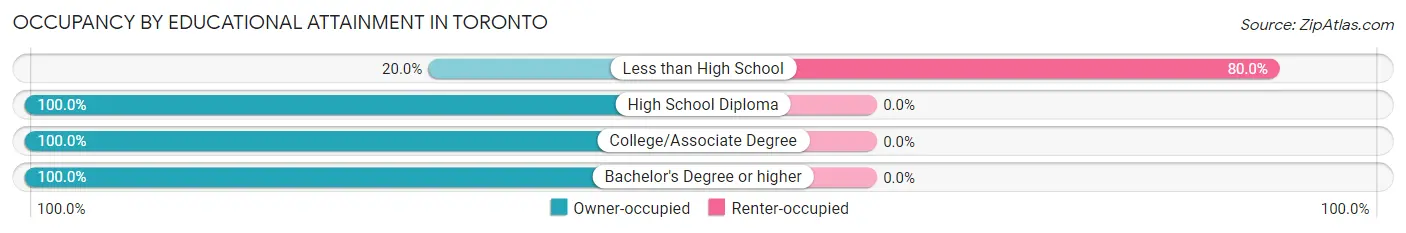
| Household Size | Owner-occupied | Renter-occupied |
| Less than High School | 1 (20.0%) | 4 (80.0%) |
| High School Diploma | 23 (100.0%) | 0 (0.0%) |
| College/Associate Degree | 9 (100.0%) | 0 (0.0%) |
| Bachelor's Degree or higher | 2 (100.0%) | 0 (0.0%) |
Occupancy by Age of Householder in Toronto
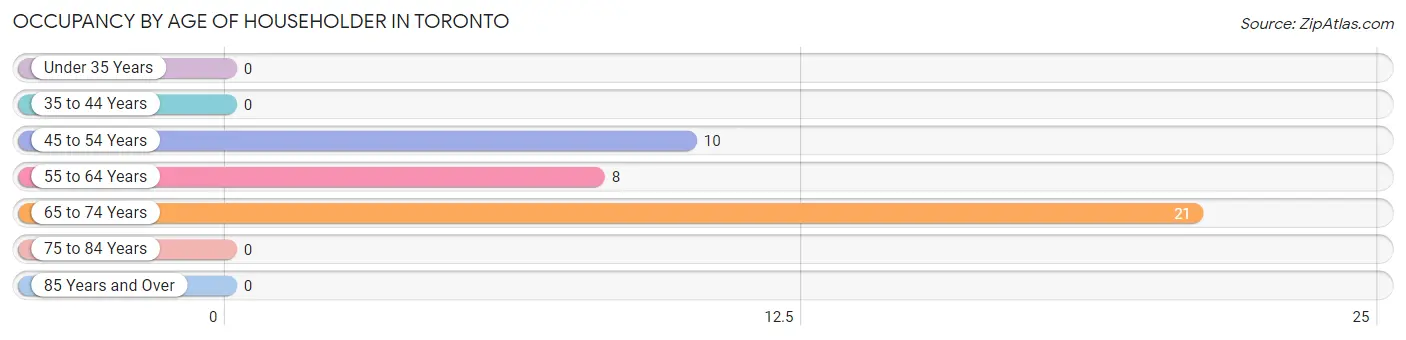
| Age Bracket | # Households | % Households |
| Under 35 Years | 0 | 0.0% |
| 35 to 44 Years | 0 | 0.0% |
| 45 to 54 Years | 10 | 25.6% |
| 55 to 64 Years | 8 | 20.5% |
| 65 to 74 Years | 21 | 53.8% |
| 75 to 84 Years | 0 | 0.0% |
| 85 Years and Over | 0 | 0.0% |
| Total | 39 | 100.0% |
Housing Finances in Toronto
Median Income by Occupancy in Toronto
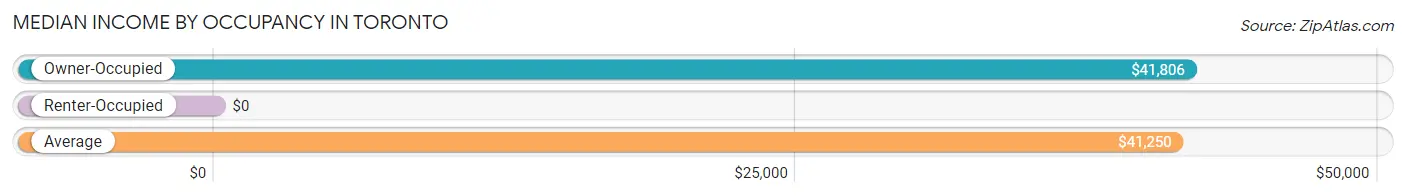
| Occupancy Type | # Households | Median Income |
| Owner-Occupied | 35 (89.7%) | $41,806 |
| Renter-Occupied | 4 (10.3%) | $0 |
| Average | 39 (100.0%) | $41,250 |
Occupancy by Householder Income Bracket in Toronto
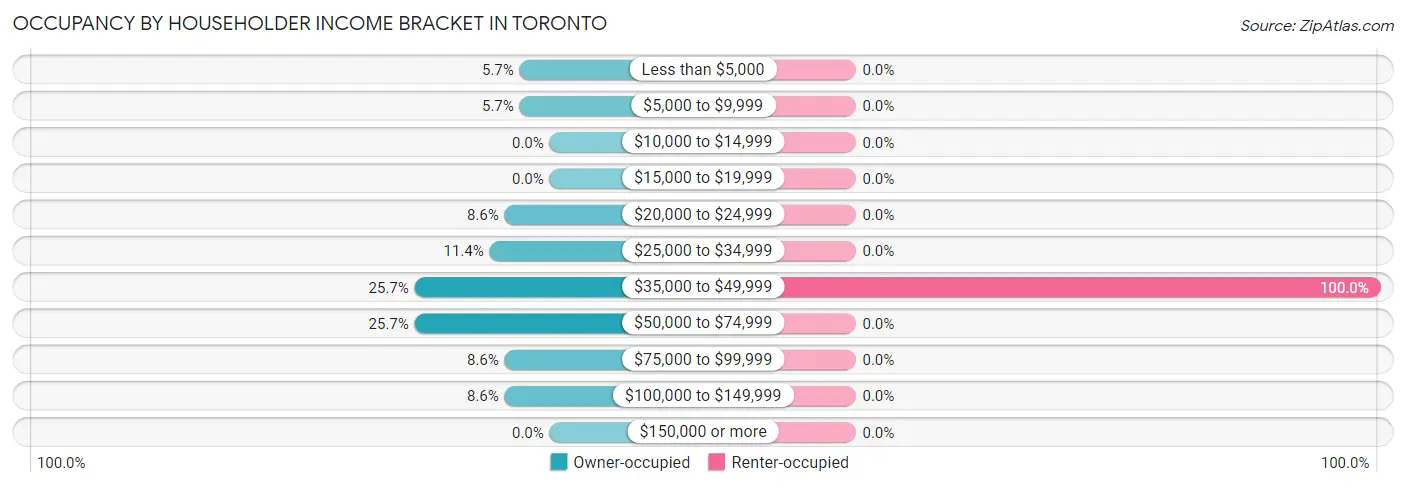
| Income Bracket | Owner-occupied | Renter-occupied |
| Less than $5,000 | 2 (5.7%) | 0 (0.0%) |
| $5,000 to $9,999 | 2 (5.7%) | 0 (0.0%) |
| $10,000 to $14,999 | 0 (0.0%) | 0 (0.0%) |
| $15,000 to $19,999 | 0 (0.0%) | 0 (0.0%) |
| $20,000 to $24,999 | 3 (8.6%) | 0 (0.0%) |
| $25,000 to $34,999 | 4 (11.4%) | 0 (0.0%) |
| $35,000 to $49,999 | 9 (25.7%) | 4 (100.0%) |
| $50,000 to $74,999 | 9 (25.7%) | 0 (0.0%) |
| $75,000 to $99,999 | 3 (8.6%) | 0 (0.0%) |
| $100,000 to $149,999 | 3 (8.6%) | 0 (0.0%) |
| $150,000 or more | 0 (0.0%) | 0 (0.0%) |
| Total | 35 (100.0%) | 4 (100.0%) |
Monthly Housing Cost Tiers in Toronto
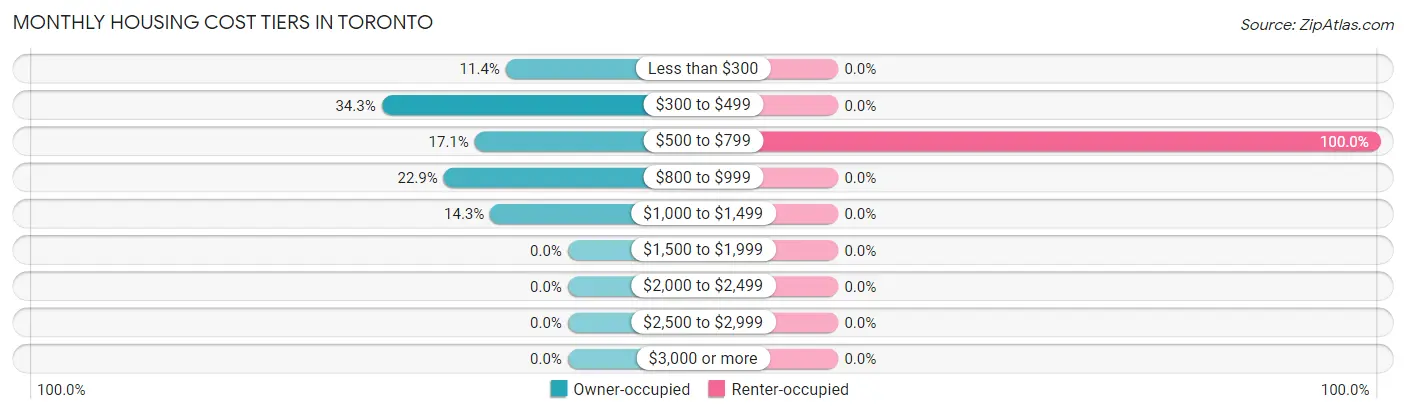
| Monthly Cost | Owner-occupied | Renter-occupied |
| Less than $300 | 4 (11.4%) | 0 (0.0%) |
| $300 to $499 | 12 (34.3%) | 0 (0.0%) |
| $500 to $799 | 6 (17.1%) | 4 (100.0%) |
| $800 to $999 | 8 (22.9%) | 0 (0.0%) |
| $1,000 to $1,499 | 5 (14.3%) | 0 (0.0%) |
| $1,500 to $1,999 | 0 (0.0%) | 0 (0.0%) |
| $2,000 to $2,499 | 0 (0.0%) | 0 (0.0%) |
| $2,500 to $2,999 | 0 (0.0%) | 0 (0.0%) |
| $3,000 or more | 0 (0.0%) | 0 (0.0%) |
| Total | 35 (100.0%) | 4 (100.0%) |
Physical Housing Characteristics in Toronto
Housing Structures in Toronto
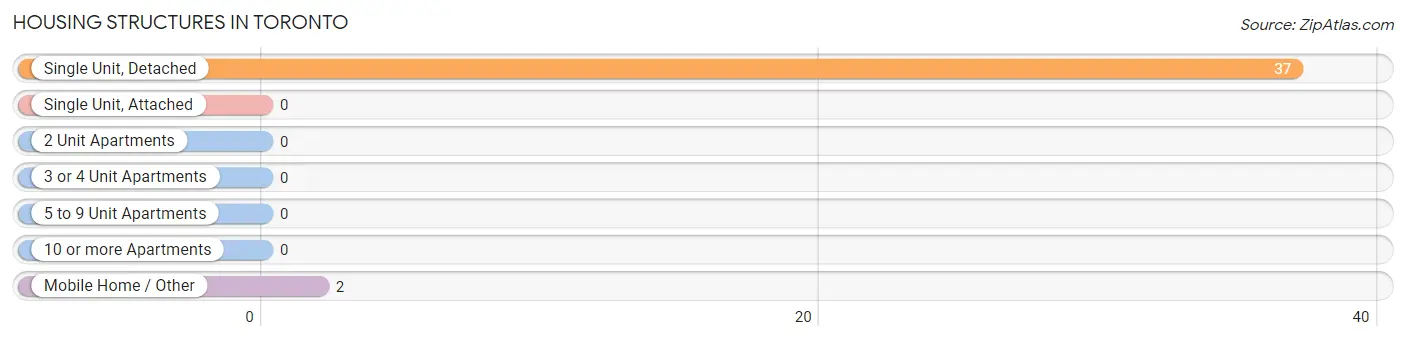
| Structure Type | # Housing Units | % Housing Units |
| Single Unit, Detached | 37 | 94.9% |
| Single Unit, Attached | 0 | 0.0% |
| 2 Unit Apartments | 0 | 0.0% |
| 3 or 4 Unit Apartments | 0 | 0.0% |
| 5 to 9 Unit Apartments | 0 | 0.0% |
| 10 or more Apartments | 0 | 0.0% |
| Mobile Home / Other | 2 | 5.1% |
| Total | 39 | 100.0% |
Housing Structures by Occupancy in Toronto
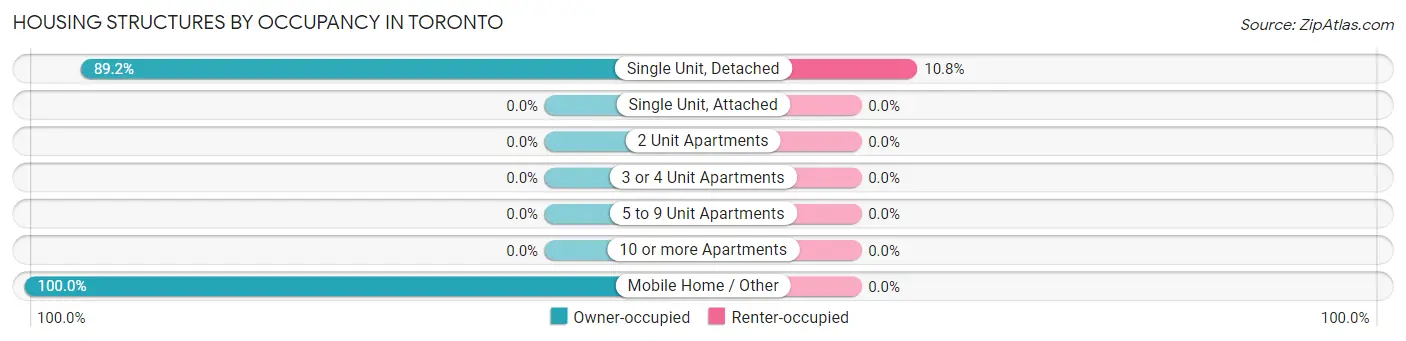
| Structure Type | Owner-occupied | Renter-occupied |
| Single Unit, Detached | 33 (89.2%) | 4 (10.8%) |
| Single Unit, Attached | 0 (0.0%) | 0 (0.0%) |
| 2 Unit Apartments | 0 (0.0%) | 0 (0.0%) |
| 3 or 4 Unit Apartments | 0 (0.0%) | 0 (0.0%) |
| 5 to 9 Unit Apartments | 0 (0.0%) | 0 (0.0%) |
| 10 or more Apartments | 0 (0.0%) | 0 (0.0%) |
| Mobile Home / Other | 2 (100.0%) | 0 (0.0%) |
| Total | 35 (89.7%) | 4 (10.3%) |
Housing Structures by Number of Rooms in Toronto
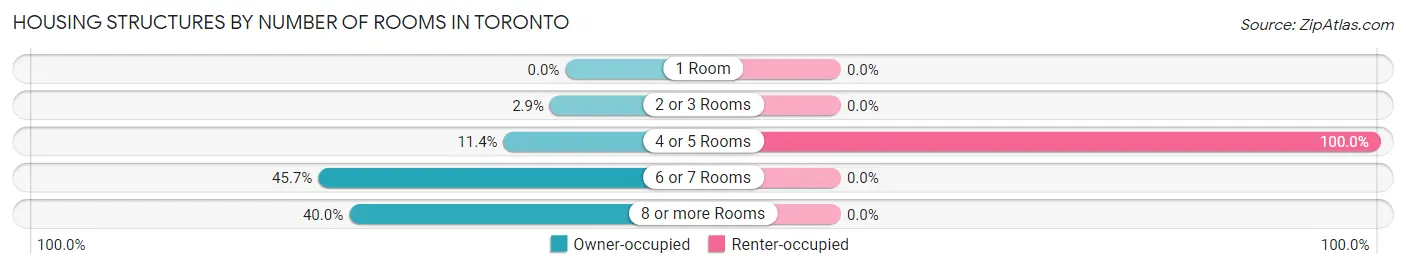
| Number of Rooms | Owner-occupied | Renter-occupied |
| 1 Room | 0 (0.0%) | 0 (0.0%) |
| 2 or 3 Rooms | 1 (2.9%) | 0 (0.0%) |
| 4 or 5 Rooms | 4 (11.4%) | 4 (100.0%) |
| 6 or 7 Rooms | 16 (45.7%) | 0 (0.0%) |
| 8 or more Rooms | 14 (40.0%) | 0 (0.0%) |
| Total | 35 (100.0%) | 4 (100.0%) |
Housing Structure by Heating Type in Toronto
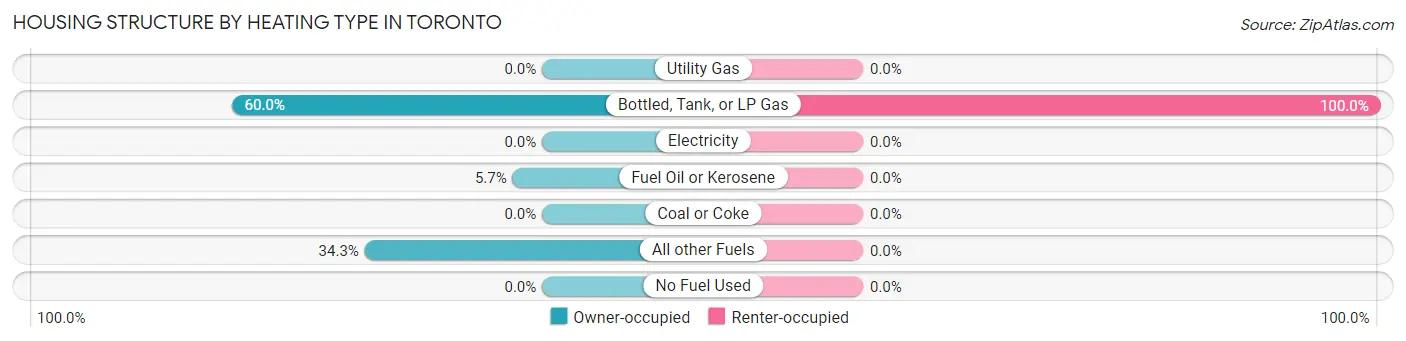
| Heating Type | Owner-occupied | Renter-occupied |
| Utility Gas | 0 (0.0%) | 0 (0.0%) |
| Bottled, Tank, or LP Gas | 21 (60.0%) | 4 (100.0%) |
| Electricity | 0 (0.0%) | 0 (0.0%) |
| Fuel Oil or Kerosene | 2 (5.7%) | 0 (0.0%) |
| Coal or Coke | 0 (0.0%) | 0 (0.0%) |
| All other Fuels | 12 (34.3%) | 0 (0.0%) |
| No Fuel Used | 0 (0.0%) | 0 (0.0%) |
| Total | 35 (100.0%) | 4 (100.0%) |
Household Vehicle Usage in Toronto
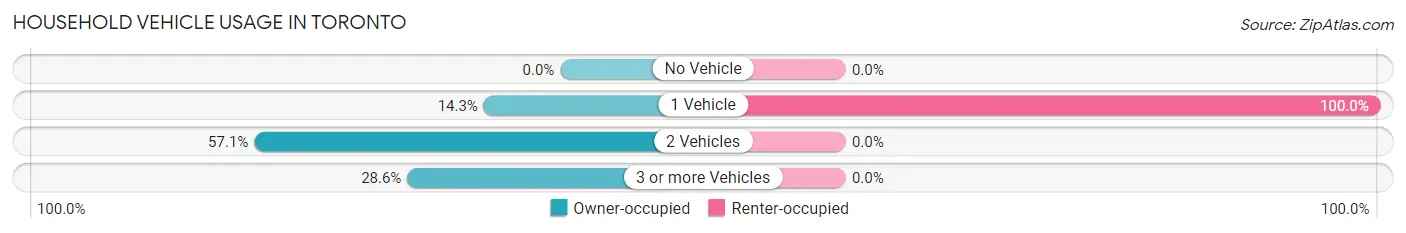
| Vehicles per Household | Owner-occupied | Renter-occupied |
| No Vehicle | 0 (0.0%) | 0 (0.0%) |
| 1 Vehicle | 5 (14.3%) | 4 (100.0%) |
| 2 Vehicles | 20 (57.1%) | 0 (0.0%) |
| 3 or more Vehicles | 10 (28.6%) | 0 (0.0%) |
| Total | 35 (100.0%) | 4 (100.0%) |
Real Estate & Mortgages in Toronto
Real Estate and Mortgage Overview in Toronto
| Characteristic | Without Mortgage | With Mortgage |
| Housing Units | 19 | 16 |
| Median Property Value | $75,000 | $0 |
| Median Household Income | $56,875 | $0 |
| Monthly Housing Costs | $408 | $0 |
| Real Estate Taxes | $700 | $0 |
Property Value by Mortgage Status in Toronto
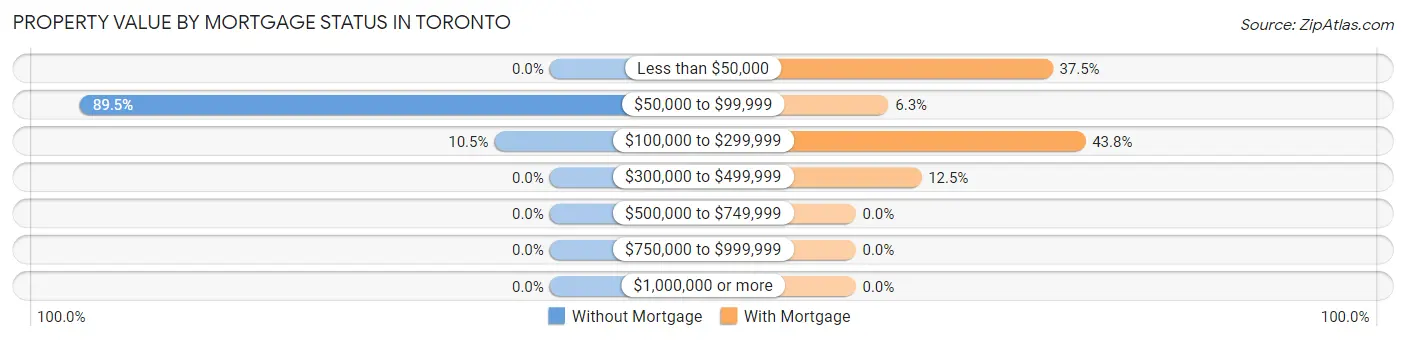
| Property Value | Without Mortgage | With Mortgage |
| Less than $50,000 | 0 (0.0%) | 6 (37.5%) |
| $50,000 to $99,999 | 17 (89.5%) | 1 (6.2%) |
| $100,000 to $299,999 | 2 (10.5%) | 7 (43.8%) |
| $300,000 to $499,999 | 0 (0.0%) | 2 (12.5%) |
| $500,000 to $749,999 | 0 (0.0%) | 0 (0.0%) |
| $750,000 to $999,999 | 0 (0.0%) | 0 (0.0%) |
| $1,000,000 or more | 0 (0.0%) | 0 (0.0%) |
| Total | 19 (100.0%) | 16 (100.0%) |
Household Income by Mortgage Status in Toronto
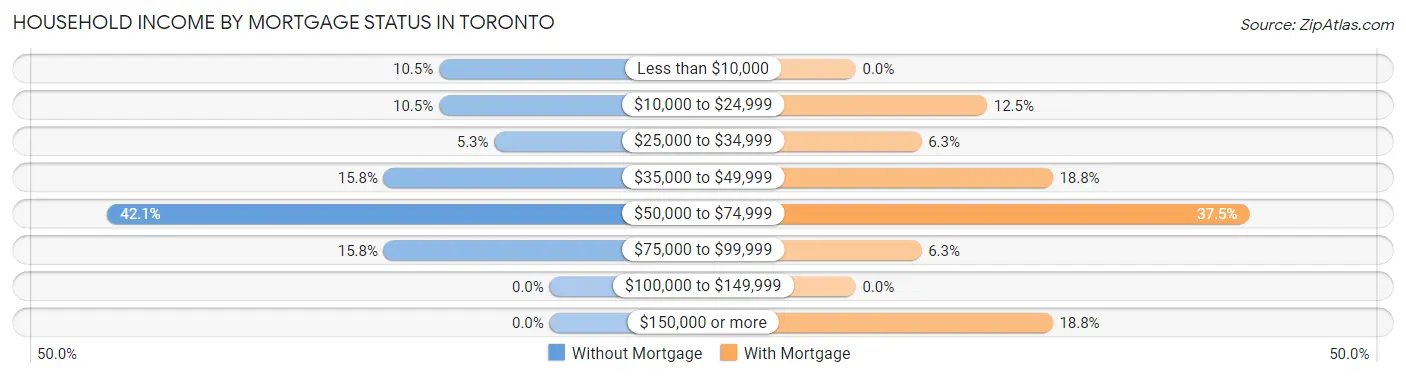
| Household Income | Without Mortgage | With Mortgage |
| Less than $10,000 | 2 (10.5%) | 0 (0.0%) |
| $10,000 to $24,999 | 2 (10.5%) | 2 (12.5%) |
| $25,000 to $34,999 | 1 (5.3%) | 1 (6.2%) |
| $35,000 to $49,999 | 3 (15.8%) | 3 (18.8%) |
| $50,000 to $74,999 | 8 (42.1%) | 6 (37.5%) |
| $75,000 to $99,999 | 3 (15.8%) | 1 (6.2%) |
| $100,000 to $149,999 | 0 (0.0%) | 0 (0.0%) |
| $150,000 or more | 0 (0.0%) | 3 (18.8%) |
| Total | 19 (100.0%) | 16 (100.0%) |
Property Value to Household Income Ratio in Toronto
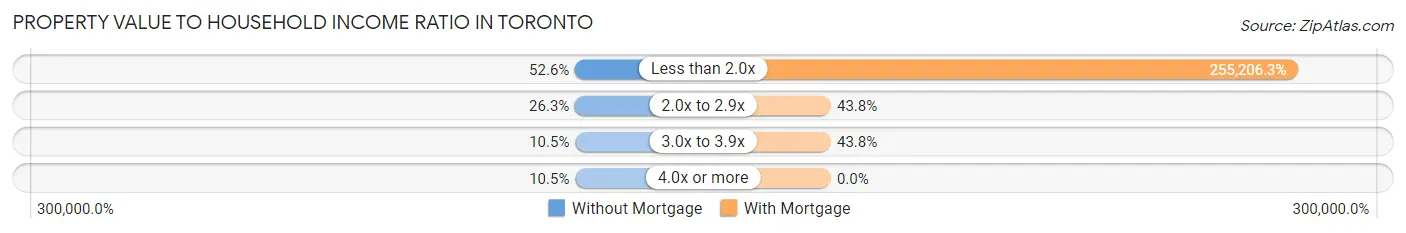
| Value-to-Income Ratio | Without Mortgage | With Mortgage |
| Less than 2.0x | 10 (52.6%) | 40,833 (255,206.2%) |
| 2.0x to 2.9x | 5 (26.3%) | 7 (43.8%) |
| 3.0x to 3.9x | 2 (10.5%) | 7 (43.8%) |
| 4.0x or more | 2 (10.5%) | 0 (0.0%) |
| Total | 19 (100.0%) | 16 (100.0%) |
Real Estate Taxes by Mortgage Status in Toronto
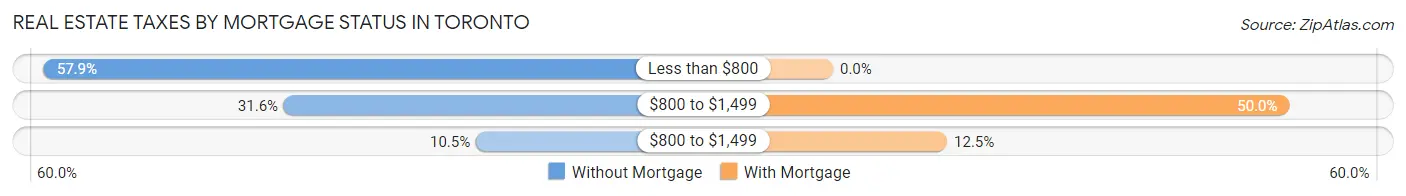
| Property Taxes | Without Mortgage | With Mortgage |
| Less than $800 | 11 (57.9%) | 0 (0.0%) |
| $800 to $1,499 | 6 (31.6%) | 8 (50.0%) |
| $800 to $1,499 | 2 (10.5%) | 2 (12.5%) |
| Total | 19 (100.0%) | 16 (100.0%) |
Health & Disability in Toronto
Health Insurance Coverage by Age in Toronto
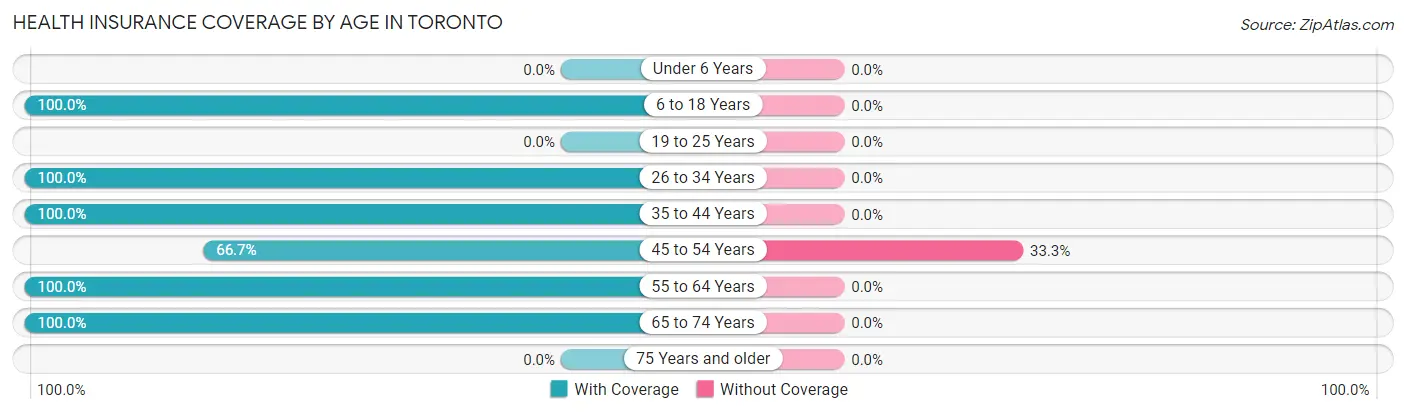
| Age Bracket | With Coverage | Without Coverage |
| Under 6 Years | 0 (0.0%) | 0 (0.0%) |
| 6 to 18 Years | 6 (100.0%) | 0 (0.0%) |
| 19 to 25 Years | 0 (0.0%) | 0 (0.0%) |
| 26 to 34 Years | 5 (100.0%) | 0 (0.0%) |
| 35 to 44 Years | 4 (100.0%) | 0 (0.0%) |
| 45 to 54 Years | 12 (66.7%) | 6 (33.3%) |
| 55 to 64 Years | 13 (100.0%) | 0 (0.0%) |
| 65 to 74 Years | 30 (100.0%) | 0 (0.0%) |
| 75 Years and older | 0 (0.0%) | 0 (0.0%) |
| Total | 70 (92.1%) | 6 (7.9%) |
Health Insurance Coverage by Citizenship Status in Toronto
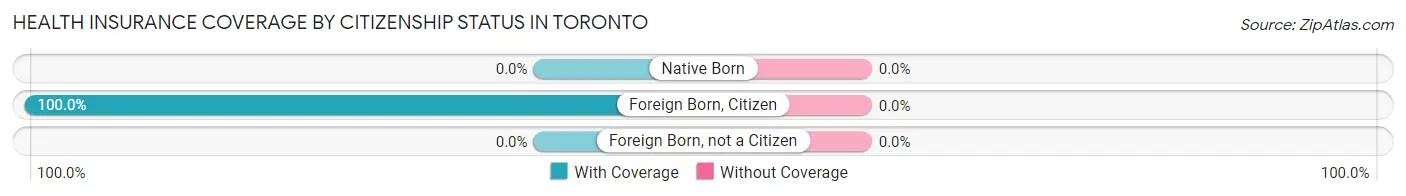
| Citizenship Status | With Coverage | Without Coverage |
| Native Born | 0 (0.0%) | 0 (0.0%) |
| Foreign Born, Citizen | 6 (100.0%) | 0 (0.0%) |
| Foreign Born, not a Citizen | 0 (0.0%) | 0 (0.0%) |
Health Insurance Coverage by Household Income in Toronto
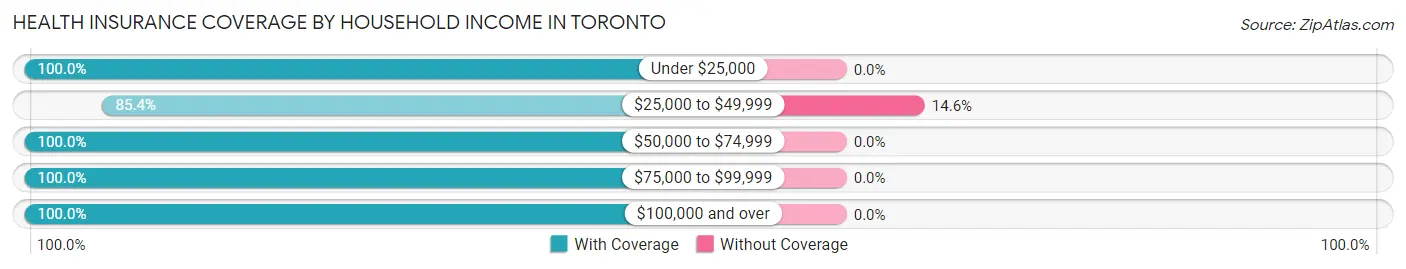
| Household Income | With Coverage | Without Coverage |
| Under $25,000 | 8 (100.0%) | 0 (0.0%) |
| $25,000 to $49,999 | 35 (85.4%) | 6 (14.6%) |
| $50,000 to $74,999 | 17 (100.0%) | 0 (0.0%) |
| $75,000 to $99,999 | 4 (100.0%) | 0 (0.0%) |
| $100,000 and over | 6 (100.0%) | 0 (0.0%) |
Public vs Private Health Insurance Coverage by Age in Toronto
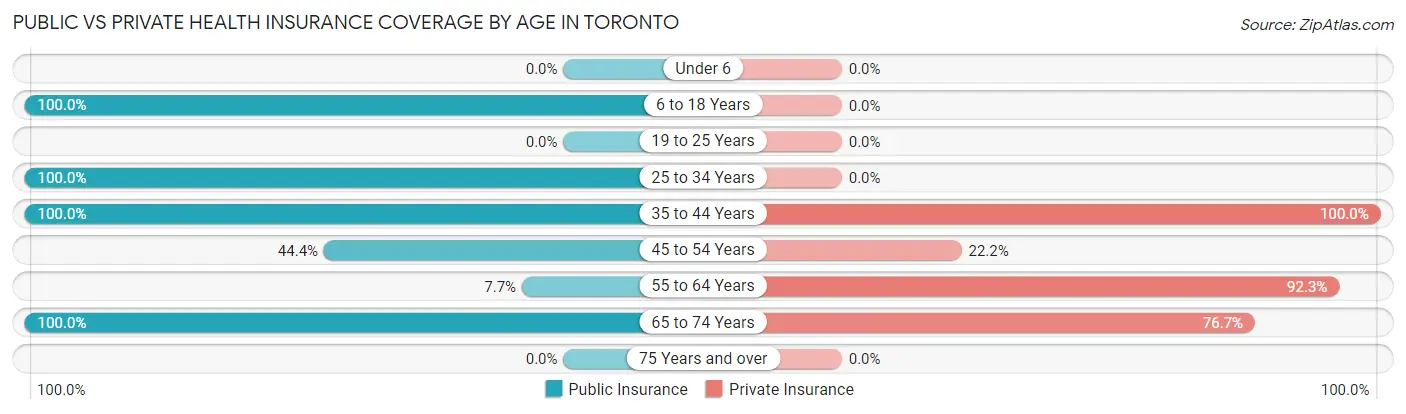
| Age Bracket | Public Insurance | Private Insurance |
| Under 6 | 0 (0.0%) | 0 (0.0%) |
| 6 to 18 Years | 6 (100.0%) | 0 (0.0%) |
| 19 to 25 Years | 0 (0.0%) | 0 (0.0%) |
| 25 to 34 Years | 5 (100.0%) | 0 (0.0%) |
| 35 to 44 Years | 4 (100.0%) | 4 (100.0%) |
| 45 to 54 Years | 8 (44.4%) | 4 (22.2%) |
| 55 to 64 Years | 1 (7.7%) | 12 (92.3%) |
| 65 to 74 Years | 30 (100.0%) | 23 (76.7%) |
| 75 Years and over | 0 (0.0%) | 0 (0.0%) |
| Total | 54 (71.1%) | 43 (56.6%) |
Disability Status by Sex by Age in Toronto
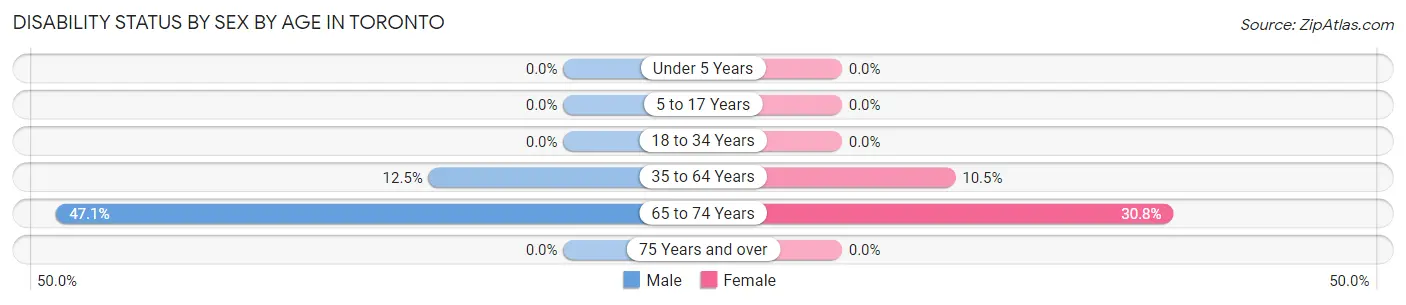
| Age Bracket | Male | Female |
| Under 5 Years | 0 (0.0%) | 0 (0.0%) |
| 5 to 17 Years | 0 (0.0%) | 0 (0.0%) |
| 18 to 34 Years | 0 (0.0%) | 0 (0.0%) |
| 35 to 64 Years | 2 (12.5%) | 2 (10.5%) |
| 65 to 74 Years | 8 (47.1%) | 4 (30.8%) |
| 75 Years and over | 0 (0.0%) | 0 (0.0%) |
Disability Class by Sex by Age in Toronto
Disability Class: Hearing Difficulty
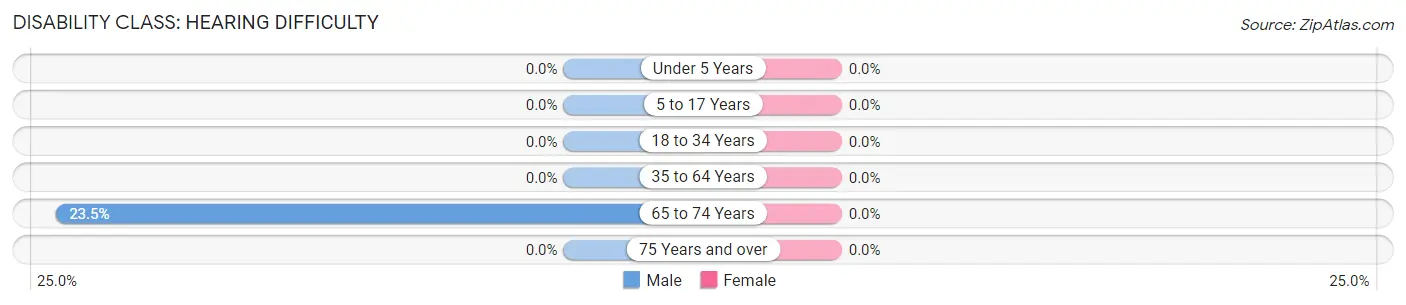
| Age Bracket | Male | Female |
| Under 5 Years | 0 (0.0%) | 0 (0.0%) |
| 5 to 17 Years | 0 (0.0%) | 0 (0.0%) |
| 18 to 34 Years | 0 (0.0%) | 0 (0.0%) |
| 35 to 64 Years | 0 (0.0%) | 0 (0.0%) |
| 65 to 74 Years | 4 (23.5%) | 0 (0.0%) |
| 75 Years and over | 0 (0.0%) | 0 (0.0%) |
Disability Class: Vision Difficulty
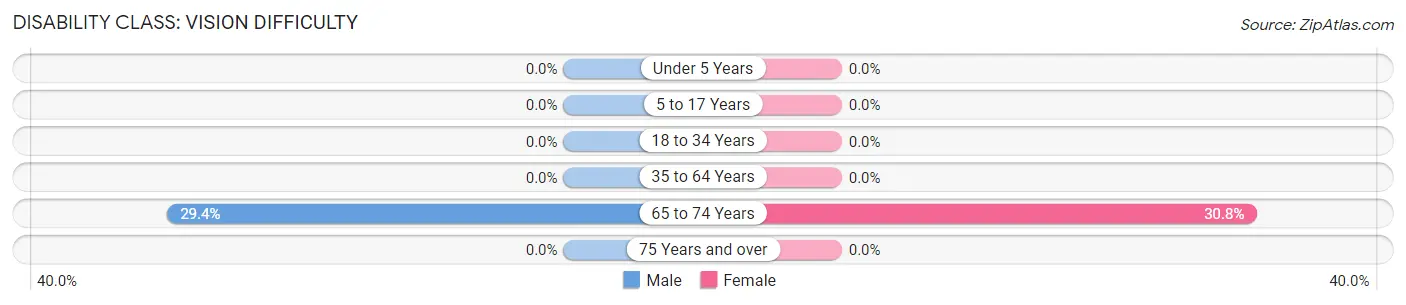
| Age Bracket | Male | Female |
| Under 5 Years | 0 (0.0%) | 0 (0.0%) |
| 5 to 17 Years | 0 (0.0%) | 0 (0.0%) |
| 18 to 34 Years | 0 (0.0%) | 0 (0.0%) |
| 35 to 64 Years | 0 (0.0%) | 0 (0.0%) |
| 65 to 74 Years | 5 (29.4%) | 4 (30.8%) |
| 75 Years and over | 0 (0.0%) | 0 (0.0%) |
Disability Class: Cognitive Difficulty
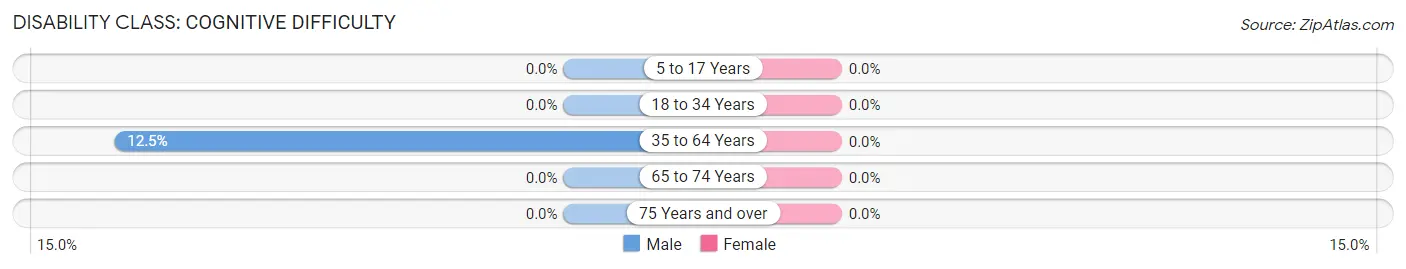
| Age Bracket | Male | Female |
| 5 to 17 Years | 0 (0.0%) | 0 (0.0%) |
| 18 to 34 Years | 0 (0.0%) | 0 (0.0%) |
| 35 to 64 Years | 2 (12.5%) | 0 (0.0%) |
| 65 to 74 Years | 0 (0.0%) | 0 (0.0%) |
| 75 Years and over | 0 (0.0%) | 0 (0.0%) |
Disability Class: Ambulatory Difficulty
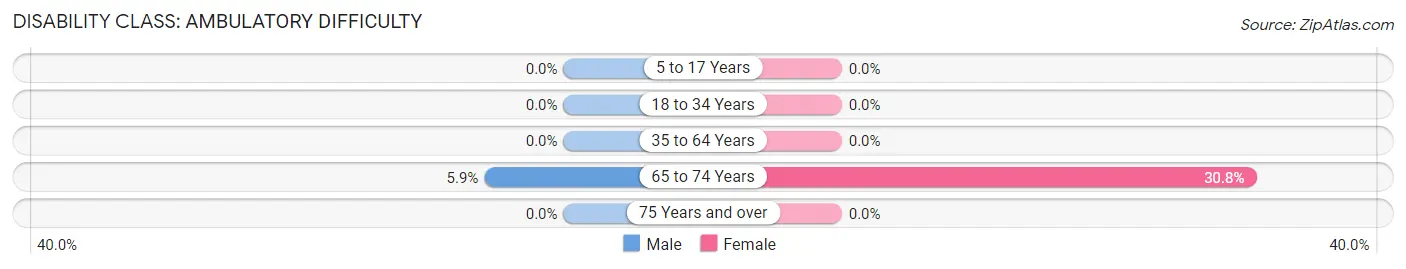
| Age Bracket | Male | Female |
| 5 to 17 Years | 0 (0.0%) | 0 (0.0%) |
| 18 to 34 Years | 0 (0.0%) | 0 (0.0%) |
| 35 to 64 Years | 0 (0.0%) | 0 (0.0%) |
| 65 to 74 Years | 1 (5.9%) | 4 (30.8%) |
| 75 Years and over | 0 (0.0%) | 0 (0.0%) |
Disability Class: Self-Care Difficulty
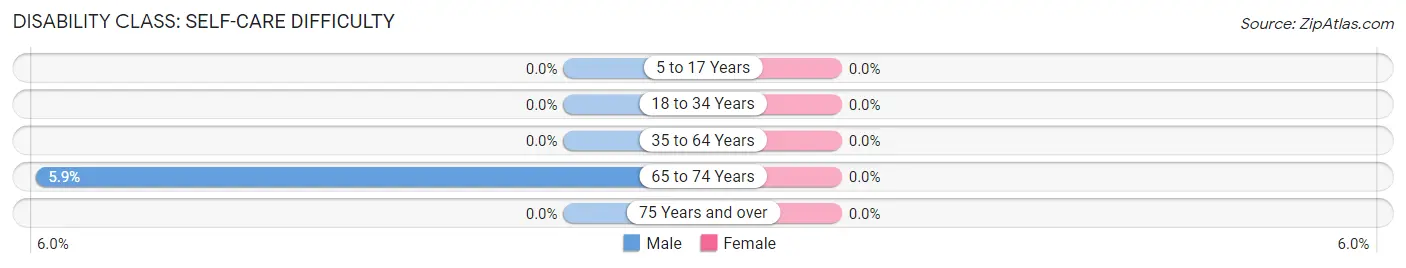
| Age Bracket | Male | Female |
| 5 to 17 Years | 0 (0.0%) | 0 (0.0%) |
| 18 to 34 Years | 0 (0.0%) | 0 (0.0%) |
| 35 to 64 Years | 0 (0.0%) | 0 (0.0%) |
| 65 to 74 Years | 1 (5.9%) | 0 (0.0%) |
| 75 Years and over | 0 (0.0%) | 0 (0.0%) |
Technology Access in Toronto
Computing Device Access in Toronto
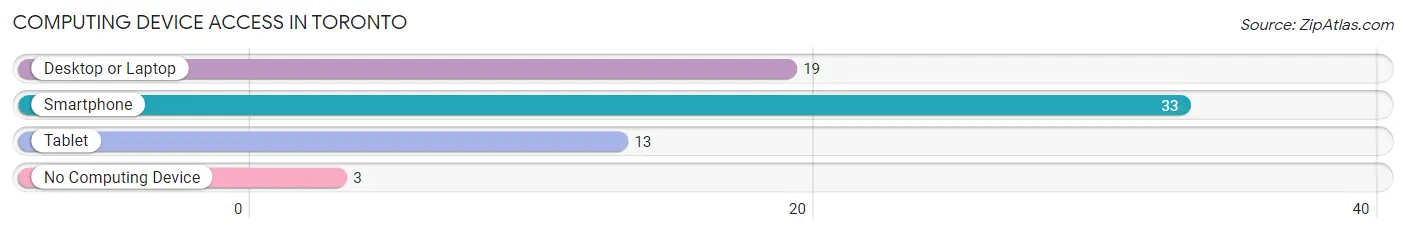
| Device Type | # Households | % Households |
| Desktop or Laptop | 19 | 48.7% |
| Smartphone | 33 | 84.6% |
| Tablet | 13 | 33.3% |
| No Computing Device | 3 | 7.7% |
| Total | 39 | 100.0% |
Internet Access in Toronto
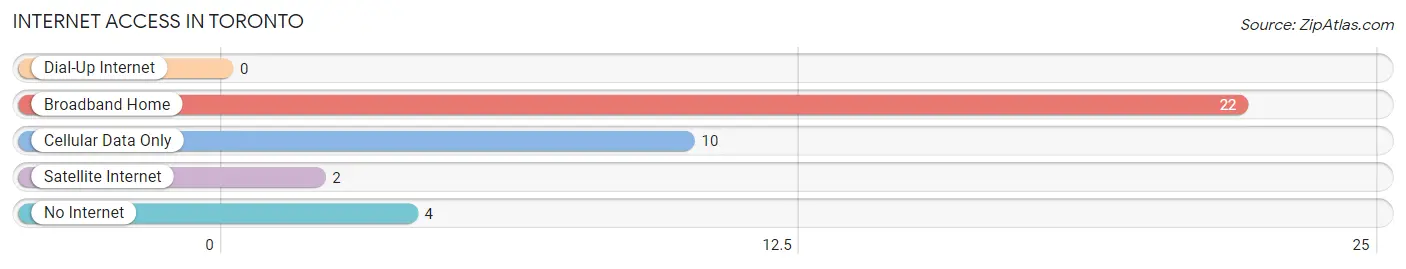
| Internet Type | # Households | % Households |
| Dial-Up Internet | 0 | 0.0% |
| Broadband Home | 22 | 56.4% |
| Cellular Data Only | 10 | 25.6% |
| Satellite Internet | 2 | 5.1% |
| No Internet | 4 | 10.3% |
| Total | 39 | 100.0% |
Toronto Summary
Toronto is the largest city in Canada and the provincial capital of Ontario. It is located in the south-central part of the province, on the northwestern shore of Lake Ontario. With a population of 2.7 million people in 2016, it is the fourth-largest city in North America. Toronto is a global city, and is an international centre of business, finance, arts, and culture. It is recognized as one of the most multicultural and cosmopolitan cities in the world.
History
The history of Toronto dates back to the late 17th century, when the area was first inhabited by the Iroquois. The city was founded in 1793 by John Graves Simcoe, the first Lieutenant Governor of Upper Canada. The city was named after the British port city of York, which was renamed Toronto in 1834.
In the 19th century, Toronto grew rapidly as an important centre of commerce and industry. It became the capital of the Province of Canada in 1867, and was the site of the first Canadian Parliament. In the early 20th century, Toronto experienced a period of rapid growth and industrialization, and became a major centre of finance and manufacturing.
Geography
Toronto is located in the south-central part of Ontario, on the northwestern shore of Lake Ontario. It is bordered by the cities of Mississauga to the west, Brampton to the north, and Markham to the east. The city is divided into four major regions: Downtown Toronto, East Toronto, North York, and Scarborough.
The city has a total area of 630 square kilometres, and is situated at an elevation of 76 metres above sea level. The climate is humid continental, with warm summers and cold winters.
Economy
Toronto is a major centre of finance, business, and commerce in Canada. It is home to the Toronto Stock Exchange, the largest stock exchange in Canada, and the headquarters of the five largest banks in the country. The city is also a major centre of manufacturing, with a large automotive industry and a thriving technology sector.
Toronto is also a major centre of tourism, with over 25 million visitors each year. The city is home to a number of attractions, including the CN Tower, the Royal Ontario Museum, and the Toronto Zoo.
Demographics
As of 2016, the population of Toronto was 2.7 million people. The city is one of the most diverse in the world, with over half of the population being foreign-born. The largest ethnic groups are Chinese, South Asian, and Black.
The city is also home to a large number of immigrants, with over 200 different languages spoken in the city. The majority of the population is Christian, with the largest denominations being Roman Catholic and Protestant.
Conclusion
Toronto is a vibrant and diverse city, with a rich history and a thriving economy. It is a major centre of finance, business, and culture, and is home to a large and diverse population. Toronto is a global city, and is an important centre of commerce and industry in Canada.
Common Questions
What is Per Capita Income in Toronto?
Per Capita income in Toronto is $26,579.
What is the Median Household income in Toronto?
Median Household Income in Toronto is $41,250.
What is Income or Wage Gap in Toronto?
Income or Wage Gap in Toronto is 50.8%.
Women in Toronto earn 49.2 cents for every dollar earned by a man.
What is Inequality or Gini Index in Toronto?
Inequality or Gini Index in Toronto is 0.34.
What is the Total Population of Toronto?
Total Population of Toronto is 76.
What is the Total Male Population of Toronto?
Total Male Population of Toronto is 39.
What is the Total Female Population of Toronto?
Total Female Population of Toronto is 37.
What is the Ratio of Males per 100 Females in Toronto?
There are 105.41 Males per 100 Females in Toronto.
What is the Ratio of Females per 100 Males in Toronto?
There are 94.87 Females per 100 Males in Toronto.
What is the Median Population Age in Toronto?
Median Population Age in Toronto is 62.5 Years.
What is the Average Family Size in Toronto
Average Family Size in Toronto is 2.3 People.
What is the Average Household Size in Toronto
Average Household Size in Toronto is 1.9 People.
How Large is the Labor Force in Toronto?
There are 33 People in the Labor Forcein in Toronto.
What is the Percentage of People in the Labor Force in Toronto?
43.4% of People are in the Labor Force in Toronto.
What is the Unemployment Rate in Toronto?
Unemployment Rate in Toronto is 18.2%.