Villisca, IA Map & Demographics
Villisca Map
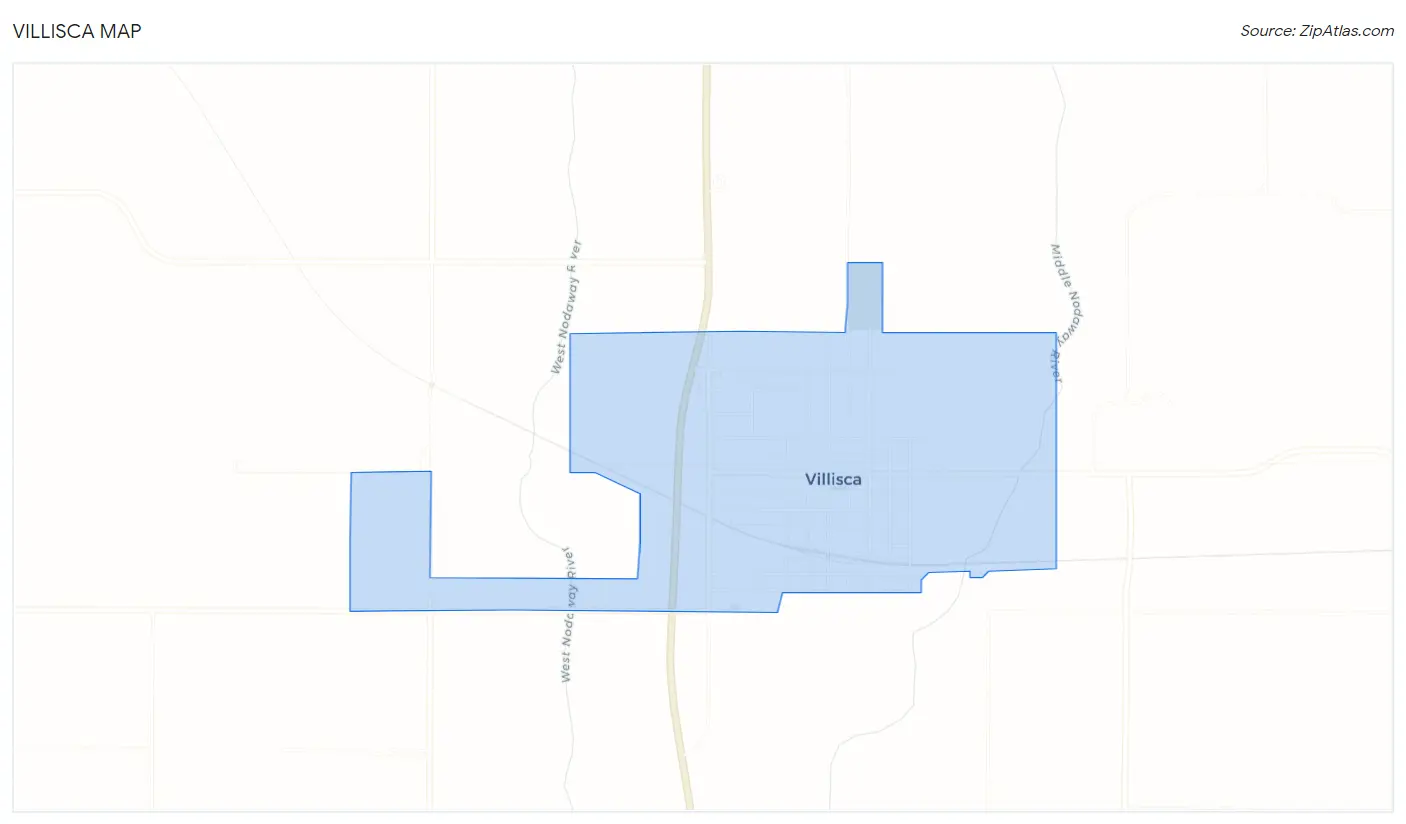
Villisca Overview
$28,535
PER CAPITA INCOME
$73,194
AVG FAMILY INCOME
$55,625
AVG HOUSEHOLD INCOME
43.7%
WAGE / INCOME GAP [ % ]
56.3¢/ $1
WAGE / INCOME GAP [ $ ]
0.39
INEQUALITY / GINI INDEX
1,071
TOTAL POPULATION
508
MALE POPULATION
563
FEMALE POPULATION
90.23
MALES / 100 FEMALES
110.83
FEMALES / 100 MALES
44.2
MEDIAN AGE
2.9
AVG FAMILY SIZE
2.1
AVG HOUSEHOLD SIZE
472
LABOR FORCE [ PEOPLE ]
56.6%
PERCENT IN LABOR FORCE
1.9%
UNEMPLOYMENT RATE
Villisca Zip Codes
Villisca Area Codes
Income in Villisca
Income Overview in Villisca
Per Capita Income in Villisca is $28,535, while median incomes of families and households are $73,194 and $55,625 respectively.
| Characteristic | Number | Measure |
| Per Capita Income | 1,071 | $28,535 |
| Median Family Income | 251 | $73,194 |
| Mean Family Income | 251 | $74,263 |
| Median Household Income | 498 | $55,625 |
| Mean Household Income | 498 | $59,744 |
| Income Deficit | 251 | $0 |
| Wage / Income Gap (%) | 1,071 | 43.68% |
| Wage / Income Gap ($) | 1,071 | 56.32¢ per $1 |
| Gini / Inequality Index | 1,071 | 0.39 |
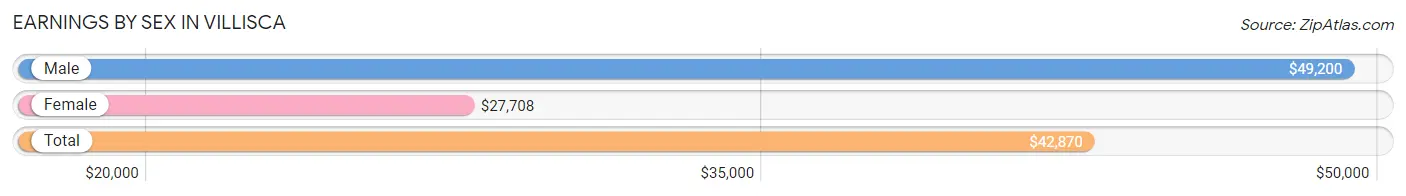
Earnings by Sex in Villisca
Average Earnings in Villisca are $42,870, $49,200 for men and $27,708 for women, a difference of 43.7%.
| Sex | Number | Average Earnings |
| Male | 268 (53.6%) | $49,200 |
| Female | 232 (46.4%) | $27,708 |
| Total | 500 (100.0%) | $42,870 |
Earnings by Sex by Income Bracket in Villisca
The most common earnings brackets in Villisca are $55,000 to $64,999 for men (67 | 25.0%) and $10,000 to $12,499 for women (29 | 12.5%).
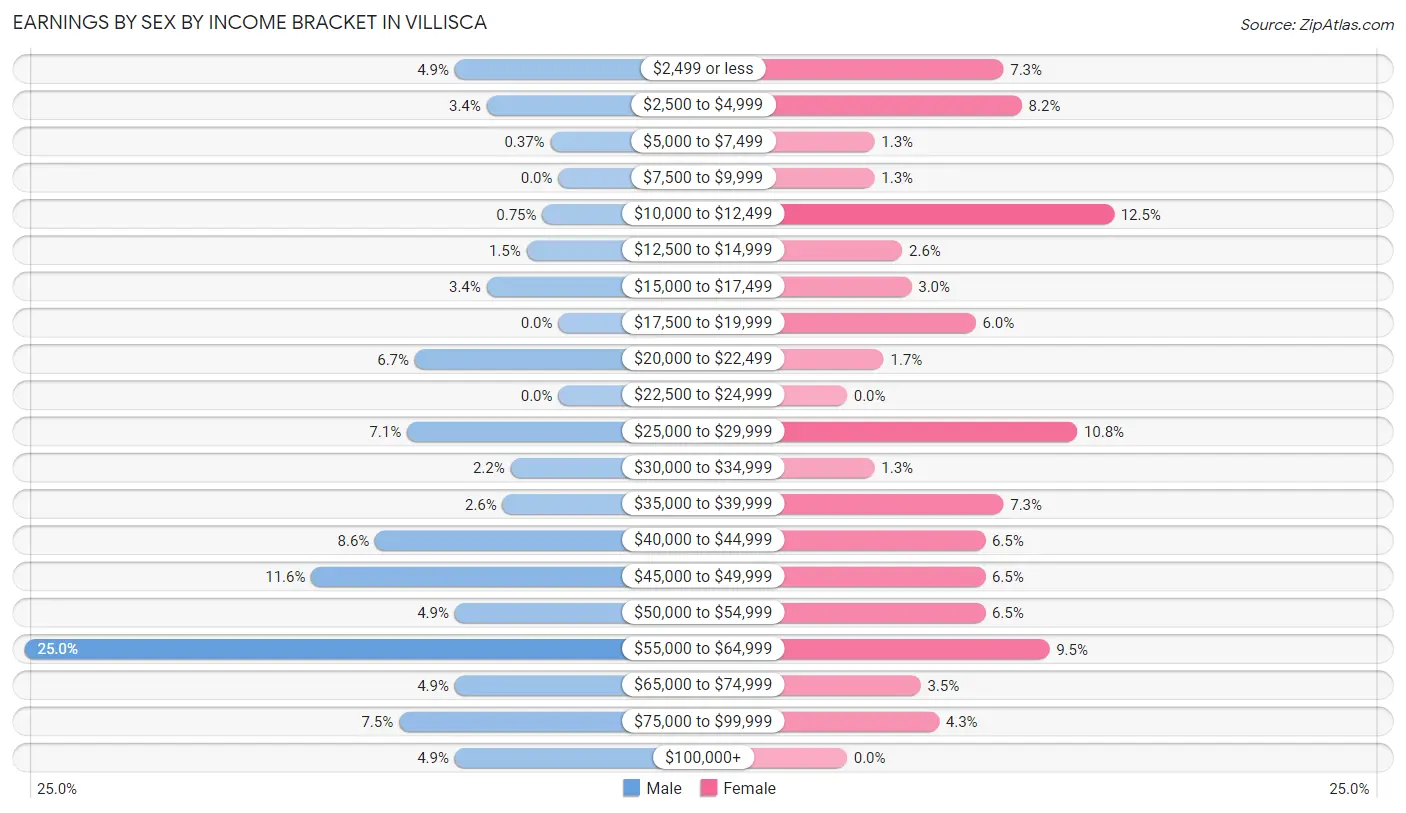
| Income | Male | Female |
| $2,499 or less | 13 (4.9%) | 17 (7.3%) |
| $2,500 to $4,999 | 9 (3.4%) | 19 (8.2%) |
| $5,000 to $7,499 | 1 (0.4%) | 3 (1.3%) |
| $7,500 to $9,999 | 0 (0.0%) | 3 (1.3%) |
| $10,000 to $12,499 | 2 (0.7%) | 29 (12.5%) |
| $12,500 to $14,999 | 4 (1.5%) | 6 (2.6%) |
| $15,000 to $17,499 | 9 (3.4%) | 7 (3.0%) |
| $17,500 to $19,999 | 0 (0.0%) | 14 (6.0%) |
| $20,000 to $22,499 | 18 (6.7%) | 4 (1.7%) |
| $22,500 to $24,999 | 0 (0.0%) | 0 (0.0%) |
| $25,000 to $29,999 | 19 (7.1%) | 25 (10.8%) |
| $30,000 to $34,999 | 6 (2.2%) | 3 (1.3%) |
| $35,000 to $39,999 | 7 (2.6%) | 17 (7.3%) |
| $40,000 to $44,999 | 23 (8.6%) | 15 (6.5%) |
| $45,000 to $49,999 | 31 (11.6%) | 15 (6.5%) |
| $50,000 to $54,999 | 13 (4.9%) | 15 (6.5%) |
| $55,000 to $64,999 | 67 (25.0%) | 22 (9.5%) |
| $65,000 to $74,999 | 13 (4.9%) | 8 (3.5%) |
| $75,000 to $99,999 | 20 (7.5%) | 10 (4.3%) |
| $100,000+ | 13 (4.9%) | 0 (0.0%) |
| Total | 268 (100.0%) | 232 (100.0%) |
Earnings by Sex by Educational Attainment in Villisca
Average earnings in Villisca are $48,100 for men and $28,333 for women, a difference of 41.1%. Men with an educational attainment of college or associate's degree enjoy the highest average annual earnings of $49,821, while those with high school diploma education earn the least with $45,250. Women with an educational attainment of bachelor's degree earn the most with the average annual earnings of $50,000, while those with college or associate's degree education have the smallest earnings of $26,125.
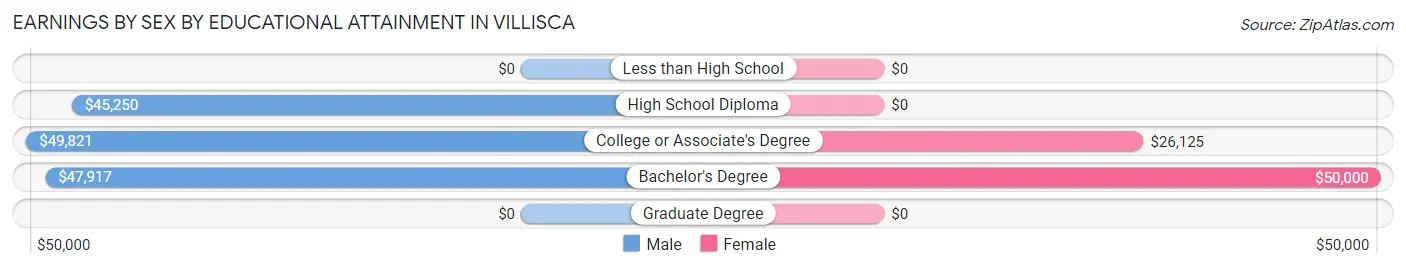
| Educational Attainment | Male Income | Female Income |
| Less than High School | - | - |
| High School Diploma | $45,250 | $0 |
| College or Associate's Degree | $49,821 | $26,125 |
| Bachelor's Degree | $47,917 | $50,000 |
| Graduate Degree | - | - |
| Total | $48,100 | $28,333 |
Family Income in Villisca
Family Income Brackets in Villisca
According to the Villisca family income data, there are 66 families falling into the $100,000 to $149,999 income range, which is the most common income bracket and makes up 26.3% of all families.
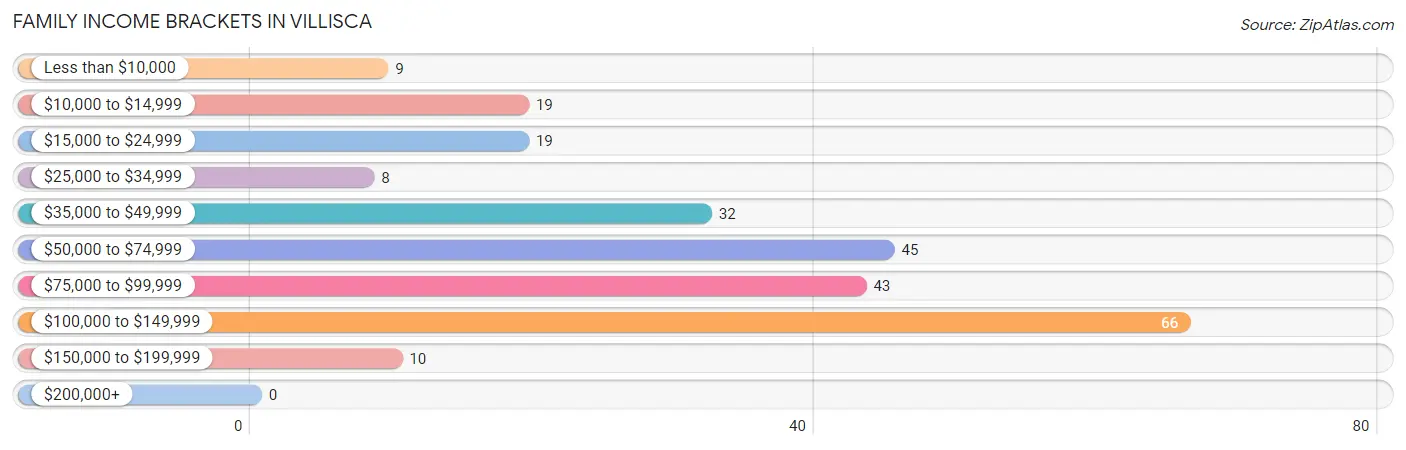
| Income Bracket | # Families | % Families |
| Less than $10,000 | 9 | 3.6% |
| $10,000 to $14,999 | 19 | 7.6% |
| $15,000 to $24,999 | 19 | 7.6% |
| $25,000 to $34,999 | 8 | 3.2% |
| $35,000 to $49,999 | 32 | 12.7% |
| $50,000 to $74,999 | 45 | 17.9% |
| $75,000 to $99,999 | 43 | 17.1% |
| $100,000 to $149,999 | 66 | 26.3% |
| $150,000 to $199,999 | 10 | 4.0% |
| $200,000+ | 0 | 0.0% |
Family Income by Famaliy Size in Villisca
5-person families (19 | 7.6%) account for the highest median family income in Villisca with $108,750 per family, while 2-person families (162 | 64.5%) have the highest median income of $37,500 per family member.
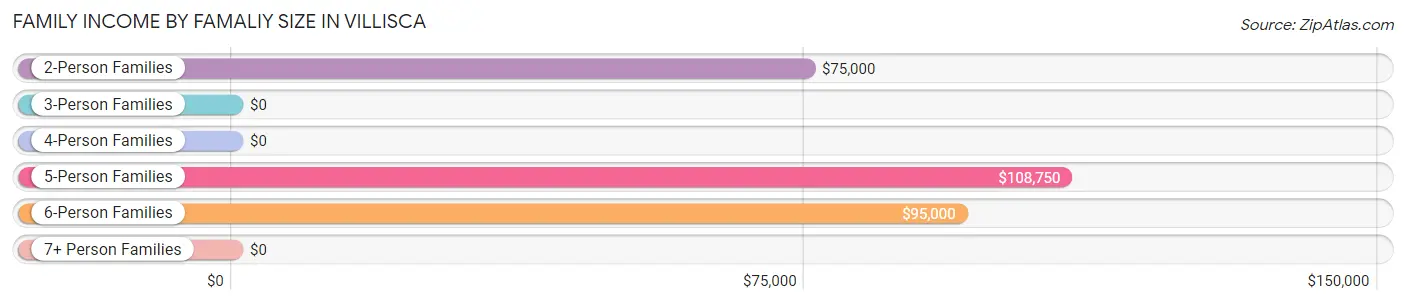
| Income Bracket | # Families | Median Income |
| 2-Person Families | 162 (64.5%) | $75,000 |
| 3-Person Families | 41 (16.3%) | $0 |
| 4-Person Families | 13 (5.2%) | $0 |
| 5-Person Families | 19 (7.6%) | $108,750 |
| 6-Person Families | 16 (6.4%) | $95,000 |
| 7+ Person Families | 0 (0.0%) | $0 |
| Total | 251 (100.0%) | $73,194 |
Family Income by Number of Earners in Villisca
The median family income in Villisca is $73,194, with families comprising 3+ earners (16) having the highest median family income of $111,667, while families with 1 earner (77) have the lowest median family income of $48,375, accounting for 6.4% and 30.7% of families, respectively.
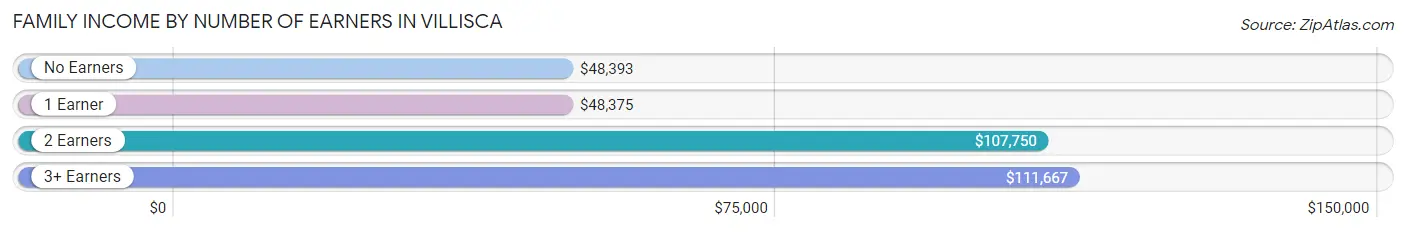
| Number of Earners | # Families | Median Income |
| No Earners | 59 (23.5%) | $48,393 |
| 1 Earner | 77 (30.7%) | $48,375 |
| 2 Earners | 99 (39.4%) | $107,750 |
| 3+ Earners | 16 (6.4%) | $111,667 |
| Total | 251 (100.0%) | $73,194 |
Household Income in Villisca
Household Income Brackets in Villisca
With 101 households falling in the category, the $50,000 to $74,999 income range is the most frequent in Villisca, accounting for 20.3% of all households.
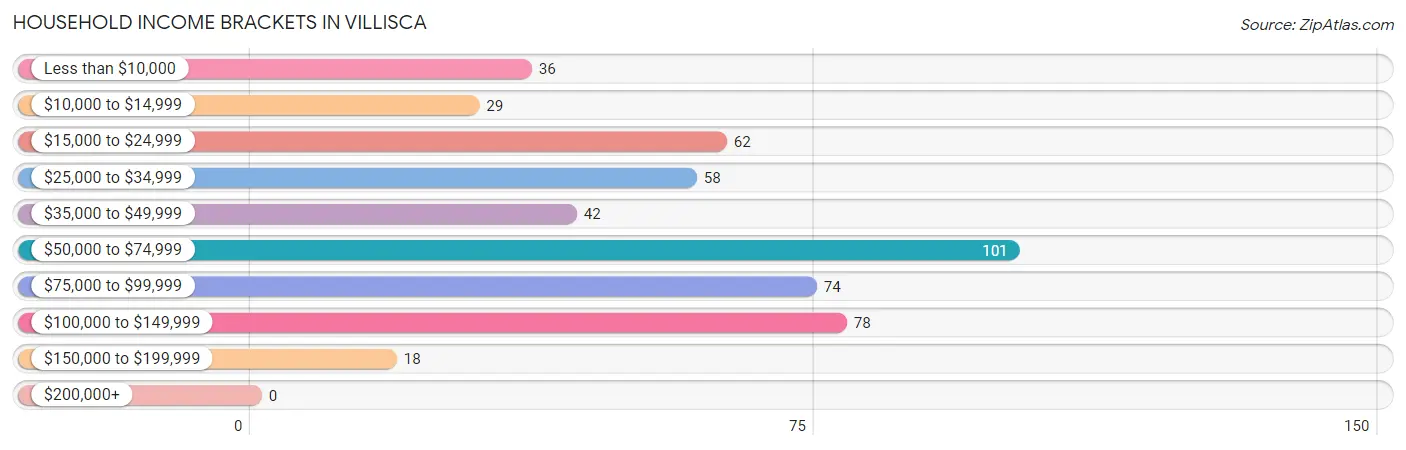
| Income Bracket | # Households | % Households |
| Less than $10,000 | 36 | 7.2% |
| $10,000 to $14,999 | 29 | 5.8% |
| $15,000 to $24,999 | 62 | 12.4% |
| $25,000 to $34,999 | 58 | 11.6% |
| $35,000 to $49,999 | 42 | 8.4% |
| $50,000 to $74,999 | 101 | 20.3% |
| $75,000 to $99,999 | 74 | 14.9% |
| $100,000 to $149,999 | 78 | 15.7% |
| $150,000 to $199,999 | 18 | 3.6% |
| $200,000+ | 0 | 0.0% |
Household Income by Householder Age in Villisca
The median household income in Villisca is $55,625, with the highest median household income of $67,404 found in the 45 to 64 years age bracket for the primary householder. A total of 133 households (26.7%) fall into this category. Meanwhile, the 65+ years age bracket for the primary householder has the lowest median household income of $39,554, with 187 households (37.6%) in this group.
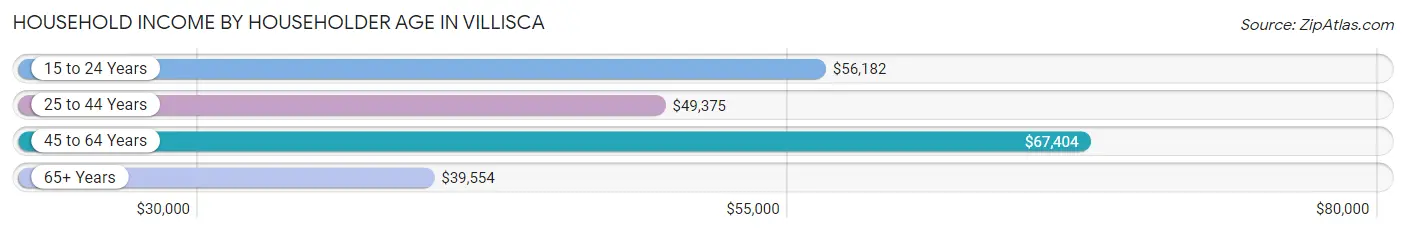
| Income Bracket | # Households | Median Income |
| 15 to 24 Years | 45 (9.0%) | $56,182 |
| 25 to 44 Years | 133 (26.7%) | $49,375 |
| 45 to 64 Years | 133 (26.7%) | $67,404 |
| 65+ Years | 187 (37.6%) | $39,554 |
| Total | 498 (100.0%) | $55,625 |
Poverty in Villisca
Income Below Poverty by Sex and Age in Villisca
With 19.8% poverty level for males and 26.8% for females among the residents of Villisca, 6 to 11 year old males and 15 year old females are the most vulnerable to poverty, with 13 males (56.5%) and 12 females (80.0%) in their respective age groups living below the poverty level.
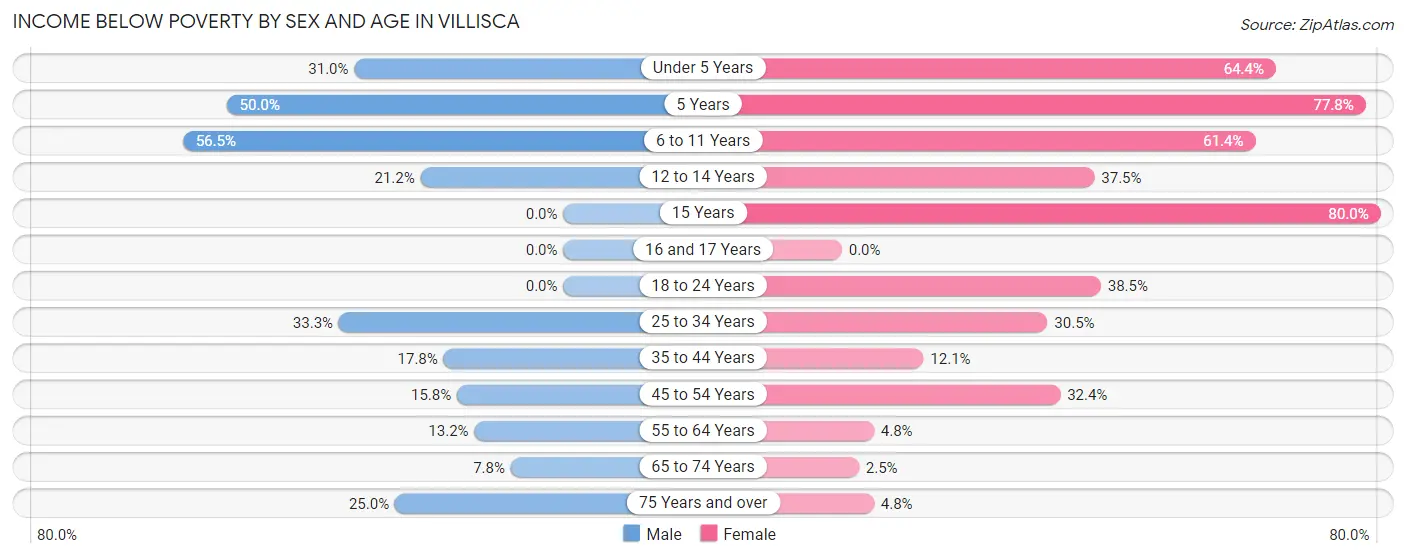
| Age Bracket | Male | Female |
| Under 5 Years | 9 (31.0%) | 29 (64.4%) |
| 5 Years | 6 (50.0%) | 7 (77.8%) |
| 6 to 11 Years | 13 (56.5%) | 35 (61.4%) |
| 12 to 14 Years | 7 (21.2%) | 3 (37.5%) |
| 15 Years | 0 (0.0%) | 12 (80.0%) |
| 16 and 17 Years | 0 (0.0%) | 0 (0.0%) |
| 18 to 24 Years | 0 (0.0%) | 5 (38.5%) |
| 25 to 34 Years | 21 (33.3%) | 29 (30.5%) |
| 35 to 44 Years | 8 (17.8%) | 4 (12.1%) |
| 45 to 54 Years | 9 (15.8%) | 12 (32.4%) |
| 55 to 64 Years | 7 (13.2%) | 4 (4.8%) |
| 65 to 74 Years | 5 (7.8%) | 2 (2.5%) |
| 75 Years and over | 12 (25.0%) | 3 (4.8%) |
| Total | 97 (19.8%) | 145 (26.8%) |
Income Above Poverty by Sex and Age in Villisca
According to the poverty statistics in Villisca, males aged 15 years and females aged 16 and 17 years are the age groups that are most secure financially, with 100.0% of males and 100.0% of females in these age groups living above the poverty line.
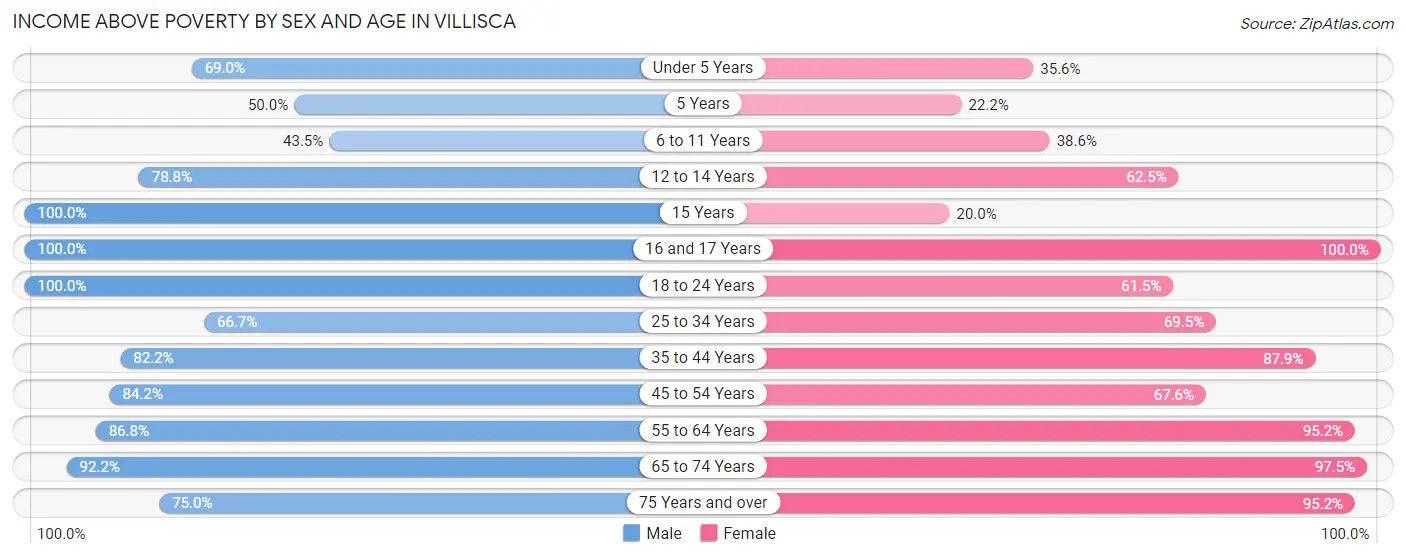
| Age Bracket | Male | Female |
| Under 5 Years | 20 (69.0%) | 16 (35.6%) |
| 5 Years | 6 (50.0%) | 2 (22.2%) |
| 6 to 11 Years | 10 (43.5%) | 22 (38.6%) |
| 12 to 14 Years | 26 (78.8%) | 5 (62.5%) |
| 15 Years | 6 (100.0%) | 3 (20.0%) |
| 16 and 17 Years | 5 (100.0%) | 3 (100.0%) |
| 18 to 24 Years | 53 (100.0%) | 8 (61.5%) |
| 25 to 34 Years | 42 (66.7%) | 66 (69.5%) |
| 35 to 44 Years | 37 (82.2%) | 29 (87.9%) |
| 45 to 54 Years | 48 (84.2%) | 25 (67.6%) |
| 55 to 64 Years | 46 (86.8%) | 80 (95.2%) |
| 65 to 74 Years | 59 (92.2%) | 77 (97.5%) |
| 75 Years and over | 36 (75.0%) | 60 (95.2%) |
| Total | 394 (80.2%) | 396 (73.2%) |
Income Below Poverty Among Married-Couple Families in Villisca
The poverty statistics for married-couple families in Villisca show that 3.6% or 6 of the total 165 families live below the poverty line. Families with 3 or 4 children have the highest poverty rate of 19.1%, comprising of 4 families. On the other hand, families with 1 or 2 children have the lowest poverty rate of 0.0%, which includes 0 families.
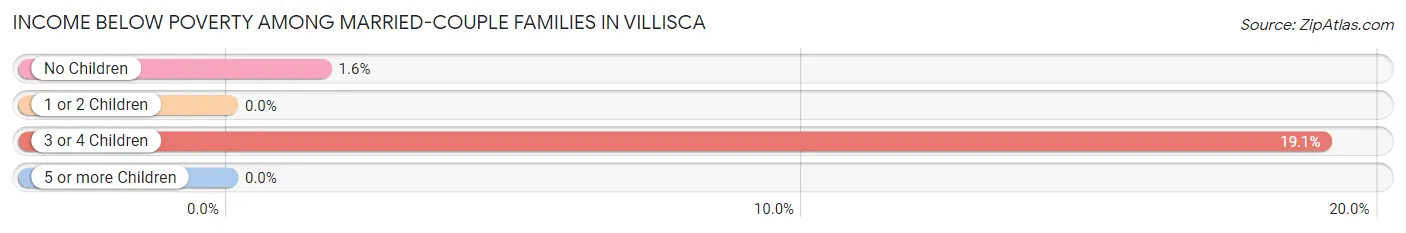
| Children | Above Poverty | Below Poverty |
| No Children | 121 (98.4%) | 2 (1.6%) |
| 1 or 2 Children | 21 (100.0%) | 0 (0.0%) |
| 3 or 4 Children | 17 (80.9%) | 4 (19.1%) |
| 5 or more Children | 0 (0.0%) | 0 (0.0%) |
| Total | 159 (96.4%) | 6 (3.6%) |
Income Below Poverty Among Single-Parent Households in Villisca
According to the poverty data in Villisca, 81.8% or 18 single-father households and 34.4% or 22 single-mother households are living below the poverty line. Among single-father households, those with no children have the highest poverty rate, with 6 households (100.0%) experiencing poverty. Likewise, among single-mother households, those with 3 or 4 children have the highest poverty rate, with 5 households (100.0%) falling below the poverty line.
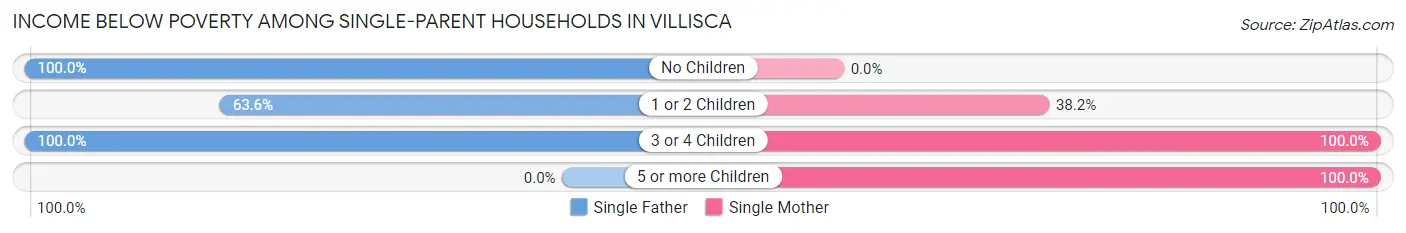
| Children | Single Father | Single Mother |
| No Children | 6 (100.0%) | 0 (0.0%) |
| 1 or 2 Children | 7 (63.6%) | 13 (38.2%) |
| 3 or 4 Children | 5 (100.0%) | 5 (100.0%) |
| 5 or more Children | 0 (0.0%) | 4 (100.0%) |
| Total | 18 (81.8%) | 22 (34.4%) |
Income Below Poverty Among Married-Couple vs Single-Parent Households in Villisca
The poverty data for Villisca shows that 6 of the married-couple family households (3.6%) and 40 of the single-parent households (46.5%) are living below the poverty level. Within the married-couple family households, those with 3 or 4 children have the highest poverty rate, with 4 households (19.1%) falling below the poverty line. Among the single-parent households, those with 3 or 4 children have the highest poverty rate, with 10 household (100.0%) living below poverty.

| Children | Married-Couple Families | Single-Parent Households |
| No Children | 2 (1.6%) | 6 (22.2%) |
| 1 or 2 Children | 0 (0.0%) | 20 (44.4%) |
| 3 or 4 Children | 4 (19.1%) | 10 (100.0%) |
| 5 or more Children | 0 (0.0%) | 4 (100.0%) |
| Total | 6 (3.6%) | 40 (46.5%) |
Race in Villisca
The most populous races in Villisca are White / Caucasian (969 | 90.5%), Two or more Races (85 | 7.9%), and Hispanic or Latino (32 | 3.0%).
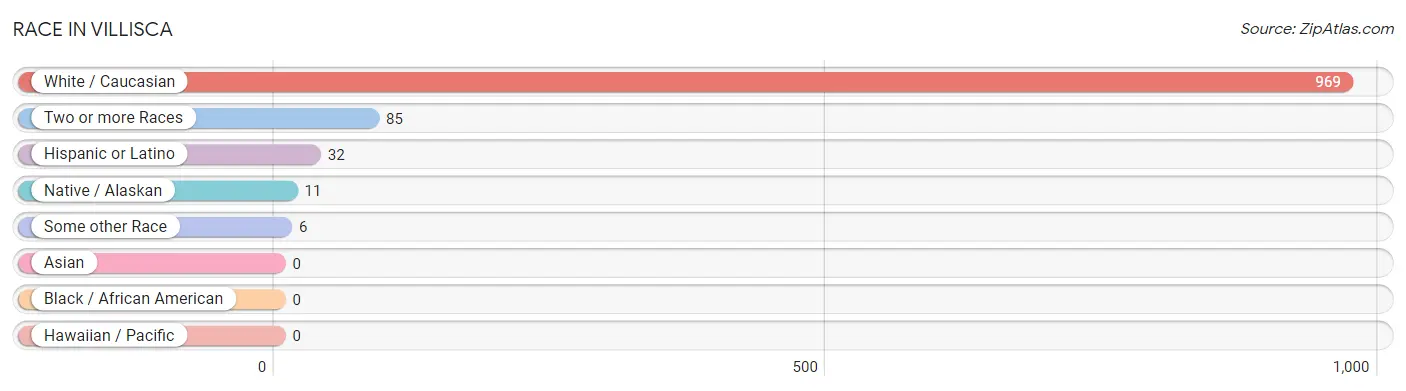
| Race | # Population | % Population |
| Asian | 0 | 0.0% |
| Black / African American | 0 | 0.0% |
| Hawaiian / Pacific | 0 | 0.0% |
| Hispanic or Latino | 32 | 3.0% |
| Native / Alaskan | 11 | 1.0% |
| White / Caucasian | 969 | 90.5% |
| Two or more Races | 85 | 7.9% |
| Some other Race | 6 | 0.6% |
| Total | 1,071 | 100.0% |
Ancestry in Villisca
The most populous ancestries reported in Villisca are German (221 | 20.6%), Irish (137 | 12.8%), American (81 | 7.6%), English (66 | 6.2%), and Swedish (61 | 5.7%), together accounting for 52.8% of all Villisca residents.
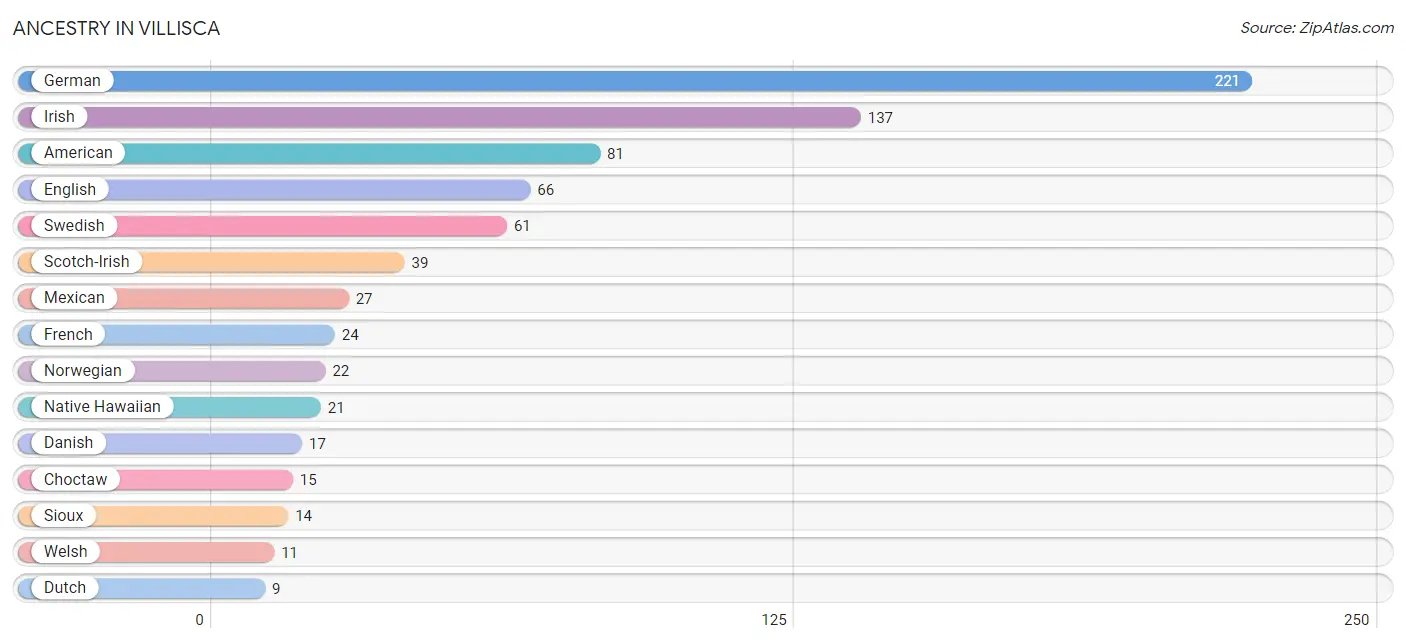
| Ancestry | # Population | % Population |
| American | 81 | 7.6% |
| British | 6 | 0.6% |
| Cherokee | 4 | 0.4% |
| Choctaw | 15 | 1.4% |
| Cuban | 5 | 0.5% |
| Danish | 17 | 1.6% |
| Dutch | 9 | 0.8% |
| English | 66 | 6.2% |
| French | 24 | 2.2% |
| German | 221 | 20.6% |
| Hopi | 6 | 0.6% |
| Irish | 137 | 12.8% |
| Iroquois | 2 | 0.2% |
| Italian | 9 | 0.8% |
| Mexican | 27 | 2.5% |
| Native Hawaiian | 21 | 2.0% |
| Northern European | 2 | 0.2% |
| Norwegian | 22 | 2.1% |
| Pennsylvania German | 4 | 0.4% |
| Polish | 4 | 0.4% |
| Portuguese | 6 | 0.6% |
| Scotch-Irish | 39 | 3.6% |
| Scottish | 2 | 0.2% |
| Sioux | 14 | 1.3% |
| Slovak | 2 | 0.2% |
| Swedish | 61 | 5.7% |
| Swiss | 8 | 0.7% |
| Welsh | 11 | 1.0% | View All 28 Rows |
Immigrants in Villisca

| Immigration Origin | # Population | % Population | View All 0 Rows |
Sex and Age in Villisca
Sex and Age in Villisca
The most populous age groups in Villisca are 20 to 24 Years (49 | 9.7%) for men and 70 to 74 Years (49 | 8.7%) for women.
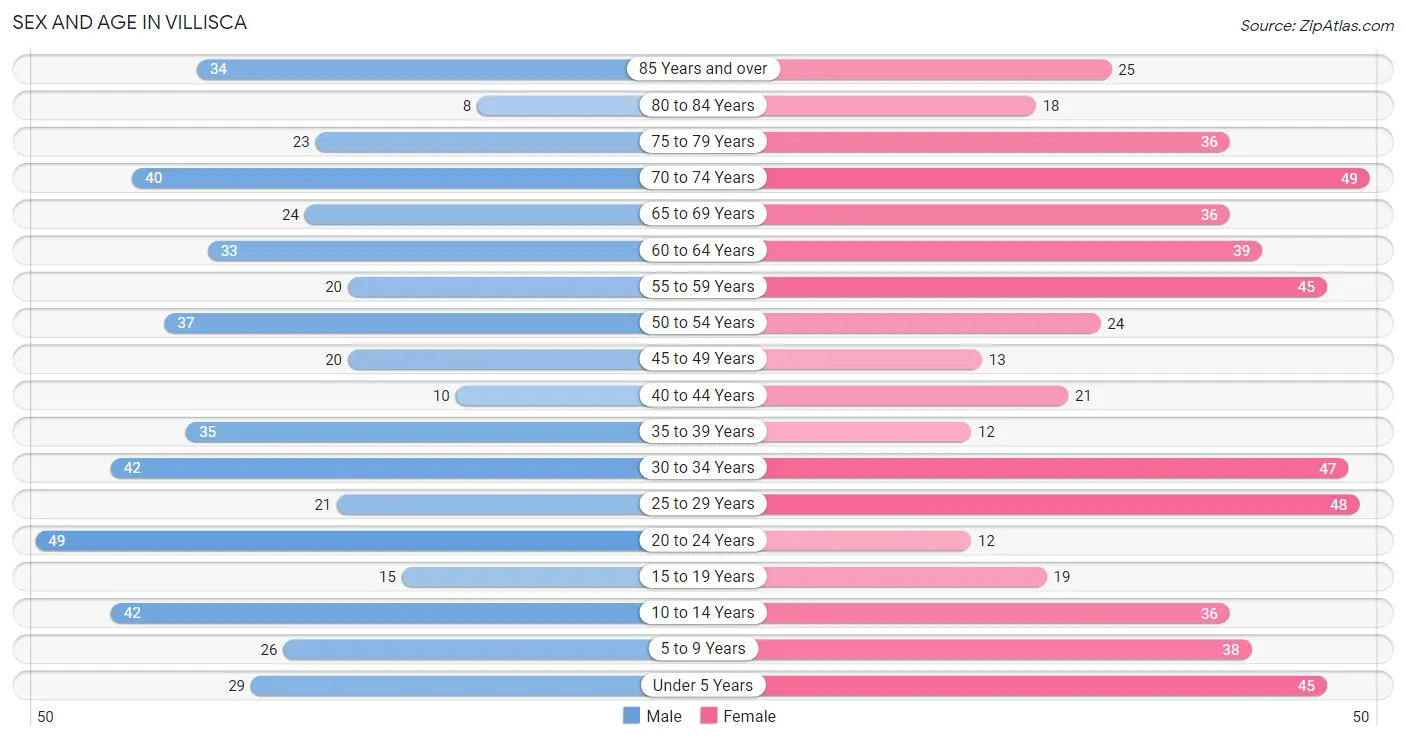
| Age Bracket | Male | Female |
| Under 5 Years | 29 (5.7%) | 45 (8.0%) |
| 5 to 9 Years | 26 (5.1%) | 38 (6.8%) |
| 10 to 14 Years | 42 (8.3%) | 36 (6.4%) |
| 15 to 19 Years | 15 (2.9%) | 19 (3.4%) |
| 20 to 24 Years | 49 (9.7%) | 12 (2.1%) |
| 25 to 29 Years | 21 (4.1%) | 48 (8.5%) |
| 30 to 34 Years | 42 (8.3%) | 47 (8.4%) |
| 35 to 39 Years | 35 (6.9%) | 12 (2.1%) |
| 40 to 44 Years | 10 (2.0%) | 21 (3.7%) |
| 45 to 49 Years | 20 (3.9%) | 13 (2.3%) |
| 50 to 54 Years | 37 (7.3%) | 24 (4.3%) |
| 55 to 59 Years | 20 (3.9%) | 45 (8.0%) |
| 60 to 64 Years | 33 (6.5%) | 39 (6.9%) |
| 65 to 69 Years | 24 (4.7%) | 36 (6.4%) |
| 70 to 74 Years | 40 (7.9%) | 49 (8.7%) |
| 75 to 79 Years | 23 (4.5%) | 36 (6.4%) |
| 80 to 84 Years | 8 (1.6%) | 18 (3.2%) |
| 85 Years and over | 34 (6.7%) | 25 (4.4%) |
| Total | 508 (100.0%) | 563 (100.0%) |
Families and Households in Villisca
Median Family Size in Villisca
The median family size in Villisca is 2.88 persons per family, with single female/mother families (64 | 25.5%) accounting for the largest median family size of 3.13 persons per family. On the other hand, single male/father families (22 | 8.8%) represent the smallest median family size with 2.55 persons per family.
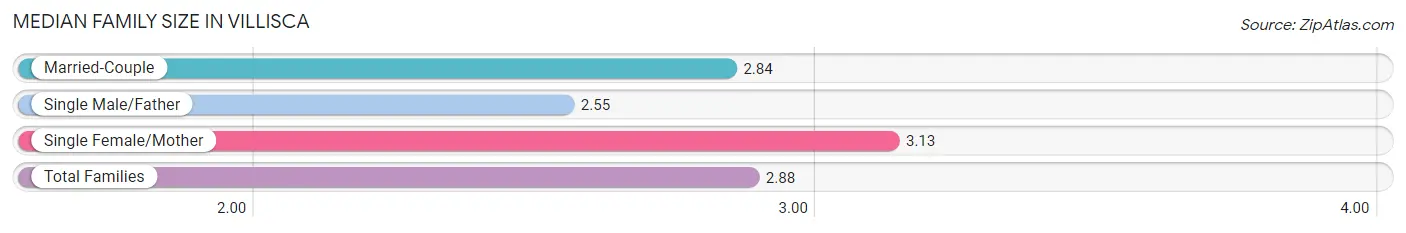
| Family Type | # Families | Family Size |
| Married-Couple | 165 (65.7%) | 2.84 |
| Single Male/Father | 22 (8.8%) | 2.55 |
| Single Female/Mother | 64 (25.5%) | 3.13 |
| Total Families | 251 (100.0%) | 2.88 |
Median Household Size in Villisca
The median household size in Villisca is 2.07 persons per household, with single female/mother households (64 | 12.9%) accounting for the largest median household size of 3.52 persons per household. non-family households (247 | 49.6%) represent the smallest median household size with 1.11 persons per household.
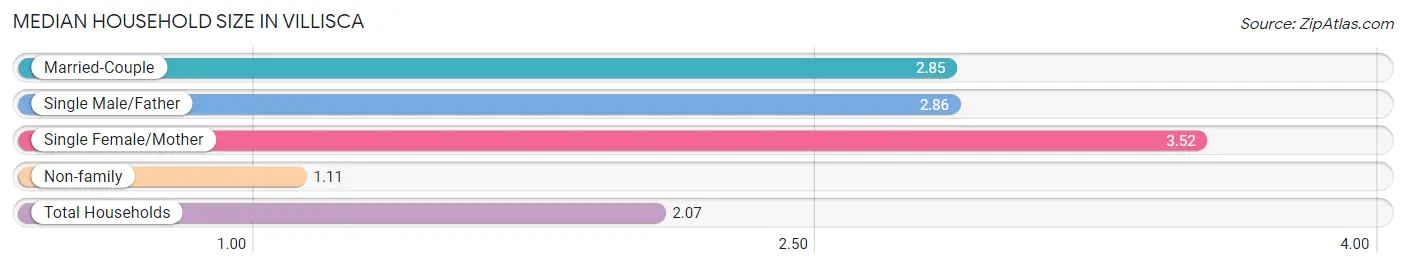
| Household Type | # Households | Household Size |
| Married-Couple | 165 (33.1%) | 2.85 |
| Single Male/Father | 22 (4.4%) | 2.86 |
| Single Female/Mother | 64 (12.9%) | 3.52 |
| Non-family | 247 (49.6%) | 1.11 |
| Total Households | 498 (100.0%) | 2.07 |
Household Size by Marriage Status in Villisca
Out of a total of 498 households in Villisca, 251 (50.4%) are family households, while 247 (49.6%) are nonfamily households. The most numerous type of family households are 2-person households, comprising 144, and the most common type of nonfamily households are 1-person households, comprising 219.
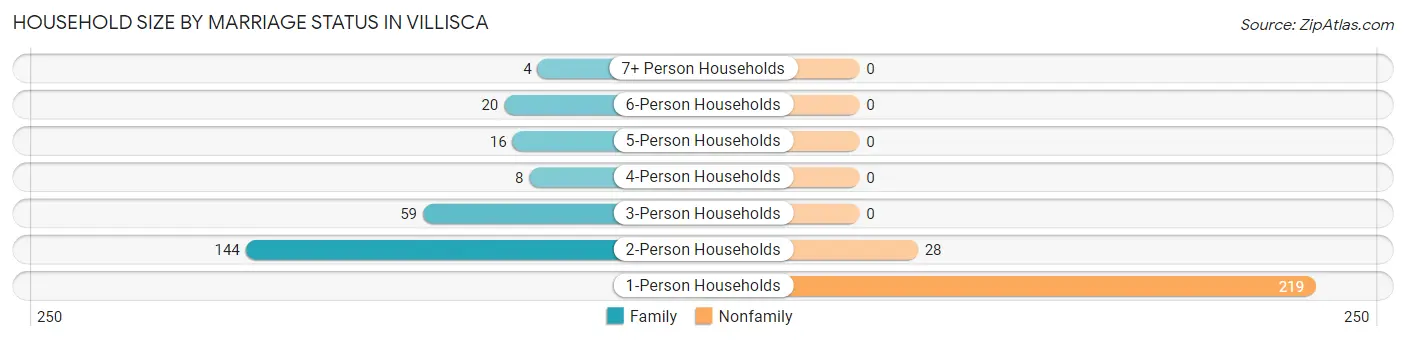
| Household Size | Family Households | Nonfamily Households |
| 1-Person Households | - | 219 (44.0%) |
| 2-Person Households | 144 (28.9%) | 28 (5.6%) |
| 3-Person Households | 59 (11.8%) | 0 (0.0%) |
| 4-Person Households | 8 (1.6%) | 0 (0.0%) |
| 5-Person Households | 16 (3.2%) | 0 (0.0%) |
| 6-Person Households | 20 (4.0%) | 0 (0.0%) |
| 7+ Person Households | 4 (0.8%) | 0 (0.0%) |
| Total | 251 (50.4%) | 247 (49.6%) |
Female Fertility in Villisca
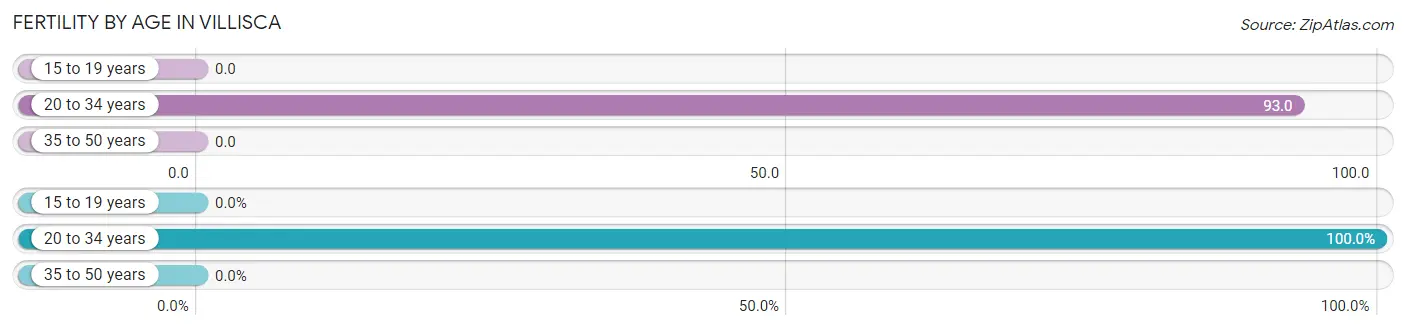
Fertility by Age in Villisca
Average fertility rate in Villisca is 56.0 births per 1,000 women. Women in the age bracket of 20 to 34 years have the highest fertility rate with 93.0 births per 1,000 women. Women in the age bracket of 20 to 34 years acount for 100.0% of all women with births.
| Age Bracket | Women with Births | Births / 1,000 Women |
| 15 to 19 years | 0 (0.0%) | 0.0 |
| 20 to 34 years | 10 (100.0%) | 93.0 |
| 35 to 50 years | 0 (0.0%) | 0.0 |
| Total | 10 (100.0%) | 56.0 |
Fertility by Age by Marriage Status in Villisca
60.0% of women with births (10) in Villisca are married. The highest percentage of unmarried women with births falls into 20 to 34 years age bracket with 40.0% of them unmarried at the time of birth, while the lowest percentage of unmarried women with births belong to 20 to 34 years age bracket with 40.0% of them unmarried.
| Age Bracket | Married | Unmarried |
| 15 to 19 years | 0 (0.0%) | 0 (0.0%) |
| 20 to 34 years | 6 (60.0%) | 4 (40.0%) |
| 35 to 50 years | 0 (0.0%) | 0 (0.0%) |
| Total | 6 (60.0%) | 4 (40.0%) |
Fertility by Education in Villisca
| Educational Attainment | Women with Births | Births / 1,000 Women |
| Less than High School | 0 (0.0%) | 0.0 |
| High School Diploma | 0 (0.0%) | 0.0 |
| College or Associate's Degree | 6 (60.0%) | 57.0 |
| Bachelor's Degree | 4 (40.0%) | 143.0 |
| Graduate Degree | 0 (0.0%) | 0.0 |
| Total | 10 (100.0%) | 56.0 |
Fertility by Education by Marriage Status in Villisca
40.0% of women with births in Villisca are unmarried. Women with the educational attainment of bachelor's degree are most likely to be married with 100.0% of them married at childbirth, while women with the educational attainment of college or associate's degree are least likely to be married with 66.7% of them unmarried at childbirth.
| Educational Attainment | Married | Unmarried |
| Less than High School | 0 (0.0%) | 0 (0.0%) |
| High School Diploma | 0 (0.0%) | 0 (0.0%) |
| College or Associate's Degree | 2 (33.3%) | 4 (66.7%) |
| Bachelor's Degree | 4 (100.0%) | 0 (0.0%) |
| Graduate Degree | 0 (0.0%) | 0 (0.0%) |
| Total | 6 (60.0%) | 4 (40.0%) |
Employment Characteristics in Villisca
Employment by Class of Employer in Villisca
Among the 463 employed individuals in Villisca, private company employees (287 | 62.0%), local government employees (47 | 10.2%), and not-for-profit organizations (46 | 9.9%) make up the most common classes of employment.
| Employer Class | # Employees | % Employees |
| Private Company Employees | 287 | 62.0% |
| Self-Employed (Incorporated) | 10 | 2.2% |
| Self-Employed (Not Incorporated) | 43 | 9.3% |
| Not-for-profit Organizations | 46 | 9.9% |
| Local Government Employees | 47 | 10.2% |
| State Government Employees | 24 | 5.2% |
| Federal Government Employees | 6 | 1.3% |
| Unpaid Family Workers | 0 | 0.0% |
| Total | 463 | 100.0% |
Employment Status by Age in Villisca
According to the labor force statistics for Villisca, out of the total population over 16 years of age (834), 56.6% or 472 individuals are in the labor force, with 1.9% or 9 of them unemployed. The age group with the highest labor force participation rate is 20 to 24 years, with 91.8% or 56 individuals in the labor force. Within the labor force, the 30 to 34 years age range has the highest percentage of unemployed individuals, with 8.8% or 6 of them being unemployed.
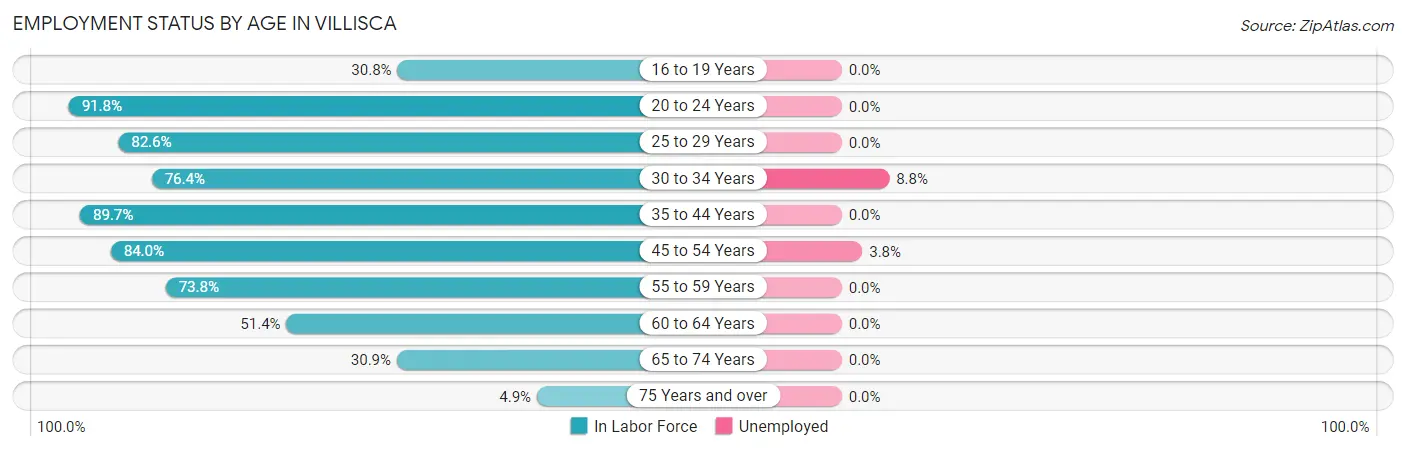
| Age Bracket | In Labor Force | Unemployed |
| 16 to 19 Years | 4 (30.8%) | 0 (0.0%) |
| 20 to 24 Years | 56 (91.8%) | 0 (0.0%) |
| 25 to 29 Years | 57 (82.6%) | 0 (0.0%) |
| 30 to 34 Years | 68 (76.4%) | 6 (8.8%) |
| 35 to 44 Years | 70 (89.7%) | 0 (0.0%) |
| 45 to 54 Years | 79 (84.0%) | 3 (3.8%) |
| 55 to 59 Years | 48 (73.8%) | 0 (0.0%) |
| 60 to 64 Years | 37 (51.4%) | 0 (0.0%) |
| 65 to 74 Years | 46 (30.9%) | 0 (0.0%) |
| 75 Years and over | 7 (4.9%) | 0 (0.0%) |
| Total | 472 (56.6%) | 9 (1.9%) |
Employment Status by Educational Attainment in Villisca
According to labor force statistics for Villisca, 76.9% of individuals (359) out of the total population between 25 and 64 years of age (467) are in the labor force, with 2.5% or 9 of them being unemployed. The group with the highest labor force participation rate are those with the educational attainment of college / associate degree, with 86.8% or 223 individuals in the labor force. Within the labor force, individuals with high school diploma education have the highest percentage of unemployment, with 7.1% or 6 of them being unemployed.
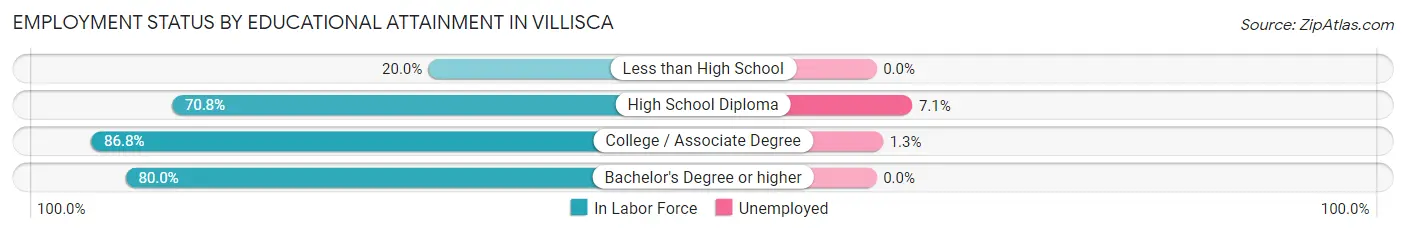
| Educational Attainment | In Labor Force | Unemployed |
| Less than High School | 7 (20.0%) | 0 (0.0%) |
| High School Diploma | 85 (70.8%) | 9 (7.1%) |
| College / Associate Degree | 223 (86.8%) | 3 (1.3%) |
| Bachelor's Degree or higher | 44 (80.0%) | 0 (0.0%) |
| Total | 359 (76.9%) | 12 (2.5%) |
Employment Occupations by Sex in Villisca
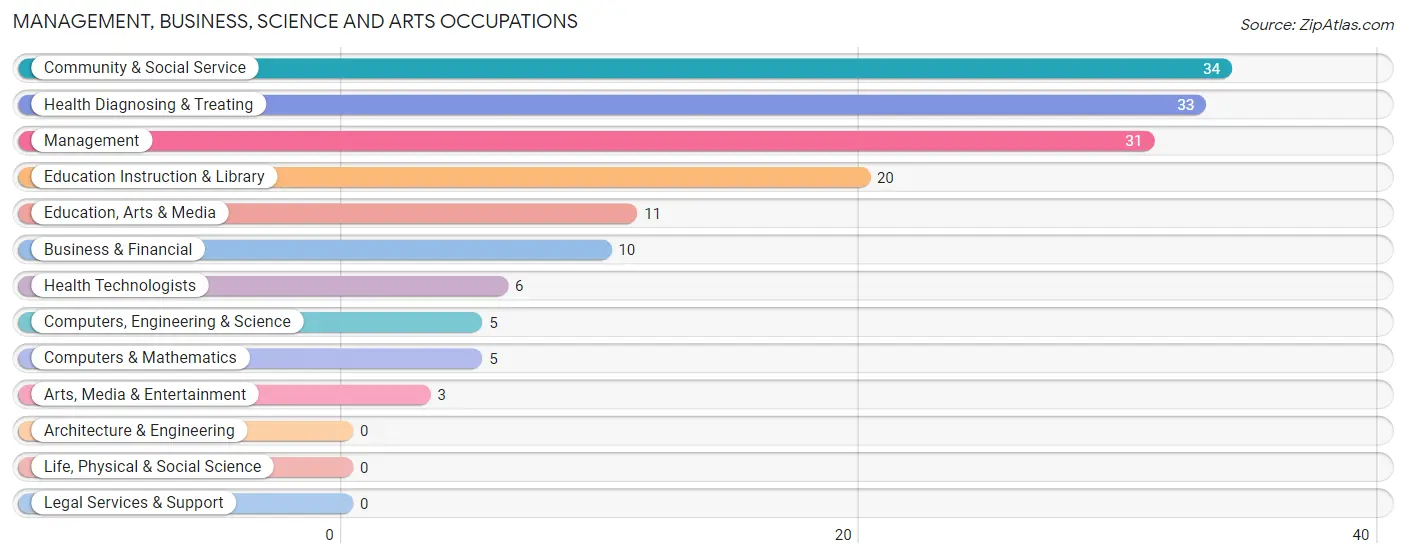
Management, Business, Science and Arts Occupations
The most common Management, Business, Science and Arts occupations in Villisca are Community & Social Service (34 | 7.3%), Health Diagnosing & Treating (33 | 7.1%), Management (31 | 6.7%), Education Instruction & Library (20 | 4.3%), and Education, Arts & Media (11 | 2.4%).
Management, Business, Science and Arts Occupations by Sex
Within the Management, Business, Science and Arts occupations in Villisca, the most male-oriented occupations are Computers, Engineering & Science (100.0%), Computers & Mathematics (100.0%), and Management (61.3%), while the most female-oriented occupations are Arts, Media & Entertainment (100.0%), Health Technologists (100.0%), and Health Diagnosing & Treating (90.9%).
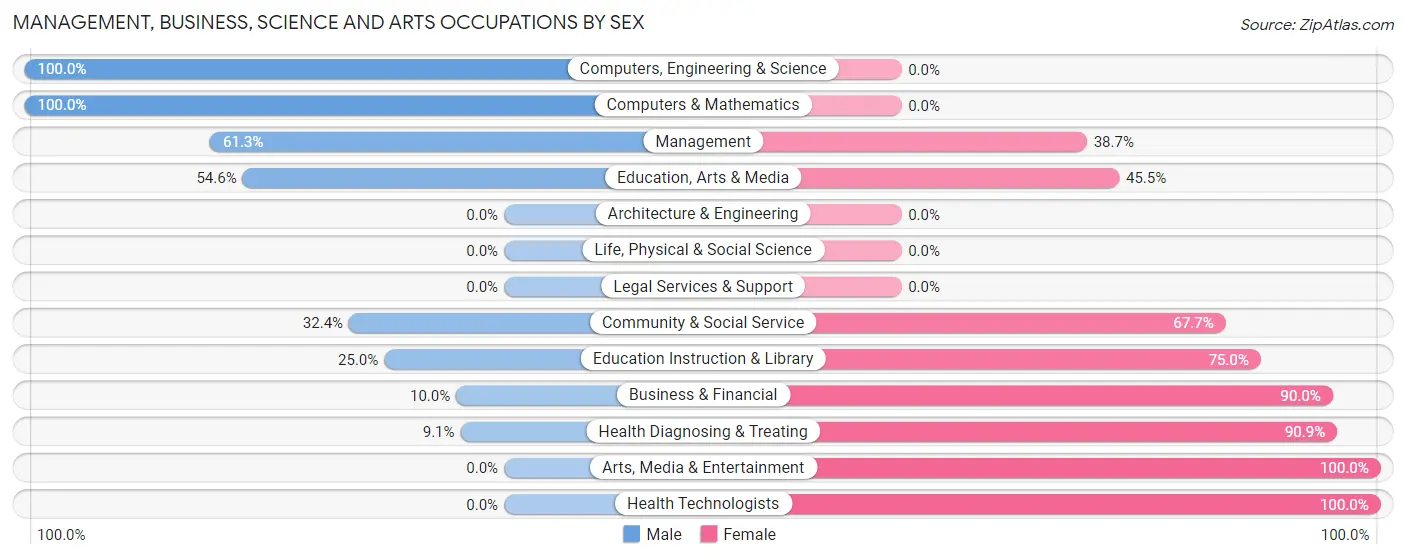
| Occupation | Male | Female |
| Management | 19 (61.3%) | 12 (38.7%) |
| Business & Financial | 1 (10.0%) | 9 (90.0%) |
| Computers, Engineering & Science | 5 (100.0%) | 0 (0.0%) |
| Computers & Mathematics | 5 (100.0%) | 0 (0.0%) |
| Architecture & Engineering | 0 (0.0%) | 0 (0.0%) |
| Life, Physical & Social Science | 0 (0.0%) | 0 (0.0%) |
| Community & Social Service | 11 (32.4%) | 23 (67.6%) |
| Education, Arts & Media | 6 (54.5%) | 5 (45.5%) |
| Legal Services & Support | 0 (0.0%) | 0 (0.0%) |
| Education Instruction & Library | 5 (25.0%) | 15 (75.0%) |
| Arts, Media & Entertainment | 0 (0.0%) | 3 (100.0%) |
| Health Diagnosing & Treating | 3 (9.1%) | 30 (90.9%) |
| Health Technologists | 0 (0.0%) | 6 (100.0%) |
| Total (Category) | 39 (34.5%) | 74 (65.5%) |
| Total (Overall) | 254 (54.9%) | 209 (45.1%) |
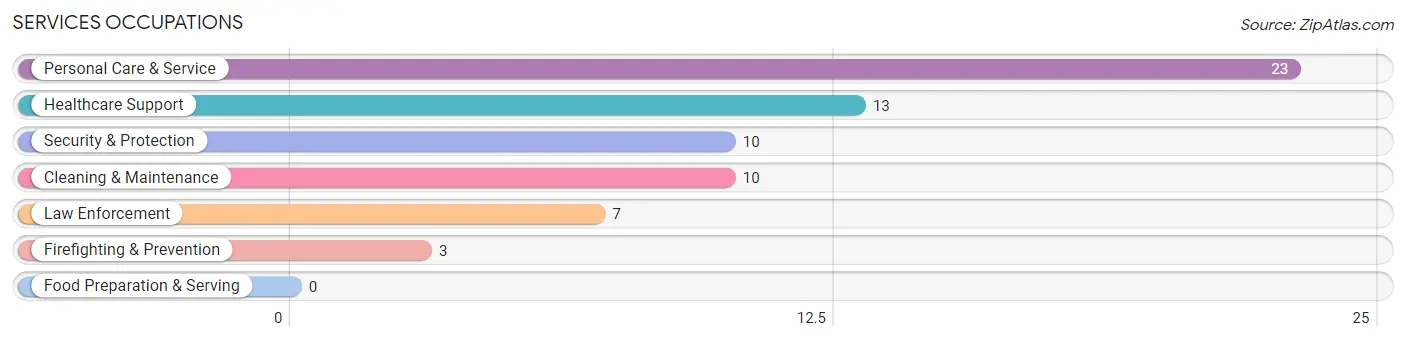
Services Occupations
The most common Services occupations in Villisca are Personal Care & Service (23 | 5.0%), Healthcare Support (13 | 2.8%), Security & Protection (10 | 2.2%), Cleaning & Maintenance (10 | 2.2%), and Law Enforcement (7 | 1.5%).
Services Occupations by Sex
Within the Services occupations in Villisca, the most male-oriented occupations are Security & Protection (100.0%), Firefighting & Prevention (100.0%), and Law Enforcement (100.0%), while the most female-oriented occupations are Healthcare Support (100.0%), Personal Care & Service (100.0%), and Cleaning & Maintenance (60.0%).
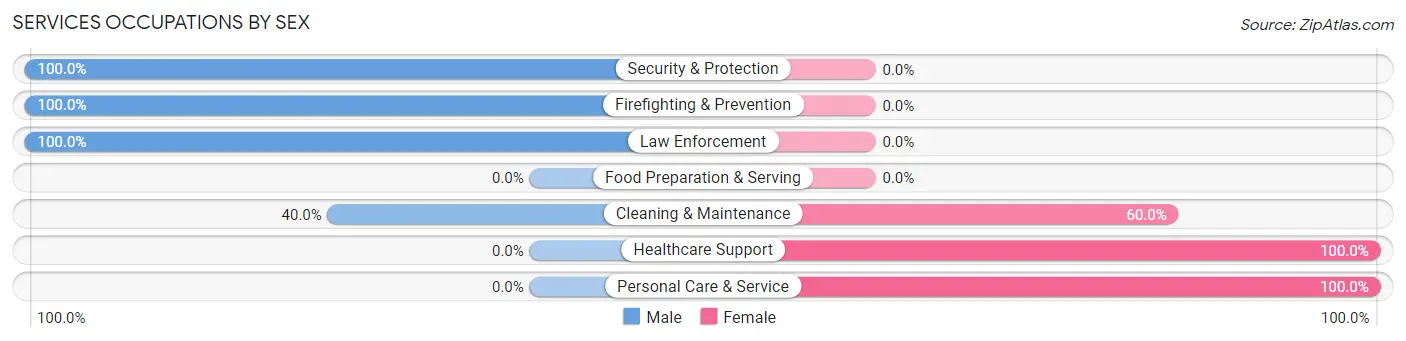
| Occupation | Male | Female |
| Healthcare Support | 0 (0.0%) | 13 (100.0%) |
| Security & Protection | 10 (100.0%) | 0 (0.0%) |
| Firefighting & Prevention | 3 (100.0%) | 0 (0.0%) |
| Law Enforcement | 7 (100.0%) | 0 (0.0%) |
| Food Preparation & Serving | 0 (0.0%) | 0 (0.0%) |
| Cleaning & Maintenance | 4 (40.0%) | 6 (60.0%) |
| Personal Care & Service | 0 (0.0%) | 23 (100.0%) |
| Total (Category) | 14 (25.0%) | 42 (75.0%) |
| Total (Overall) | 254 (54.9%) | 209 (45.1%) |
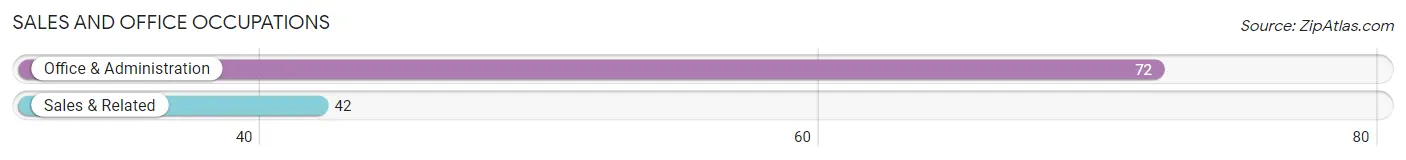
Sales and Office Occupations
The most common Sales and Office occupations in Villisca are Office & Administration (72 | 15.5%), and Sales & Related (42 | 9.1%).
Sales and Office Occupations by Sex
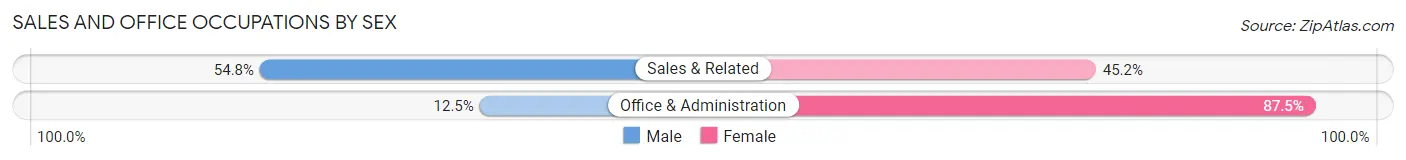
| Occupation | Male | Female |
| Sales & Related | 23 (54.8%) | 19 (45.2%) |
| Office & Administration | 9 (12.5%) | 63 (87.5%) |
| Total (Category) | 32 (28.1%) | 82 (71.9%) |
| Total (Overall) | 254 (54.9%) | 209 (45.1%) |
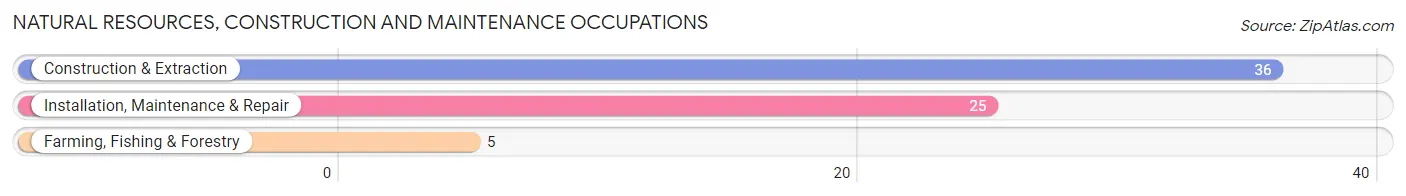
Natural Resources, Construction and Maintenance Occupations
The most common Natural Resources, Construction and Maintenance occupations in Villisca are Construction & Extraction (36 | 7.8%), Installation, Maintenance & Repair (25 | 5.4%), and Farming, Fishing & Forestry (5 | 1.1%).
Natural Resources, Construction and Maintenance Occupations by Sex
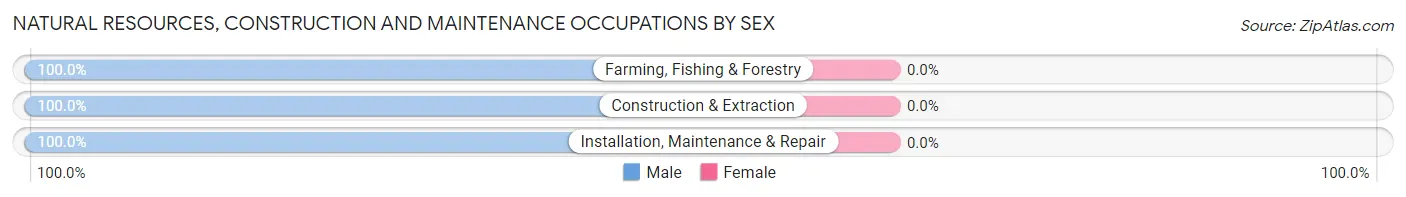
| Occupation | Male | Female |
| Farming, Fishing & Forestry | 5 (100.0%) | 0 (0.0%) |
| Construction & Extraction | 36 (100.0%) | 0 (0.0%) |
| Installation, Maintenance & Repair | 25 (100.0%) | 0 (0.0%) |
| Total (Category) | 66 (100.0%) | 0 (0.0%) |
| Total (Overall) | 254 (54.9%) | 209 (45.1%) |
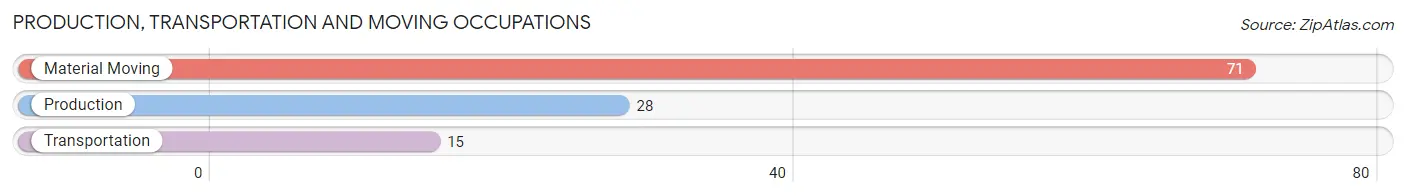
Production, Transportation and Moving Occupations
The most common Production, Transportation and Moving occupations in Villisca are Material Moving (71 | 15.3%), Production (28 | 6.0%), and Transportation (15 | 3.2%).
Production, Transportation and Moving Occupations by Sex
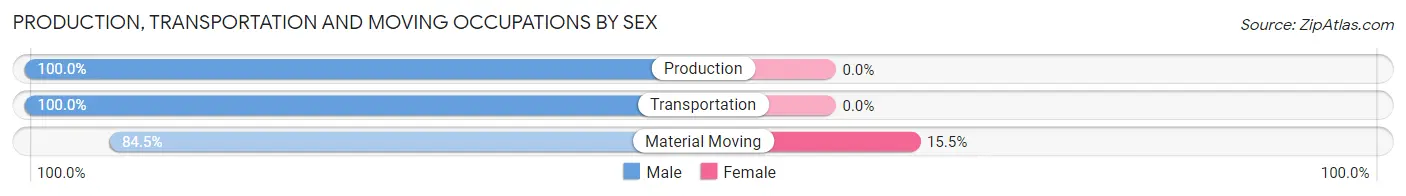
| Occupation | Male | Female |
| Production | 28 (100.0%) | 0 (0.0%) |
| Transportation | 15 (100.0%) | 0 (0.0%) |
| Material Moving | 60 (84.5%) | 11 (15.5%) |
| Total (Category) | 103 (90.3%) | 11 (9.7%) |
| Total (Overall) | 254 (54.9%) | 209 (45.1%) |
Employment Industries by Sex in Villisca
Employment Industries in Villisca
The major employment industries in Villisca include Manufacturing (99 | 21.4%), Health Care & Social Assistance (70 | 15.1%), Retail Trade (60 | 13.0%), Educational Services (31 | 6.7%), and Agriculture, Fishing & Hunting (24 | 5.2%).
Employment Industries by Sex in Villisca
The Villisca industries that see more men than women are Agriculture, Fishing & Hunting (100.0%), Mining, Quarrying, & Extraction (100.0%), and Construction (100.0%), whereas the industries that tend to have a higher number of women are Information (100.0%), Finance & Insurance (100.0%), and Professional & Scientific (100.0%).
| Industry | Male | Female |
| Agriculture, Fishing & Hunting | 24 (100.0%) | 0 (0.0%) |
| Mining, Quarrying, & Extraction | 13 (100.0%) | 0 (0.0%) |
| Construction | 20 (100.0%) | 0 (0.0%) |
| Manufacturing | 88 (88.9%) | 11 (11.1%) |
| Wholesale Trade | 2 (33.3%) | 4 (66.7%) |
| Retail Trade | 19 (31.7%) | 41 (68.3%) |
| Transportation & Warehousing | 4 (40.0%) | 6 (60.0%) |
| Utilities | 9 (100.0%) | 0 (0.0%) |
| Information | 0 (0.0%) | 22 (100.0%) |
| Finance & Insurance | 0 (0.0%) | 7 (100.0%) |
| Real Estate, Rental & Leasing | 6 (100.0%) | 0 (0.0%) |
| Professional & Scientific | 0 (0.0%) | 3 (100.0%) |
| Enterprise Management | 0 (0.0%) | 0 (0.0%) |
| Administrative & Support | 5 (62.5%) | 3 (37.5%) |
| Educational Services | 14 (45.2%) | 17 (54.8%) |
| Health Care & Social Assistance | 15 (21.4%) | 55 (78.6%) |
| Arts, Entertainment & Recreation | 0 (0.0%) | 3 (100.0%) |
| Accommodation & Food Services | 0 (0.0%) | 0 (0.0%) |
| Public Administration | 10 (43.5%) | 13 (56.5%) |
| Total | 254 (54.9%) | 209 (45.1%) |
Education in Villisca
School Enrollment in Villisca
The most common levels of schooling among the 196 students in Villisca are middle school (61 | 31.1%), elementary school (46 | 23.5%), and high school (33 | 16.8%).
| School Level | # Students | % Students |
| Nursery / Preschool | 19 | 9.7% |
| Kindergarten | 19 | 9.7% |
| Elementary School | 46 | 23.5% |
| Middle School | 61 | 31.1% |
| High School | 33 | 16.8% |
| College / Undergraduate | 18 | 9.2% |
| Graduate / Professional | 0 | 0.0% |
| Total | 196 | 100.0% |
School Enrollment by Age by Funding Source in Villisca
Out of a total of 196 students who are enrolled in schools in Villisca, 3 (1.5%) attend a private institution, while the remaining 193 (98.5%) are enrolled in public schools. The age group of 35 years and over has the highest likelihood of being enrolled in private schools, with 3 (100.0% in the age bracket) enrolled. Conversely, the age group of 3 to 4 year olds has the lowest likelihood of being enrolled in a private school, with 13 (100.0% in the age bracket) attending a public institution.
| Age Bracket | Public School | Private School |
| 3 to 4 Year Olds | 13 (100.0%) | 0 (0.0%) |
| 5 to 9 Year Old | 58 (100.0%) | 0 (0.0%) |
| 10 to 14 Year Olds | 78 (100.0%) | 0 (0.0%) |
| 15 to 17 Year Olds | 29 (100.0%) | 0 (0.0%) |
| 18 to 19 Year Olds | 0 (0.0%) | 0 (0.0%) |
| 20 to 24 Year Olds | 8 (100.0%) | 0 (0.0%) |
| 25 to 34 Year Olds | 7 (100.0%) | 0 (0.0%) |
| 35 Years and over | 0 (0.0%) | 3 (100.0%) |
| Total | 193 (98.5%) | 3 (1.5%) |
Educational Attainment by Field of Study in Villisca
Education (37 | 32.2%), business (23 | 20.0%), bio, nature & agricultural (16 | 13.9%), computers & mathematics (10 | 8.7%), and science & technology (7 | 6.1%) are the most common fields of study among 115 individuals in Villisca who have obtained a bachelor's degree or higher.
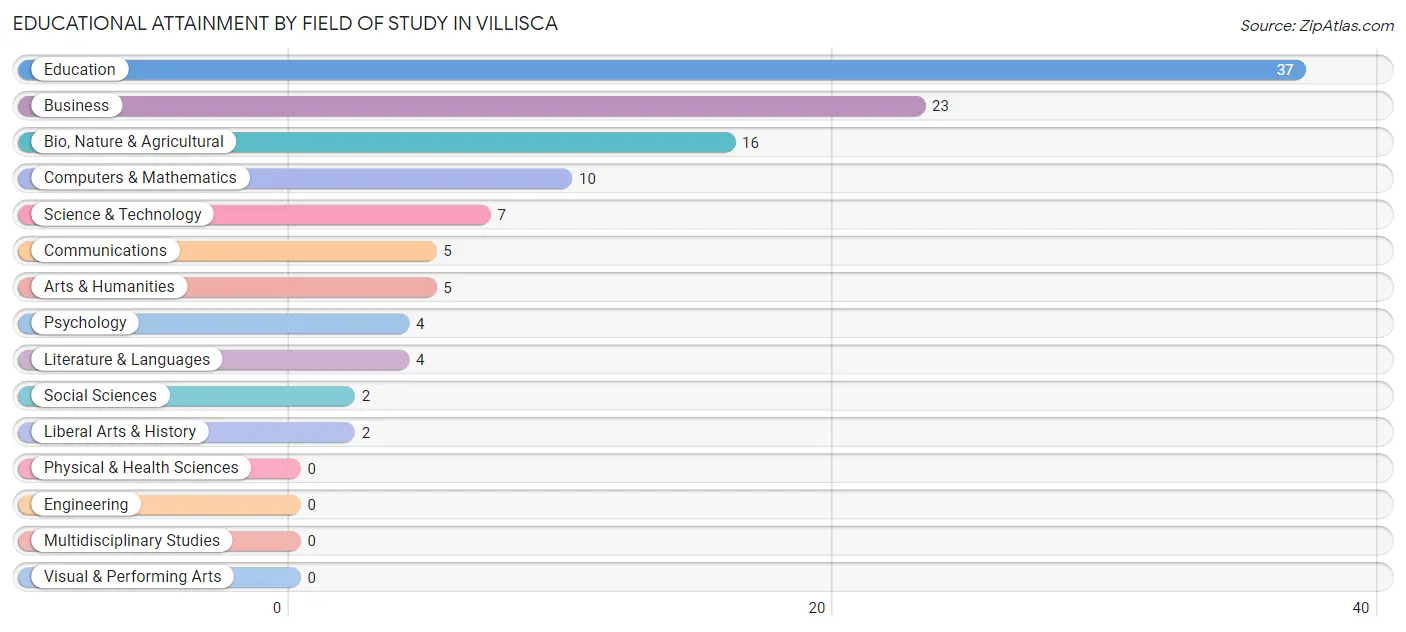
| Field of Study | # Graduates | % Graduates |
| Computers & Mathematics | 10 | 8.7% |
| Bio, Nature & Agricultural | 16 | 13.9% |
| Physical & Health Sciences | 0 | 0.0% |
| Psychology | 4 | 3.5% |
| Social Sciences | 2 | 1.7% |
| Engineering | 0 | 0.0% |
| Multidisciplinary Studies | 0 | 0.0% |
| Science & Technology | 7 | 6.1% |
| Business | 23 | 20.0% |
| Education | 37 | 32.2% |
| Literature & Languages | 4 | 3.5% |
| Liberal Arts & History | 2 | 1.7% |
| Visual & Performing Arts | 0 | 0.0% |
| Communications | 5 | 4.3% |
| Arts & Humanities | 5 | 4.3% |
| Total | 115 | 100.0% |
Transportation & Commute in Villisca
Vehicle Availability by Sex in Villisca
The most prevalent vehicle ownership categories in Villisca are males with 3 vehicles (83, accounting for 32.7%) and females with 3 vehicles (71, making up 39.7%).
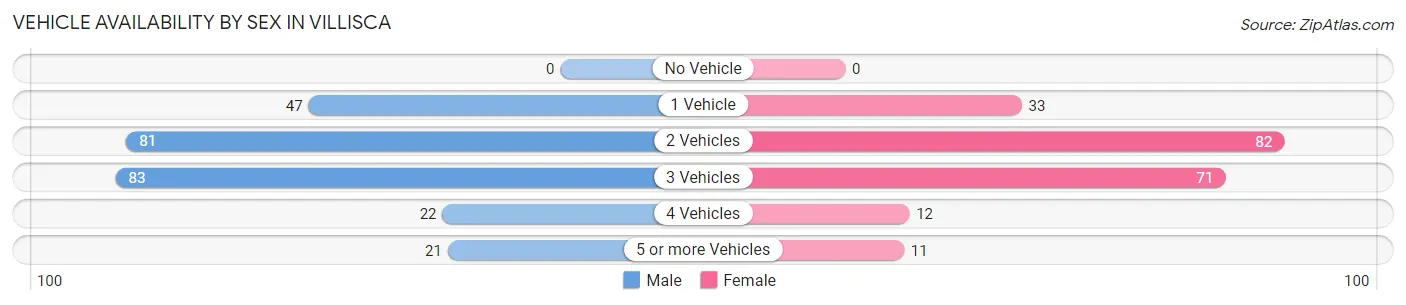
| Vehicles Available | Male | Female |
| No Vehicle | 0 (0.0%) | 0 (0.0%) |
| 1 Vehicle | 47 (18.5%) | 33 (15.8%) |
| 2 Vehicles | 81 (31.9%) | 82 (39.2%) |
| 3 Vehicles | 83 (32.7%) | 71 (34.0%) |
| 4 Vehicles | 22 (8.7%) | 12 (5.7%) |
| 5 or more Vehicles | 21 (8.3%) | 11 (5.3%) |
| Total | 254 (100.0%) | 209 (100.0%) |
Commute Time in Villisca
The most frequently occuring commute durations in Villisca are 20 to 24 minutes (89 commuters, 20.4%), less than 5 minutes (86 commuters, 19.7%), and 30 to 34 minutes (86 commuters, 19.7%).
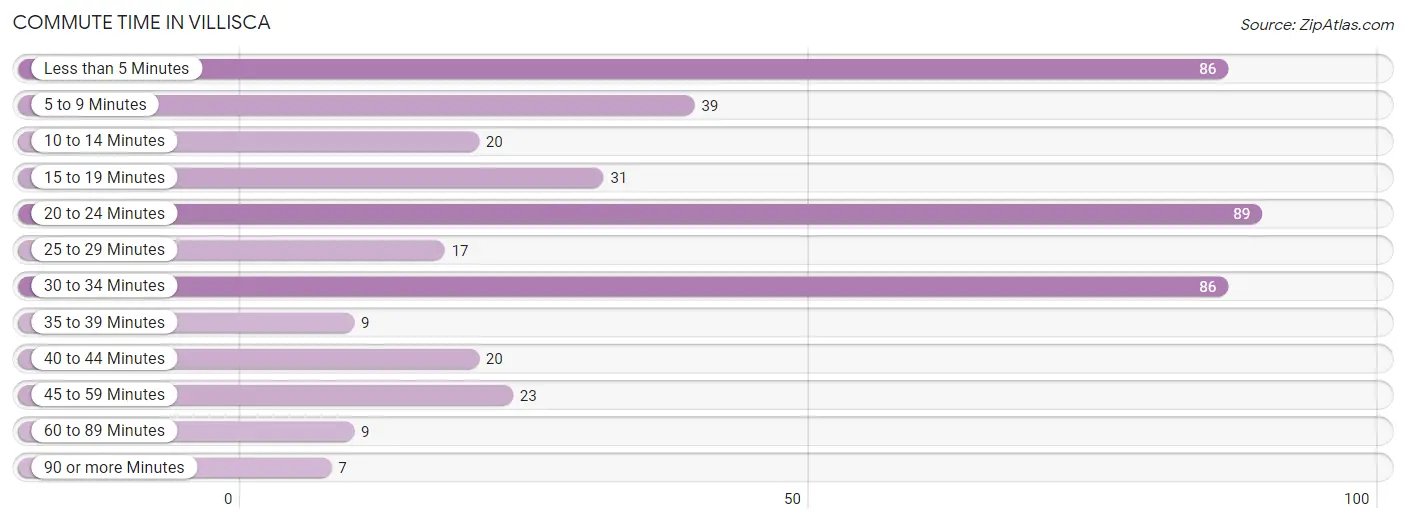
| Commute Time | # Commuters | % Commuters |
| Less than 5 Minutes | 86 | 19.7% |
| 5 to 9 Minutes | 39 | 8.9% |
| 10 to 14 Minutes | 20 | 4.6% |
| 15 to 19 Minutes | 31 | 7.1% |
| 20 to 24 Minutes | 89 | 20.4% |
| 25 to 29 Minutes | 17 | 3.9% |
| 30 to 34 Minutes | 86 | 19.7% |
| 35 to 39 Minutes | 9 | 2.1% |
| 40 to 44 Minutes | 20 | 4.6% |
| 45 to 59 Minutes | 23 | 5.3% |
| 60 to 89 Minutes | 9 | 2.1% |
| 90 or more Minutes | 7 | 1.6% |
Commute Time by Sex in Villisca
The most common commute times in Villisca are 30 to 34 minutes (72 commuters, 28.3%) for males and less than 5 minutes (42 commuters, 23.1%) for females.
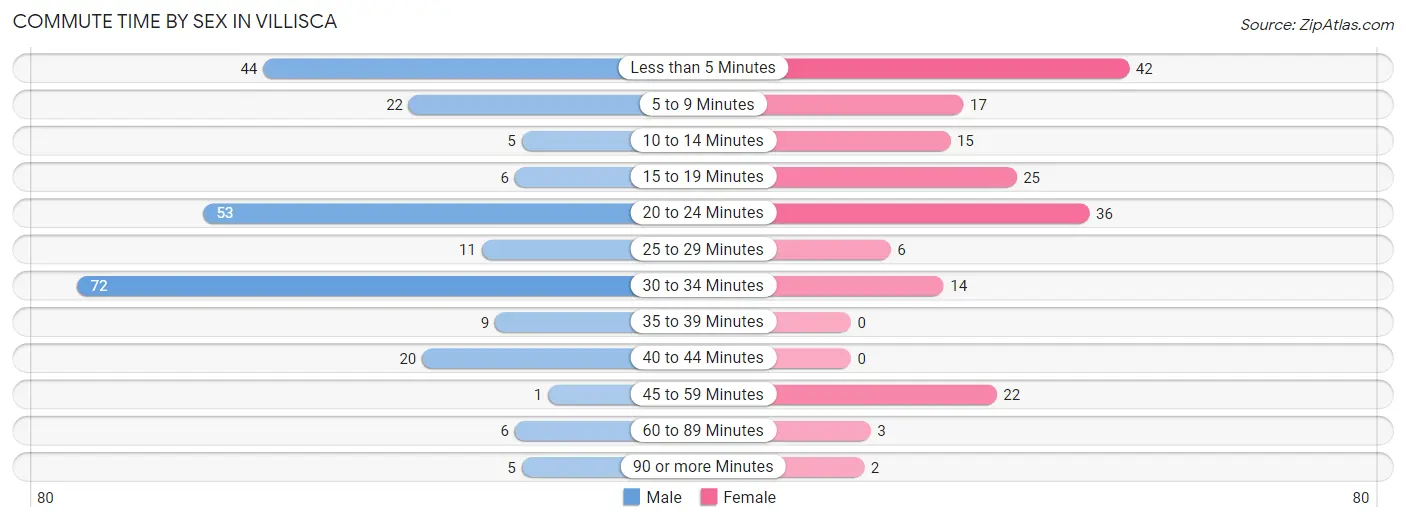
| Commute Time | Male | Female |
| Less than 5 Minutes | 44 (17.3%) | 42 (23.1%) |
| 5 to 9 Minutes | 22 (8.7%) | 17 (9.3%) |
| 10 to 14 Minutes | 5 (2.0%) | 15 (8.2%) |
| 15 to 19 Minutes | 6 (2.4%) | 25 (13.7%) |
| 20 to 24 Minutes | 53 (20.9%) | 36 (19.8%) |
| 25 to 29 Minutes | 11 (4.3%) | 6 (3.3%) |
| 30 to 34 Minutes | 72 (28.3%) | 14 (7.7%) |
| 35 to 39 Minutes | 9 (3.5%) | 0 (0.0%) |
| 40 to 44 Minutes | 20 (7.9%) | 0 (0.0%) |
| 45 to 59 Minutes | 1 (0.4%) | 22 (12.1%) |
| 60 to 89 Minutes | 6 (2.4%) | 3 (1.7%) |
| 90 or more Minutes | 5 (2.0%) | 2 (1.1%) |
Time of Departure to Work by Sex in Villisca
The most frequent times of departure to work in Villisca are 12:00 PM to 3:59 PM (51, 20.1%) for males and 7:30 AM to 7:59 AM (49, 26.9%) for females.
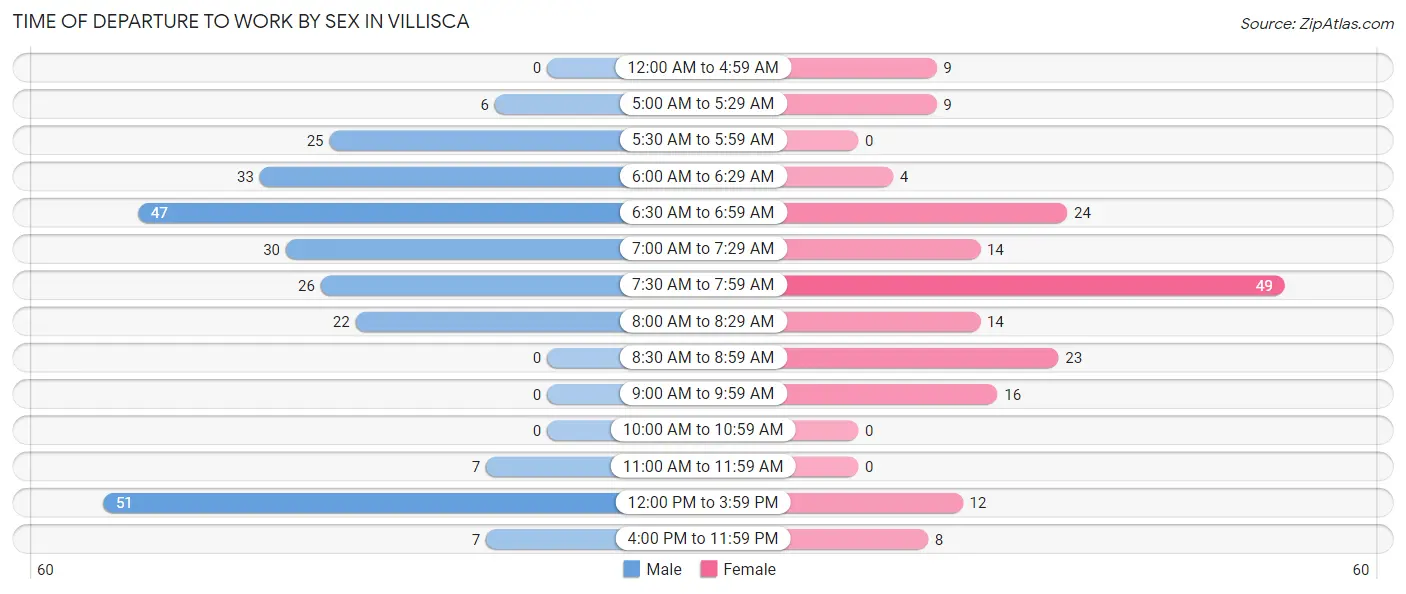
| Time of Departure | Male | Female |
| 12:00 AM to 4:59 AM | 0 (0.0%) | 9 (5.0%) |
| 5:00 AM to 5:29 AM | 6 (2.4%) | 9 (5.0%) |
| 5:30 AM to 5:59 AM | 25 (9.8%) | 0 (0.0%) |
| 6:00 AM to 6:29 AM | 33 (13.0%) | 4 (2.2%) |
| 6:30 AM to 6:59 AM | 47 (18.5%) | 24 (13.2%) |
| 7:00 AM to 7:29 AM | 30 (11.8%) | 14 (7.7%) |
| 7:30 AM to 7:59 AM | 26 (10.2%) | 49 (26.9%) |
| 8:00 AM to 8:29 AM | 22 (8.7%) | 14 (7.7%) |
| 8:30 AM to 8:59 AM | 0 (0.0%) | 23 (12.6%) |
| 9:00 AM to 9:59 AM | 0 (0.0%) | 16 (8.8%) |
| 10:00 AM to 10:59 AM | 0 (0.0%) | 0 (0.0%) |
| 11:00 AM to 11:59 AM | 7 (2.8%) | 0 (0.0%) |
| 12:00 PM to 3:59 PM | 51 (20.1%) | 12 (6.6%) |
| 4:00 PM to 11:59 PM | 7 (2.8%) | 8 (4.4%) |
| Total | 254 (100.0%) | 182 (100.0%) |
Housing Occupancy in Villisca
Occupancy by Ownership in Villisca
Of the total 498 dwellings in Villisca, owner-occupied units account for 371 (74.5%), while renter-occupied units make up 127 (25.5%).
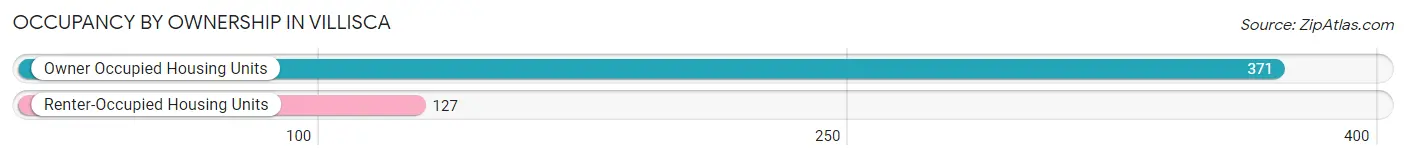
| Occupancy | # Housing Units | % Housing Units |
| Owner Occupied Housing Units | 371 | 74.5% |
| Renter-Occupied Housing Units | 127 | 25.5% |
| Total Occupied Housing Units | 498 | 100.0% |
Occupancy by Household Size in Villisca
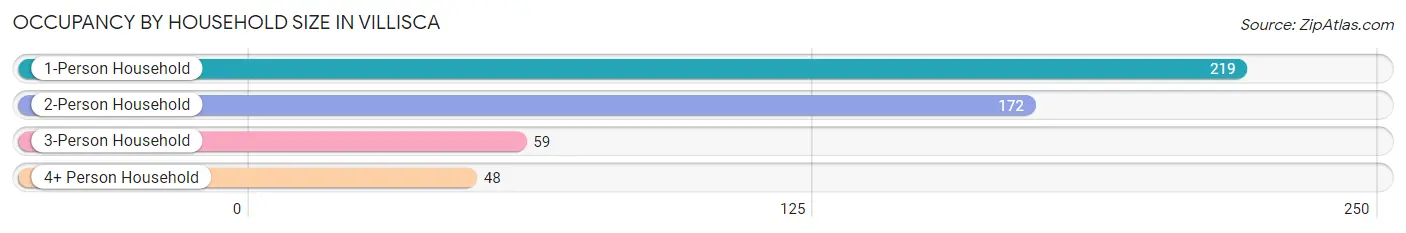
| Household Size | # Housing Units | % Housing Units |
| 1-Person Household | 219 | 44.0% |
| 2-Person Household | 172 | 34.5% |
| 3-Person Household | 59 | 11.8% |
| 4+ Person Household | 48 | 9.6% |
| Total Housing Units | 498 | 100.0% |
Occupancy by Ownership by Household Size in Villisca
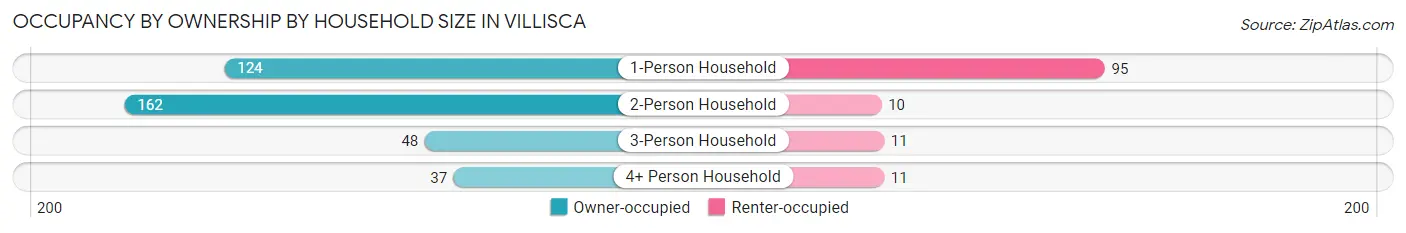
| Household Size | Owner-occupied | Renter-occupied |
| 1-Person Household | 124 (56.6%) | 95 (43.4%) |
| 2-Person Household | 162 (94.2%) | 10 (5.8%) |
| 3-Person Household | 48 (81.4%) | 11 (18.6%) |
| 4+ Person Household | 37 (77.1%) | 11 (22.9%) |
| Total Housing Units | 371 (74.5%) | 127 (25.5%) |
Occupancy by Educational Attainment in Villisca
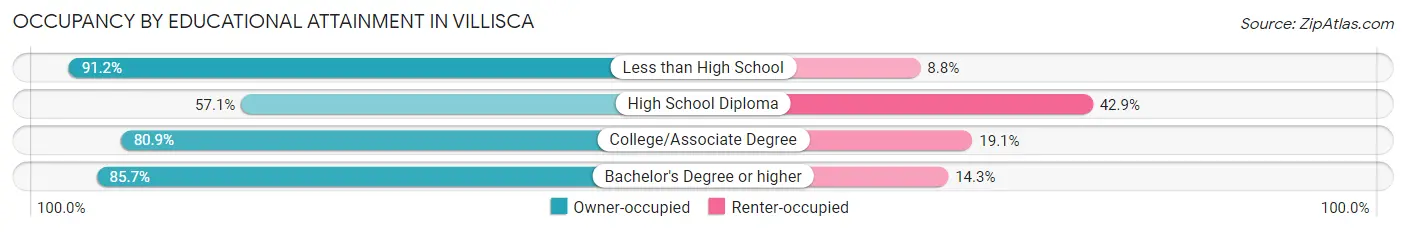
| Household Size | Owner-occupied | Renter-occupied |
| Less than High School | 52 (91.2%) | 5 (8.8%) |
| High School Diploma | 97 (57.1%) | 73 (42.9%) |
| College/Associate Degree | 174 (80.9%) | 41 (19.1%) |
| Bachelor's Degree or higher | 48 (85.7%) | 8 (14.3%) |
Occupancy by Age of Householder in Villisca
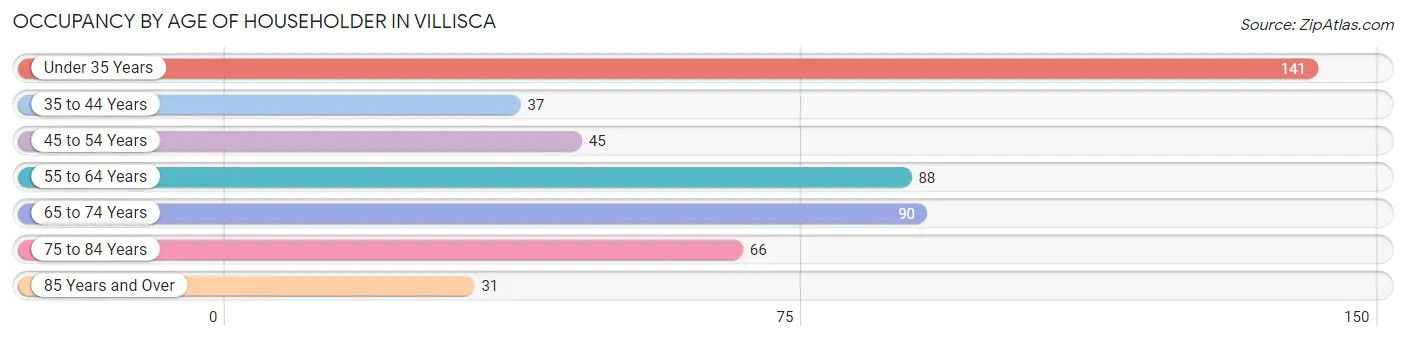
| Age Bracket | # Households | % Households |
| Under 35 Years | 141 | 28.3% |
| 35 to 44 Years | 37 | 7.4% |
| 45 to 54 Years | 45 | 9.0% |
| 55 to 64 Years | 88 | 17.7% |
| 65 to 74 Years | 90 | 18.1% |
| 75 to 84 Years | 66 | 13.3% |
| 85 Years and Over | 31 | 6.2% |
| Total | 498 | 100.0% |
Housing Finances in Villisca
Median Income by Occupancy in Villisca
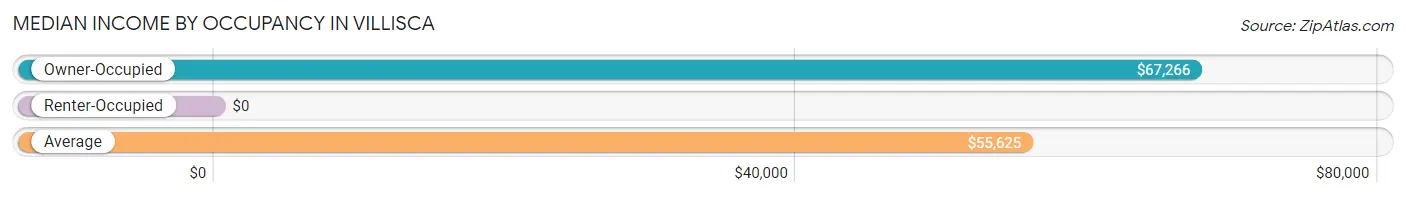
| Occupancy Type | # Households | Median Income |
| Owner-Occupied | 371 (74.5%) | $67,266 |
| Renter-Occupied | 127 (25.5%) | $0 |
| Average | 498 (100.0%) | $55,625 |
Occupancy by Householder Income Bracket in Villisca
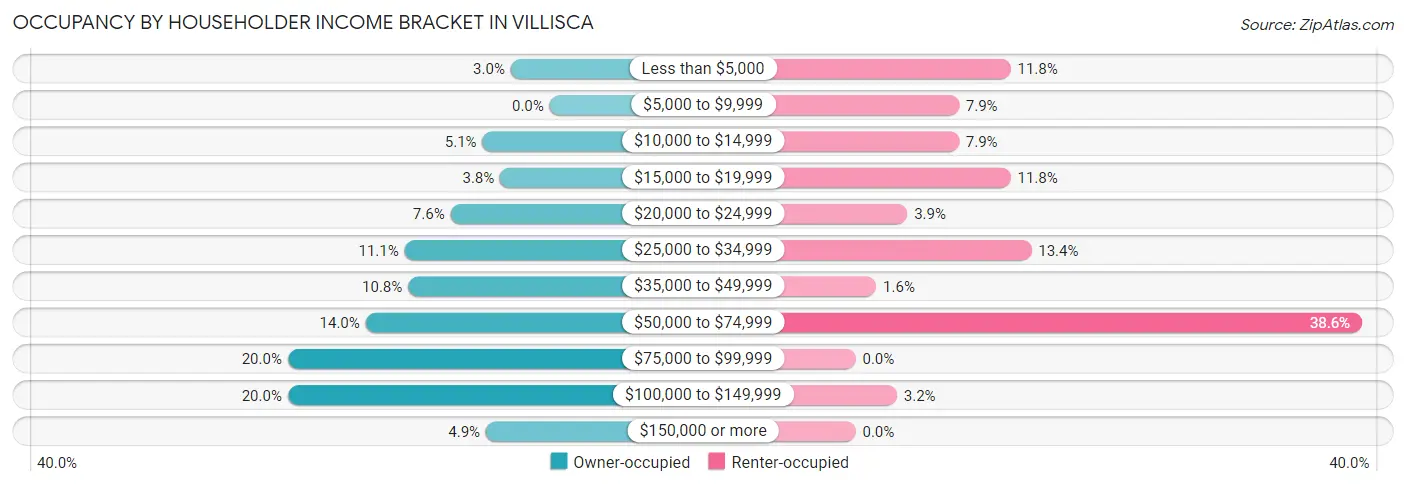
| Income Bracket | Owner-occupied | Renter-occupied |
| Less than $5,000 | 11 (3.0%) | 15 (11.8%) |
| $5,000 to $9,999 | 0 (0.0%) | 10 (7.9%) |
| $10,000 to $14,999 | 19 (5.1%) | 10 (7.9%) |
| $15,000 to $19,999 | 14 (3.8%) | 15 (11.8%) |
| $20,000 to $24,999 | 28 (7.5%) | 5 (3.9%) |
| $25,000 to $34,999 | 41 (11.1%) | 17 (13.4%) |
| $35,000 to $49,999 | 40 (10.8%) | 2 (1.6%) |
| $50,000 to $74,999 | 52 (14.0%) | 49 (38.6%) |
| $75,000 to $99,999 | 74 (20.0%) | 0 (0.0%) |
| $100,000 to $149,999 | 74 (20.0%) | 4 (3.2%) |
| $150,000 or more | 18 (4.9%) | 0 (0.0%) |
| Total | 371 (100.0%) | 127 (100.0%) |
Monthly Housing Cost Tiers in Villisca
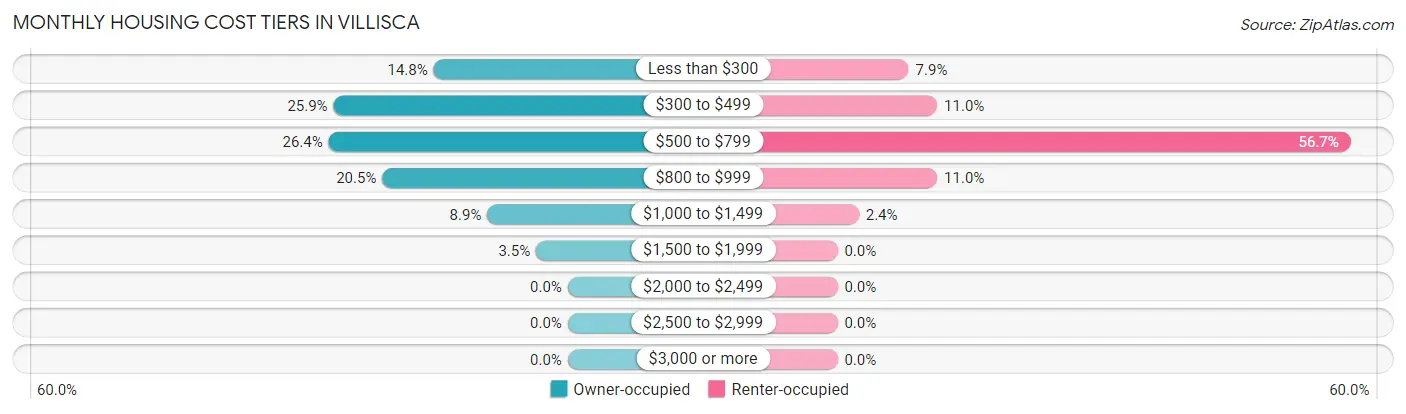
| Monthly Cost | Owner-occupied | Renter-occupied |
| Less than $300 | 55 (14.8%) | 10 (7.9%) |
| $300 to $499 | 96 (25.9%) | 14 (11.0%) |
| $500 to $799 | 98 (26.4%) | 72 (56.7%) |
| $800 to $999 | 76 (20.5%) | 14 (11.0%) |
| $1,000 to $1,499 | 33 (8.9%) | 3 (2.4%) |
| $1,500 to $1,999 | 13 (3.5%) | 0 (0.0%) |
| $2,000 to $2,499 | 0 (0.0%) | 0 (0.0%) |
| $2,500 to $2,999 | 0 (0.0%) | 0 (0.0%) |
| $3,000 or more | 0 (0.0%) | 0 (0.0%) |
| Total | 371 (100.0%) | 127 (100.0%) |
Physical Housing Characteristics in Villisca
Housing Structures in Villisca
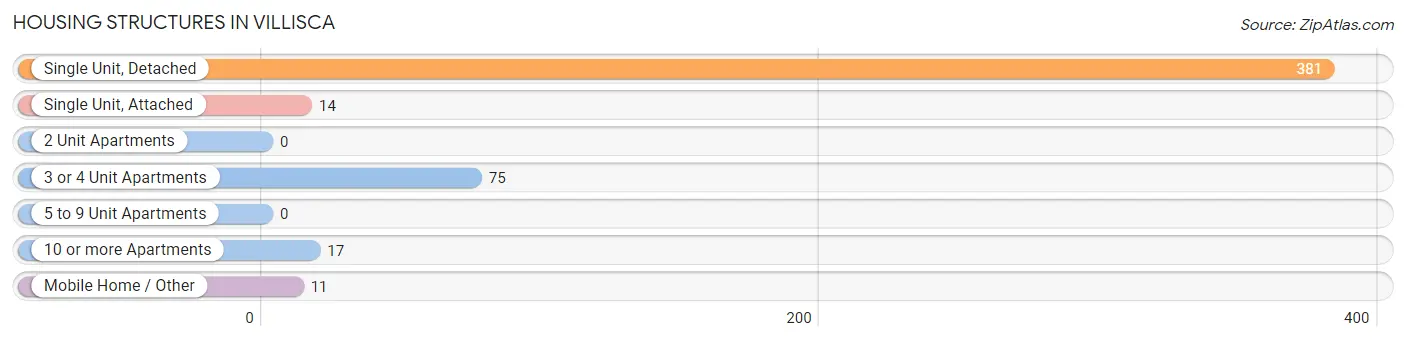
| Structure Type | # Housing Units | % Housing Units |
| Single Unit, Detached | 381 | 76.5% |
| Single Unit, Attached | 14 | 2.8% |
| 2 Unit Apartments | 0 | 0.0% |
| 3 or 4 Unit Apartments | 75 | 15.1% |
| 5 to 9 Unit Apartments | 0 | 0.0% |
| 10 or more Apartments | 17 | 3.4% |
| Mobile Home / Other | 11 | 2.2% |
| Total | 498 | 100.0% |
Housing Structures by Occupancy in Villisca
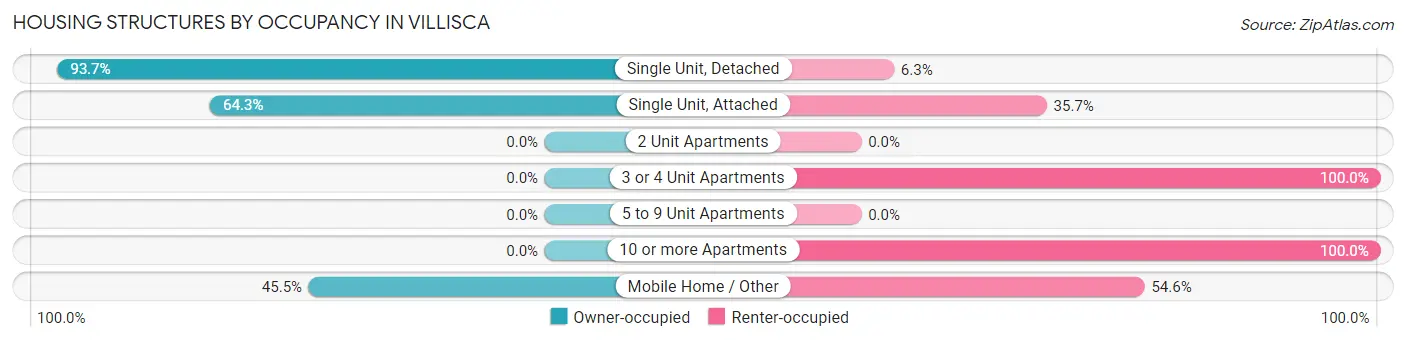
| Structure Type | Owner-occupied | Renter-occupied |
| Single Unit, Detached | 357 (93.7%) | 24 (6.3%) |
| Single Unit, Attached | 9 (64.3%) | 5 (35.7%) |
| 2 Unit Apartments | 0 (0.0%) | 0 (0.0%) |
| 3 or 4 Unit Apartments | 0 (0.0%) | 75 (100.0%) |
| 5 to 9 Unit Apartments | 0 (0.0%) | 0 (0.0%) |
| 10 or more Apartments | 0 (0.0%) | 17 (100.0%) |
| Mobile Home / Other | 5 (45.5%) | 6 (54.5%) |
| Total | 371 (74.5%) | 127 (25.5%) |
Housing Structures by Number of Rooms in Villisca
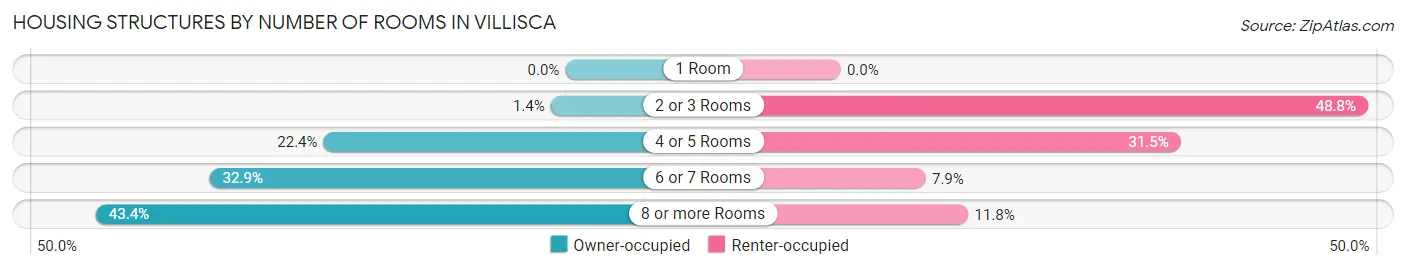
| Number of Rooms | Owner-occupied | Renter-occupied |
| 1 Room | 0 (0.0%) | 0 (0.0%) |
| 2 or 3 Rooms | 5 (1.3%) | 62 (48.8%) |
| 4 or 5 Rooms | 83 (22.4%) | 40 (31.5%) |
| 6 or 7 Rooms | 122 (32.9%) | 10 (7.9%) |
| 8 or more Rooms | 161 (43.4%) | 15 (11.8%) |
| Total | 371 (100.0%) | 127 (100.0%) |
Housing Structure by Heating Type in Villisca
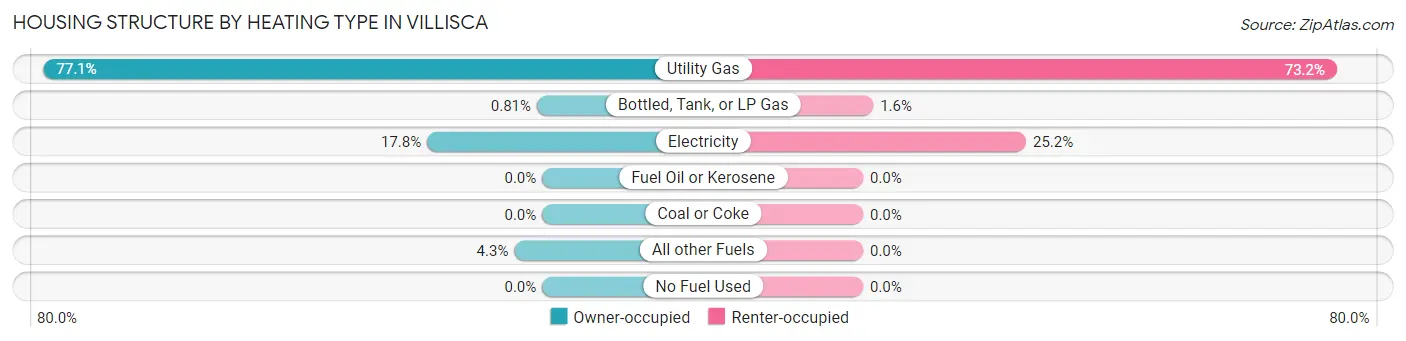
| Heating Type | Owner-occupied | Renter-occupied |
| Utility Gas | 286 (77.1%) | 93 (73.2%) |
| Bottled, Tank, or LP Gas | 3 (0.8%) | 2 (1.6%) |
| Electricity | 66 (17.8%) | 32 (25.2%) |
| Fuel Oil or Kerosene | 0 (0.0%) | 0 (0.0%) |
| Coal or Coke | 0 (0.0%) | 0 (0.0%) |
| All other Fuels | 16 (4.3%) | 0 (0.0%) |
| No Fuel Used | 0 (0.0%) | 0 (0.0%) |
| Total | 371 (100.0%) | 127 (100.0%) |
Household Vehicle Usage in Villisca
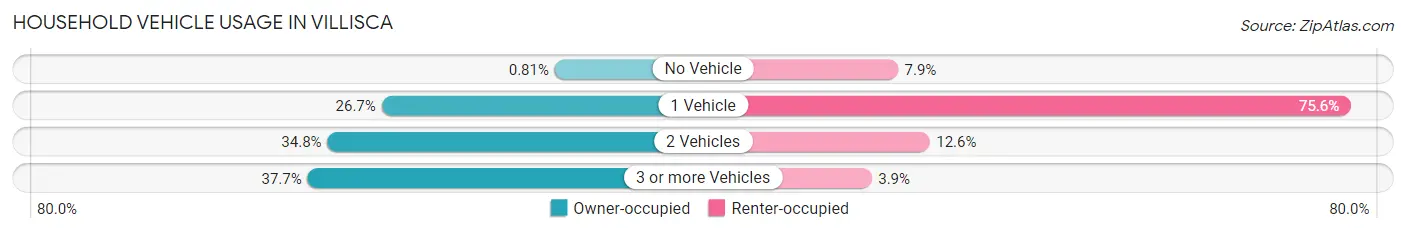
| Vehicles per Household | Owner-occupied | Renter-occupied |
| No Vehicle | 3 (0.8%) | 10 (7.9%) |
| 1 Vehicle | 99 (26.7%) | 96 (75.6%) |
| 2 Vehicles | 129 (34.8%) | 16 (12.6%) |
| 3 or more Vehicles | 140 (37.7%) | 5 (3.9%) |
| Total | 371 (100.0%) | 127 (100.0%) |
Real Estate & Mortgages in Villisca
Real Estate and Mortgage Overview in Villisca
| Characteristic | Without Mortgage | With Mortgage |
| Housing Units | 207 | 164 |
| Median Property Value | $66,100 | $81,400 |
| Median Household Income | $55,179 | $4 |
| Monthly Housing Costs | $405 | $0 |
| Real Estate Taxes | $1,225 | $0 |
Property Value by Mortgage Status in Villisca
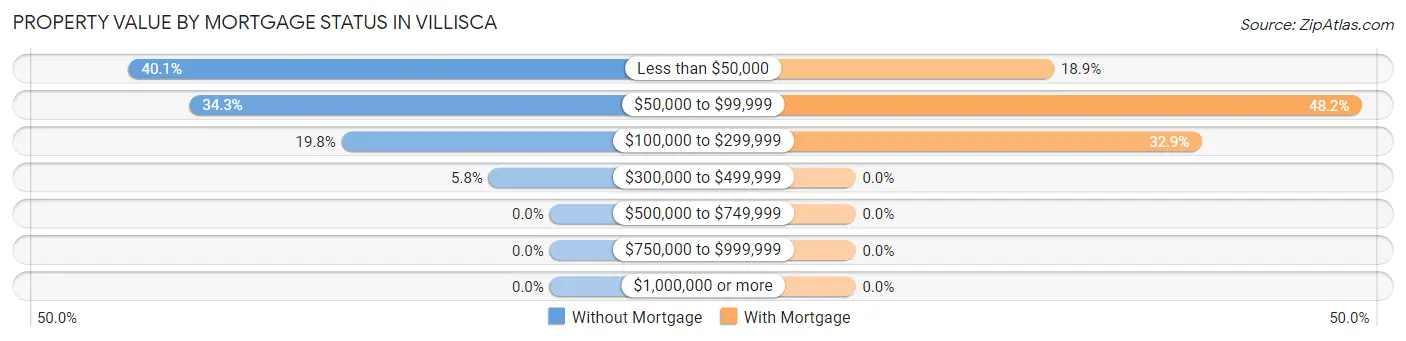
| Property Value | Without Mortgage | With Mortgage |
| Less than $50,000 | 83 (40.1%) | 31 (18.9%) |
| $50,000 to $99,999 | 71 (34.3%) | 79 (48.2%) |
| $100,000 to $299,999 | 41 (19.8%) | 54 (32.9%) |
| $300,000 to $499,999 | 12 (5.8%) | 0 (0.0%) |
| $500,000 to $749,999 | 0 (0.0%) | 0 (0.0%) |
| $750,000 to $999,999 | 0 (0.0%) | 0 (0.0%) |
| $1,000,000 or more | 0 (0.0%) | 0 (0.0%) |
| Total | 207 (100.0%) | 164 (100.0%) |
Household Income by Mortgage Status in Villisca
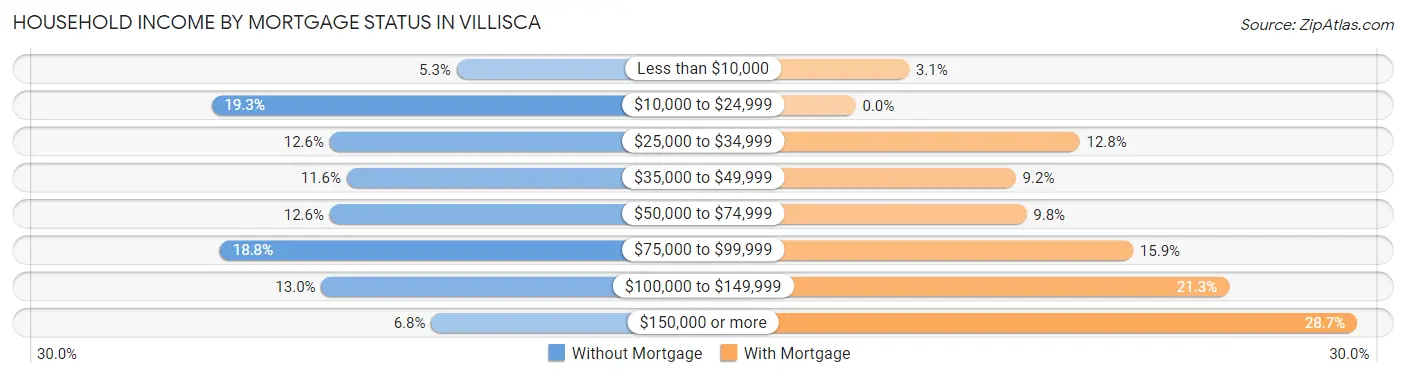
| Household Income | Without Mortgage | With Mortgage |
| Less than $10,000 | 11 (5.3%) | 5 (3.0%) |
| $10,000 to $24,999 | 40 (19.3%) | 0 (0.0%) |
| $25,000 to $34,999 | 26 (12.6%) | 21 (12.8%) |
| $35,000 to $49,999 | 24 (11.6%) | 15 (9.1%) |
| $50,000 to $74,999 | 26 (12.6%) | 16 (9.8%) |
| $75,000 to $99,999 | 39 (18.8%) | 26 (15.9%) |
| $100,000 to $149,999 | 27 (13.0%) | 35 (21.3%) |
| $150,000 or more | 14 (6.8%) | 47 (28.7%) |
| Total | 207 (100.0%) | 164 (100.0%) |
Property Value to Household Income Ratio in Villisca
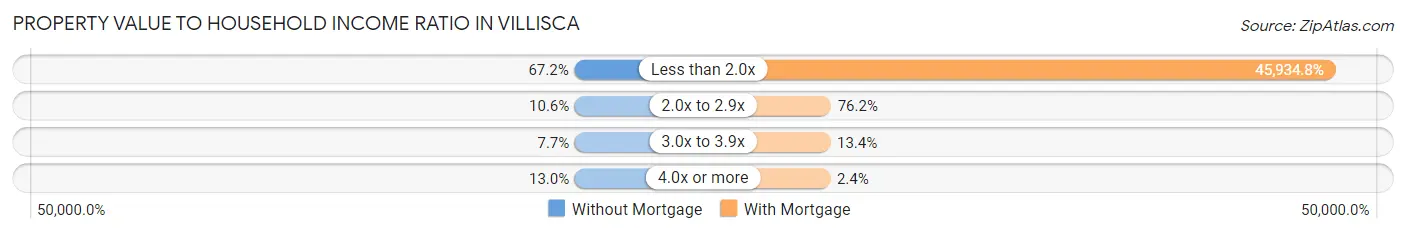
| Value-to-Income Ratio | Without Mortgage | With Mortgage |
| Less than 2.0x | 139 (67.1%) | 75,333 (45,934.8%) |
| 2.0x to 2.9x | 22 (10.6%) | 125 (76.2%) |
| 3.0x to 3.9x | 16 (7.7%) | 22 (13.4%) |
| 4.0x or more | 27 (13.0%) | 4 (2.4%) |
| Total | 207 (100.0%) | 164 (100.0%) |
Real Estate Taxes by Mortgage Status in Villisca
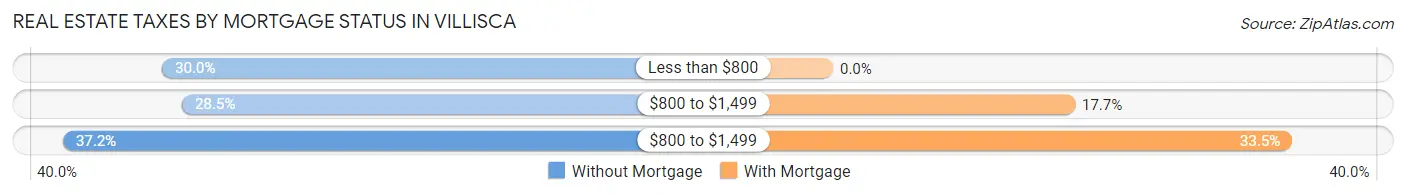
| Property Taxes | Without Mortgage | With Mortgage |
| Less than $800 | 62 (29.9%) | 0 (0.0%) |
| $800 to $1,499 | 59 (28.5%) | 29 (17.7%) |
| $800 to $1,499 | 77 (37.2%) | 55 (33.5%) |
| Total | 207 (100.0%) | 164 (100.0%) |
Health & Disability in Villisca
Health Insurance Coverage by Age in Villisca
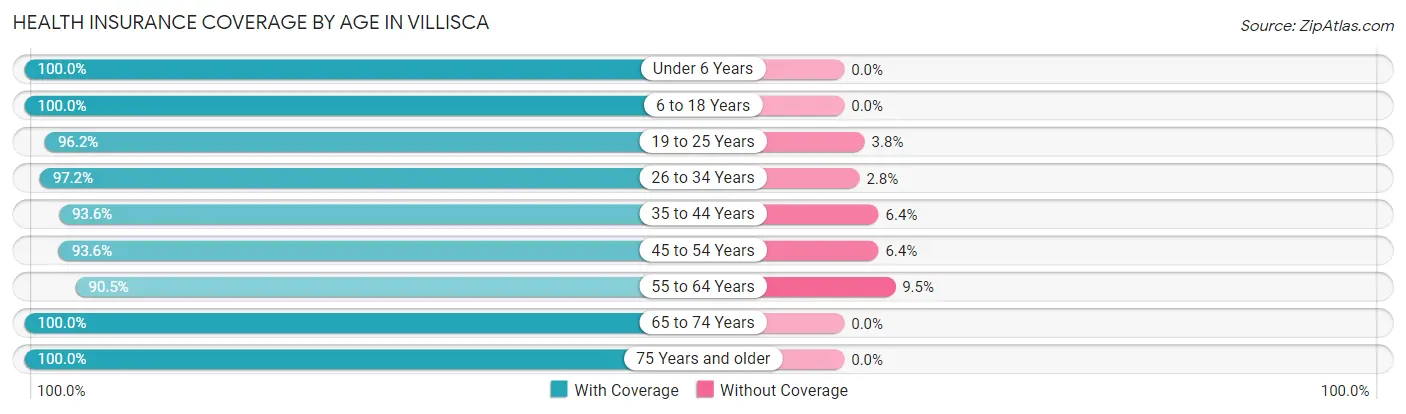
| Age Bracket | With Coverage | Without Coverage |
| Under 6 Years | 95 (100.0%) | 0 (0.0%) |
| 6 to 18 Years | 154 (100.0%) | 0 (0.0%) |
| 19 to 25 Years | 76 (96.2%) | 3 (3.8%) |
| 26 to 34 Years | 137 (97.2%) | 4 (2.8%) |
| 35 to 44 Years | 73 (93.6%) | 5 (6.4%) |
| 45 to 54 Years | 88 (93.6%) | 6 (6.4%) |
| 55 to 64 Years | 124 (90.5%) | 13 (9.5%) |
| 65 to 74 Years | 143 (100.0%) | 0 (0.0%) |
| 75 Years and older | 111 (100.0%) | 0 (0.0%) |
| Total | 1,001 (97.0%) | 31 (3.0%) |
Health Insurance Coverage by Citizenship Status in Villisca
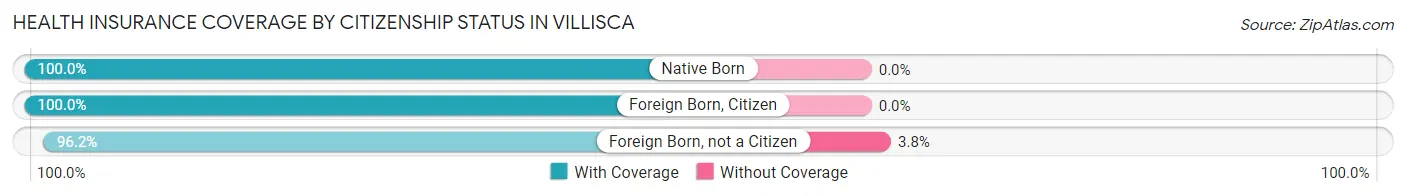
| Citizenship Status | With Coverage | Without Coverage |
| Native Born | 95 (100.0%) | 0 (0.0%) |
| Foreign Born, Citizen | 154 (100.0%) | 0 (0.0%) |
| Foreign Born, not a Citizen | 76 (96.2%) | 3 (3.8%) |
Health Insurance Coverage by Household Income in Villisca
| Household Income | With Coverage | Without Coverage |
| Under $25,000 | 241 (96.8%) | 8 (3.2%) |
| $25,000 to $49,999 | 155 (98.7%) | 2 (1.3%) |
| $50,000 to $74,999 | 184 (96.8%) | 6 (3.2%) |
| $75,000 to $99,999 | 167 (100.0%) | 0 (0.0%) |
| $100,000 and over | 254 (94.4%) | 15 (5.6%) |
Public vs Private Health Insurance Coverage by Age in Villisca
| Age Bracket | Public Insurance | Private Insurance |
| Under 6 | 54 (56.8%) | 47 (49.5%) |
| 6 to 18 Years | 87 (56.5%) | 67 (43.5%) |
| 19 to 25 Years | 24 (30.4%) | 63 (79.7%) |
| 25 to 34 Years | 70 (49.6%) | 98 (69.5%) |
| 35 to 44 Years | 17 (21.8%) | 62 (79.5%) |
| 45 to 54 Years | 15 (16.0%) | 83 (88.3%) |
| 55 to 64 Years | 46 (33.6%) | 92 (67.1%) |
| 65 to 74 Years | 143 (100.0%) | 68 (47.5%) |
| 75 Years and over | 111 (100.0%) | 81 (73.0%) |
| Total | 567 (54.9%) | 661 (64.0%) |
Disability Status by Sex by Age in Villisca
| Age Bracket | Male | Female |
| Under 5 Years | 0 (0.0%) | 0 (0.0%) |
| 5 to 17 Years | 16 (20.3%) | 8 (8.7%) |
| 18 to 34 Years | 1 (0.9%) | 10 (9.3%) |
| 35 to 64 Years | 26 (16.8%) | 32 (20.8%) |
| 65 to 74 Years | 29 (45.3%) | 15 (19.0%) |
| 75 Years and over | 22 (45.8%) | 23 (36.5%) |
Disability Class by Sex by Age in Villisca
Disability Class: Hearing Difficulty
| Age Bracket | Male | Female |
| Under 5 Years | 0 (0.0%) | 0 (0.0%) |
| 5 to 17 Years | 0 (0.0%) | 0 (0.0%) |
| 18 to 34 Years | 0 (0.0%) | 0 (0.0%) |
| 35 to 64 Years | 10 (6.5%) | 0 (0.0%) |
| 65 to 74 Years | 12 (18.8%) | 3 (3.8%) |
| 75 Years and over | 13 (27.1%) | 4 (6.4%) |
Disability Class: Vision Difficulty
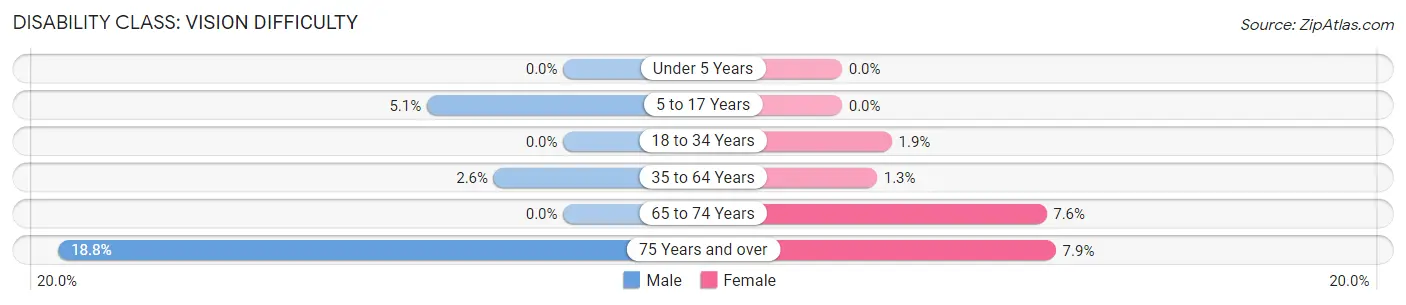
| Age Bracket | Male | Female |
| Under 5 Years | 0 (0.0%) | 0 (0.0%) |
| 5 to 17 Years | 4 (5.1%) | 0 (0.0%) |
| 18 to 34 Years | 0 (0.0%) | 2 (1.8%) |
| 35 to 64 Years | 4 (2.6%) | 2 (1.3%) |
| 65 to 74 Years | 0 (0.0%) | 6 (7.6%) |
| 75 Years and over | 9 (18.8%) | 5 (7.9%) |
Disability Class: Cognitive Difficulty
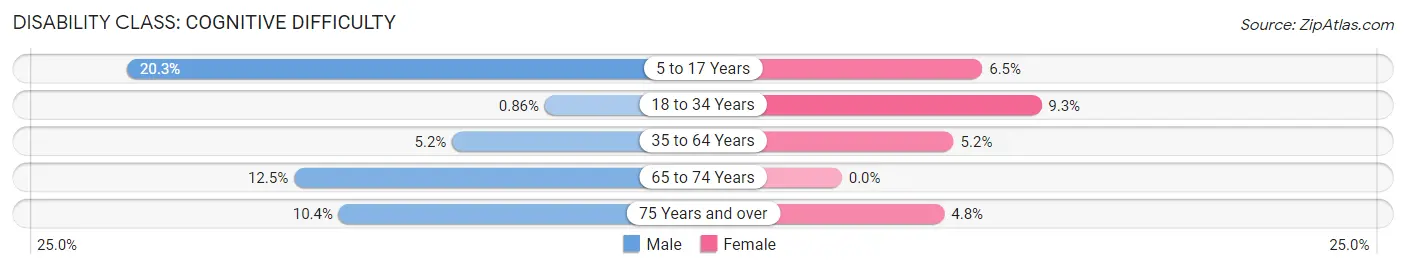
| Age Bracket | Male | Female |
| 5 to 17 Years | 16 (20.3%) | 6 (6.5%) |
| 18 to 34 Years | 1 (0.9%) | 10 (9.3%) |
| 35 to 64 Years | 8 (5.2%) | 8 (5.2%) |
| 65 to 74 Years | 8 (12.5%) | 0 (0.0%) |
| 75 Years and over | 5 (10.4%) | 3 (4.8%) |
Disability Class: Ambulatory Difficulty
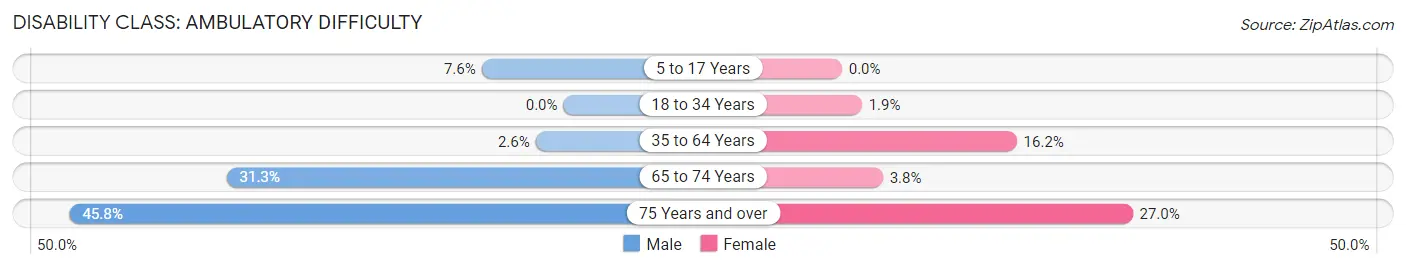
| Age Bracket | Male | Female |
| 5 to 17 Years | 6 (7.6%) | 0 (0.0%) |
| 18 to 34 Years | 0 (0.0%) | 2 (1.8%) |
| 35 to 64 Years | 4 (2.6%) | 25 (16.2%) |
| 65 to 74 Years | 20 (31.2%) | 3 (3.8%) |
| 75 Years and over | 22 (45.8%) | 17 (27.0%) |
Disability Class: Self-Care Difficulty
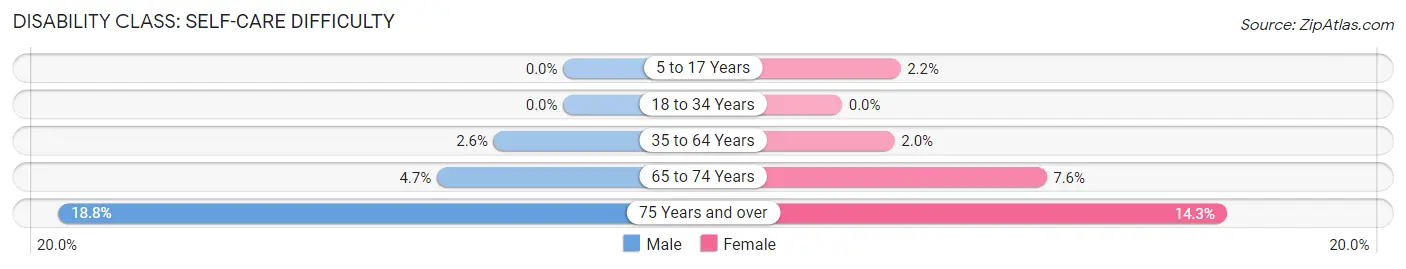
| Age Bracket | Male | Female |
| 5 to 17 Years | 0 (0.0%) | 2 (2.2%) |
| 18 to 34 Years | 0 (0.0%) | 0 (0.0%) |
| 35 to 64 Years | 4 (2.6%) | 3 (1.9%) |
| 65 to 74 Years | 3 (4.7%) | 6 (7.6%) |
| 75 Years and over | 9 (18.8%) | 9 (14.3%) |
Technology Access in Villisca
Computing Device Access in Villisca
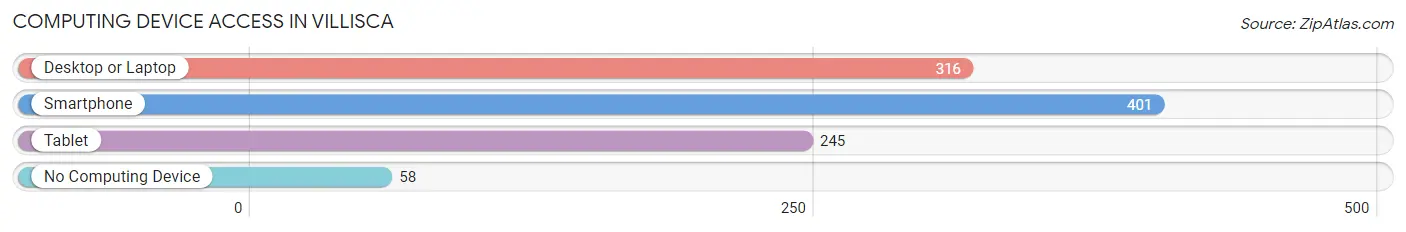
| Device Type | # Households | % Households |
| Desktop or Laptop | 316 | 63.4% |
| Smartphone | 401 | 80.5% |
| Tablet | 245 | 49.2% |
| No Computing Device | 58 | 11.7% |
| Total | 498 | 100.0% |
Internet Access in Villisca
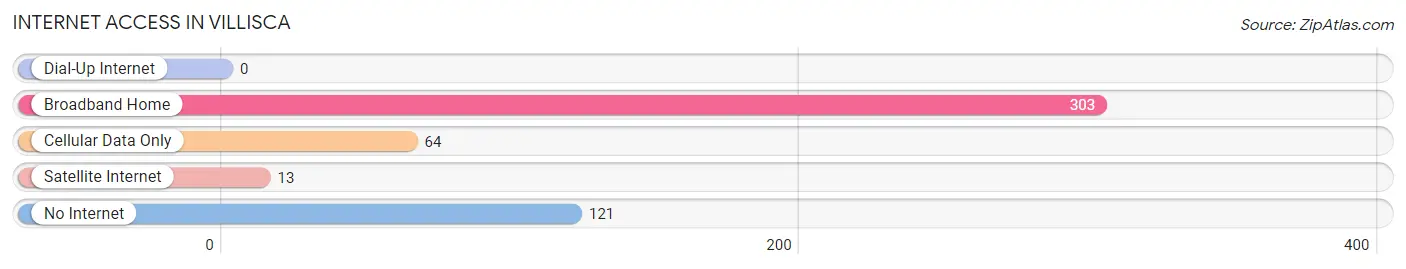
| Internet Type | # Households | % Households |
| Dial-Up Internet | 0 | 0.0% |
| Broadband Home | 303 | 60.8% |
| Cellular Data Only | 64 | 12.9% |
| Satellite Internet | 13 | 2.6% |
| No Internet | 121 | 24.3% |
| Total | 498 | 100.0% |
Villisca Summary
Villisca, Iowa is a small town located in Montgomery County in the southwestern part of the state. It is situated along the Middle Nodaway River, about 25 miles east of the Missouri border. The town was founded in 1869 and was named after the nearby Villisca Creek. As of the 2010 census, the population of Villisca was 1,252.
Geography
Villisca is located at 40°59'N 94°59'W (40.983, -94.983). It is situated in the Loess Hills region of Iowa, which is characterized by rolling hills and deep ravines. The town is located on the Middle Nodaway River, which flows through the town and is a tributary of the Nodaway River. The town is located in the Central Time Zone and has an elevation of 1,072 feet.
Economy
Villisca is a small rural town and the economy is largely based on agriculture. The town is home to several grain elevators, a feed mill, and a fertilizer plant. The town also has a few small businesses, including a grocery store, a hardware store, and a few restaurants. The town is also home to a few manufacturing companies, including a furniture factory and a plastics factory.
Demographics
As of the 2010 census, the population of Villisca was 1,252. The racial makeup of the town was 97.2% White, 0.2% African American, 0.2% Native American, 0.2% Asian, 0.2% from other races, and 1.9% from two or more races. Hispanic or Latino of any race were 1.2% of the population.
The median income for a household in the town was $41,250, and the median income for a family was $48,750. The per capita income for the town was $19,945. About 8.2% of families and 10.2% of the population were below the poverty line, including 14.2% of those under age 18 and 8.2% of those age 65 or over.
History
Villisca was founded in 1869 and was named after the nearby Villisca Creek. The town was originally a farming community and the economy was largely based on agriculture. In the early 1900s, the town began to grow and several businesses were established, including a furniture factory, a feed mill, and a fertilizer plant.
In 1912, the town was the site of a gruesome murder that remains unsolved to this day. On the night of June 10, 1912, eight people were found bludgeoned to death in the Moore family home. The victims included Josiah and Sarah Moore, their four children, and two of their guests. The crime remains unsolved and has become the subject of numerous books and films.
In the late 20th century, Villisca began to decline as the population began to move away from the town. The town has since seen a resurgence in recent years, with several new businesses opening and the population increasing. The town is now a popular tourist destination, with visitors coming to explore the town's history and visit the site of the infamous 1912 murders.
Common Questions
What is Per Capita Income in Villisca?
Per Capita income in Villisca is $28,535.
What is the Median Family Income in Villisca?
Median Family Income in Villisca is $73,194.
What is the Median Household income in Villisca?
Median Household Income in Villisca is $55,625.
What is Income or Wage Gap in Villisca?
Income or Wage Gap in Villisca is 43.7%.
Women in Villisca earn 56.3 cents for every dollar earned by a man.
What is Inequality or Gini Index in Villisca?
Inequality or Gini Index in Villisca is 0.39.
What is the Total Population of Villisca?
Total Population of Villisca is 1,071.
What is the Total Male Population of Villisca?
Total Male Population of Villisca is 508.
What is the Total Female Population of Villisca?
Total Female Population of Villisca is 563.
What is the Ratio of Males per 100 Females in Villisca?
There are 90.23 Males per 100 Females in Villisca.
What is the Ratio of Females per 100 Males in Villisca?
There are 110.83 Females per 100 Males in Villisca.
What is the Median Population Age in Villisca?
Median Population Age in Villisca is 44.2 Years.
What is the Average Family Size in Villisca
Average Family Size in Villisca is 2.9 People.
What is the Average Household Size in Villisca
Average Household Size in Villisca is 2.1 People.
How Large is the Labor Force in Villisca?
There are 472 People in the Labor Forcein in Villisca.
What is the Percentage of People in the Labor Force in Villisca?
56.6% of People are in the Labor Force in Villisca.
What is the Unemployment Rate in Villisca?
Unemployment Rate in Villisca is 1.9%.