Osterdock, IA Map & Demographics
Osterdock Map
Osterdock Overview
$20,334
PER CAPITA INCOME
$46,302
AVG FAMILY INCOME
$47,031
AVG HOUSEHOLD INCOME
0.20
INEQUALITY / GINI INDEX
151
TOTAL POPULATION
81
MALE POPULATION
70
FEMALE POPULATION
115.71
MALES / 100 FEMALES
86.42
FEMALES / 100 MALES
57.9
MEDIAN AGE
3.1
AVG FAMILY SIZE
2.6
AVG HOUSEHOLD SIZE
58
LABOR FORCE [ PEOPLE ]
45.0%
PERCENT IN LABOR FORCE
39.7%
UNEMPLOYMENT RATE
Income in Osterdock
Income Overview in Osterdock
Per Capita Income in Osterdock is $20,334, while median incomes of families and households are $46,302 and $47,031 respectively.
| Characteristic | Number | Measure |
| Per Capita Income | 151 | $20,334 |
| Median Family Income | 41 | $46,302 |
| Mean Family Income | 41 | $57,115 |
| Median Household Income | 57 | $47,031 |
| Mean Household Income | 57 | $55,651 |
| Income Deficit | 41 | $0 |
| Wage / Income Gap (%) | 151 | 0.00% |
| Wage / Income Gap ($) | 151 | 100.00¢ per $1 |
| Gini / Inequality Index | 151 | 0.20 |
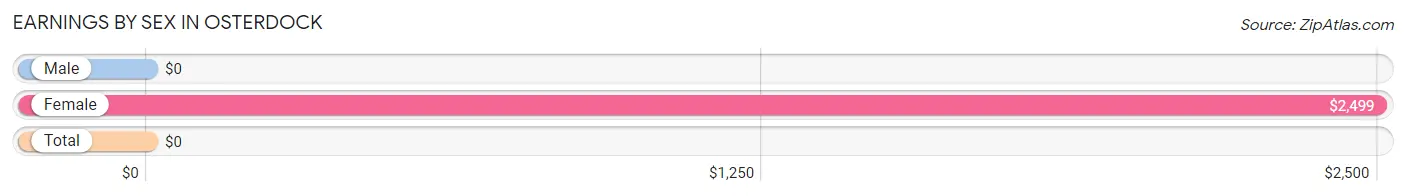
Earnings by Sex in Osterdock
| Sex | Number | Average Earnings |
| Male | 28 (53.8%) | $0 |
| Female | 24 (46.2%) | $2,499 |
| Total | 52 (100.0%) | $0 |
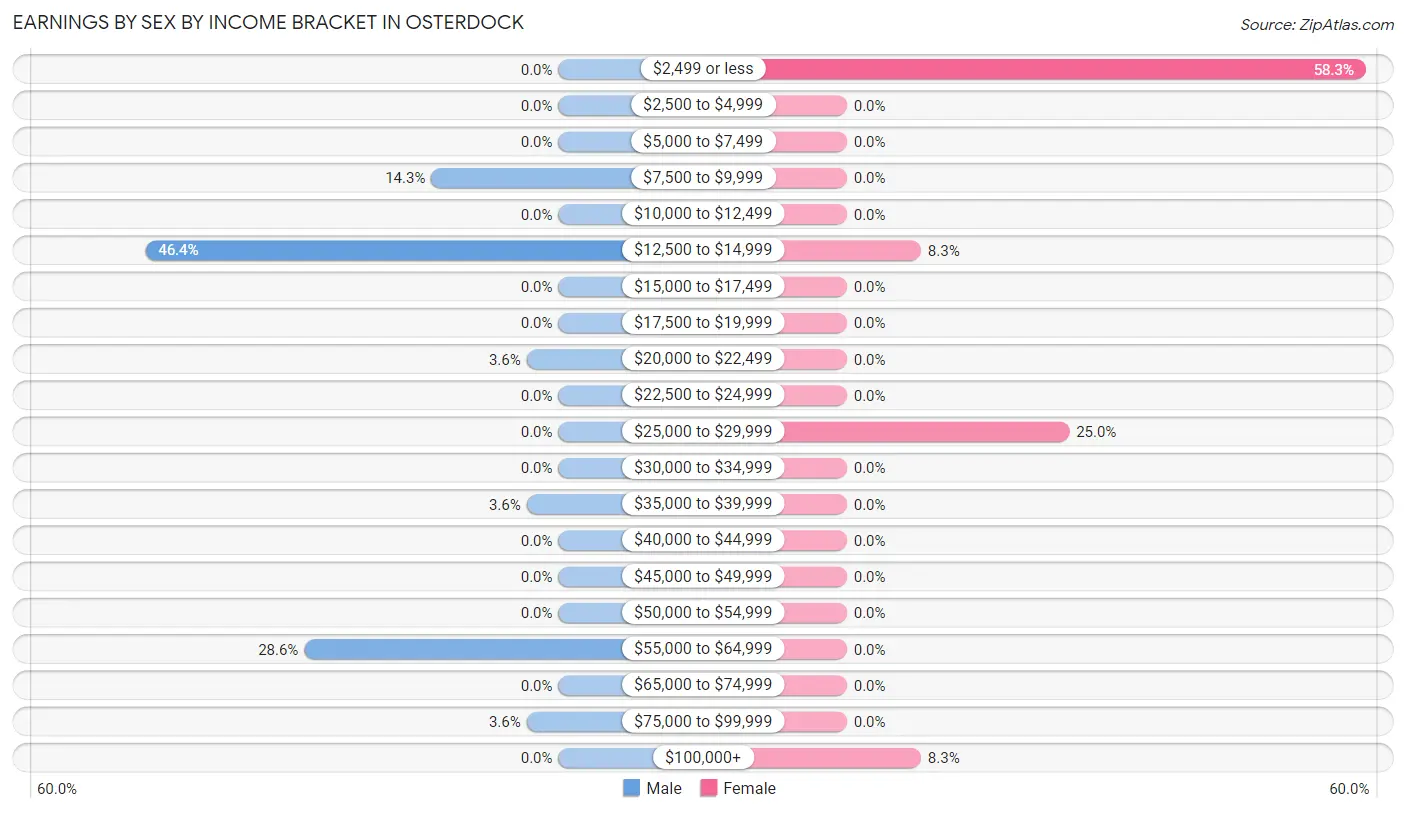
Earnings by Sex by Income Bracket in Osterdock
The most common earnings brackets in Osterdock are $12,500 to $14,999 for men (13 | 46.4%) and $2,499 or less for women (14 | 58.3%).
| Income | Male | Female |
| $2,499 or less | 0 (0.0%) | 14 (58.3%) |
| $2,500 to $4,999 | 0 (0.0%) | 0 (0.0%) |
| $5,000 to $7,499 | 0 (0.0%) | 0 (0.0%) |
| $7,500 to $9,999 | 4 (14.3%) | 0 (0.0%) |
| $10,000 to $12,499 | 0 (0.0%) | 0 (0.0%) |
| $12,500 to $14,999 | 13 (46.4%) | 2 (8.3%) |
| $15,000 to $17,499 | 0 (0.0%) | 0 (0.0%) |
| $17,500 to $19,999 | 0 (0.0%) | 0 (0.0%) |
| $20,000 to $22,499 | 1 (3.6%) | 0 (0.0%) |
| $22,500 to $24,999 | 0 (0.0%) | 0 (0.0%) |
| $25,000 to $29,999 | 0 (0.0%) | 6 (25.0%) |
| $30,000 to $34,999 | 0 (0.0%) | 0 (0.0%) |
| $35,000 to $39,999 | 1 (3.6%) | 0 (0.0%) |
| $40,000 to $44,999 | 0 (0.0%) | 0 (0.0%) |
| $45,000 to $49,999 | 0 (0.0%) | 0 (0.0%) |
| $50,000 to $54,999 | 0 (0.0%) | 0 (0.0%) |
| $55,000 to $64,999 | 8 (28.6%) | 0 (0.0%) |
| $65,000 to $74,999 | 0 (0.0%) | 0 (0.0%) |
| $75,000 to $99,999 | 1 (3.6%) | 0 (0.0%) |
| $100,000+ | 0 (0.0%) | 2 (8.3%) |
| Total | 28 (100.0%) | 24 (100.0%) |
Earnings by Sex by Educational Attainment in Osterdock
| Educational Attainment | Male Income | Female Income |
| Less than High School | - | - |
| High School Diploma | - | - |
| College or Associate's Degree | - | - |
| Bachelor's Degree | - | - |
| Graduate Degree | - | - |
| Total | - | - |
Family Income in Osterdock
Family Income Brackets in Osterdock
According to the Osterdock family income data, there are 25 families falling into the $35,000 to $49,999 income range, which is the most common income bracket and makes up 61.0% of all families.
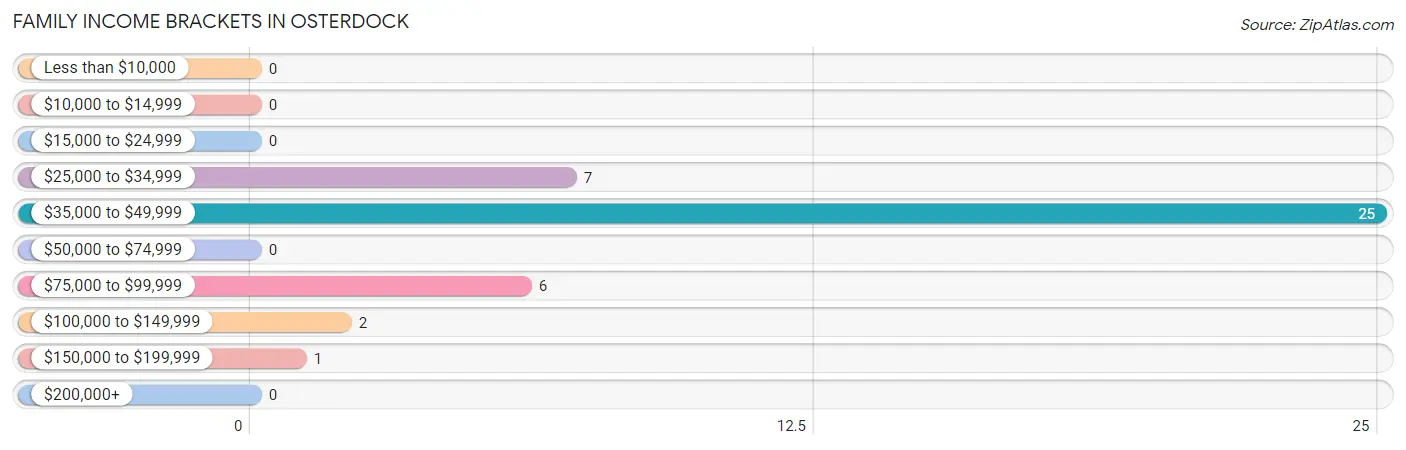
| Income Bracket | # Families | % Families |
| Less than $10,000 | 0 | 0.0% |
| $10,000 to $14,999 | 0 | 0.0% |
| $15,000 to $24,999 | 0 | 0.0% |
| $25,000 to $34,999 | 7 | 17.1% |
| $35,000 to $49,999 | 25 | 61.0% |
| $50,000 to $74,999 | 0 | 0.0% |
| $75,000 to $99,999 | 6 | 14.6% |
| $100,000 to $149,999 | 2 | 4.9% |
| $150,000 to $199,999 | 1 | 2.4% |
| $200,000+ | 0 | 0.0% |
Family Income by Famaliy Size in Osterdock
2-person families (27 | 65.8%) account for the highest median family income in Osterdock with $46,302 per family, while 2-person families (27 | 65.8%) have the highest median income of $23,151 per family member.
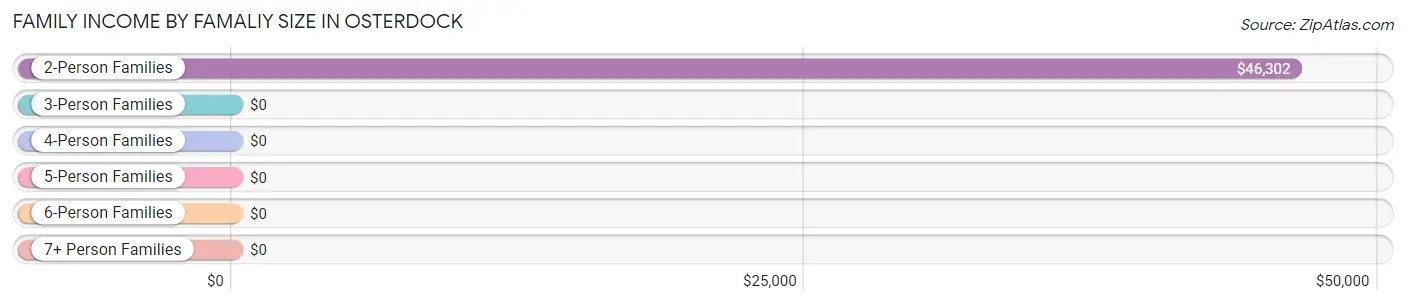
| Income Bracket | # Families | Median Income |
| 2-Person Families | 27 (65.8%) | $46,302 |
| 3-Person Families | 5 (12.2%) | $0 |
| 4-Person Families | 0 (0.0%) | $0 |
| 5-Person Families | 2 (4.9%) | $0 |
| 6-Person Families | 7 (17.1%) | $0 |
| 7+ Person Families | 0 (0.0%) | $0 |
| Total | 41 (100.0%) | $46,302 |
Family Income by Number of Earners in Osterdock
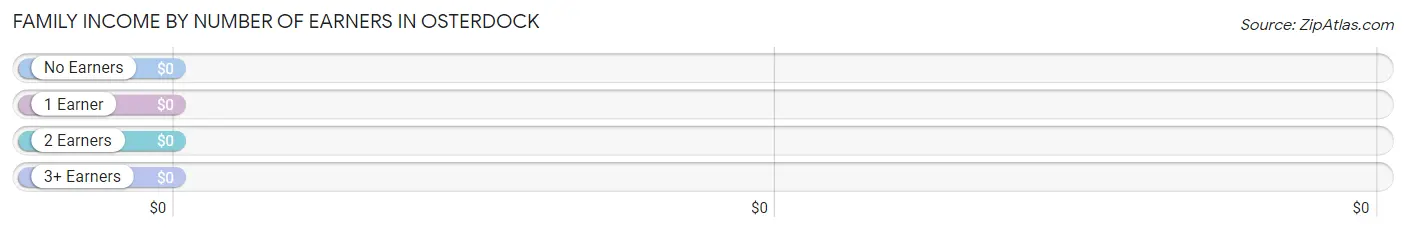
| Number of Earners | # Families | Median Income |
| No Earners | 25 (61.0%) | $0 |
| 1 Earner | 6 (14.6%) | $0 |
| 2 Earners | 10 (24.4%) | $0 |
| 3+ Earners | 0 (0.0%) | $0 |
| Total | 41 (100.0%) | $46,302 |
Household Income in Osterdock
Household Income Brackets in Osterdock
With 32 households falling in the category, the $35,000 to $49,999 income range is the most frequent in Osterdock, accounting for 56.1% of all households.
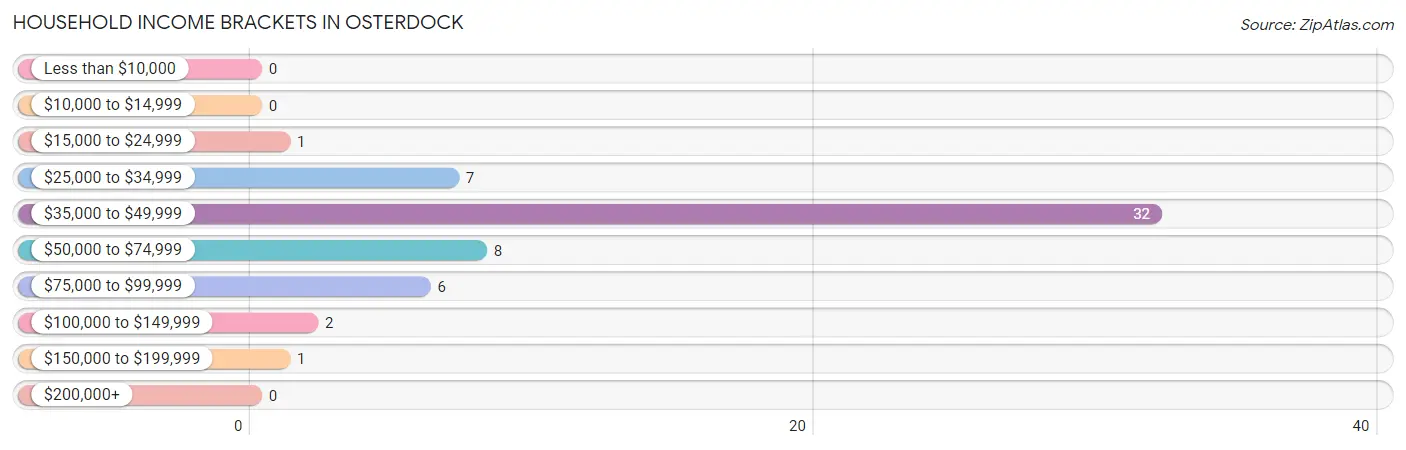
| Income Bracket | # Households | % Households |
| Less than $10,000 | 0 | 0.0% |
| $10,000 to $14,999 | 0 | 0.0% |
| $15,000 to $24,999 | 1 | 1.8% |
| $25,000 to $34,999 | 7 | 12.3% |
| $35,000 to $49,999 | 32 | 56.1% |
| $50,000 to $74,999 | 8 | 14.0% |
| $75,000 to $99,999 | 6 | 10.5% |
| $100,000 to $149,999 | 2 | 3.5% |
| $150,000 to $199,999 | 1 | 1.8% |
| $200,000+ | 0 | 0.0% |
Household Income by Householder Age in Osterdock
The median household income in Osterdock is $47,031, with the highest median household income of $49,821 found in the 45 to 64 years age bracket for the primary householder. A total of 27 households (47.4%) fall into this category.
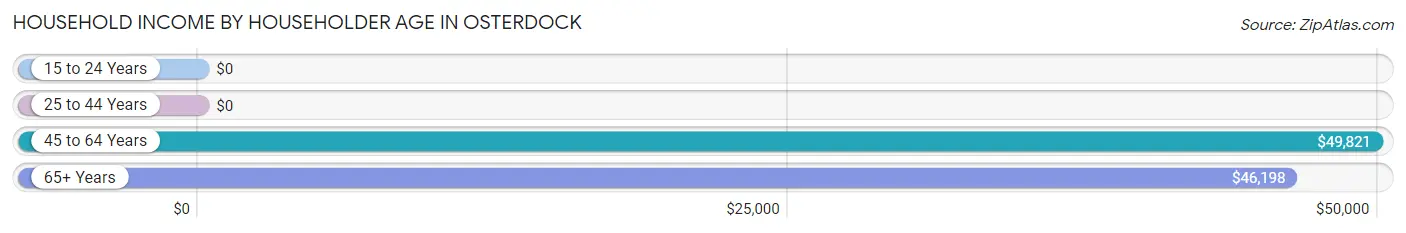
| Income Bracket | # Households | Median Income |
| 15 to 24 Years | 0 (0.0%) | $0 |
| 25 to 44 Years | 3 (5.3%) | $0 |
| 45 to 64 Years | 27 (47.4%) | $49,821 |
| 65+ Years | 27 (47.4%) | $46,198 |
| Total | 57 (100.0%) | $47,031 |
Poverty in Osterdock
Income Below Poverty by Sex and Age in Osterdock
With 39.5% poverty level for males and 38.6% for females among the residents of Osterdock, under 5 year old males and under 5 year old females are the most vulnerable to poverty, with 12 males (100.0%) and 7 females (100.0%) in their respective age groups living below the poverty level.
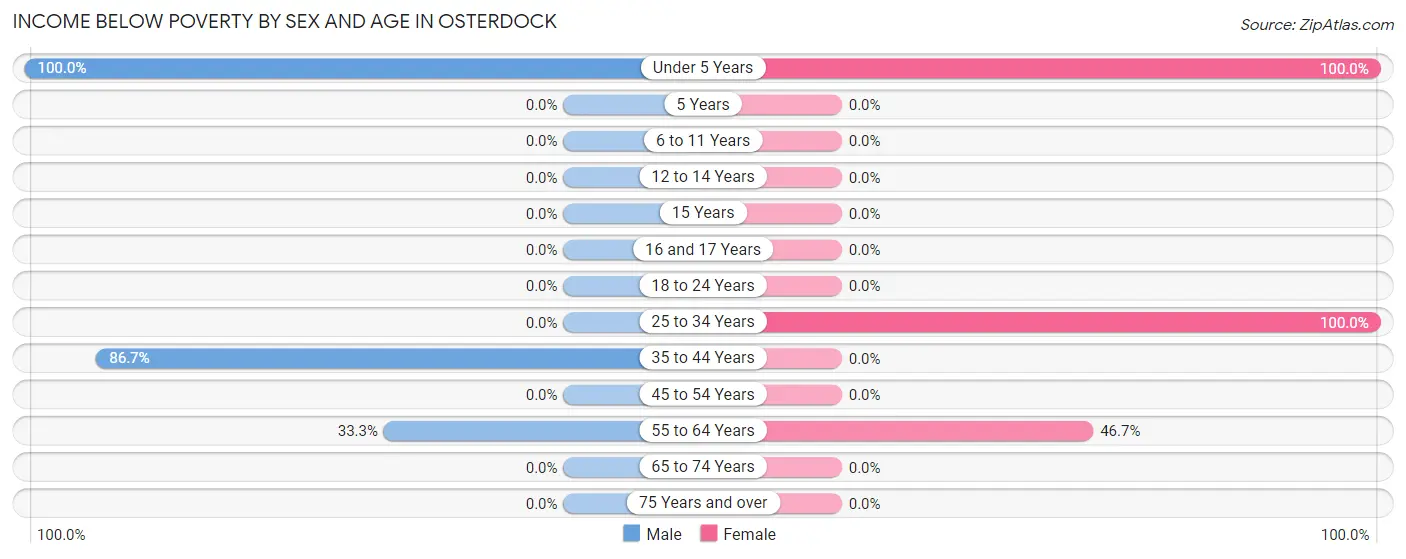
| Age Bracket | Male | Female |
| Under 5 Years | 12 (100.0%) | 7 (100.0%) |
| 5 Years | 0 (0.0%) | 0 (0.0%) |
| 6 to 11 Years | 0 (0.0%) | 0 (0.0%) |
| 12 to 14 Years | 0 (0.0%) | 0 (0.0%) |
| 15 Years | 0 (0.0%) | 0 (0.0%) |
| 16 and 17 Years | 0 (0.0%) | 0 (0.0%) |
| 18 to 24 Years | 0 (0.0%) | 0 (0.0%) |
| 25 to 34 Years | 0 (0.0%) | 13 (100.0%) |
| 35 to 44 Years | 13 (86.7%) | 0 (0.0%) |
| 45 to 54 Years | 0 (0.0%) | 0 (0.0%) |
| 55 to 64 Years | 7 (33.3%) | 7 (46.7%) |
| 65 to 74 Years | 0 (0.0%) | 0 (0.0%) |
| 75 Years and over | 0 (0.0%) | 0 (0.0%) |
| Total | 32 (39.5%) | 27 (38.6%) |
Income Above Poverty by Sex and Age in Osterdock
According to the poverty statistics in Osterdock, males aged 5 years and females aged 6 to 11 years are the age groups that are most secure financially, with 100.0% of males and 100.0% of females in these age groups living above the poverty line.
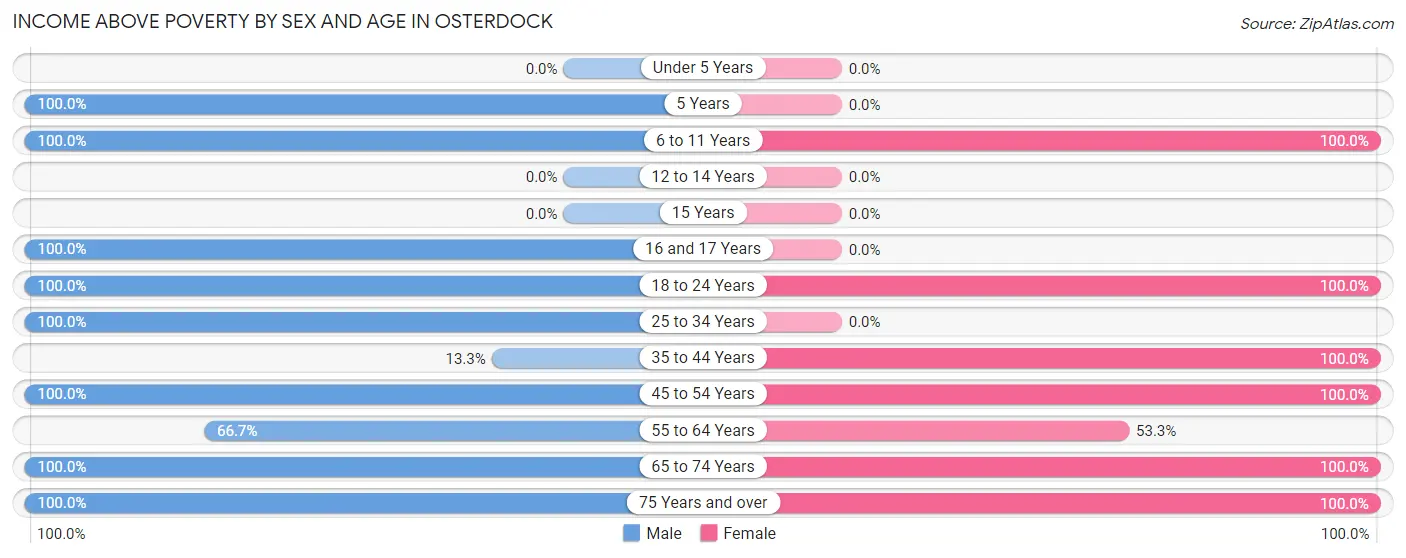
| Age Bracket | Male | Female |
| Under 5 Years | 0 (0.0%) | 0 (0.0%) |
| 5 Years | 1 (100.0%) | 0 (0.0%) |
| 6 to 11 Years | 1 (100.0%) | 1 (100.0%) |
| 12 to 14 Years | 0 (0.0%) | 0 (0.0%) |
| 15 Years | 0 (0.0%) | 0 (0.0%) |
| 16 and 17 Years | 4 (100.0%) | 0 (0.0%) |
| 18 to 24 Years | 1 (100.0%) | 4 (100.0%) |
| 25 to 34 Years | 2 (100.0%) | 0 (0.0%) |
| 35 to 44 Years | 2 (13.3%) | 1 (100.0%) |
| 45 to 54 Years | 5 (100.0%) | 2 (100.0%) |
| 55 to 64 Years | 14 (66.7%) | 8 (53.3%) |
| 65 to 74 Years | 18 (100.0%) | 25 (100.0%) |
| 75 Years and over | 1 (100.0%) | 2 (100.0%) |
| Total | 49 (60.5%) | 43 (61.4%) |
Income Below Poverty Among Married-Couple Families in Osterdock
The poverty statistics for married-couple families in Osterdock show that 20.0% or 7 of the total 35 families live below the poverty line. Families with 1 or 2 children have the highest poverty rate of 100.0%, comprising of 7 families. On the other hand, families with no children have the lowest poverty rate of 0.0%, which includes 0 families.
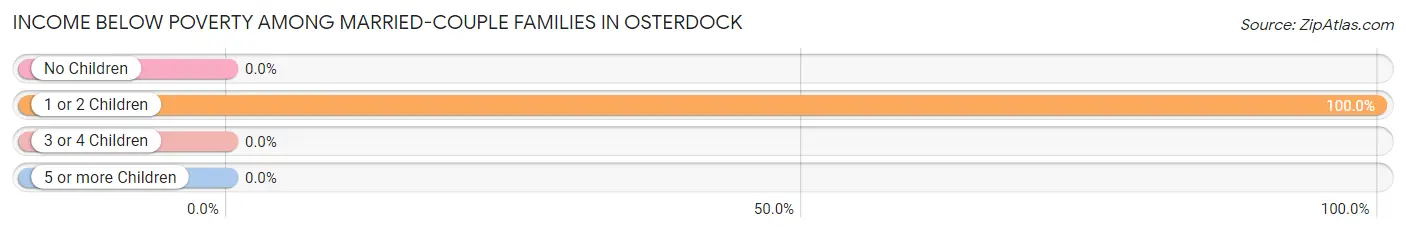
| Children | Above Poverty | Below Poverty |
| No Children | 27 (100.0%) | 0 (0.0%) |
| 1 or 2 Children | 0 (0.0%) | 7 (100.0%) |
| 3 or 4 Children | 1 (100.0%) | 0 (0.0%) |
| 5 or more Children | 0 (0.0%) | 0 (0.0%) |
| Total | 28 (80.0%) | 7 (20.0%) |
Income Below Poverty Among Single-Parent Households in Osterdock
| Children | Single Father | Single Mother |
| No Children | 0 (0.0%) | 0 (0.0%) |
| 1 or 2 Children | 0 (0.0%) | 0 (0.0%) |
| 3 or 4 Children | 0 (0.0%) | 0 (0.0%) |
| 5 or more Children | 0 (0.0%) | 0 (0.0%) |
| Total | 0 (0.0%) | 0 (0.0%) |
Income Below Poverty Among Married-Couple vs Single-Parent Households in Osterdock
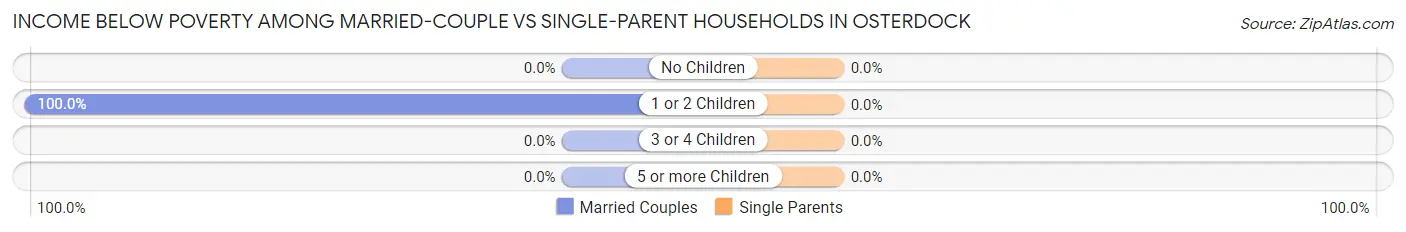
| Children | Married-Couple Families | Single-Parent Households |
| No Children | 0 (0.0%) | 0 (0.0%) |
| 1 or 2 Children | 7 (100.0%) | 0 (0.0%) |
| 3 or 4 Children | 0 (0.0%) | 0 (0.0%) |
| 5 or more Children | 0 (0.0%) | 0 (0.0%) |
| Total | 7 (20.0%) | 0 (0.0%) |
Race in Osterdock
The most populous races in Osterdock are , and White / Caucasian (151 | 100.0%).
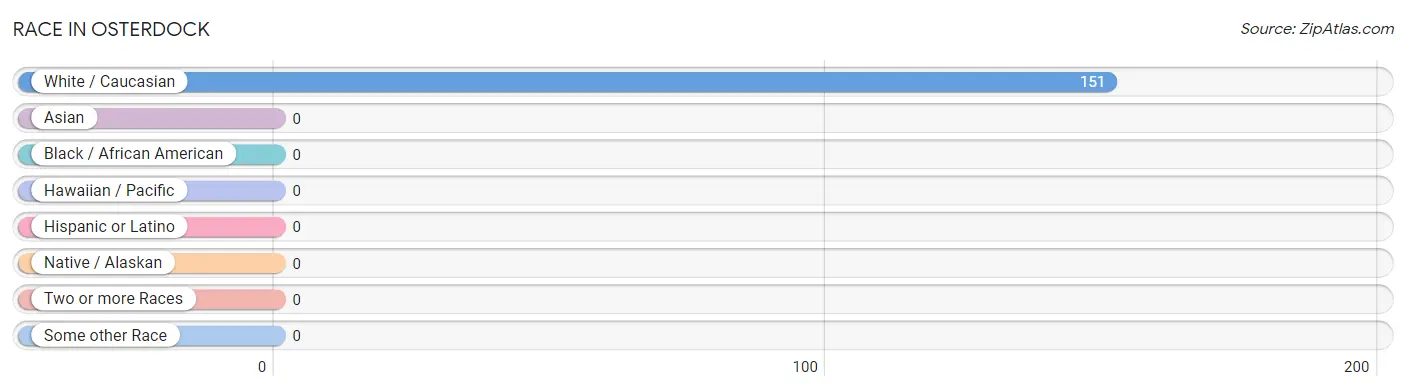
| Race | # Population | % Population |
| Asian | 0 | 0.0% |
| Black / African American | 0 | 0.0% |
| Hawaiian / Pacific | 0 | 0.0% |
| Hispanic or Latino | 0 | 0.0% |
| Native / Alaskan | 0 | 0.0% |
| White / Caucasian | 151 | 100.0% |
| Two or more Races | 0 | 0.0% |
| Some other Race | 0 | 0.0% |
| Total | 151 | 100.0% |
Ancestry in Osterdock
The most populous ancestries reported in Osterdock are German (45 | 29.8%), Irish (32 | 21.2%), Scandinavian (7 | 4.6%), American (6 | 4.0%), and Scottish (4 | 2.6%), together accounting for 62.2% of all Osterdock residents.
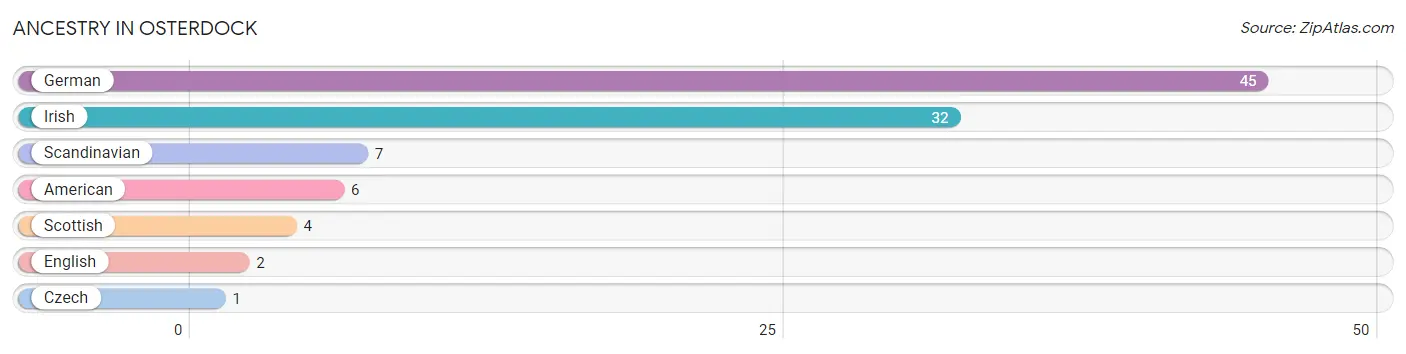
| Ancestry | # Population | % Population |
| American | 6 | 4.0% |
| Czech | 1 | 0.7% |
| English | 2 | 1.3% |
| German | 45 | 29.8% |
| Irish | 32 | 21.2% |
| Scandinavian | 7 | 4.6% |
| Scottish | 4 | 2.6% | View All 7 Rows |
Immigrants in Osterdock

| Immigration Origin | # Population | % Population | View All 0 Rows |
Sex and Age in Osterdock
Sex and Age in Osterdock
The most populous age groups in Osterdock are 65 to 69 Years (18 | 22.2%) for men and 65 to 69 Years (25 | 35.7%) for women.
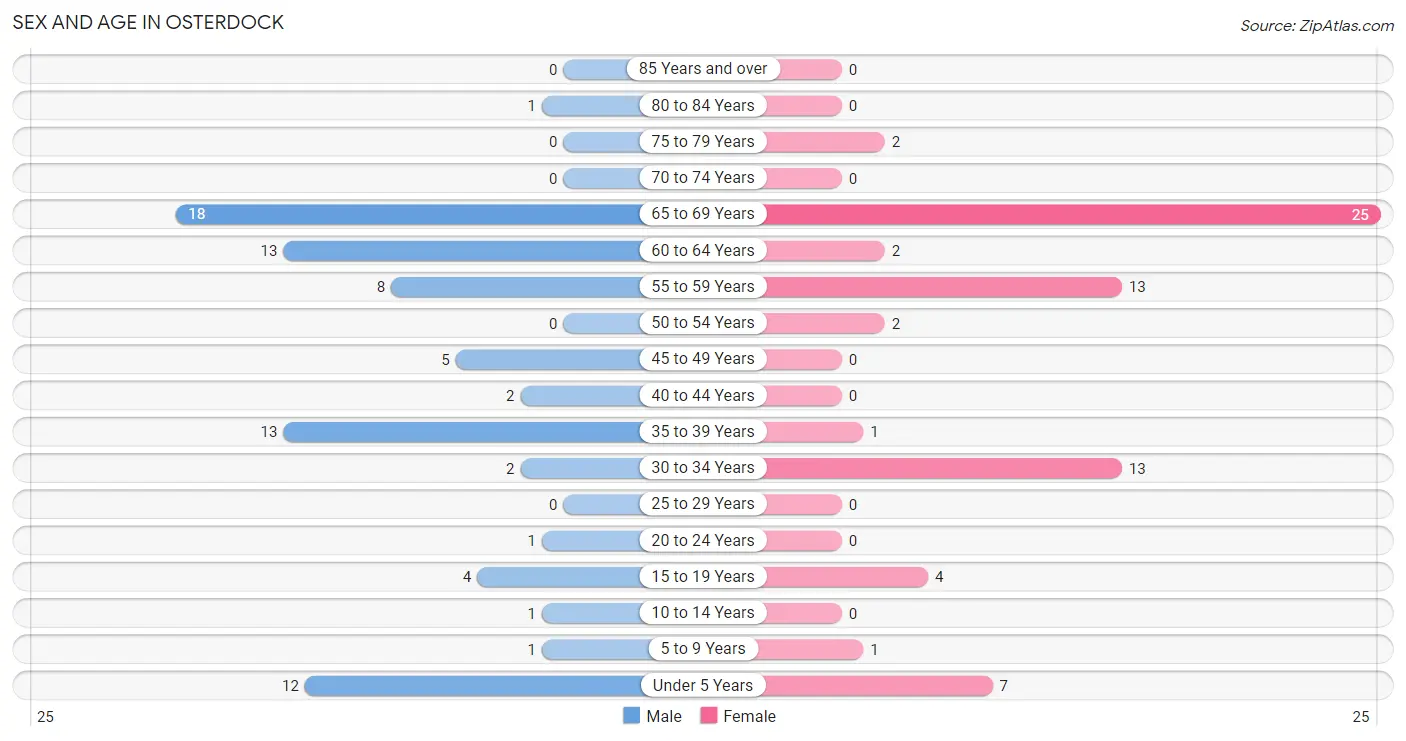
| Age Bracket | Male | Female |
| Under 5 Years | 12 (14.8%) | 7 (10.0%) |
| 5 to 9 Years | 1 (1.2%) | 1 (1.4%) |
| 10 to 14 Years | 1 (1.2%) | 0 (0.0%) |
| 15 to 19 Years | 4 (4.9%) | 4 (5.7%) |
| 20 to 24 Years | 1 (1.2%) | 0 (0.0%) |
| 25 to 29 Years | 0 (0.0%) | 0 (0.0%) |
| 30 to 34 Years | 2 (2.5%) | 13 (18.6%) |
| 35 to 39 Years | 13 (16.1%) | 1 (1.4%) |
| 40 to 44 Years | 2 (2.5%) | 0 (0.0%) |
| 45 to 49 Years | 5 (6.2%) | 0 (0.0%) |
| 50 to 54 Years | 0 (0.0%) | 2 (2.9%) |
| 55 to 59 Years | 8 (9.9%) | 13 (18.6%) |
| 60 to 64 Years | 13 (16.1%) | 2 (2.9%) |
| 65 to 69 Years | 18 (22.2%) | 25 (35.7%) |
| 70 to 74 Years | 0 (0.0%) | 0 (0.0%) |
| 75 to 79 Years | 0 (0.0%) | 2 (2.9%) |
| 80 to 84 Years | 1 (1.2%) | 0 (0.0%) |
| 85 Years and over | 0 (0.0%) | 0 (0.0%) |
| Total | 81 (100.0%) | 70 (100.0%) |
Families and Households in Osterdock
Median Family Size in Osterdock
The median family size in Osterdock is 3.15 persons per family, with single female/mother families (1 | 2.4%) accounting for the largest median family size of 5 persons per family. On the other hand, single male/father families (5 | 12.2%) represent the smallest median family size with 2.60 persons per family.
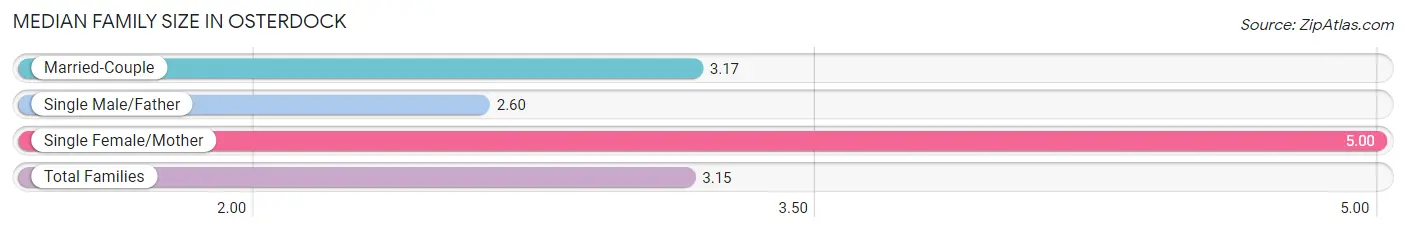
| Family Type | # Families | Family Size |
| Married-Couple | 35 (85.4%) | 3.17 |
| Single Male/Father | 5 (12.2%) | 2.60 |
| Single Female/Mother | 1 (2.4%) | 5.00 |
| Total Families | 41 (100.0%) | 3.15 |
Median Household Size in Osterdock
The median household size in Osterdock is 2.65 persons per household, with single female/mother households (1 | 1.8%) accounting for the largest median household size of 5 persons per household. non-family households (16 | 28.1%) represent the smallest median household size with 1.38 persons per household.
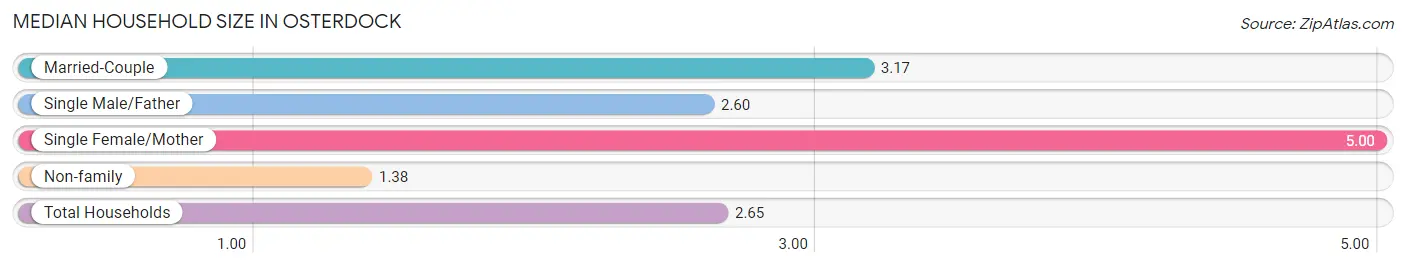
| Household Type | # Households | Household Size |
| Married-Couple | 35 (61.4%) | 3.17 |
| Single Male/Father | 5 (8.8%) | 2.60 |
| Single Female/Mother | 1 (1.8%) | 5.00 |
| Non-family | 16 (28.1%) | 1.38 |
| Total Households | 57 (100.0%) | 2.65 |
Household Size by Marriage Status in Osterdock
Out of a total of 57 households in Osterdock, 41 (71.9%) are family households, while 16 (28.1%) are nonfamily households. The most numerous type of family households are 2-person households, comprising 27, and the most common type of nonfamily households are 1-person households, comprising 9.
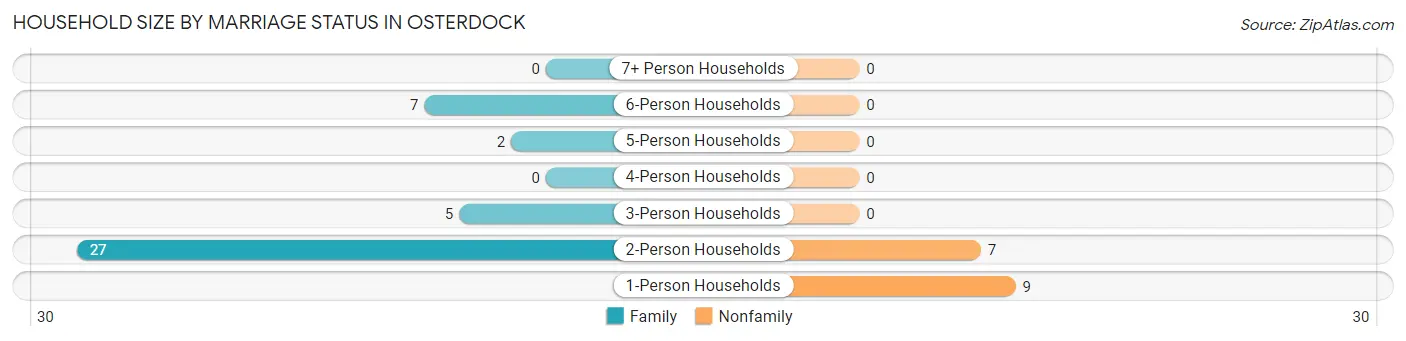
| Household Size | Family Households | Nonfamily Households |
| 1-Person Households | - | 9 (15.8%) |
| 2-Person Households | 27 (47.4%) | 7 (12.3%) |
| 3-Person Households | 5 (8.8%) | 0 (0.0%) |
| 4-Person Households | 0 (0.0%) | 0 (0.0%) |
| 5-Person Households | 2 (3.5%) | 0 (0.0%) |
| 6-Person Households | 7 (12.3%) | 0 (0.0%) |
| 7+ Person Households | 0 (0.0%) | 0 (0.0%) |
| Total | 41 (71.9%) | 16 (28.1%) |
Female Fertility in Osterdock
Fertility by Age in Osterdock
Average fertility rate in Osterdock is 722.0 births per 1,000 women. Women in the age bracket of 20 to 34 years have the highest fertility rate with 1,000.0 births per 1,000 women. Women in the age bracket of 20 to 34 years acount for 100.0% of all women with births.
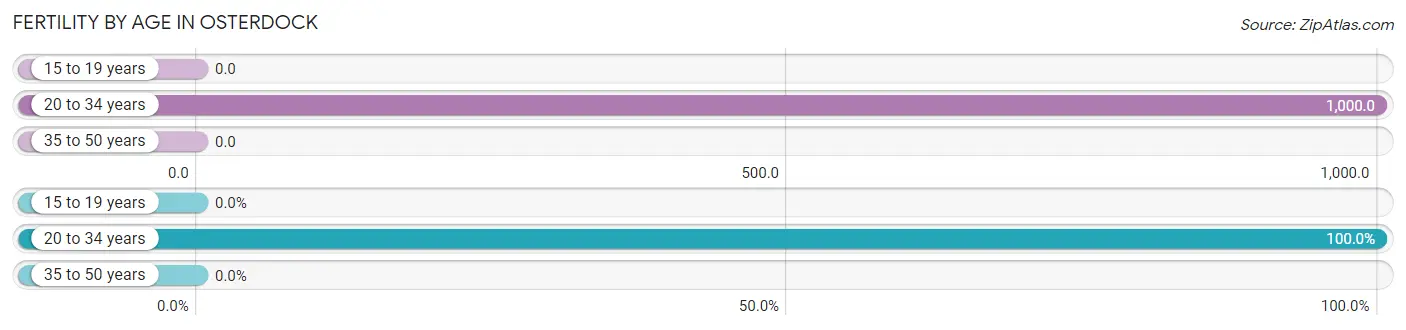
| Age Bracket | Women with Births | Births / 1,000 Women |
| 15 to 19 years | 0 (0.0%) | 0.0 |
| 20 to 34 years | 13 (100.0%) | 1,000.0 |
| 35 to 50 years | 0 (0.0%) | 0.0 |
| Total | 13 (100.0%) | 722.0 |
Fertility by Age by Marriage Status in Osterdock
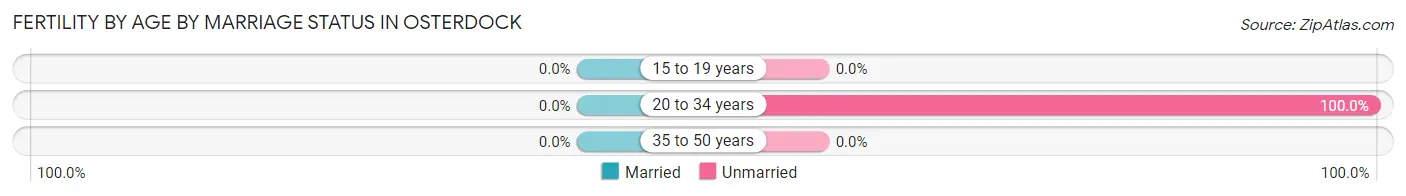
| Age Bracket | Married | Unmarried |
| 15 to 19 years | 0 (0.0%) | 0 (0.0%) |
| 20 to 34 years | 0 (0.0%) | 13 (100.0%) |
| 35 to 50 years | 0 (0.0%) | 0 (0.0%) |
| Total | 0 (0.0%) | 13 (100.0%) |
Fertility by Education in Osterdock
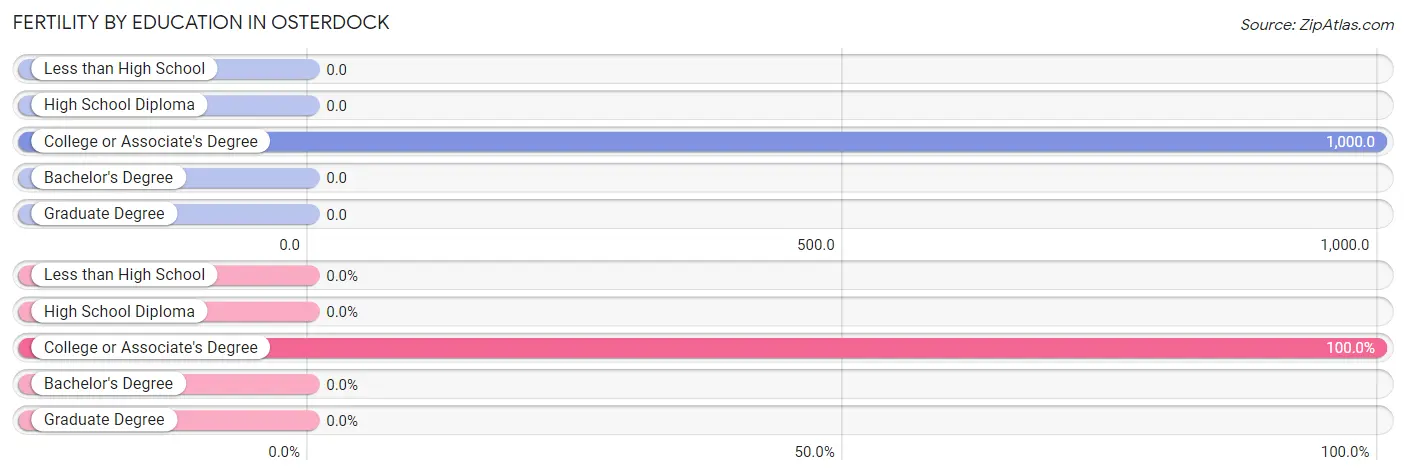
| Educational Attainment | Women with Births | Births / 1,000 Women |
| Less than High School | 0 (0.0%) | 0.0 |
| High School Diploma | 0 (0.0%) | 0.0 |
| College or Associate's Degree | 13 (100.0%) | 1,000.0 |
| Bachelor's Degree | 0 (0.0%) | 0.0 |
| Graduate Degree | 0 (0.0%) | 0.0 |
| Total | 13 (100.0%) | 722.0 |
Fertility by Education by Marriage Status in Osterdock
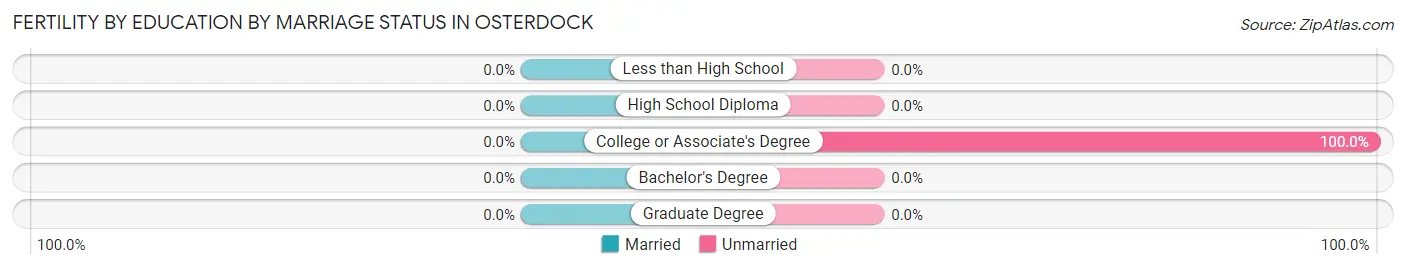
| Educational Attainment | Married | Unmarried |
| Less than High School | 0 (0.0%) | 0 (0.0%) |
| High School Diploma | 0 (0.0%) | 0 (0.0%) |
| College or Associate's Degree | 0 (0.0%) | 13 (100.0%) |
| Bachelor's Degree | 0 (0.0%) | 0 (0.0%) |
| Graduate Degree | 0 (0.0%) | 0 (0.0%) |
| Total | 0 (0.0%) | 13 (100.0%) |
Employment Characteristics in Osterdock
Employment by Class of Employer in Osterdock
Among the 35 employed individuals in Osterdock, private company employees (32 | 91.4%), self-employed (incorporated) (2 | 5.7%), and not-for-profit organizations (1 | 2.9%) make up the most common classes of employment.
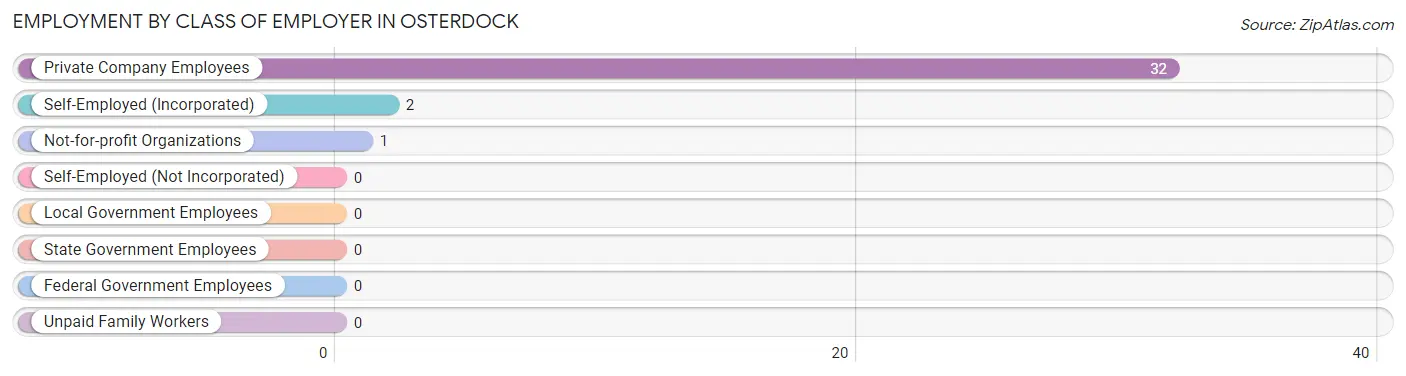
| Employer Class | # Employees | % Employees |
| Private Company Employees | 32 | 91.4% |
| Self-Employed (Incorporated) | 2 | 5.7% |
| Self-Employed (Not Incorporated) | 0 | 0.0% |
| Not-for-profit Organizations | 1 | 2.9% |
| Local Government Employees | 0 | 0.0% |
| State Government Employees | 0 | 0.0% |
| Federal Government Employees | 0 | 0.0% |
| Unpaid Family Workers | 0 | 0.0% |
| Total | 35 | 100.0% |
Employment Status by Age in Osterdock
According to the labor force statistics for Osterdock, out of the total population over 16 years of age (129), 45.0% or 58 individuals are in the labor force, with 39.7% or 23 of them unemployed. The age group with the highest labor force participation rate is 30 to 34 years, with 100.0% or 15 individuals in the labor force. Within the labor force, the 30 to 34 years age range has the highest percentage of unemployed individuals, with 100.0% or 15 of them being unemployed.
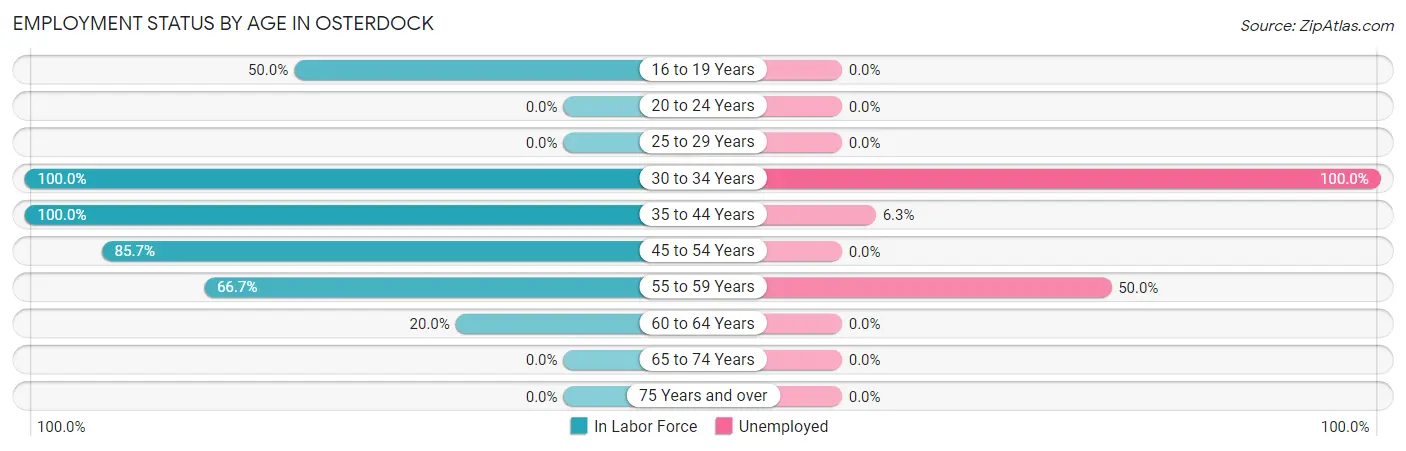
| Age Bracket | In Labor Force | Unemployed |
| 16 to 19 Years | 4 (50.0%) | 0 (0.0%) |
| 20 to 24 Years | 0 (0.0%) | 0 (0.0%) |
| 25 to 29 Years | 0 (0.0%) | 0 (0.0%) |
| 30 to 34 Years | 15 (100.0%) | 15 (100.0%) |
| 35 to 44 Years | 16 (100.0%) | 1 (6.3%) |
| 45 to 54 Years | 6 (85.7%) | 0 (0.0%) |
| 55 to 59 Years | 14 (66.7%) | 7 (50.0%) |
| 60 to 64 Years | 3 (20.0%) | 0 (0.0%) |
| 65 to 74 Years | 0 (0.0%) | 0 (0.0%) |
| 75 Years and over | 0 (0.0%) | 0 (0.0%) |
| Total | 58 (45.0%) | 23 (39.7%) |
Employment Status by Educational Attainment in Osterdock
According to labor force statistics for Osterdock, 73.0% of individuals (54) out of the total population between 25 and 64 years of age (74) are in the labor force, with 42.6% or 23 of them being unemployed. The group with the highest labor force participation rate are those with the educational attainment of less than high school, with 100.0% or 13 individuals in the labor force. Within the labor force, individuals with less than high school education have the highest percentage of unemployment, with 53.8% or 7 of them being unemployed.
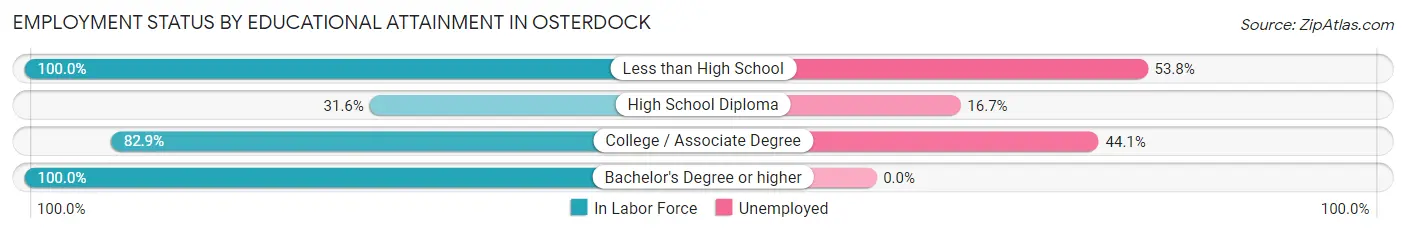
| Educational Attainment | In Labor Force | Unemployed |
| Less than High School | 13 (100.0%) | 7 (53.8%) |
| High School Diploma | 6 (31.6%) | 3 (16.7%) |
| College / Associate Degree | 34 (82.9%) | 18 (44.1%) |
| Bachelor's Degree or higher | 1 (100.0%) | 0 (0.0%) |
| Total | 54 (73.0%) | 32 (42.6%) |
Employment Occupations by Sex in Osterdock
Management, Business, Science and Arts Occupations
The most common Management, Business, Science and Arts occupations in Osterdock are Community & Social Service (2 | 5.7%), Arts, Media & Entertainment (2 | 5.7%), Health Diagnosing & Treating (1 | 2.9%), and Health Technologists (1 | 2.9%).
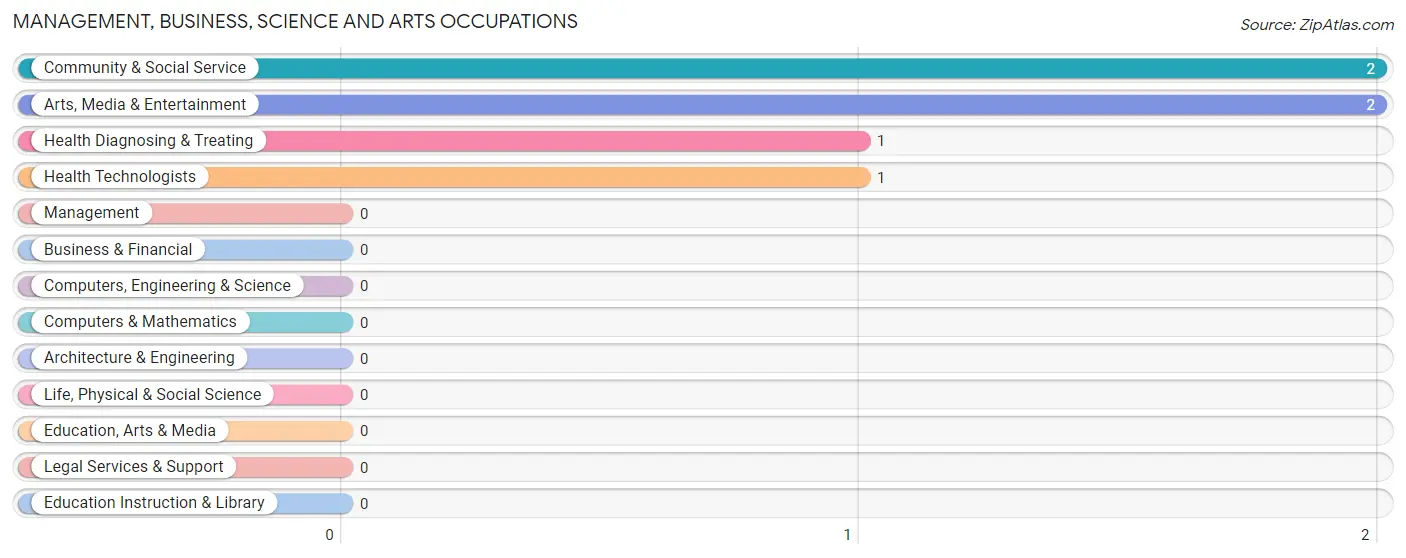
Management, Business, Science and Arts Occupations by Sex
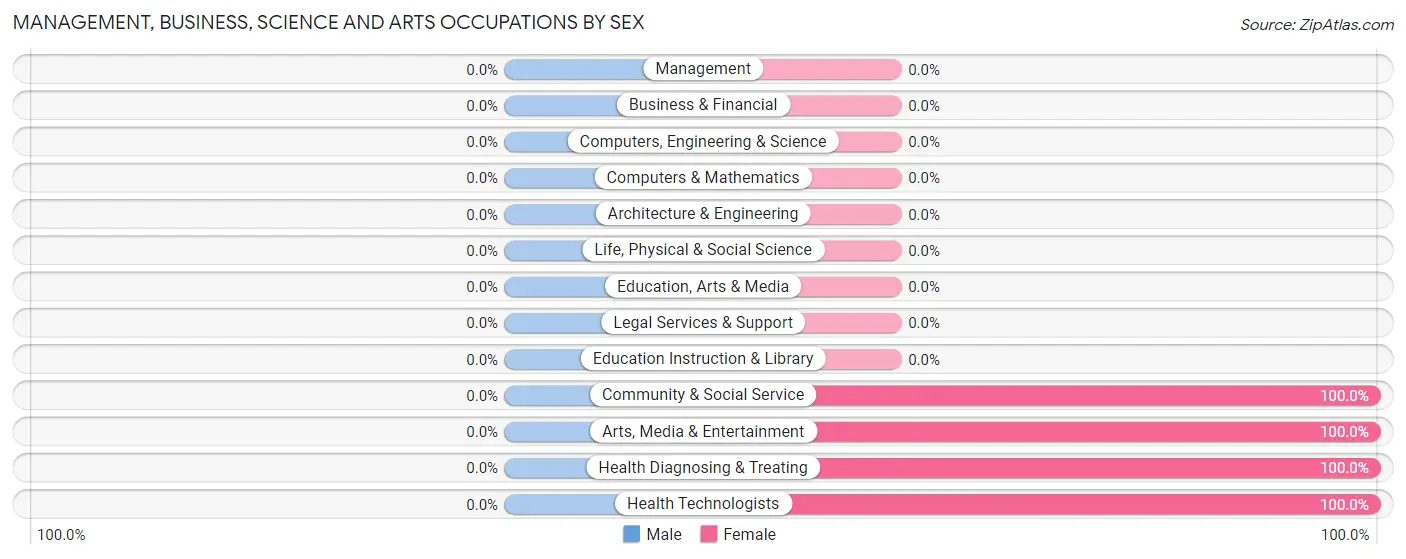
| Occupation | Male | Female |
| Management | 0 (0.0%) | 0 (0.0%) |
| Business & Financial | 0 (0.0%) | 0 (0.0%) |
| Computers, Engineering & Science | 0 (0.0%) | 0 (0.0%) |
| Computers & Mathematics | 0 (0.0%) | 0 (0.0%) |
| Architecture & Engineering | 0 (0.0%) | 0 (0.0%) |
| Life, Physical & Social Science | 0 (0.0%) | 0 (0.0%) |
| Community & Social Service | 0 (0.0%) | 2 (100.0%) |
| Education, Arts & Media | 0 (0.0%) | 0 (0.0%) |
| Legal Services & Support | 0 (0.0%) | 0 (0.0%) |
| Education Instruction & Library | 0 (0.0%) | 0 (0.0%) |
| Arts, Media & Entertainment | 0 (0.0%) | 2 (100.0%) |
| Health Diagnosing & Treating | 0 (0.0%) | 1 (100.0%) |
| Health Technologists | 0 (0.0%) | 1 (100.0%) |
| Total (Category) | 0 (0.0%) | 3 (100.0%) |
| Total (Overall) | 25 (71.4%) | 10 (28.6%) |
Services Occupations
The most common Services occupations in Osterdock are , and Food Preparation & Serving (4 | 11.4%).
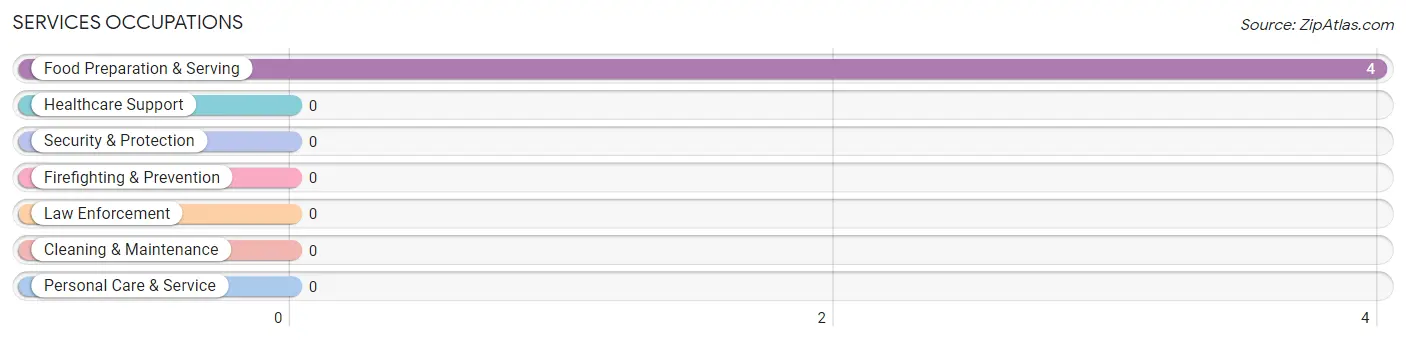
Services Occupations by Sex
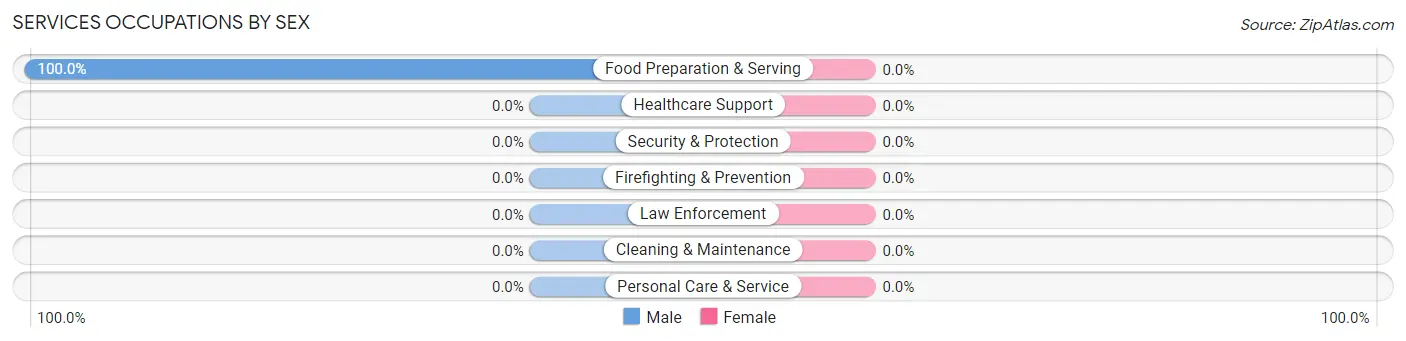
| Occupation | Male | Female |
| Healthcare Support | 0 (0.0%) | 0 (0.0%) |
| Security & Protection | 0 (0.0%) | 0 (0.0%) |
| Firefighting & Prevention | 0 (0.0%) | 0 (0.0%) |
| Law Enforcement | 0 (0.0%) | 0 (0.0%) |
| Food Preparation & Serving | 4 (100.0%) | 0 (0.0%) |
| Cleaning & Maintenance | 0 (0.0%) | 0 (0.0%) |
| Personal Care & Service | 0 (0.0%) | 0 (0.0%) |
| Total (Category) | 4 (100.0%) | 0 (0.0%) |
| Total (Overall) | 25 (71.4%) | 10 (28.6%) |
Sales and Office Occupations
The most common Sales and Office occupations in Osterdock are , and Office & Administration (7 | 20.0%).

Sales and Office Occupations by Sex

| Occupation | Male | Female |
| Sales & Related | 0 (0.0%) | 0 (0.0%) |
| Office & Administration | 0 (0.0%) | 7 (100.0%) |
| Total (Category) | 0 (0.0%) | 7 (100.0%) |
| Total (Overall) | 25 (71.4%) | 10 (28.6%) |
Natural Resources, Construction and Maintenance Occupations
The most common Natural Resources, Construction and Maintenance occupations in Osterdock are Construction & Extraction (13 | 37.1%), and Installation, Maintenance & Repair (1 | 2.9%).
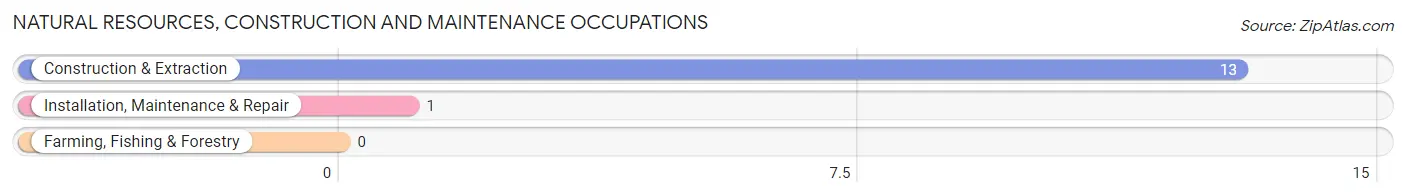
Natural Resources, Construction and Maintenance Occupations by Sex

| Occupation | Male | Female |
| Farming, Fishing & Forestry | 0 (0.0%) | 0 (0.0%) |
| Construction & Extraction | 13 (100.0%) | 0 (0.0%) |
| Installation, Maintenance & Repair | 1 (100.0%) | 0 (0.0%) |
| Total (Category) | 14 (100.0%) | 0 (0.0%) |
| Total (Overall) | 25 (71.4%) | 10 (28.6%) |
Production, Transportation and Moving Occupations
The most common Production, Transportation and Moving occupations in Osterdock are Production (5 | 14.3%), Transportation (1 | 2.9%), and Material Moving (1 | 2.9%).
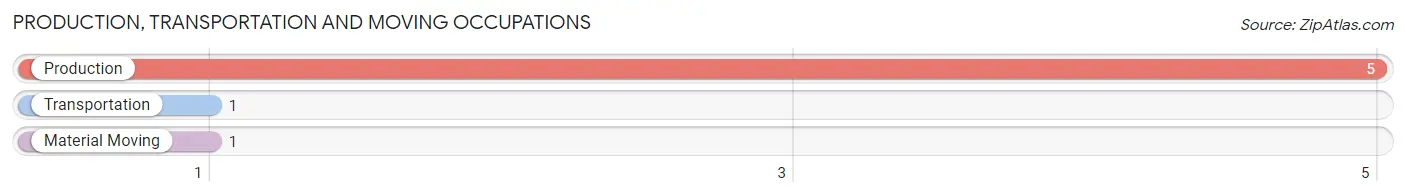
Production, Transportation and Moving Occupations by Sex
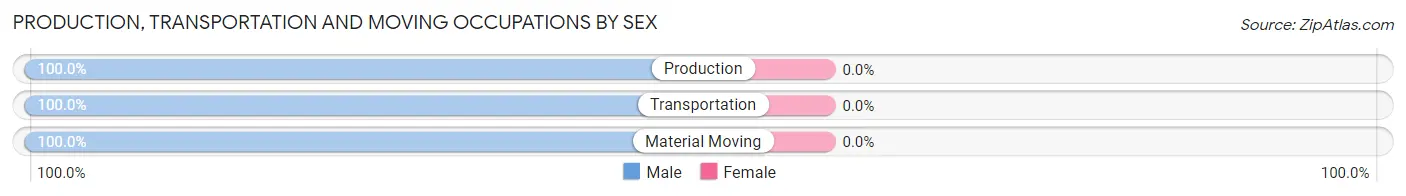
| Occupation | Male | Female |
| Production | 5 (100.0%) | 0 (0.0%) |
| Transportation | 1 (100.0%) | 0 (0.0%) |
| Material Moving | 1 (100.0%) | 0 (0.0%) |
| Total (Category) | 7 (100.0%) | 0 (0.0%) |
| Total (Overall) | 25 (71.4%) | 10 (28.6%) |
Employment Industries by Sex in Osterdock
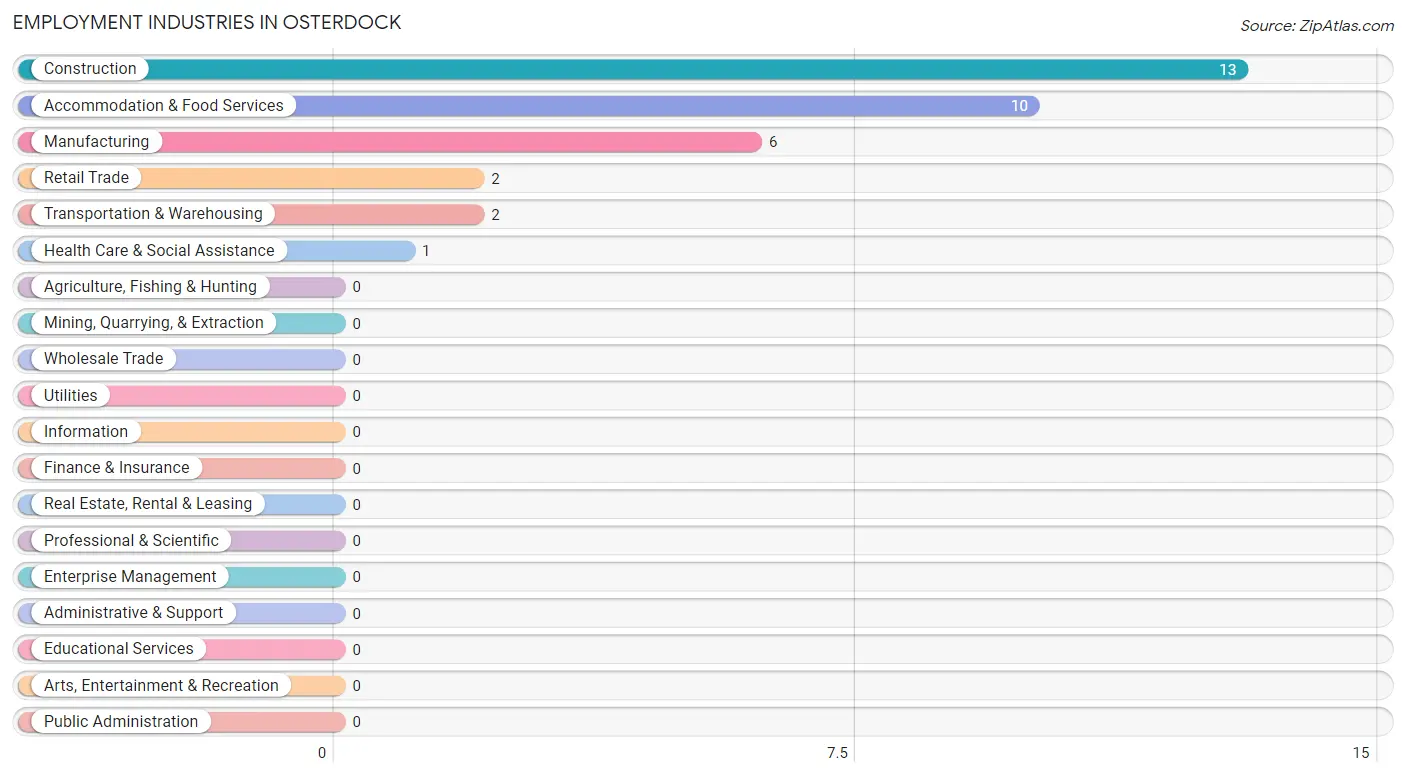
Employment Industries in Osterdock
The major employment industries in Osterdock include Construction (13 | 37.1%), Accommodation & Food Services (10 | 28.6%), Manufacturing (6 | 17.1%), Retail Trade (2 | 5.7%), and Transportation & Warehousing (2 | 5.7%).
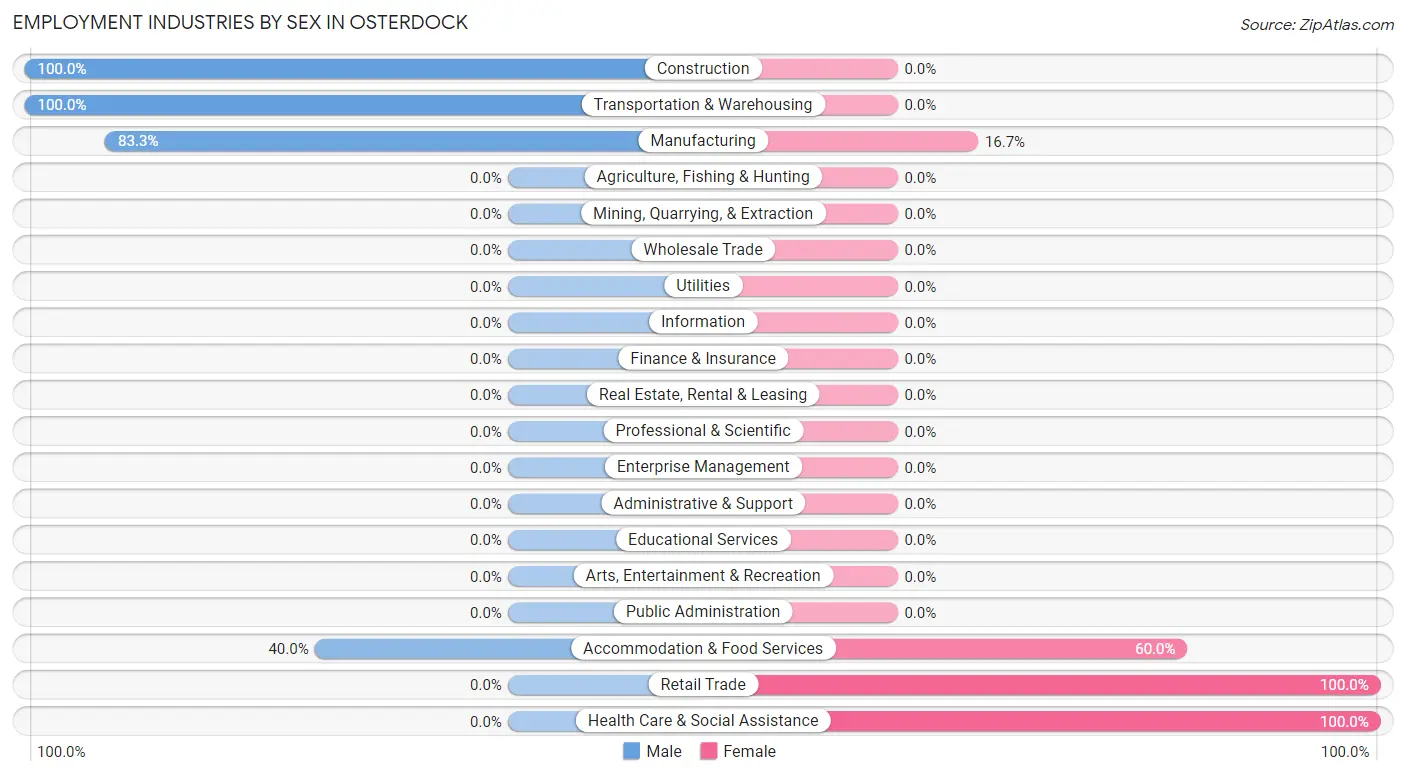
Employment Industries by Sex in Osterdock
The Osterdock industries that see more men than women are Construction (100.0%), Transportation & Warehousing (100.0%), and Manufacturing (83.3%), whereas the industries that tend to have a higher number of women are Retail Trade (100.0%), Health Care & Social Assistance (100.0%), and Accommodation & Food Services (60.0%).
| Industry | Male | Female |
| Agriculture, Fishing & Hunting | 0 (0.0%) | 0 (0.0%) |
| Mining, Quarrying, & Extraction | 0 (0.0%) | 0 (0.0%) |
| Construction | 13 (100.0%) | 0 (0.0%) |
| Manufacturing | 5 (83.3%) | 1 (16.7%) |
| Wholesale Trade | 0 (0.0%) | 0 (0.0%) |
| Retail Trade | 0 (0.0%) | 2 (100.0%) |
| Transportation & Warehousing | 2 (100.0%) | 0 (0.0%) |
| Utilities | 0 (0.0%) | 0 (0.0%) |
| Information | 0 (0.0%) | 0 (0.0%) |
| Finance & Insurance | 0 (0.0%) | 0 (0.0%) |
| Real Estate, Rental & Leasing | 0 (0.0%) | 0 (0.0%) |
| Professional & Scientific | 0 (0.0%) | 0 (0.0%) |
| Enterprise Management | 0 (0.0%) | 0 (0.0%) |
| Administrative & Support | 0 (0.0%) | 0 (0.0%) |
| Educational Services | 0 (0.0%) | 0 (0.0%) |
| Health Care & Social Assistance | 0 (0.0%) | 1 (100.0%) |
| Arts, Entertainment & Recreation | 0 (0.0%) | 0 (0.0%) |
| Accommodation & Food Services | 4 (40.0%) | 6 (60.0%) |
| Public Administration | 0 (0.0%) | 0 (0.0%) |
| Total | 25 (71.4%) | 10 (28.6%) |
Education in Osterdock
School Enrollment in Osterdock
The most common levels of schooling among the 11 students in Osterdock are high school (8 | 72.7%), kindergarten (1 | 9.1%), and elementary school (1 | 9.1%).
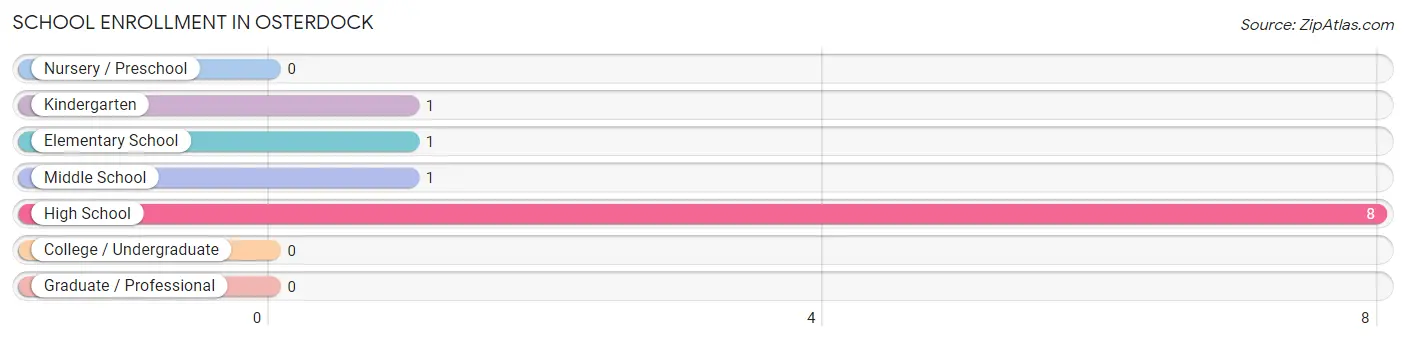
| School Level | # Students | % Students |
| Nursery / Preschool | 0 | 0.0% |
| Kindergarten | 1 | 9.1% |
| Elementary School | 1 | 9.1% |
| Middle School | 1 | 9.1% |
| High School | 8 | 72.7% |
| College / Undergraduate | 0 | 0.0% |
| Graduate / Professional | 0 | 0.0% |
| Total | 11 | 100.0% |
School Enrollment by Age by Funding Source in Osterdock
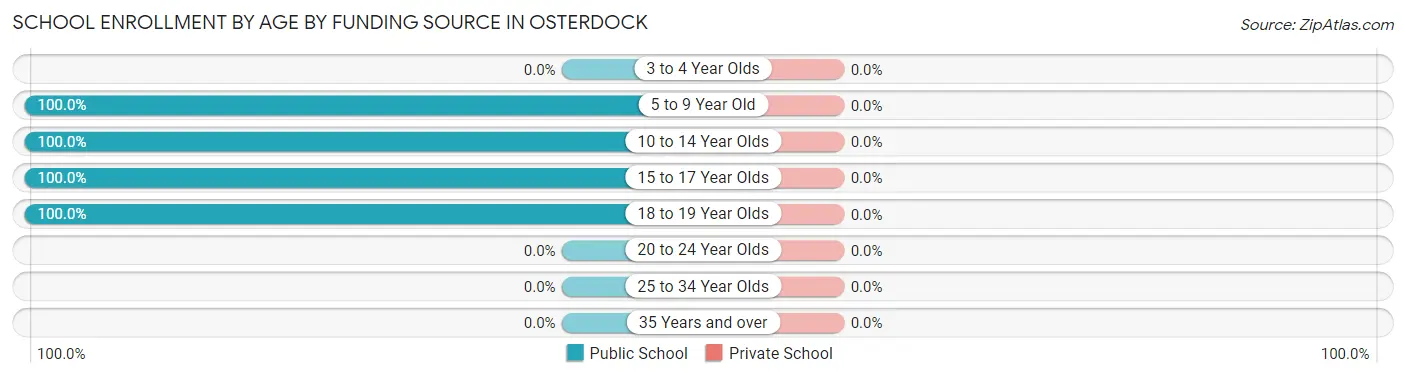
| Age Bracket | Public School | Private School |
| 3 to 4 Year Olds | 0 (0.0%) | 0 (0.0%) |
| 5 to 9 Year Old | 2 (100.0%) | 0 (0.0%) |
| 10 to 14 Year Olds | 1 (100.0%) | 0 (0.0%) |
| 15 to 17 Year Olds | 4 (100.0%) | 0 (0.0%) |
| 18 to 19 Year Olds | 4 (100.0%) | 0 (0.0%) |
| 20 to 24 Year Olds | 0 (0.0%) | 0 (0.0%) |
| 25 to 34 Year Olds | 0 (0.0%) | 0 (0.0%) |
| 35 Years and over | 0 (0.0%) | 0 (0.0%) |
| Total | 11 (100.0%) | 0 (0.0%) |
Educational Attainment by Field of Study in Osterdock
Science & technology (1 | 50.0%), and education (1 | 50.0%) are the most common fields of study among 2 individuals in Osterdock who have obtained a bachelor's degree or higher.
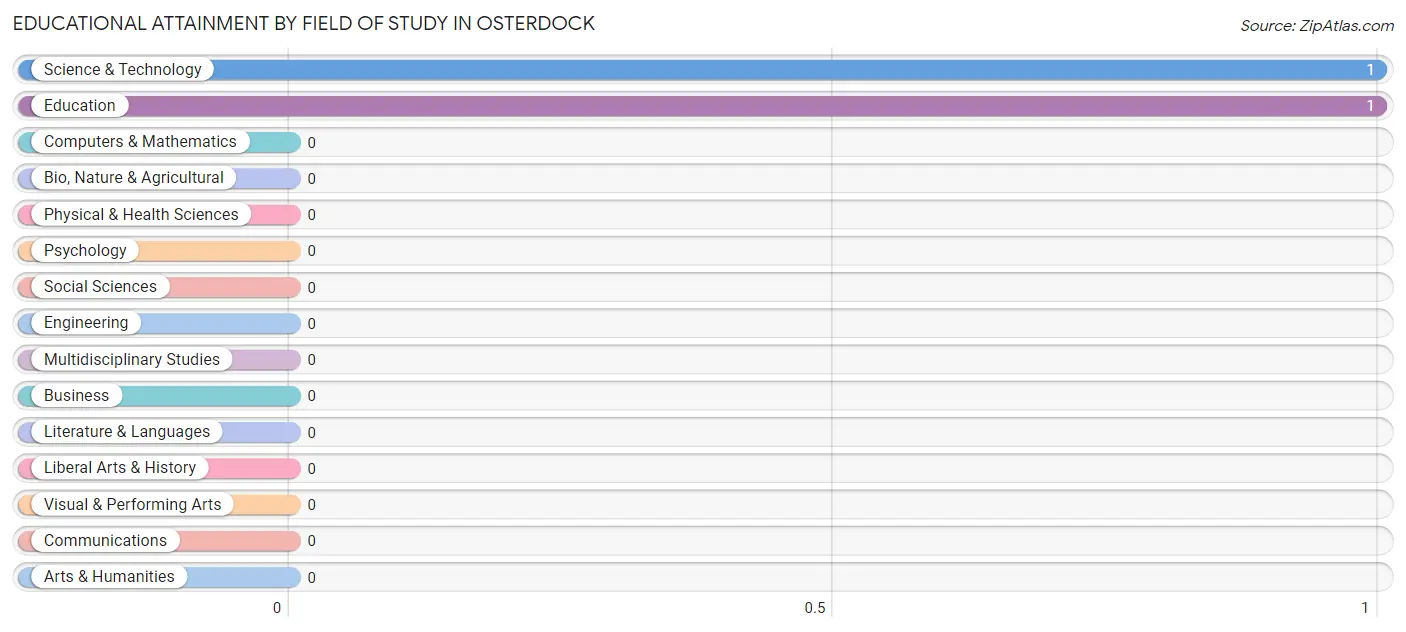
| Field of Study | # Graduates | % Graduates |
| Computers & Mathematics | 0 | 0.0% |
| Bio, Nature & Agricultural | 0 | 0.0% |
| Physical & Health Sciences | 0 | 0.0% |
| Psychology | 0 | 0.0% |
| Social Sciences | 0 | 0.0% |
| Engineering | 0 | 0.0% |
| Multidisciplinary Studies | 0 | 0.0% |
| Science & Technology | 1 | 50.0% |
| Business | 0 | 0.0% |
| Education | 1 | 50.0% |
| Literature & Languages | 0 | 0.0% |
| Liberal Arts & History | 0 | 0.0% |
| Visual & Performing Arts | 0 | 0.0% |
| Communications | 0 | 0.0% |
| Arts & Humanities | 0 | 0.0% |
| Total | 2 | 100.0% |
Transportation & Commute in Osterdock
Vehicle Availability by Sex in Osterdock
The most prevalent vehicle ownership categories in Osterdock are males with 3 vehicles (15, accounting for 60.0%) and females with 3 vehicles (9, making up 150.0%).
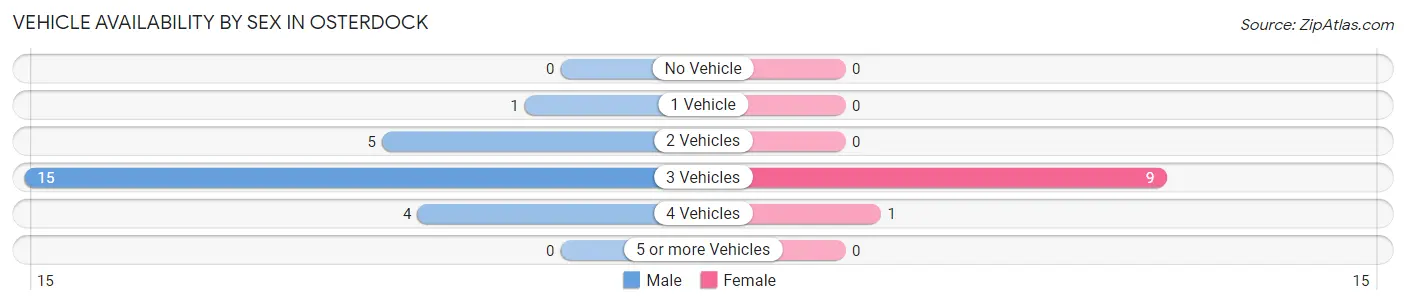
| Vehicles Available | Male | Female |
| No Vehicle | 0 (0.0%) | 0 (0.0%) |
| 1 Vehicle | 1 (4.0%) | 0 (0.0%) |
| 2 Vehicles | 5 (20.0%) | 0 (0.0%) |
| 3 Vehicles | 15 (60.0%) | 9 (90.0%) |
| 4 Vehicles | 4 (16.0%) | 1 (10.0%) |
| 5 or more Vehicles | 0 (0.0%) | 0 (0.0%) |
| Total | 25 (100.0%) | 10 (100.0%) |
Commute Time in Osterdock
The most frequently occuring commute durations in Osterdock are 20 to 24 minutes (18 commuters, 51.4%), 30 to 34 minutes (7 commuters, 20.0%), and less than 5 minutes (4 commuters, 11.4%).
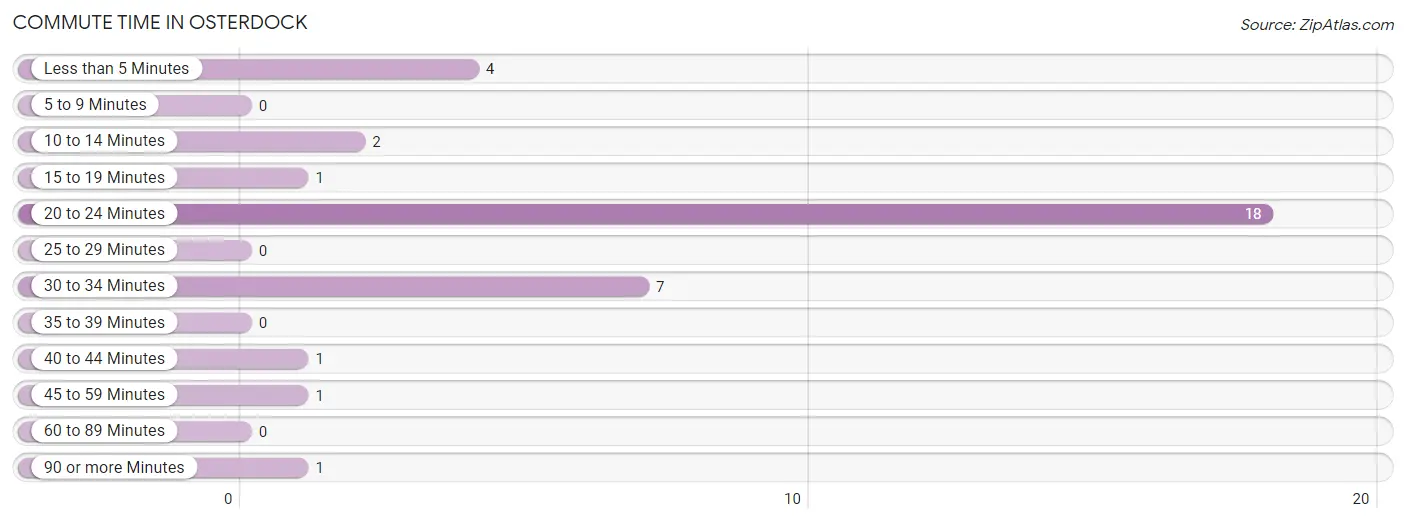
| Commute Time | # Commuters | % Commuters |
| Less than 5 Minutes | 4 | 11.4% |
| 5 to 9 Minutes | 0 | 0.0% |
| 10 to 14 Minutes | 2 | 5.7% |
| 15 to 19 Minutes | 1 | 2.9% |
| 20 to 24 Minutes | 18 | 51.4% |
| 25 to 29 Minutes | 0 | 0.0% |
| 30 to 34 Minutes | 7 | 20.0% |
| 35 to 39 Minutes | 0 | 0.0% |
| 40 to 44 Minutes | 1 | 2.9% |
| 45 to 59 Minutes | 1 | 2.9% |
| 60 to 89 Minutes | 0 | 0.0% |
| 90 or more Minutes | 1 | 2.9% |
Commute Time by Sex in Osterdock
The most common commute times in Osterdock are 20 to 24 minutes (18 commuters, 72.0%) for males and 30 to 34 minutes (6 commuters, 60.0%) for females.
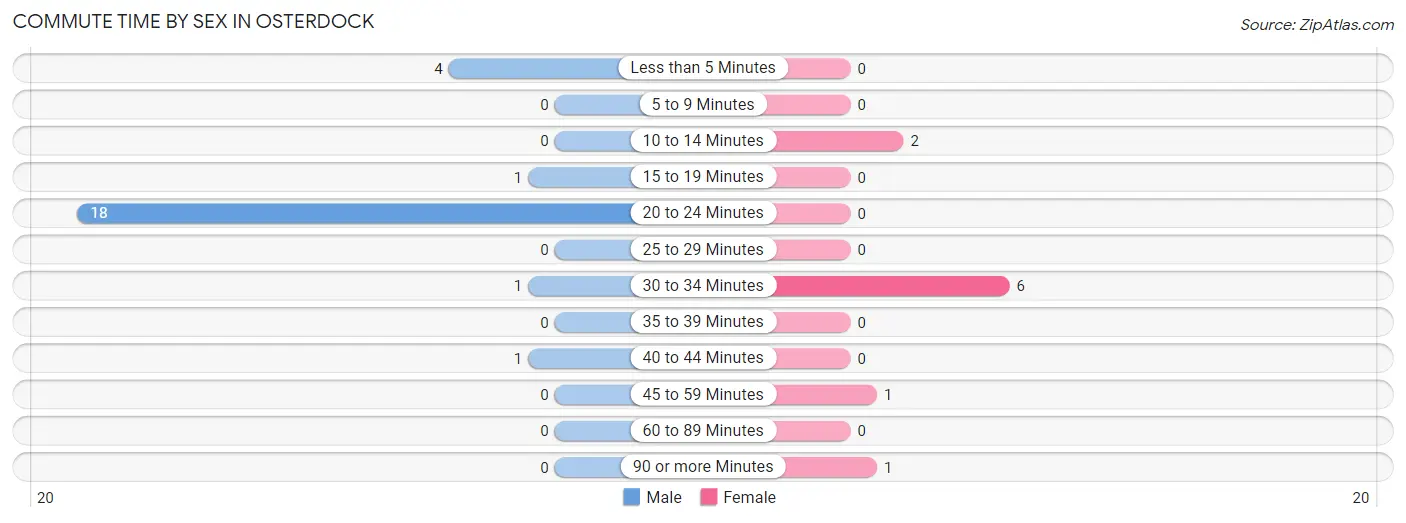
| Commute Time | Male | Female |
| Less than 5 Minutes | 4 (16.0%) | 0 (0.0%) |
| 5 to 9 Minutes | 0 (0.0%) | 0 (0.0%) |
| 10 to 14 Minutes | 0 (0.0%) | 2 (20.0%) |
| 15 to 19 Minutes | 1 (4.0%) | 0 (0.0%) |
| 20 to 24 Minutes | 18 (72.0%) | 0 (0.0%) |
| 25 to 29 Minutes | 0 (0.0%) | 0 (0.0%) |
| 30 to 34 Minutes | 1 (4.0%) | 6 (60.0%) |
| 35 to 39 Minutes | 0 (0.0%) | 0 (0.0%) |
| 40 to 44 Minutes | 1 (4.0%) | 0 (0.0%) |
| 45 to 59 Minutes | 0 (0.0%) | 1 (10.0%) |
| 60 to 89 Minutes | 0 (0.0%) | 0 (0.0%) |
| 90 or more Minutes | 0 (0.0%) | 1 (10.0%) |
Time of Departure to Work by Sex in Osterdock
The most frequent times of departure to work in Osterdock are 6:30 AM to 6:59 AM (13, 52.0%) for males and 4:00 PM to 11:59 PM (7, 70.0%) for females.
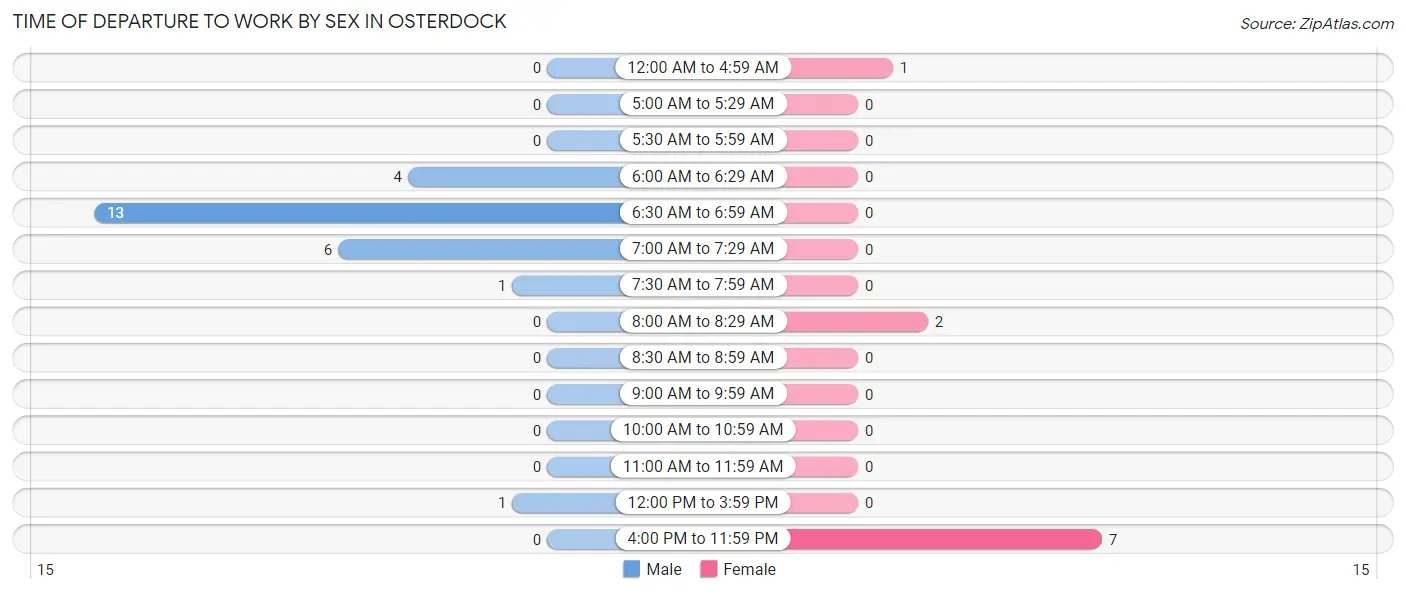
| Time of Departure | Male | Female |
| 12:00 AM to 4:59 AM | 0 (0.0%) | 1 (10.0%) |
| 5:00 AM to 5:29 AM | 0 (0.0%) | 0 (0.0%) |
| 5:30 AM to 5:59 AM | 0 (0.0%) | 0 (0.0%) |
| 6:00 AM to 6:29 AM | 4 (16.0%) | 0 (0.0%) |
| 6:30 AM to 6:59 AM | 13 (52.0%) | 0 (0.0%) |
| 7:00 AM to 7:29 AM | 6 (24.0%) | 0 (0.0%) |
| 7:30 AM to 7:59 AM | 1 (4.0%) | 0 (0.0%) |
| 8:00 AM to 8:29 AM | 0 (0.0%) | 2 (20.0%) |
| 8:30 AM to 8:59 AM | 0 (0.0%) | 0 (0.0%) |
| 9:00 AM to 9:59 AM | 0 (0.0%) | 0 (0.0%) |
| 10:00 AM to 10:59 AM | 0 (0.0%) | 0 (0.0%) |
| 11:00 AM to 11:59 AM | 0 (0.0%) | 0 (0.0%) |
| 12:00 PM to 3:59 PM | 1 (4.0%) | 0 (0.0%) |
| 4:00 PM to 11:59 PM | 0 (0.0%) | 7 (70.0%) |
| Total | 25 (100.0%) | 10 (100.0%) |
Housing Occupancy in Osterdock
Occupancy by Ownership in Osterdock
Of the total 57 dwellings in Osterdock, owner-occupied units account for 50 (87.7%), while renter-occupied units make up 7 (12.3%).
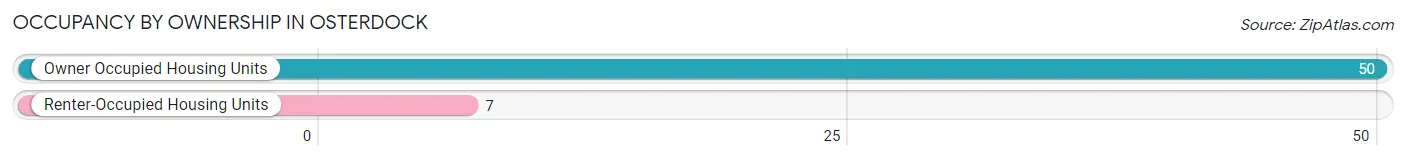
| Occupancy | # Housing Units | % Housing Units |
| Owner Occupied Housing Units | 50 | 87.7% |
| Renter-Occupied Housing Units | 7 | 12.3% |
| Total Occupied Housing Units | 57 | 100.0% |
Occupancy by Household Size in Osterdock
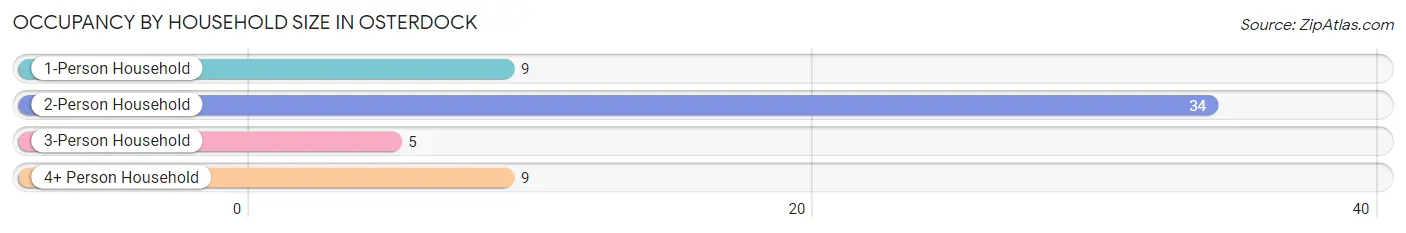
| Household Size | # Housing Units | % Housing Units |
| 1-Person Household | 9 | 15.8% |
| 2-Person Household | 34 | 59.7% |
| 3-Person Household | 5 | 8.8% |
| 4+ Person Household | 9 | 15.8% |
| Total Housing Units | 57 | 100.0% |
Occupancy by Ownership by Household Size in Osterdock
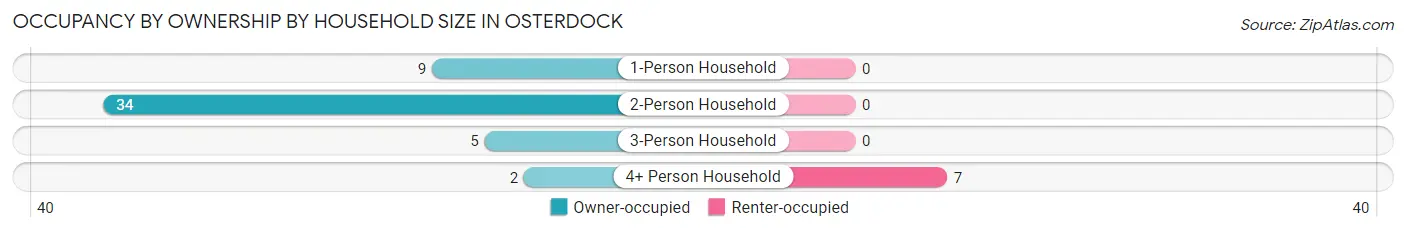
| Household Size | Owner-occupied | Renter-occupied |
| 1-Person Household | 9 (100.0%) | 0 (0.0%) |
| 2-Person Household | 34 (100.0%) | 0 (0.0%) |
| 3-Person Household | 5 (100.0%) | 0 (0.0%) |
| 4+ Person Household | 2 (22.2%) | 7 (77.8%) |
| Total Housing Units | 50 (87.7%) | 7 (12.3%) |
Occupancy by Educational Attainment in Osterdock
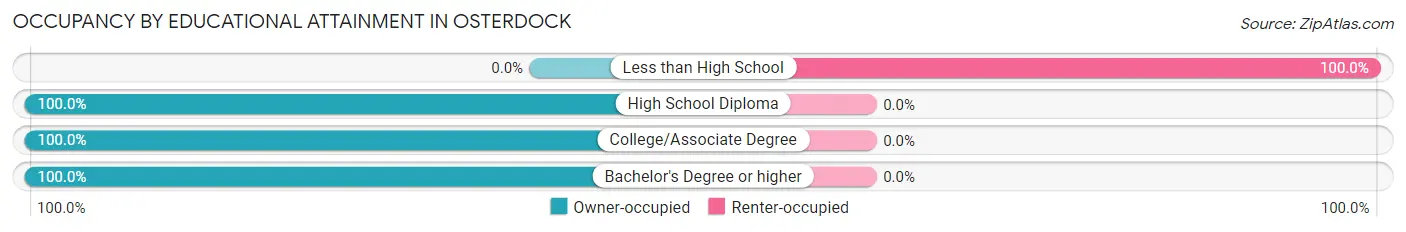
| Household Size | Owner-occupied | Renter-occupied |
| Less than High School | 0 (0.0%) | 7 (100.0%) |
| High School Diploma | 41 (100.0%) | 0 (0.0%) |
| College/Associate Degree | 7 (100.0%) | 0 (0.0%) |
| Bachelor's Degree or higher | 2 (100.0%) | 0 (0.0%) |
Occupancy by Age of Householder in Osterdock
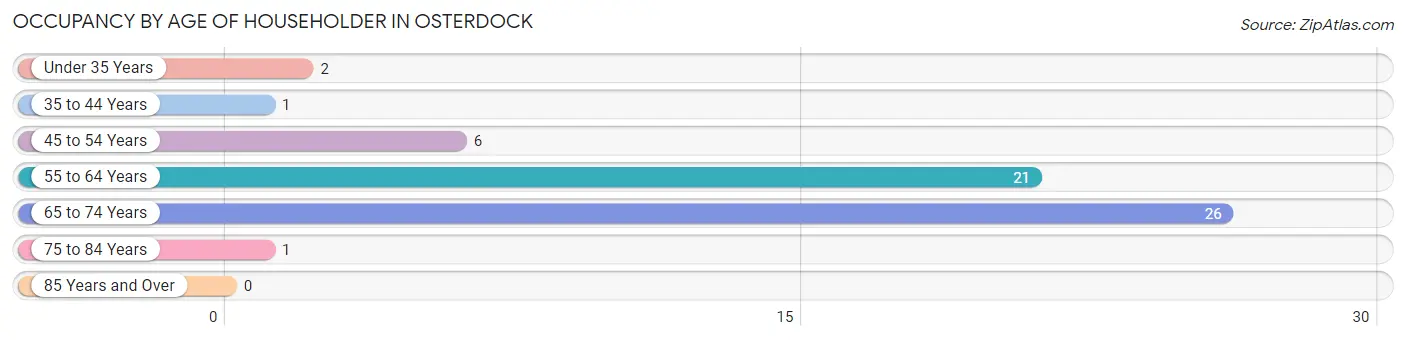
| Age Bracket | # Households | % Households |
| Under 35 Years | 2 | 3.5% |
| 35 to 44 Years | 1 | 1.8% |
| 45 to 54 Years | 6 | 10.5% |
| 55 to 64 Years | 21 | 36.8% |
| 65 to 74 Years | 26 | 45.6% |
| 75 to 84 Years | 1 | 1.8% |
| 85 Years and Over | 0 | 0.0% |
| Total | 57 | 100.0% |
Housing Finances in Osterdock
Median Income by Occupancy in Osterdock
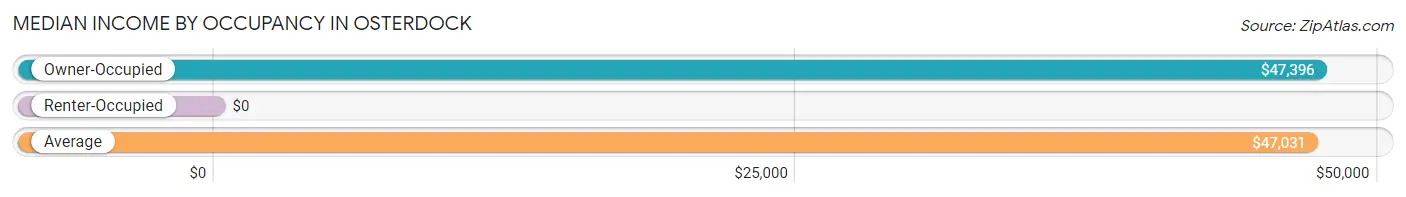
| Occupancy Type | # Households | Median Income |
| Owner-Occupied | 50 (87.7%) | $47,396 |
| Renter-Occupied | 7 (12.3%) | $0 |
| Average | 57 (100.0%) | $47,031 |
Occupancy by Householder Income Bracket in Osterdock
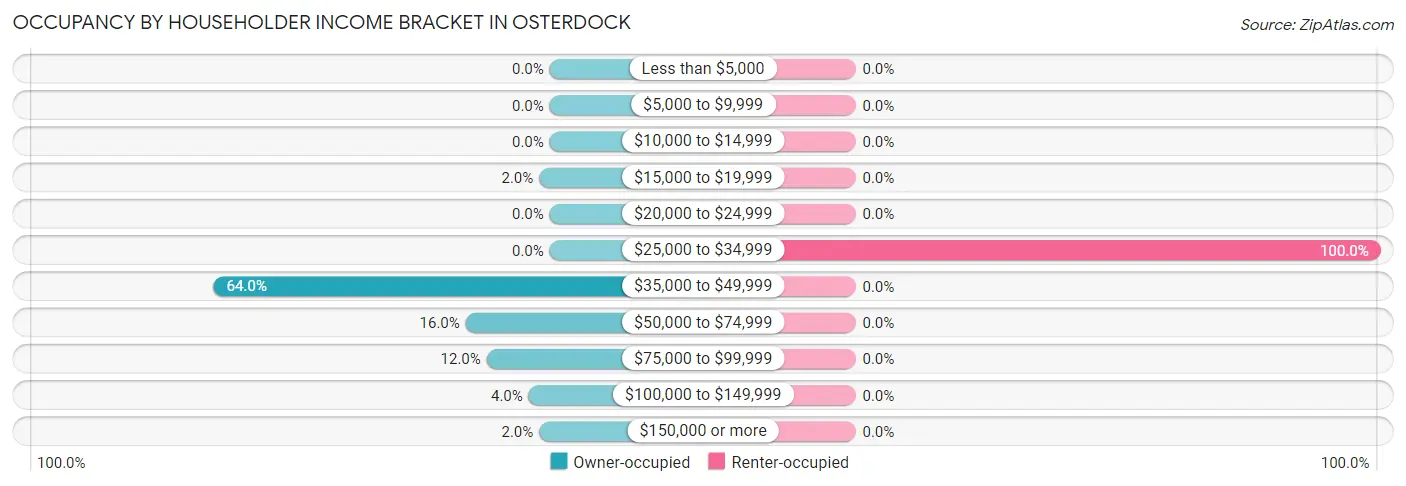
| Income Bracket | Owner-occupied | Renter-occupied |
| Less than $5,000 | 0 (0.0%) | 0 (0.0%) |
| $5,000 to $9,999 | 0 (0.0%) | 0 (0.0%) |
| $10,000 to $14,999 | 0 (0.0%) | 0 (0.0%) |
| $15,000 to $19,999 | 1 (2.0%) | 0 (0.0%) |
| $20,000 to $24,999 | 0 (0.0%) | 0 (0.0%) |
| $25,000 to $34,999 | 0 (0.0%) | 7 (100.0%) |
| $35,000 to $49,999 | 32 (64.0%) | 0 (0.0%) |
| $50,000 to $74,999 | 8 (16.0%) | 0 (0.0%) |
| $75,000 to $99,999 | 6 (12.0%) | 0 (0.0%) |
| $100,000 to $149,999 | 2 (4.0%) | 0 (0.0%) |
| $150,000 or more | 1 (2.0%) | 0 (0.0%) |
| Total | 50 (100.0%) | 7 (100.0%) |
Monthly Housing Cost Tiers in Osterdock
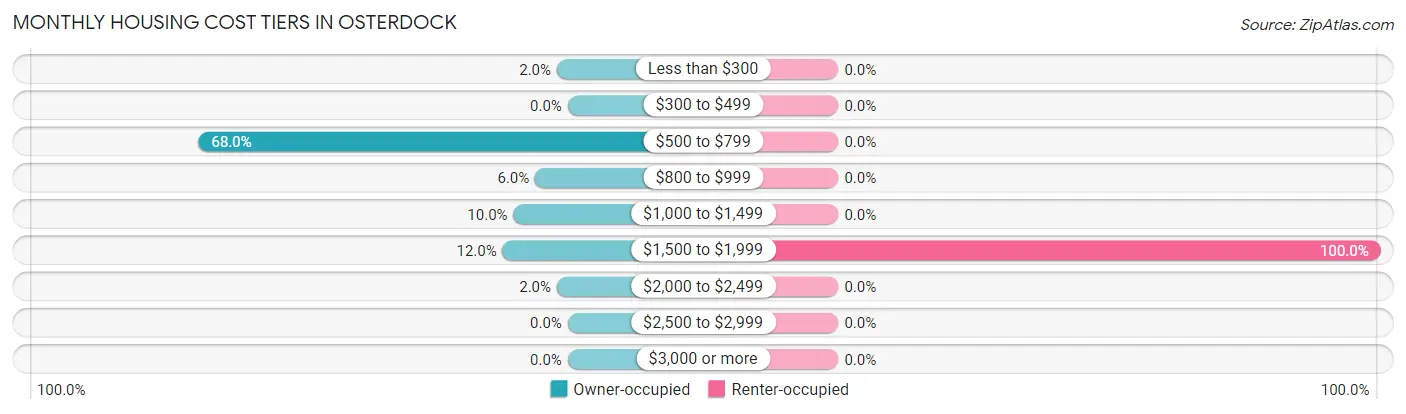
| Monthly Cost | Owner-occupied | Renter-occupied |
| Less than $300 | 1 (2.0%) | 0 (0.0%) |
| $300 to $499 | 0 (0.0%) | 0 (0.0%) |
| $500 to $799 | 34 (68.0%) | 0 (0.0%) |
| $800 to $999 | 3 (6.0%) | 0 (0.0%) |
| $1,000 to $1,499 | 5 (10.0%) | 0 (0.0%) |
| $1,500 to $1,999 | 6 (12.0%) | 7 (100.0%) |
| $2,000 to $2,499 | 1 (2.0%) | 0 (0.0%) |
| $2,500 to $2,999 | 0 (0.0%) | 0 (0.0%) |
| $3,000 or more | 0 (0.0%) | 0 (0.0%) |
| Total | 50 (100.0%) | 7 (100.0%) |
Physical Housing Characteristics in Osterdock
Housing Structures in Osterdock
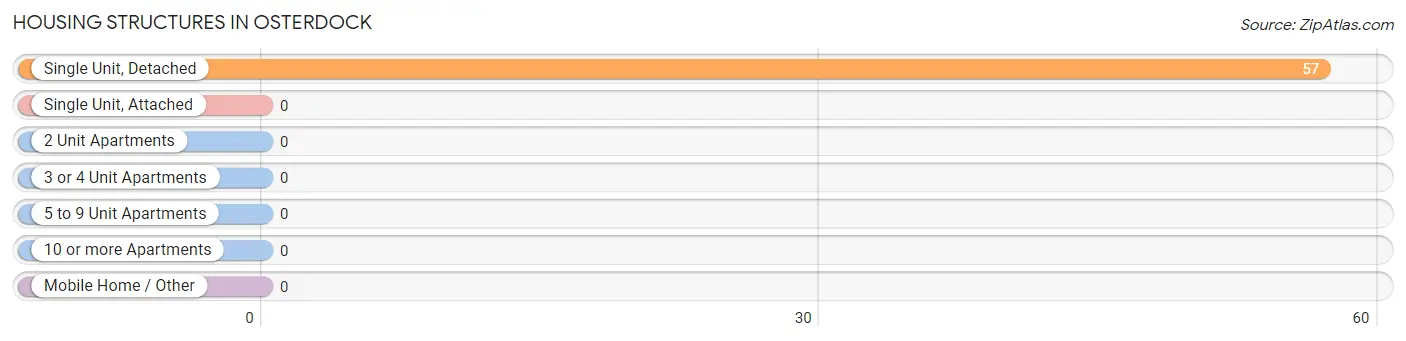
| Structure Type | # Housing Units | % Housing Units |
| Single Unit, Detached | 57 | 100.0% |
| Single Unit, Attached | 0 | 0.0% |
| 2 Unit Apartments | 0 | 0.0% |
| 3 or 4 Unit Apartments | 0 | 0.0% |
| 5 to 9 Unit Apartments | 0 | 0.0% |
| 10 or more Apartments | 0 | 0.0% |
| Mobile Home / Other | 0 | 0.0% |
| Total | 57 | 100.0% |
Housing Structures by Occupancy in Osterdock
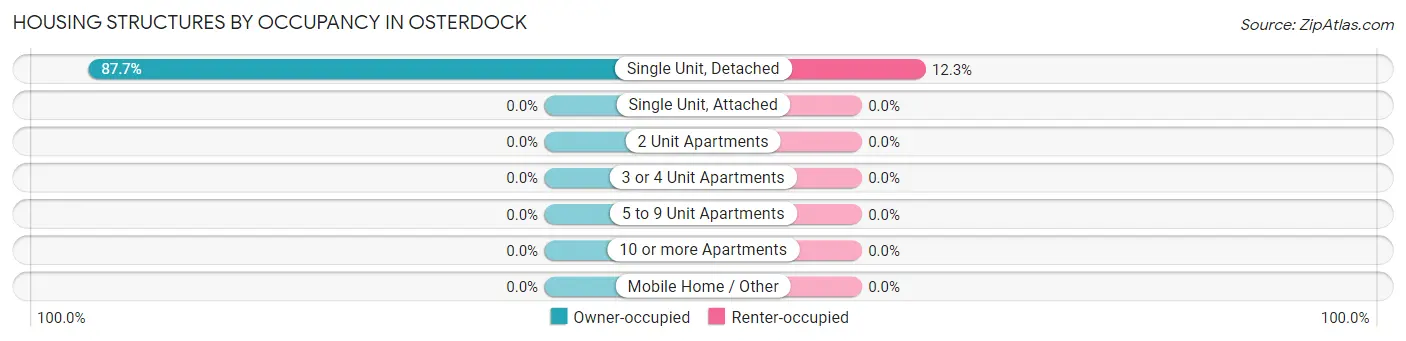
| Structure Type | Owner-occupied | Renter-occupied |
| Single Unit, Detached | 50 (87.7%) | 7 (12.3%) |
| Single Unit, Attached | 0 (0.0%) | 0 (0.0%) |
| 2 Unit Apartments | 0 (0.0%) | 0 (0.0%) |
| 3 or 4 Unit Apartments | 0 (0.0%) | 0 (0.0%) |
| 5 to 9 Unit Apartments | 0 (0.0%) | 0 (0.0%) |
| 10 or more Apartments | 0 (0.0%) | 0 (0.0%) |
| Mobile Home / Other | 0 (0.0%) | 0 (0.0%) |
| Total | 50 (87.7%) | 7 (12.3%) |
Housing Structures by Number of Rooms in Osterdock
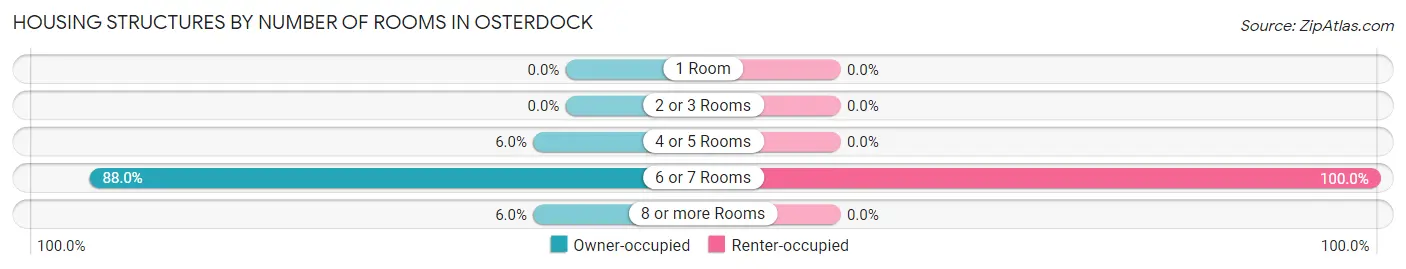
| Number of Rooms | Owner-occupied | Renter-occupied |
| 1 Room | 0 (0.0%) | 0 (0.0%) |
| 2 or 3 Rooms | 0 (0.0%) | 0 (0.0%) |
| 4 or 5 Rooms | 3 (6.0%) | 0 (0.0%) |
| 6 or 7 Rooms | 44 (88.0%) | 7 (100.0%) |
| 8 or more Rooms | 3 (6.0%) | 0 (0.0%) |
| Total | 50 (100.0%) | 7 (100.0%) |
Housing Structure by Heating Type in Osterdock
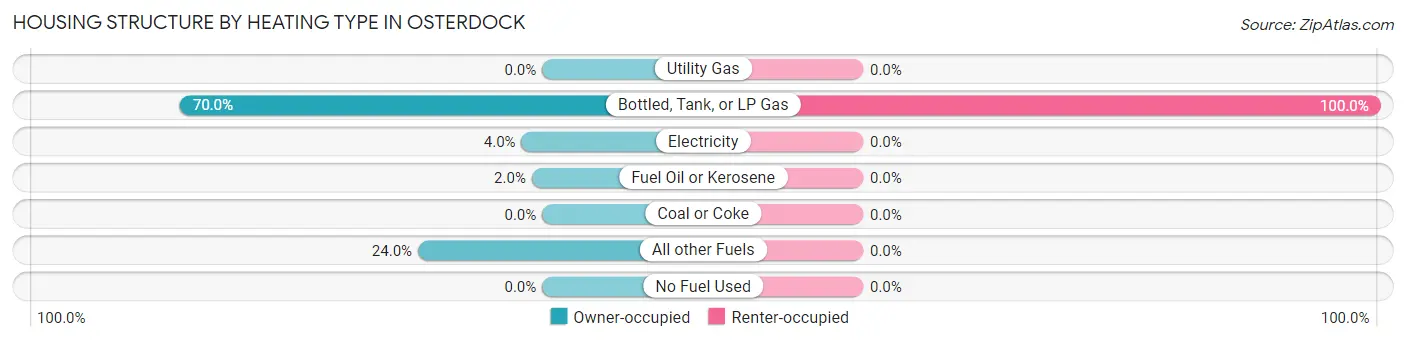
| Heating Type | Owner-occupied | Renter-occupied |
| Utility Gas | 0 (0.0%) | 0 (0.0%) |
| Bottled, Tank, or LP Gas | 35 (70.0%) | 7 (100.0%) |
| Electricity | 2 (4.0%) | 0 (0.0%) |
| Fuel Oil or Kerosene | 1 (2.0%) | 0 (0.0%) |
| Coal or Coke | 0 (0.0%) | 0 (0.0%) |
| All other Fuels | 12 (24.0%) | 0 (0.0%) |
| No Fuel Used | 0 (0.0%) | 0 (0.0%) |
| Total | 50 (100.0%) | 7 (100.0%) |
Household Vehicle Usage in Osterdock
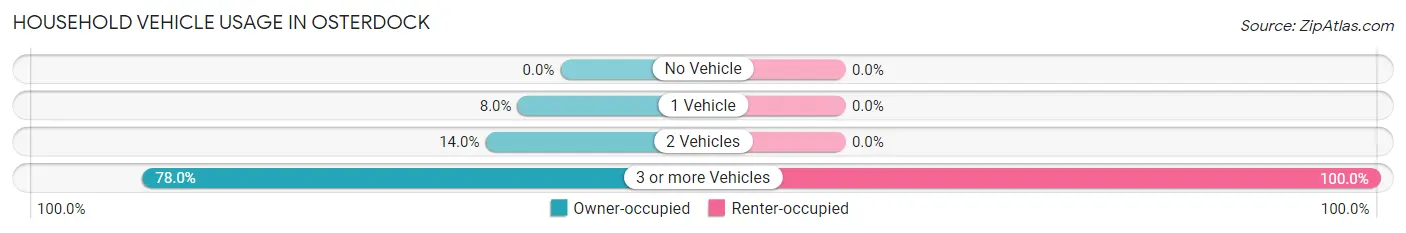
| Vehicles per Household | Owner-occupied | Renter-occupied |
| No Vehicle | 0 (0.0%) | 0 (0.0%) |
| 1 Vehicle | 4 (8.0%) | 0 (0.0%) |
| 2 Vehicles | 7 (14.0%) | 0 (0.0%) |
| 3 or more Vehicles | 39 (78.0%) | 7 (100.0%) |
| Total | 50 (100.0%) | 7 (100.0%) |
Real Estate & Mortgages in Osterdock
Real Estate and Mortgage Overview in Osterdock
| Characteristic | Without Mortgage | With Mortgage |
| Housing Units | 35 | 15 |
| Median Property Value | $76,500 | $0 |
| Median Household Income | $46,615 | $1 |
| Monthly Housing Costs | $566 | $0 |
| Real Estate Taxes | - | - |
Property Value by Mortgage Status in Osterdock
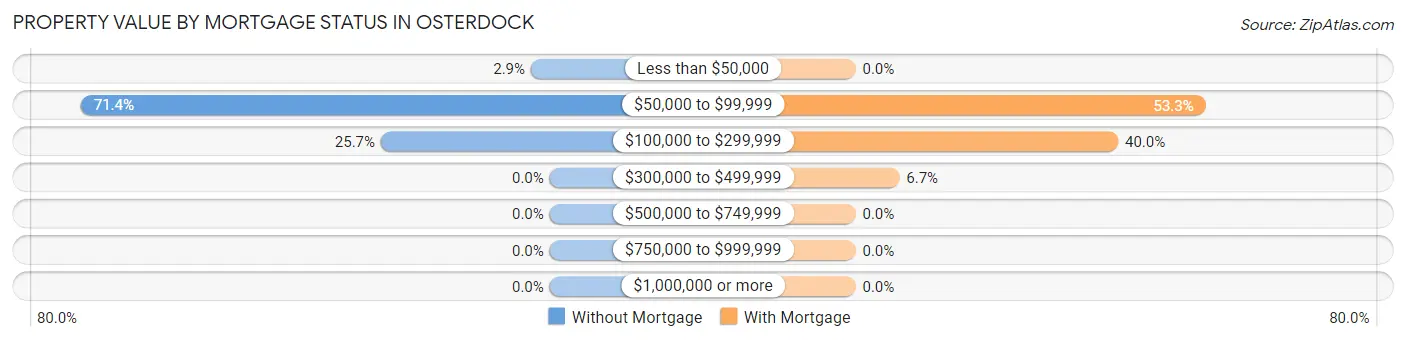
| Property Value | Without Mortgage | With Mortgage |
| Less than $50,000 | 1 (2.9%) | 0 (0.0%) |
| $50,000 to $99,999 | 25 (71.4%) | 8 (53.3%) |
| $100,000 to $299,999 | 9 (25.7%) | 6 (40.0%) |
| $300,000 to $499,999 | 0 (0.0%) | 1 (6.7%) |
| $500,000 to $749,999 | 0 (0.0%) | 0 (0.0%) |
| $750,000 to $999,999 | 0 (0.0%) | 0 (0.0%) |
| $1,000,000 or more | 0 (0.0%) | 0 (0.0%) |
| Total | 35 (100.0%) | 15 (100.0%) |
Household Income by Mortgage Status in Osterdock
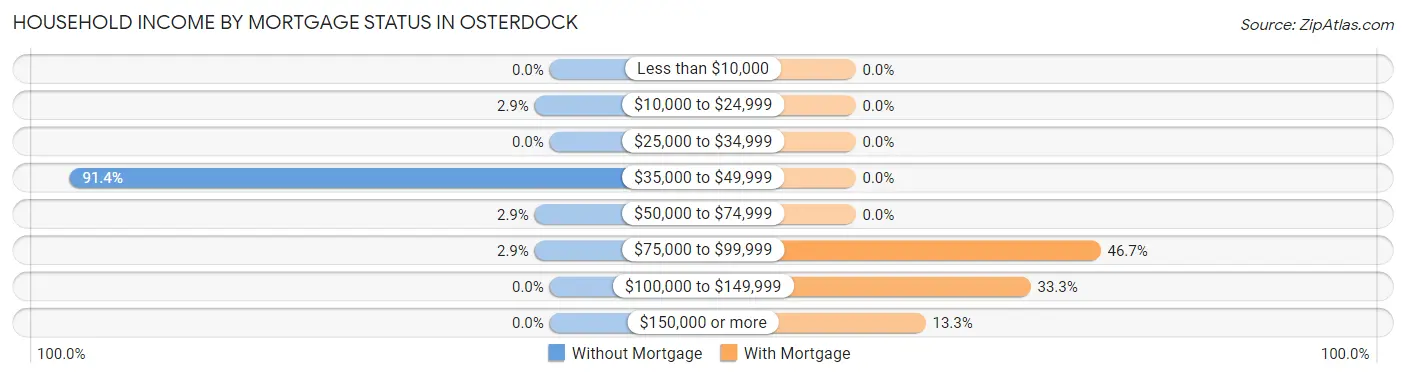
| Household Income | Without Mortgage | With Mortgage |
| Less than $10,000 | 0 (0.0%) | 0 (0.0%) |
| $10,000 to $24,999 | 1 (2.9%) | 0 (0.0%) |
| $25,000 to $34,999 | 0 (0.0%) | 0 (0.0%) |
| $35,000 to $49,999 | 32 (91.4%) | 0 (0.0%) |
| $50,000 to $74,999 | 1 (2.9%) | 0 (0.0%) |
| $75,000 to $99,999 | 1 (2.9%) | 7 (46.7%) |
| $100,000 to $149,999 | 0 (0.0%) | 5 (33.3%) |
| $150,000 or more | 0 (0.0%) | 2 (13.3%) |
| Total | 35 (100.0%) | 15 (100.0%) |
Property Value to Household Income Ratio in Osterdock
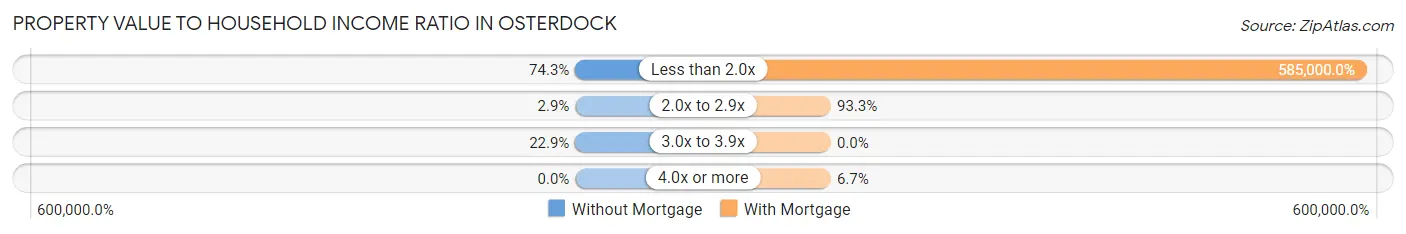
| Value-to-Income Ratio | Without Mortgage | With Mortgage |
| Less than 2.0x | 26 (74.3%) | 87,750 (585,000.0%) |
| 2.0x to 2.9x | 1 (2.9%) | 14 (93.3%) |
| 3.0x to 3.9x | 8 (22.9%) | 0 (0.0%) |
| 4.0x or more | 0 (0.0%) | 1 (6.7%) |
| Total | 35 (100.0%) | 15 (100.0%) |
Real Estate Taxes by Mortgage Status in Osterdock
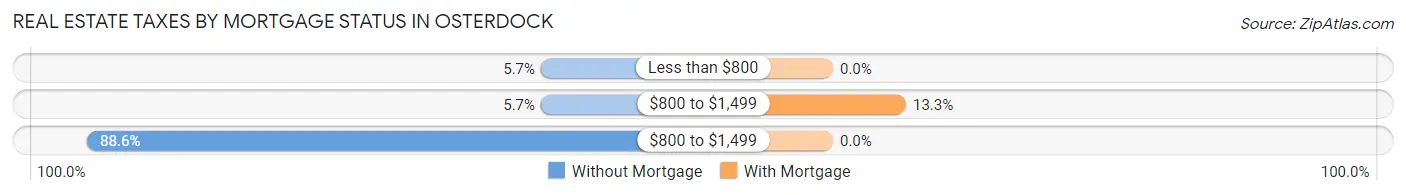
| Property Taxes | Without Mortgage | With Mortgage |
| Less than $800 | 2 (5.7%) | 0 (0.0%) |
| $800 to $1,499 | 2 (5.7%) | 2 (13.3%) |
| $800 to $1,499 | 31 (88.6%) | 0 (0.0%) |
| Total | 35 (100.0%) | 15 (100.0%) |
Health & Disability in Osterdock
Health Insurance Coverage by Age in Osterdock
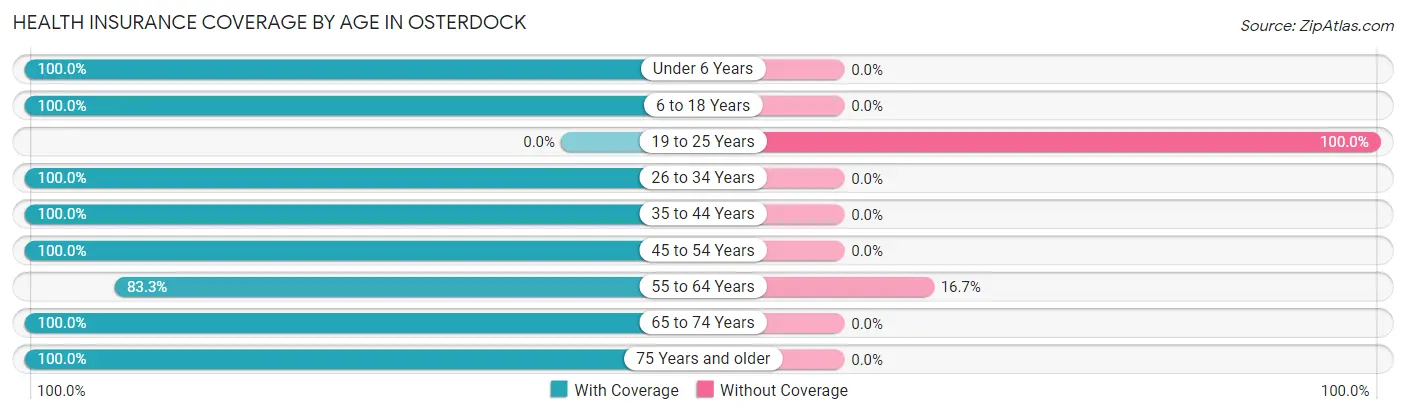
| Age Bracket | With Coverage | Without Coverage |
| Under 6 Years | 20 (100.0%) | 0 (0.0%) |
| 6 to 18 Years | 10 (100.0%) | 0 (0.0%) |
| 19 to 25 Years | 0 (0.0%) | 1 (100.0%) |
| 26 to 34 Years | 15 (100.0%) | 0 (0.0%) |
| 35 to 44 Years | 16 (100.0%) | 0 (0.0%) |
| 45 to 54 Years | 7 (100.0%) | 0 (0.0%) |
| 55 to 64 Years | 30 (83.3%) | 6 (16.7%) |
| 65 to 74 Years | 43 (100.0%) | 0 (0.0%) |
| 75 Years and older | 3 (100.0%) | 0 (0.0%) |
| Total | 144 (95.4%) | 7 (4.6%) |
Health Insurance Coverage by Citizenship Status in Osterdock

| Citizenship Status | With Coverage | Without Coverage |
| Native Born | 20 (100.0%) | 0 (0.0%) |
| Foreign Born, Citizen | 10 (100.0%) | 0 (0.0%) |
| Foreign Born, not a Citizen | 0 (0.0%) | 1 (100.0%) |
Health Insurance Coverage by Household Income in Osterdock
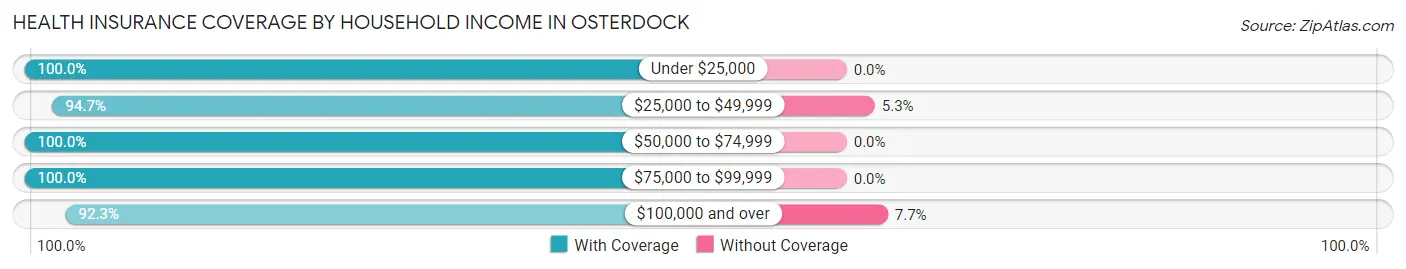
| Household Income | With Coverage | Without Coverage |
| Under $25,000 | 1 (100.0%) | 0 (0.0%) |
| $25,000 to $49,999 | 108 (94.7%) | 6 (5.3%) |
| $50,000 to $74,999 | 8 (100.0%) | 0 (0.0%) |
| $75,000 to $99,999 | 15 (100.0%) | 0 (0.0%) |
| $100,000 and over | 12 (92.3%) | 1 (7.7%) |
Public vs Private Health Insurance Coverage by Age in Osterdock
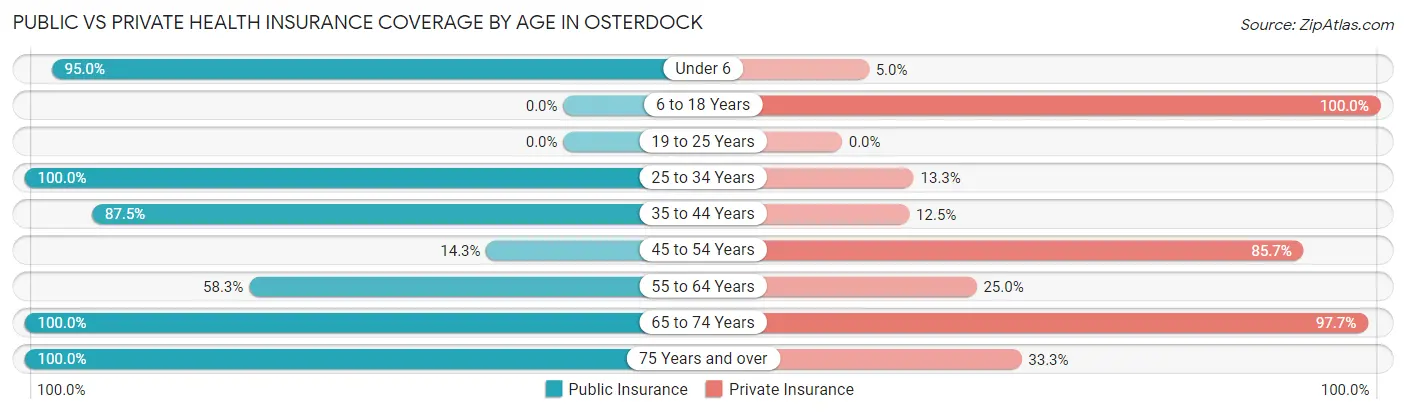
| Age Bracket | Public Insurance | Private Insurance |
| Under 6 | 19 (95.0%) | 1 (5.0%) |
| 6 to 18 Years | 0 (0.0%) | 10 (100.0%) |
| 19 to 25 Years | 0 (0.0%) | 0 (0.0%) |
| 25 to 34 Years | 15 (100.0%) | 2 (13.3%) |
| 35 to 44 Years | 14 (87.5%) | 2 (12.5%) |
| 45 to 54 Years | 1 (14.3%) | 6 (85.7%) |
| 55 to 64 Years | 21 (58.3%) | 9 (25.0%) |
| 65 to 74 Years | 43 (100.0%) | 42 (97.7%) |
| 75 Years and over | 3 (100.0%) | 1 (33.3%) |
| Total | 116 (76.8%) | 73 (48.3%) |
Disability Status by Sex by Age in Osterdock
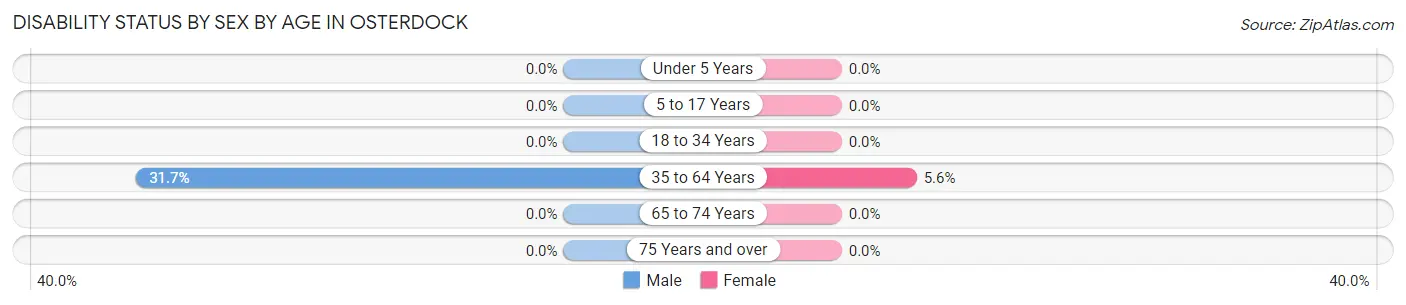
| Age Bracket | Male | Female |
| Under 5 Years | 0 (0.0%) | 0 (0.0%) |
| 5 to 17 Years | 0 (0.0%) | 0 (0.0%) |
| 18 to 34 Years | 0 (0.0%) | 0 (0.0%) |
| 35 to 64 Years | 13 (31.7%) | 1 (5.6%) |
| 65 to 74 Years | 0 (0.0%) | 0 (0.0%) |
| 75 Years and over | 0 (0.0%) | 0 (0.0%) |
Disability Class by Sex by Age in Osterdock
Disability Class: Hearing Difficulty
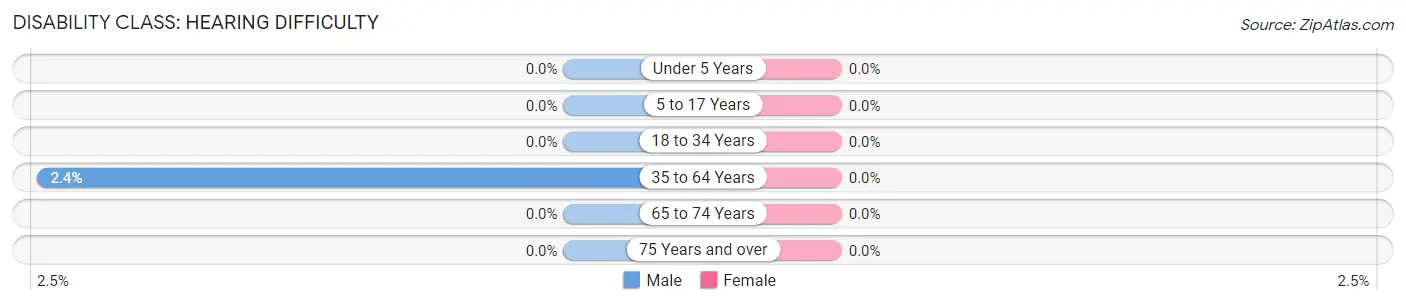
| Age Bracket | Male | Female |
| Under 5 Years | 0 (0.0%) | 0 (0.0%) |
| 5 to 17 Years | 0 (0.0%) | 0 (0.0%) |
| 18 to 34 Years | 0 (0.0%) | 0 (0.0%) |
| 35 to 64 Years | 1 (2.4%) | 0 (0.0%) |
| 65 to 74 Years | 0 (0.0%) | 0 (0.0%) |
| 75 Years and over | 0 (0.0%) | 0 (0.0%) |
Disability Class: Vision Difficulty
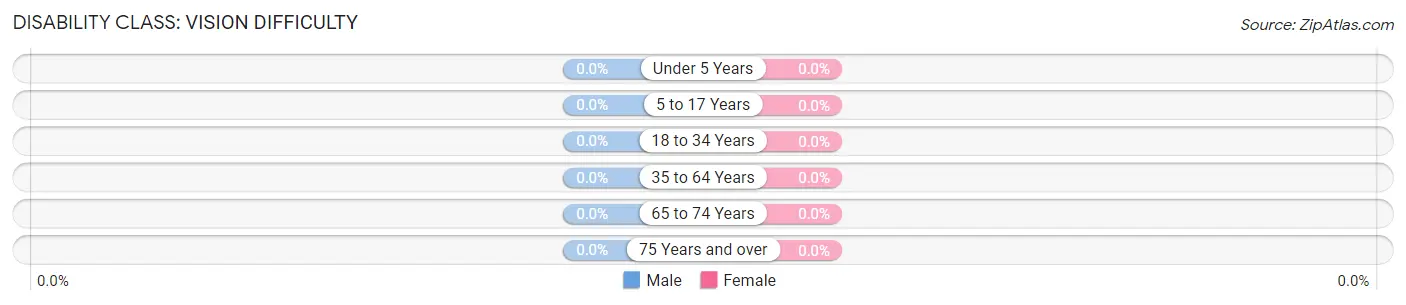
| Age Bracket | Male | Female |
| Under 5 Years | 0 (0.0%) | 0 (0.0%) |
| 5 to 17 Years | 0 (0.0%) | 0 (0.0%) |
| 18 to 34 Years | 0 (0.0%) | 0 (0.0%) |
| 35 to 64 Years | 0 (0.0%) | 0 (0.0%) |
| 65 to 74 Years | 0 (0.0%) | 0 (0.0%) |
| 75 Years and over | 0 (0.0%) | 0 (0.0%) |
Disability Class: Cognitive Difficulty
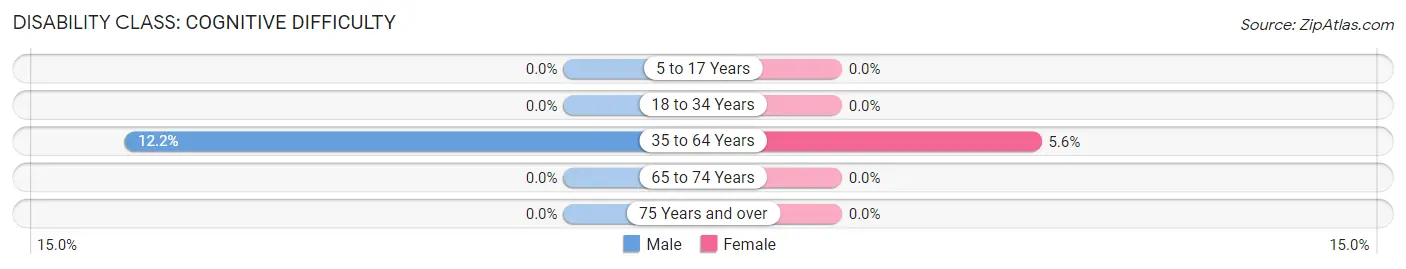
| Age Bracket | Male | Female |
| 5 to 17 Years | 0 (0.0%) | 0 (0.0%) |
| 18 to 34 Years | 0 (0.0%) | 0 (0.0%) |
| 35 to 64 Years | 5 (12.2%) | 1 (5.6%) |
| 65 to 74 Years | 0 (0.0%) | 0 (0.0%) |
| 75 Years and over | 0 (0.0%) | 0 (0.0%) |
Disability Class: Ambulatory Difficulty
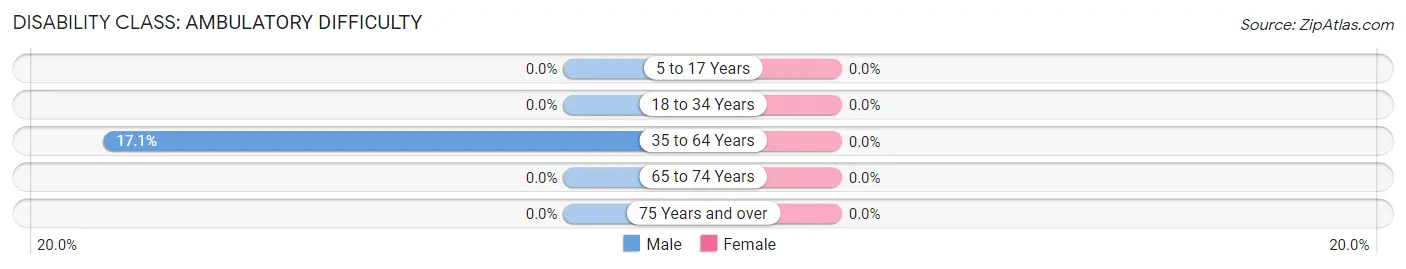
| Age Bracket | Male | Female |
| 5 to 17 Years | 0 (0.0%) | 0 (0.0%) |
| 18 to 34 Years | 0 (0.0%) | 0 (0.0%) |
| 35 to 64 Years | 7 (17.1%) | 0 (0.0%) |
| 65 to 74 Years | 0 (0.0%) | 0 (0.0%) |
| 75 Years and over | 0 (0.0%) | 0 (0.0%) |
Disability Class: Self-Care Difficulty
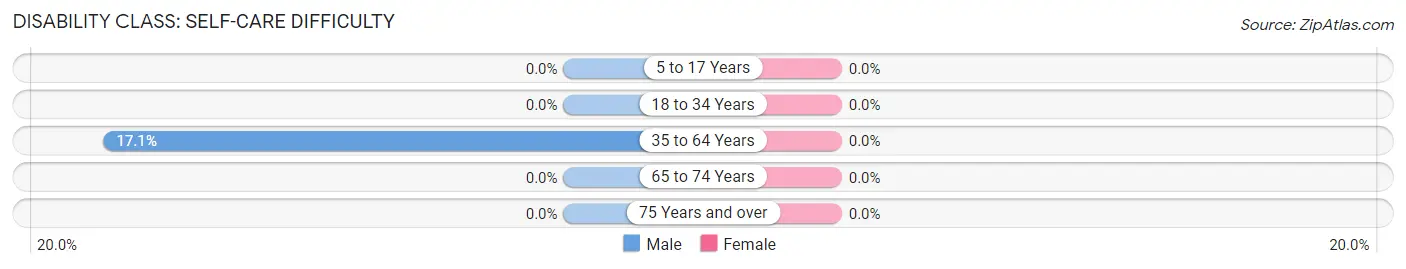
| Age Bracket | Male | Female |
| 5 to 17 Years | 0 (0.0%) | 0 (0.0%) |
| 18 to 34 Years | 0 (0.0%) | 0 (0.0%) |
| 35 to 64 Years | 7 (17.1%) | 0 (0.0%) |
| 65 to 74 Years | 0 (0.0%) | 0 (0.0%) |
| 75 Years and over | 0 (0.0%) | 0 (0.0%) |
Technology Access in Osterdock
Computing Device Access in Osterdock
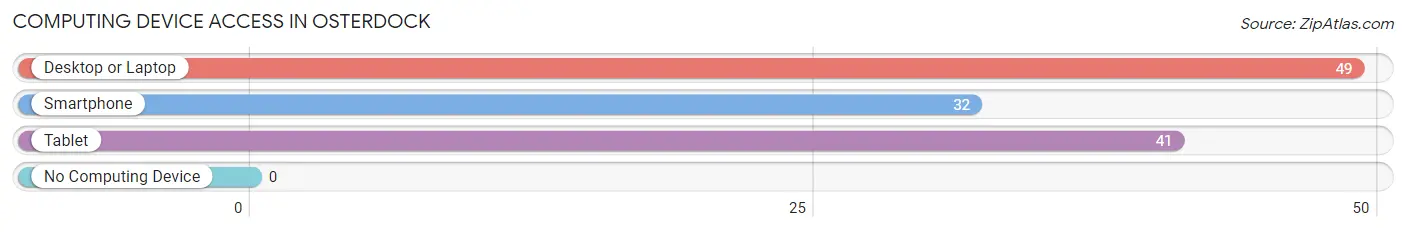
| Device Type | # Households | % Households |
| Desktop or Laptop | 49 | 86.0% |
| Smartphone | 32 | 56.1% |
| Tablet | 41 | 71.9% |
| No Computing Device | 0 | 0.0% |
| Total | 57 | 100.0% |
Internet Access in Osterdock
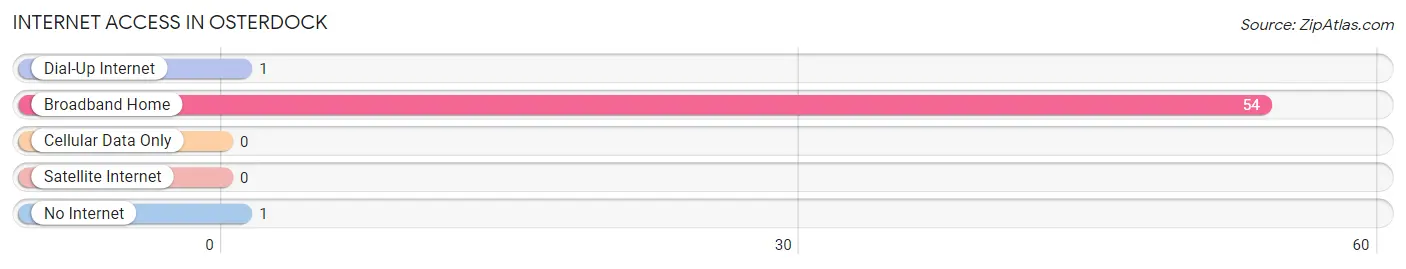
| Internet Type | # Households | % Households |
| Dial-Up Internet | 1 | 1.8% |
| Broadband Home | 54 | 94.7% |
| Cellular Data Only | 0 | 0.0% |
| Satellite Internet | 0 | 0.0% |
| No Internet | 1 | 1.8% |
| Total | 57 | 100.0% |
Osterdock Summary
Osterdock is a small unincorporated community located in Clayton County, Iowa. It is situated on the banks of the Turkey River, approximately five miles south of the county seat of Elkader. The population of Osterdock was estimated to be around 200 people in 2020.
History
Osterdock was founded in 1856 by German immigrants who had settled in the area. The town was named after the Oster family, who were among the first settlers. The town was originally known as Osterdock Station, as it was a stop on the Chicago, Milwaukee, St. Paul and Pacific Railroad. The railroad was built in 1856 and ran through the town until it was abandoned in the late 1970s.
The town was a thriving community in the late 19th and early 20th centuries. It had a post office, a general store, a blacksmith shop, a hotel, a school, and several churches. The town also had a large population of German immigrants, who brought with them their culture and traditions.
Geography
Osterdock is located in the northeast corner of Clayton County, Iowa. It is situated on the banks of the Turkey River, approximately five miles south of the county seat of Elkader. The town is surrounded by rolling hills and farmland. The climate is typical of the Midwest, with hot summers and cold winters.
Economy
The economy of Osterdock is largely based on agriculture. The town is surrounded by farmland, and many of the residents are involved in farming or related activities. The town also has a few small businesses, including a general store, a gas station, and a restaurant.
Demographics
The population of Osterdock was estimated to be around 200 people in 2020. The town is predominantly white, with a small minority population. The median household income is around $45,000, and the median home value is around $100,000. The town has a low unemployment rate and a high rate of homeownership.
Conclusion
Osterdock is a small unincorporated community located in Clayton County, Iowa. It is situated on the banks of the Turkey River, approximately five miles south of the county seat of Elkader. The population of Osterdock was estimated to be around 200 people in 2020. The town is predominantly white, with a small minority population. The economy of Osterdock is largely based on agriculture, and the town also has a few small businesses. The median household income is around $45,000, and the median home value is around $100,000. The town has a low unemployment rate and a high rate of homeownership.
Common Questions
What is Per Capita Income in Osterdock?
Per Capita income in Osterdock is $20,334.
What is the Median Family Income in Osterdock?
Median Family Income in Osterdock is $46,302.
What is the Median Household income in Osterdock?
Median Household Income in Osterdock is $47,031.
What is Inequality or Gini Index in Osterdock?
Inequality or Gini Index in Osterdock is 0.20.
What is the Total Population of Osterdock?
Total Population of Osterdock is 151.
What is the Total Male Population of Osterdock?
Total Male Population of Osterdock is 81.
What is the Total Female Population of Osterdock?
Total Female Population of Osterdock is 70.
What is the Ratio of Males per 100 Females in Osterdock?
There are 115.71 Males per 100 Females in Osterdock.
What is the Ratio of Females per 100 Males in Osterdock?
There are 86.42 Females per 100 Males in Osterdock.
What is the Median Population Age in Osterdock?
Median Population Age in Osterdock is 57.9 Years.
What is the Average Family Size in Osterdock
Average Family Size in Osterdock is 3.1 People.
What is the Average Household Size in Osterdock
Average Household Size in Osterdock is 2.6 People.
How Large is the Labor Force in Osterdock?
There are 58 People in the Labor Forcein in Osterdock.
What is the Percentage of People in the Labor Force in Osterdock?
45.0% of People are in the Labor Force in Osterdock.
What is the Unemployment Rate in Osterdock?
Unemployment Rate in Osterdock is 39.7%.