Ambrose, GA Map & Demographics
Ambrose Map
Ambrose Overview
$24,172
PER CAPITA INCOME
$24,722
AVG HOUSEHOLD INCOME
0.59
INEQUALITY / GINI INDEX
221
TOTAL POPULATION
92
MALE POPULATION
129
FEMALE POPULATION
71.32
MALES / 100 FEMALES
140.22
FEMALES / 100 MALES
42.0
MEDIAN AGE
3.3
AVG FAMILY SIZE
2.4
AVG HOUSEHOLD SIZE
106
LABOR FORCE [ PEOPLE ]
54.6%
PERCENT IN LABOR FORCE
11.3%
UNEMPLOYMENT RATE
Ambrose Zip Codes
Ambrose Area Codes
Income in Ambrose
Income Overview in Ambrose
| Characteristic | Number | Measure |
| Per Capita Income | 221 | $24,172 |
| Median Family Income | 52 | $0 |
| Mean Family Income | 52 | $63,744 |
| Median Household Income | 94 | $24,722 |
| Mean Household Income | 94 | $48,746 |
| Income Deficit | 52 | $0 |
| Wage / Income Gap (%) | 221 | 0.00% |
| Wage / Income Gap ($) | 221 | 100.00¢ per $1 |
| Gini / Inequality Index | 221 | 0.59 |
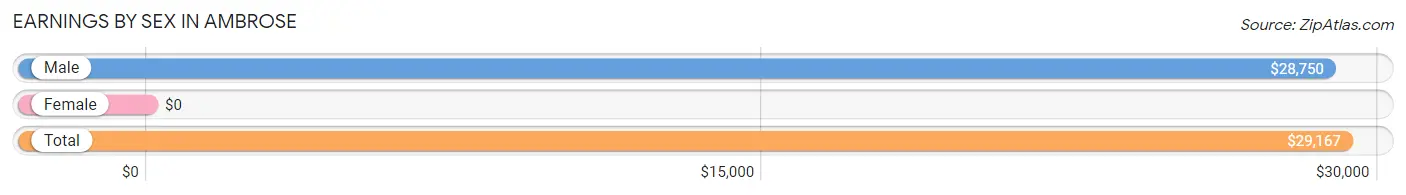
Earnings by Sex in Ambrose
| Sex | Number | Average Earnings |
| Male | 47 (47.0%) | $28,750 |
| Female | 53 (53.0%) | $0 |
| Total | 100 (100.0%) | $29,167 |
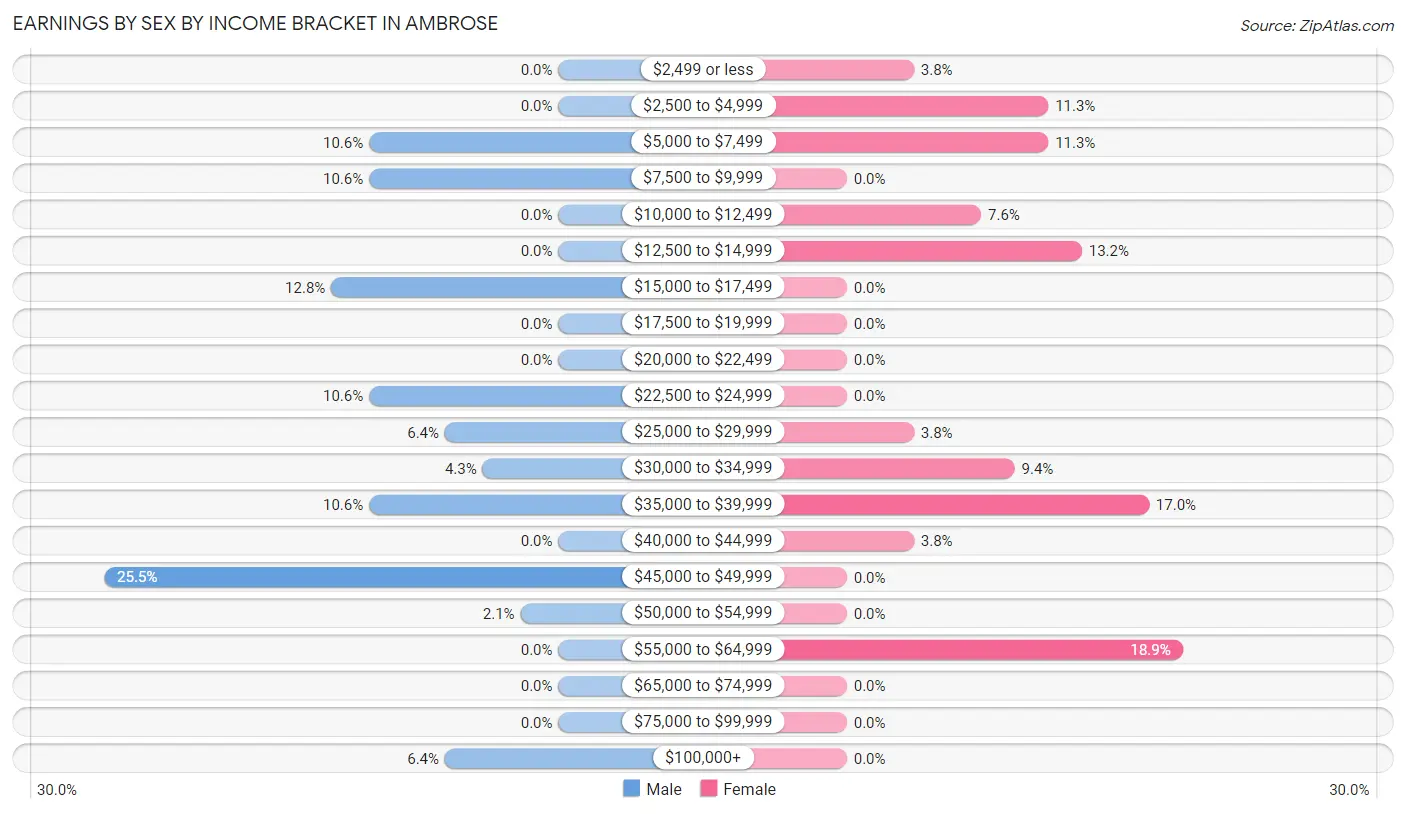
Earnings by Sex by Income Bracket in Ambrose
The most common earnings brackets in Ambrose are $45,000 to $49,999 for men (12 | 25.5%) and $55,000 to $64,999 for women (10 | 18.9%).
| Income | Male | Female |
| $2,499 or less | 0 (0.0%) | 2 (3.8%) |
| $2,500 to $4,999 | 0 (0.0%) | 6 (11.3%) |
| $5,000 to $7,499 | 5 (10.6%) | 6 (11.3%) |
| $7,500 to $9,999 | 5 (10.6%) | 0 (0.0%) |
| $10,000 to $12,499 | 0 (0.0%) | 4 (7.5%) |
| $12,500 to $14,999 | 0 (0.0%) | 7 (13.2%) |
| $15,000 to $17,499 | 6 (12.8%) | 0 (0.0%) |
| $17,500 to $19,999 | 0 (0.0%) | 0 (0.0%) |
| $20,000 to $22,499 | 0 (0.0%) | 0 (0.0%) |
| $22,500 to $24,999 | 5 (10.6%) | 0 (0.0%) |
| $25,000 to $29,999 | 3 (6.4%) | 2 (3.8%) |
| $30,000 to $34,999 | 2 (4.3%) | 5 (9.4%) |
| $35,000 to $39,999 | 5 (10.6%) | 9 (17.0%) |
| $40,000 to $44,999 | 0 (0.0%) | 2 (3.8%) |
| $45,000 to $49,999 | 12 (25.5%) | 0 (0.0%) |
| $50,000 to $54,999 | 1 (2.1%) | 0 (0.0%) |
| $55,000 to $64,999 | 0 (0.0%) | 10 (18.9%) |
| $65,000 to $74,999 | 0 (0.0%) | 0 (0.0%) |
| $75,000 to $99,999 | 0 (0.0%) | 0 (0.0%) |
| $100,000+ | 3 (6.4%) | 0 (0.0%) |
| Total | 47 (100.0%) | 53 (100.0%) |
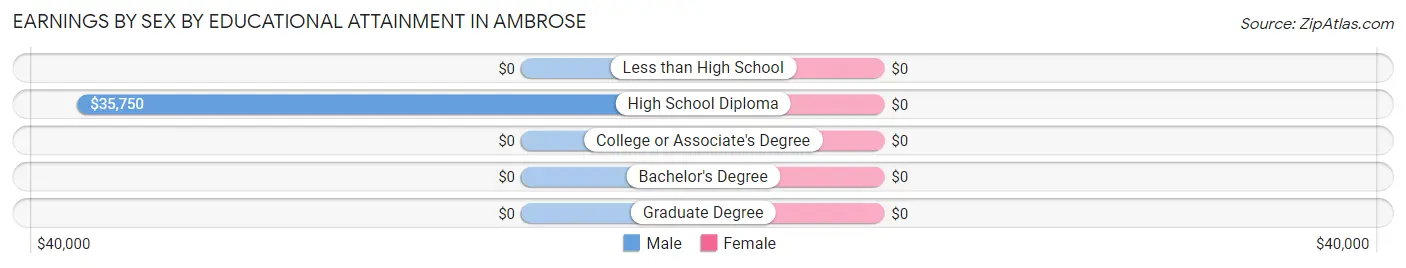
Earnings by Sex by Educational Attainment in Ambrose
| Educational Attainment | Male Income | Female Income |
| Less than High School | - | - |
| High School Diploma | $35,750 | $0 |
| College or Associate's Degree | - | - |
| Bachelor's Degree | - | - |
| Graduate Degree | - | - |
| Total | $26,875 | $0 |
Family Income in Ambrose
Family Income Brackets in Ambrose
According to the Ambrose family income data, there are 15 families falling into the $10,000 to $14,999 income range, which is the most common income bracket and makes up 28.8% of all families.
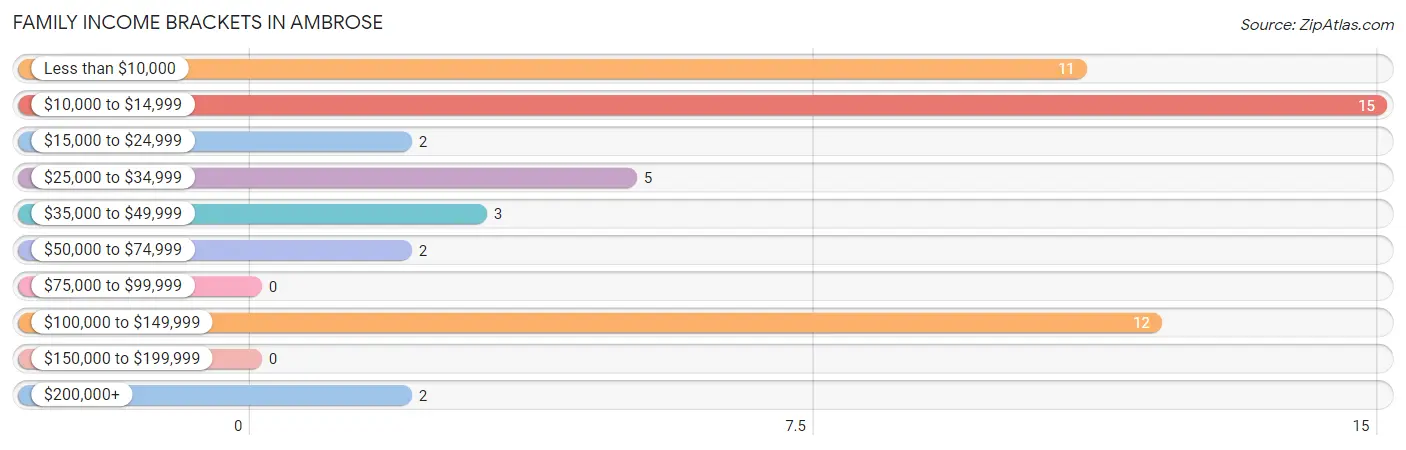
| Income Bracket | # Families | % Families |
| Less than $10,000 | 11 | 21.2% |
| $10,000 to $14,999 | 15 | 28.8% |
| $15,000 to $24,999 | 2 | 3.8% |
| $25,000 to $34,999 | 5 | 9.6% |
| $35,000 to $49,999 | 3 | 5.8% |
| $50,000 to $74,999 | 2 | 3.8% |
| $75,000 to $99,999 | 0 | 0.0% |
| $100,000 to $149,999 | 12 | 23.1% |
| $150,000 to $199,999 | 0 | 0.0% |
| $200,000+ | 2 | 3.8% |
Family Income by Famaliy Size in Ambrose
2-person families (18 | 34.6%) account for the highest median family income in Ambrose with $17,500 per family, while 2-person families (18 | 34.6%) have the highest median income of $8,750 per family member.
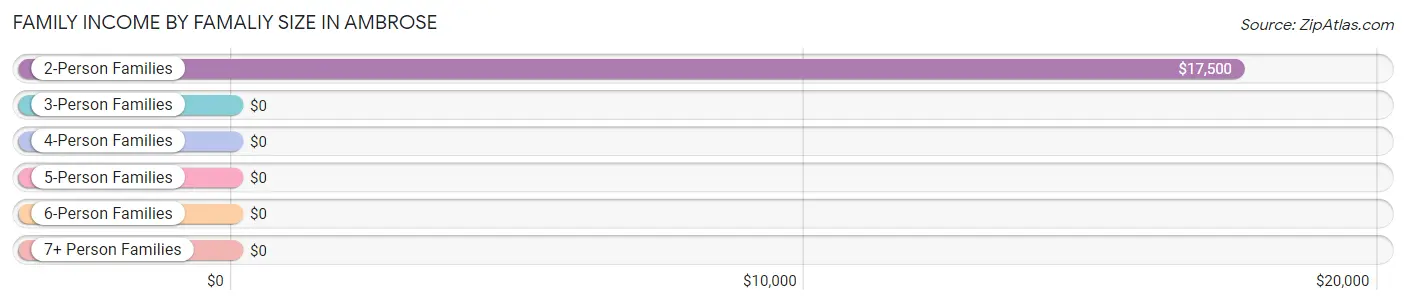
| Income Bracket | # Families | Median Income |
| 2-Person Families | 18 (34.6%) | $17,500 |
| 3-Person Families | 20 (38.5%) | $0 |
| 4-Person Families | 14 (26.9%) | $0 |
| 5-Person Families | 0 (0.0%) | $0 |
| 6-Person Families | 0 (0.0%) | $0 |
| 7+ Person Families | 0 (0.0%) | $0 |
| Total | 52 (100.0%) | $0 |
Family Income by Number of Earners in Ambrose
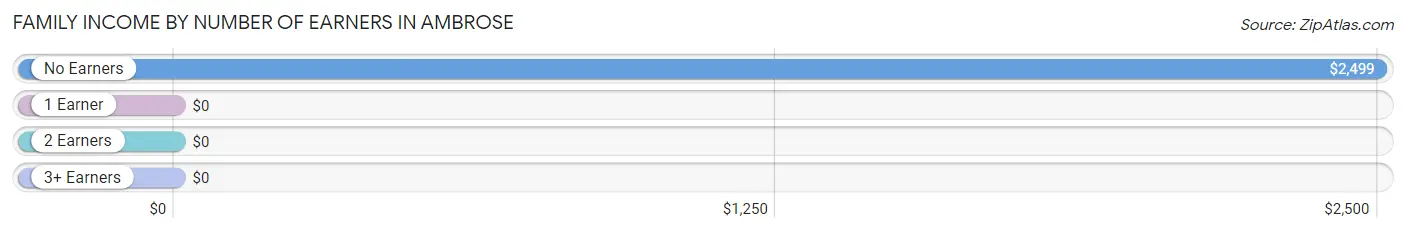
| Number of Earners | # Families | Median Income |
| No Earners | 15 (28.8%) | $2,499 |
| 1 Earner | 12 (23.1%) | $0 |
| 2 Earners | 21 (40.4%) | $0 |
| 3+ Earners | 4 (7.7%) | $0 |
| Total | 52 (100.0%) | $0 |
Household Income in Ambrose
Household Income Brackets in Ambrose
With 26 households falling in the category, the $10,000 to $14,999 income range is the most frequent in Ambrose, accounting for 27.7% of all households.
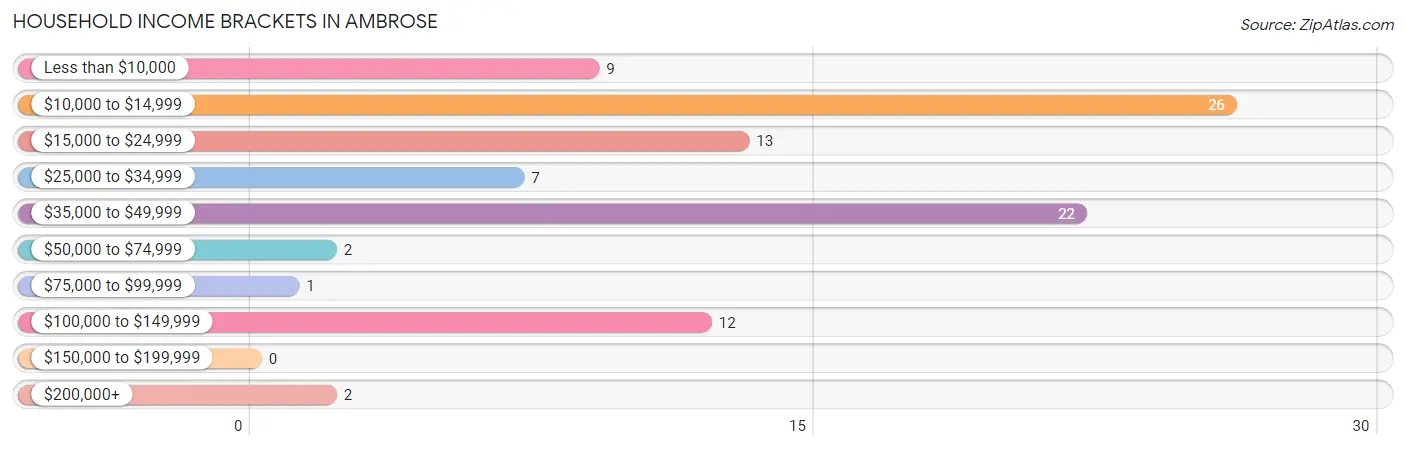
| Income Bracket | # Households | % Households |
| Less than $10,000 | 9 | 9.6% |
| $10,000 to $14,999 | 26 | 27.7% |
| $15,000 to $24,999 | 13 | 13.8% |
| $25,000 to $34,999 | 7 | 7.4% |
| $35,000 to $49,999 | 22 | 23.4% |
| $50,000 to $74,999 | 2 | 2.1% |
| $75,000 to $99,999 | 1 | 1.1% |
| $100,000 to $149,999 | 12 | 12.8% |
| $150,000 to $199,999 | 0 | 0.0% |
| $200,000+ | 2 | 2.1% |
Household Income by Householder Age in Ambrose
The median household income in Ambrose is $24,722, with the highest median household income of $27,083 found in the 45 to 64 years age bracket for the primary householder. A total of 31 households (33.0%) fall into this category. Meanwhile, the 15 to 24 years age bracket for the primary householder has the lowest median household income of $0, with 3 households (3.2%) in this group.
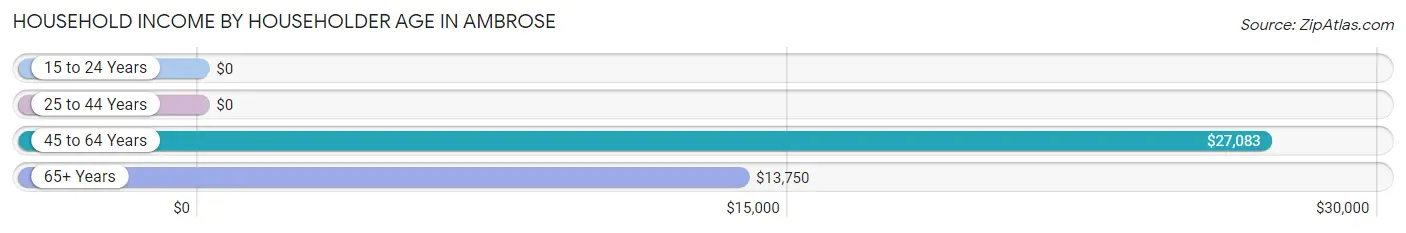
| Income Bracket | # Households | Median Income |
| 15 to 24 Years | 3 (3.2%) | $0 |
| 25 to 44 Years | 36 (38.3%) | $0 |
| 45 to 64 Years | 31 (33.0%) | $27,083 |
| 65+ Years | 24 (25.5%) | $13,750 |
| Total | 94 (100.0%) | $24,722 |
Poverty in Ambrose
Income Below Poverty by Sex and Age in Ambrose
With 43.5% poverty level for males and 40.3% for females among the residents of Ambrose, 6 to 11 year old males and under 5 year old females are the most vulnerable to poverty, with 11 males (100.0%) and 1 females (100.0%) in their respective age groups living below the poverty level.
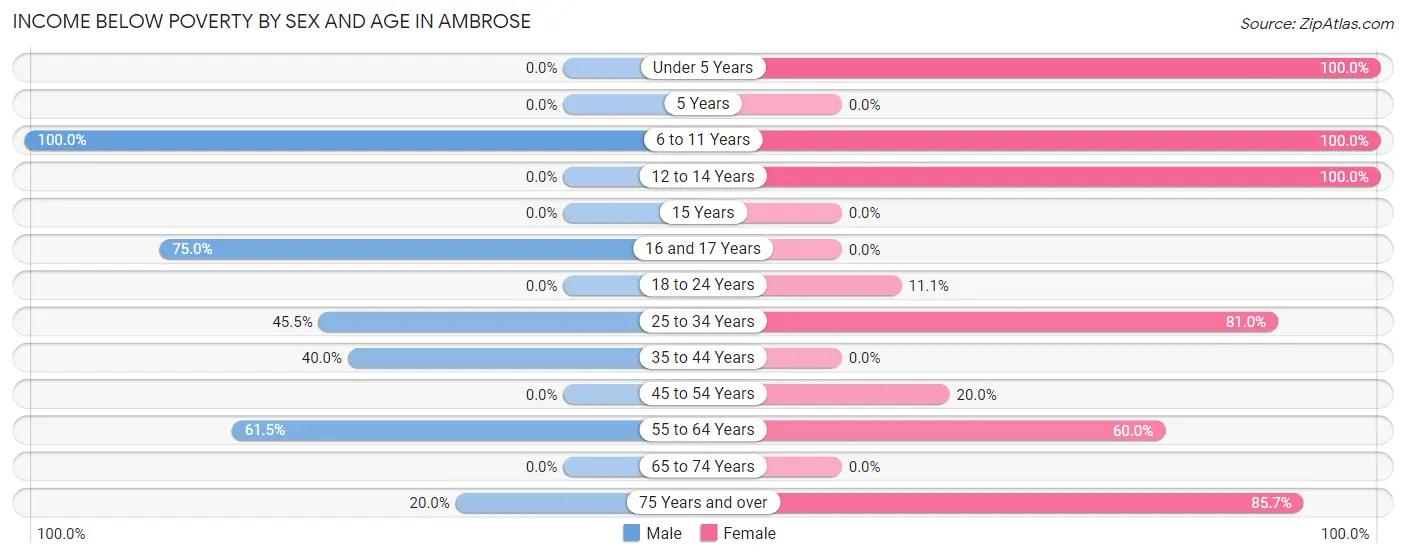
| Age Bracket | Male | Female |
| Under 5 Years | 0 (0.0%) | 1 (100.0%) |
| 5 Years | 0 (0.0%) | 0 (0.0%) |
| 6 to 11 Years | 11 (100.0%) | 6 (100.0%) |
| 12 to 14 Years | 0 (0.0%) | 6 (100.0%) |
| 15 Years | 0 (0.0%) | 0 (0.0%) |
| 16 and 17 Years | 6 (75.0%) | 0 (0.0%) |
| 18 to 24 Years | 0 (0.0%) | 1 (11.1%) |
| 25 to 34 Years | 5 (45.5%) | 17 (80.9%) |
| 35 to 44 Years | 8 (40.0%) | 0 (0.0%) |
| 45 to 54 Years | 0 (0.0%) | 3 (20.0%) |
| 55 to 64 Years | 8 (61.5%) | 6 (60.0%) |
| 65 to 74 Years | 0 (0.0%) | 0 (0.0%) |
| 75 Years and over | 2 (20.0%) | 12 (85.7%) |
| Total | 40 (43.5%) | 52 (40.3%) |
Income Above Poverty by Sex and Age in Ambrose
According to the poverty statistics in Ambrose, males aged under 5 years and females aged 15 years are the age groups that are most secure financially, with 100.0% of males and 100.0% of females in these age groups living above the poverty line.
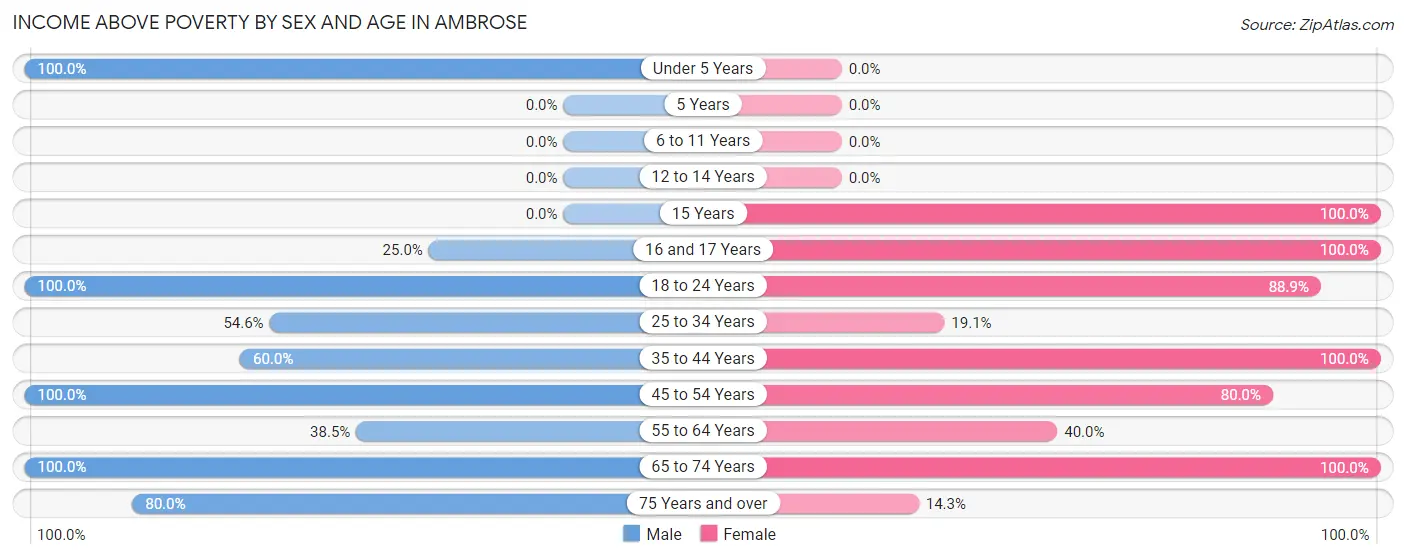
| Age Bracket | Male | Female |
| Under 5 Years | 1 (100.0%) | 0 (0.0%) |
| 5 Years | 0 (0.0%) | 0 (0.0%) |
| 6 to 11 Years | 0 (0.0%) | 0 (0.0%) |
| 12 to 14 Years | 0 (0.0%) | 0 (0.0%) |
| 15 Years | 0 (0.0%) | 2 (100.0%) |
| 16 and 17 Years | 2 (25.0%) | 1 (100.0%) |
| 18 to 24 Years | 2 (100.0%) | 8 (88.9%) |
| 25 to 34 Years | 6 (54.5%) | 4 (19.1%) |
| 35 to 44 Years | 12 (60.0%) | 13 (100.0%) |
| 45 to 54 Years | 14 (100.0%) | 12 (80.0%) |
| 55 to 64 Years | 5 (38.5%) | 4 (40.0%) |
| 65 to 74 Years | 2 (100.0%) | 31 (100.0%) |
| 75 Years and over | 8 (80.0%) | 2 (14.3%) |
| Total | 52 (56.5%) | 77 (59.7%) |
Income Below Poverty Among Married-Couple Families in Ambrose
The poverty statistics for married-couple families in Ambrose show that 33.3% or 12 of the total 36 families live below the poverty line. Families with 1 or 2 children have the highest poverty rate of 58.3%, comprising of 7 families. On the other hand, families with no children have the lowest poverty rate of 20.8%, which includes 5 families.
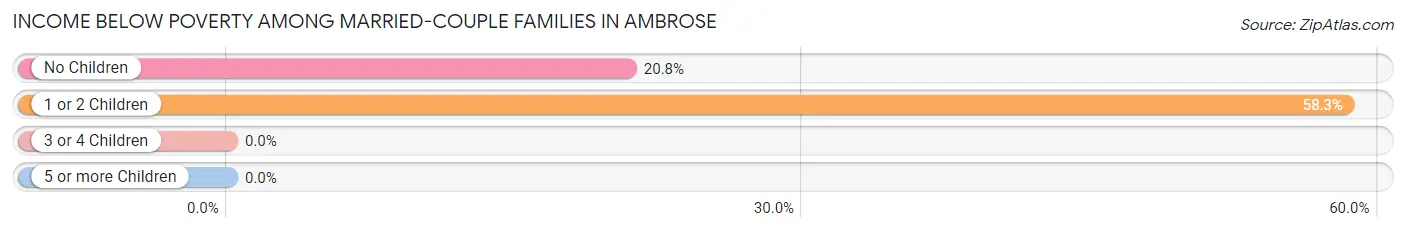
| Children | Above Poverty | Below Poverty |
| No Children | 19 (79.2%) | 5 (20.8%) |
| 1 or 2 Children | 5 (41.7%) | 7 (58.3%) |
| 3 or 4 Children | 0 (0.0%) | 0 (0.0%) |
| 5 or more Children | 0 (0.0%) | 0 (0.0%) |
| Total | 24 (66.7%) | 12 (33.3%) |
Income Below Poverty Among Single-Parent Households in Ambrose
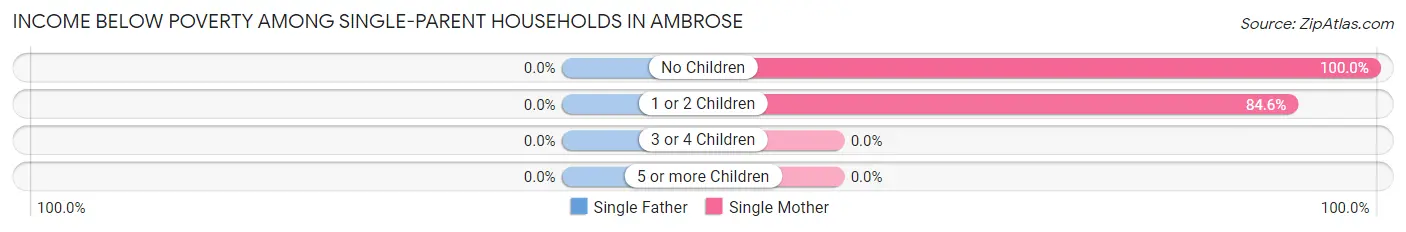
| Children | Single Father | Single Mother |
| No Children | 0 (0.0%) | 3 (100.0%) |
| 1 or 2 Children | 0 (0.0%) | 11 (84.6%) |
| 3 or 4 Children | 0 (0.0%) | 0 (0.0%) |
| 5 or more Children | 0 (0.0%) | 0 (0.0%) |
| Total | 0 (0.0%) | 14 (87.5%) |
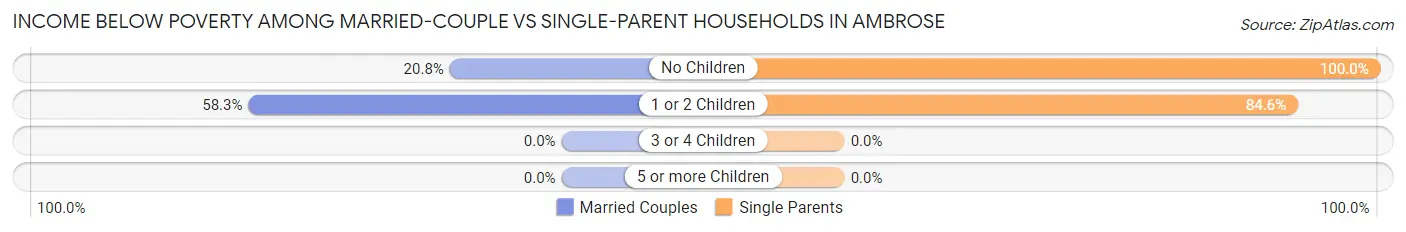
Income Below Poverty Among Married-Couple vs Single-Parent Households in Ambrose
The poverty data for Ambrose shows that 12 of the married-couple family households (33.3%) and 14 of the single-parent households (87.5%) are living below the poverty level. Within the married-couple family households, those with 1 or 2 children have the highest poverty rate, with 7 households (58.3%) falling below the poverty line. Among the single-parent households, those with no children have the highest poverty rate, with 3 household (100.0%) living below poverty.
| Children | Married-Couple Families | Single-Parent Households |
| No Children | 5 (20.8%) | 3 (100.0%) |
| 1 or 2 Children | 7 (58.3%) | 11 (84.6%) |
| 3 or 4 Children | 0 (0.0%) | 0 (0.0%) |
| 5 or more Children | 0 (0.0%) | 0 (0.0%) |
| Total | 12 (33.3%) | 14 (87.5%) |
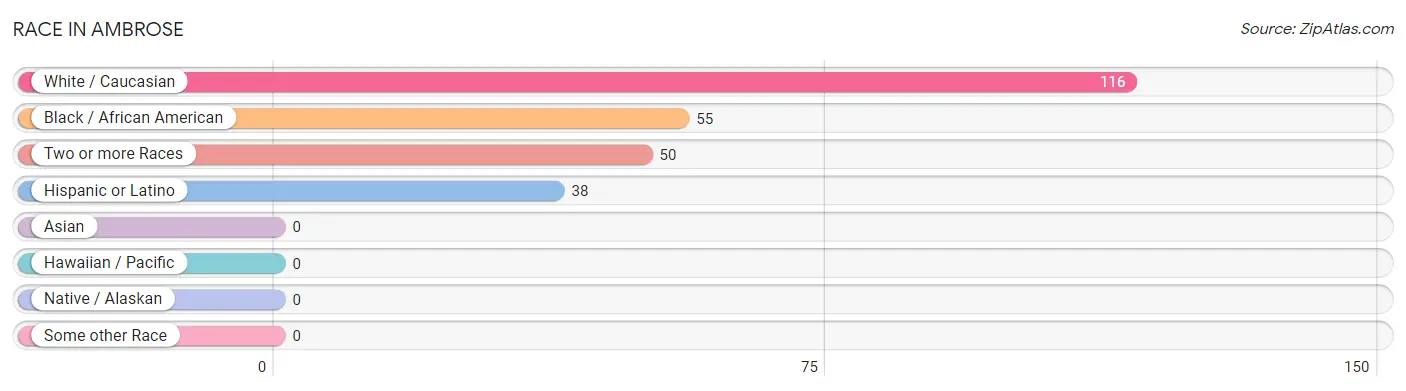
Race in Ambrose
The most populous races in Ambrose are White / Caucasian (116 | 52.5%), Black / African American (55 | 24.9%), and Two or more Races (50 | 22.6%).
| Race | # Population | % Population |
| Asian | 0 | 0.0% |
| Black / African American | 55 | 24.9% |
| Hawaiian / Pacific | 0 | 0.0% |
| Hispanic or Latino | 38 | 17.2% |
| Native / Alaskan | 0 | 0.0% |
| White / Caucasian | 116 | 52.5% |
| Two or more Races | 50 | 22.6% |
| Some other Race | 0 | 0.0% |
| Total | 221 | 100.0% |
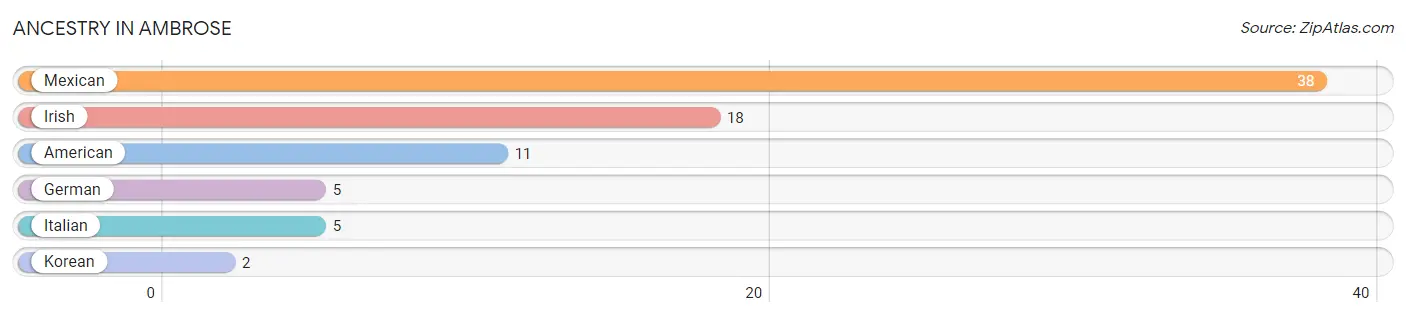
Ancestry in Ambrose
The most populous ancestries reported in Ambrose are Mexican (38 | 17.2%), Irish (18 | 8.1%), American (11 | 5.0%), German (5 | 2.3%), and Italian (5 | 2.3%), together accounting for 34.8% of all Ambrose residents.
| Ancestry | # Population | % Population |
| American | 11 | 5.0% |
| German | 5 | 2.3% |
| Irish | 18 | 8.1% |
| Italian | 5 | 2.3% |
| Korean | 2 | 0.9% |
| Mexican | 38 | 17.2% | View All 6 Rows |
Immigrants in Ambrose
The most numerous immigrant groups reported in Ambrose came from Central America (26 | 11.8%), Latin America (26 | 11.8%), Mexico (26 | 11.8%), and Canada (2 | 0.9%), together accounting for 36.2% of all Ambrose residents.
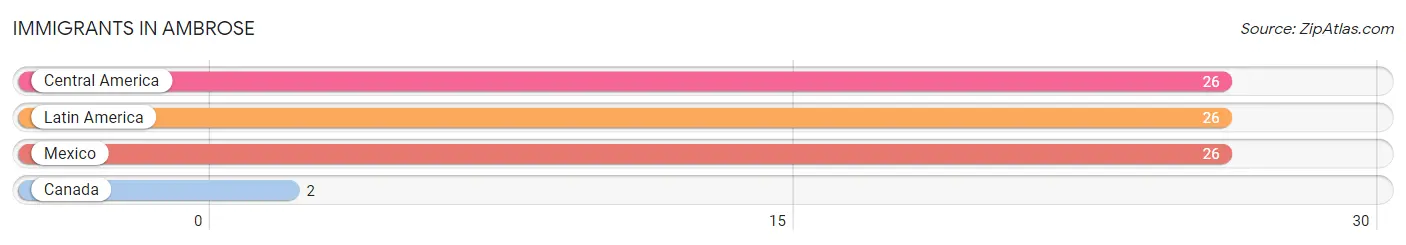
| Immigration Origin | # Population | % Population |
| Canada | 2 | 0.9% |
| Central America | 26 | 11.8% |
| Latin America | 26 | 11.8% |
| Mexico | 26 | 11.8% | View All 4 Rows |
Sex and Age in Ambrose
Sex and Age in Ambrose
The most populous age groups in Ambrose are 40 to 44 Years (14 | 15.2%) for men and 65 to 69 Years (29 | 22.5%) for women.
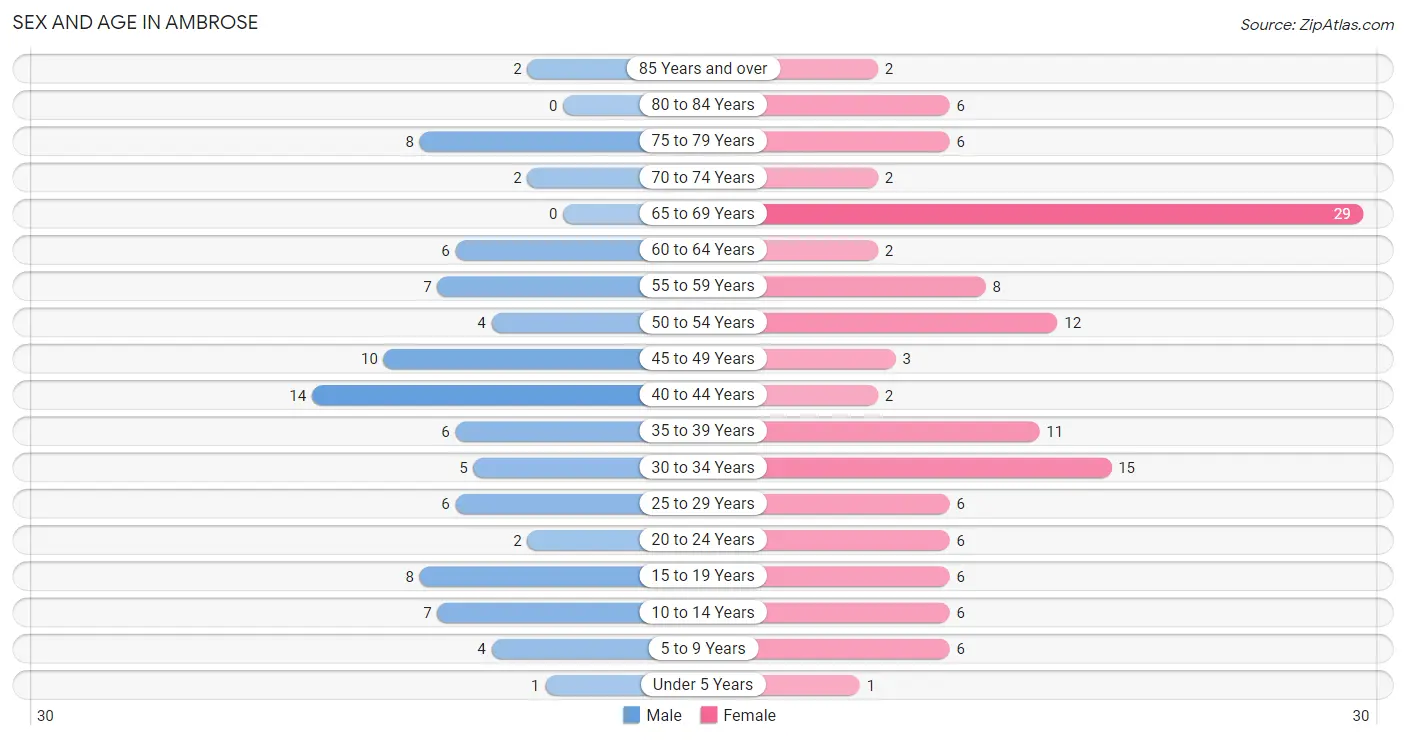
| Age Bracket | Male | Female |
| Under 5 Years | 1 (1.1%) | 1 (0.8%) |
| 5 to 9 Years | 4 (4.3%) | 6 (4.6%) |
| 10 to 14 Years | 7 (7.6%) | 6 (4.6%) |
| 15 to 19 Years | 8 (8.7%) | 6 (4.6%) |
| 20 to 24 Years | 2 (2.2%) | 6 (4.6%) |
| 25 to 29 Years | 6 (6.5%) | 6 (4.6%) |
| 30 to 34 Years | 5 (5.4%) | 15 (11.6%) |
| 35 to 39 Years | 6 (6.5%) | 11 (8.5%) |
| 40 to 44 Years | 14 (15.2%) | 2 (1.5%) |
| 45 to 49 Years | 10 (10.9%) | 3 (2.3%) |
| 50 to 54 Years | 4 (4.3%) | 12 (9.3%) |
| 55 to 59 Years | 7 (7.6%) | 8 (6.2%) |
| 60 to 64 Years | 6 (6.5%) | 2 (1.5%) |
| 65 to 69 Years | 0 (0.0%) | 29 (22.5%) |
| 70 to 74 Years | 2 (2.2%) | 2 (1.5%) |
| 75 to 79 Years | 8 (8.7%) | 6 (4.6%) |
| 80 to 84 Years | 0 (0.0%) | 6 (4.6%) |
| 85 Years and over | 2 (2.2%) | 2 (1.5%) |
| Total | 92 (100.0%) | 129 (100.0%) |
Families and Households in Ambrose
Median Family Size in Ambrose
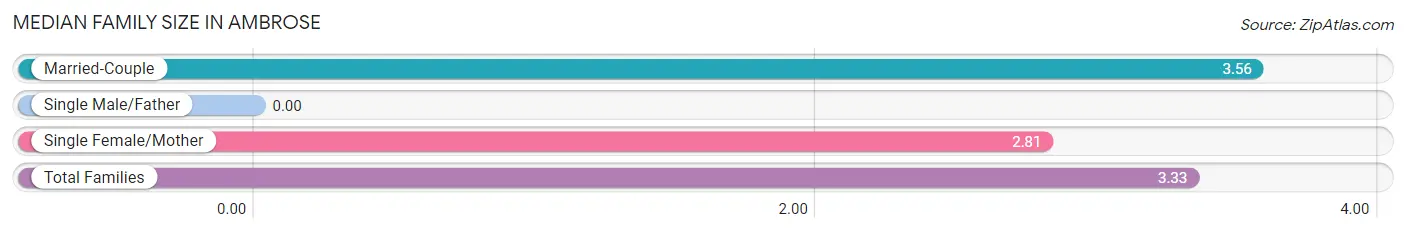
| Family Type | # Families | Family Size |
| Married-Couple | 36 (69.2%) | 3.56 |
| Single Male/Father | 0 (0.0%) | - |
| Single Female/Mother | 16 (30.8%) | 2.81 |
| Total Families | 52 (100.0%) | 3.33 |
Median Household Size in Ambrose
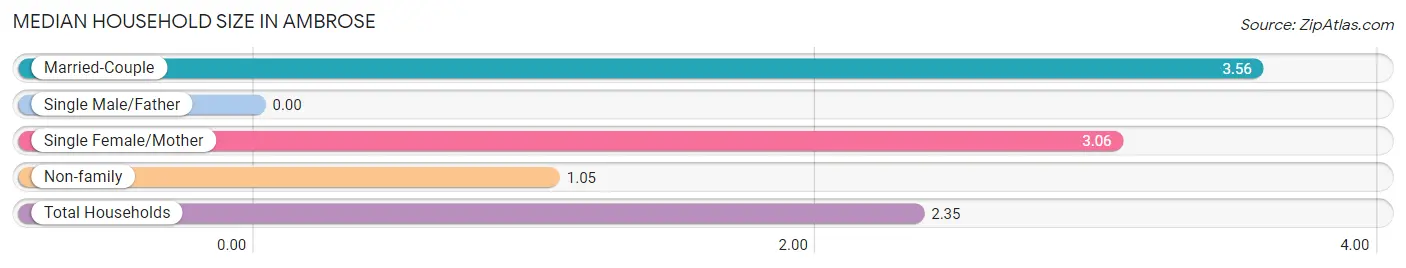
| Household Type | # Households | Household Size |
| Married-Couple | 36 (38.3%) | 3.56 |
| Single Male/Father | 0 (0.0%) | - |
| Single Female/Mother | 16 (17.0%) | 3.06 |
| Non-family | 42 (44.7%) | 1.05 |
| Total Households | 94 (100.0%) | 2.35 |
Household Size by Marriage Status in Ambrose
Out of a total of 94 households in Ambrose, 52 (55.3%) are family households, while 42 (44.7%) are nonfamily households. The most numerous type of family households are 4-person households, comprising 22, and the most common type of nonfamily households are 1-person households, comprising 41.
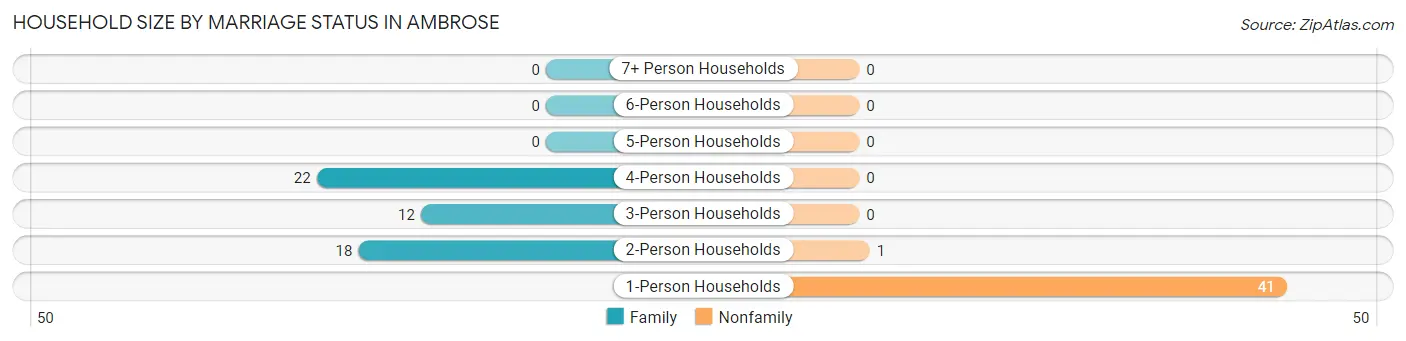
| Household Size | Family Households | Nonfamily Households |
| 1-Person Households | - | 41 (43.6%) |
| 2-Person Households | 18 (19.2%) | 1 (1.1%) |
| 3-Person Households | 12 (12.8%) | 0 (0.0%) |
| 4-Person Households | 22 (23.4%) | 0 (0.0%) |
| 5-Person Households | 0 (0.0%) | 0 (0.0%) |
| 6-Person Households | 0 (0.0%) | 0 (0.0%) |
| 7+ Person Households | 0 (0.0%) | 0 (0.0%) |
| Total | 52 (55.3%) | 42 (44.7%) |
Female Fertility in Ambrose
Fertility by Age in Ambrose
Average fertility rate in Ambrose is 33.0 births per 1,000 women. Women in the age bracket of 20 to 34 years have the highest fertility rate with 74.0 births per 1,000 women. Women in the age bracket of 20 to 34 years acount for 100.0% of all women with births.
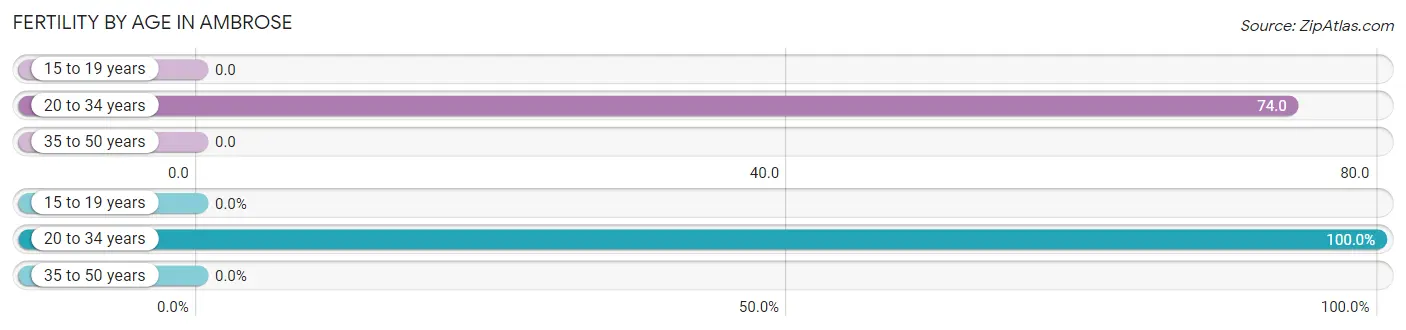
| Age Bracket | Women with Births | Births / 1,000 Women |
| 15 to 19 years | 0 (0.0%) | 0.0 |
| 20 to 34 years | 2 (100.0%) | 74.0 |
| 35 to 50 years | 0 (0.0%) | 0.0 |
| Total | 2 (100.0%) | 33.0 |
Fertility by Age by Marriage Status in Ambrose
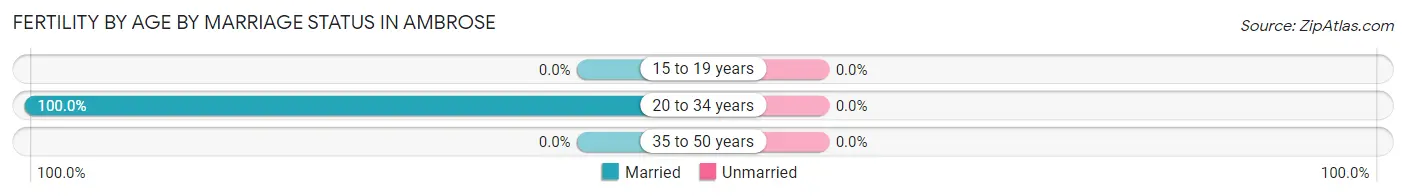
| Age Bracket | Married | Unmarried |
| 15 to 19 years | 0 (0.0%) | 0 (0.0%) |
| 20 to 34 years | 2 (100.0%) | 0 (0.0%) |
| 35 to 50 years | 0 (0.0%) | 0 (0.0%) |
| Total | 2 (100.0%) | 0 (0.0%) |
Fertility by Education in Ambrose
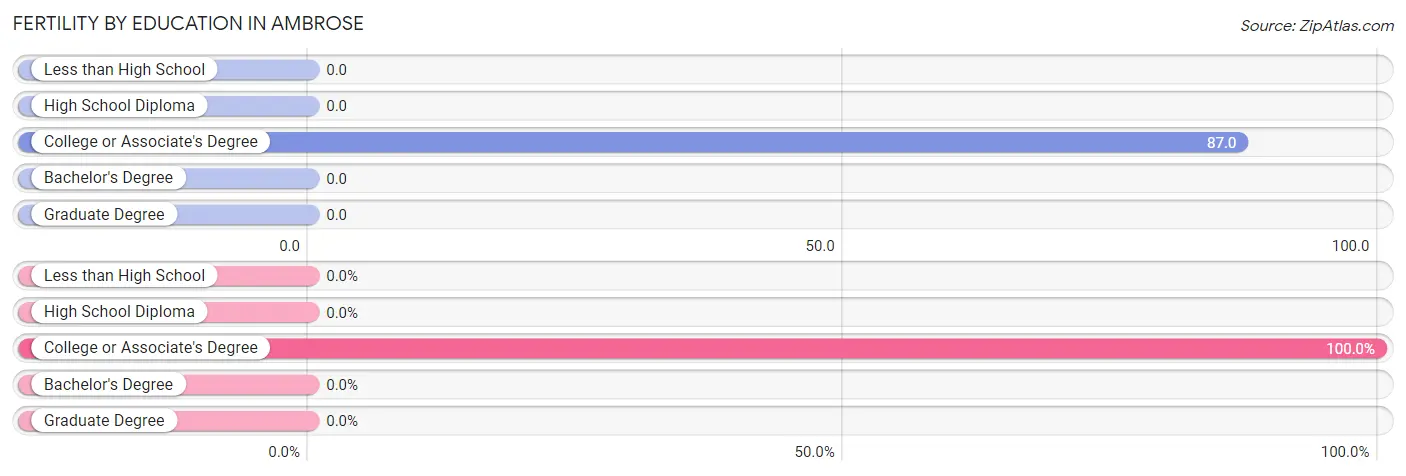
| Educational Attainment | Women with Births | Births / 1,000 Women |
| Less than High School | 0 (0.0%) | 0.0 |
| High School Diploma | 0 (0.0%) | 0.0 |
| College or Associate's Degree | 2 (100.0%) | 87.0 |
| Bachelor's Degree | 0 (0.0%) | 0.0 |
| Graduate Degree | 0 (0.0%) | 0.0 |
| Total | 2 (100.0%) | 33.0 |
Fertility by Education by Marriage Status in Ambrose
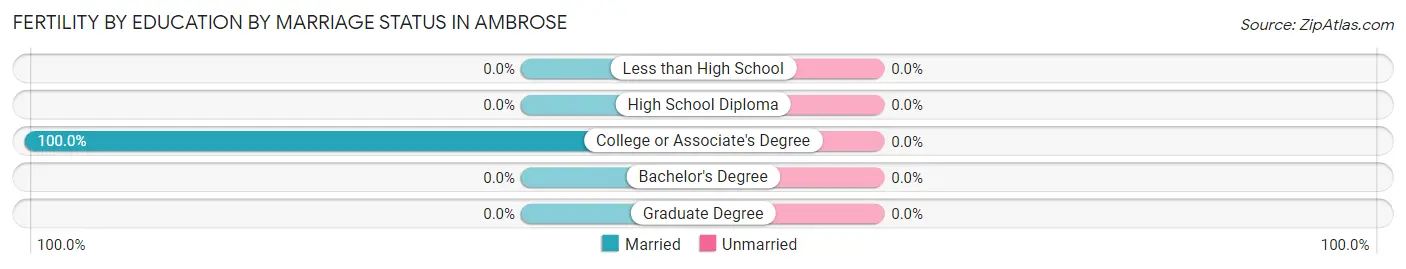
| Educational Attainment | Married | Unmarried |
| Less than High School | 0 (0.0%) | 0 (0.0%) |
| High School Diploma | 0 (0.0%) | 0 (0.0%) |
| College or Associate's Degree | 2 (100.0%) | 0 (0.0%) |
| Bachelor's Degree | 0 (0.0%) | 0 (0.0%) |
| Graduate Degree | 0 (0.0%) | 0 (0.0%) |
| Total | 2 (100.0%) | 0 (0.0%) |
Employment Characteristics in Ambrose
Employment by Class of Employer in Ambrose
Among the 89 employed individuals in Ambrose, private company employees (55 | 61.8%), federal government employees (19 | 21.3%), and not-for-profit organizations (5 | 5.6%) make up the most common classes of employment.
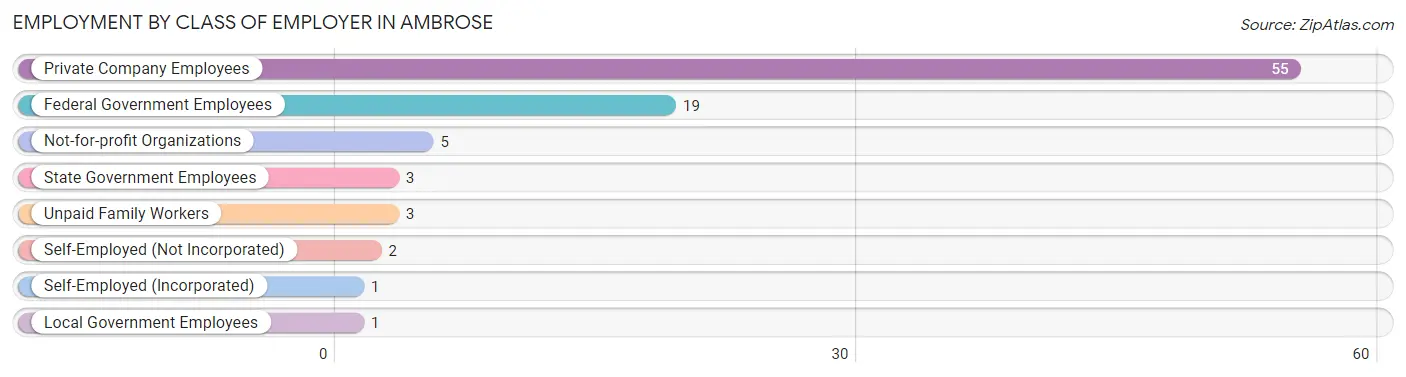
| Employer Class | # Employees | % Employees |
| Private Company Employees | 55 | 61.8% |
| Self-Employed (Incorporated) | 1 | 1.1% |
| Self-Employed (Not Incorporated) | 2 | 2.2% |
| Not-for-profit Organizations | 5 | 5.6% |
| Local Government Employees | 1 | 1.1% |
| State Government Employees | 3 | 3.4% |
| Federal Government Employees | 19 | 21.3% |
| Unpaid Family Workers | 3 | 3.4% |
| Total | 89 | 100.0% |
Employment Status by Age in Ambrose
According to the labor force statistics for Ambrose, out of the total population over 16 years of age (194), 54.6% or 106 individuals are in the labor force, with 11.3% or 12 of them unemployed. The age group with the highest labor force participation rate is 30 to 34 years, with 100.0% or 20 individuals in the labor force. Within the labor force, the 30 to 34 years age range has the highest percentage of unemployed individuals, with 40.0% or 8 of them being unemployed.
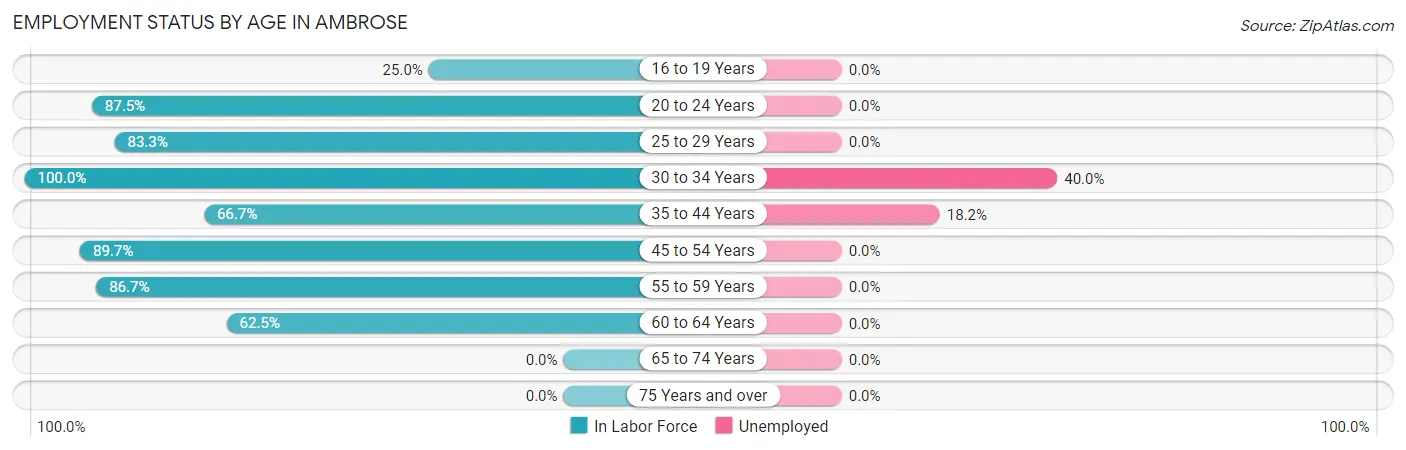
| Age Bracket | In Labor Force | Unemployed |
| 16 to 19 Years | 3 (25.0%) | 0 (0.0%) |
| 20 to 24 Years | 7 (87.5%) | 0 (0.0%) |
| 25 to 29 Years | 10 (83.3%) | 0 (0.0%) |
| 30 to 34 Years | 20 (100.0%) | 8 (40.0%) |
| 35 to 44 Years | 22 (66.7%) | 4 (18.2%) |
| 45 to 54 Years | 26 (89.7%) | 0 (0.0%) |
| 55 to 59 Years | 13 (86.7%) | 0 (0.0%) |
| 60 to 64 Years | 5 (62.5%) | 0 (0.0%) |
| 65 to 74 Years | 0 (0.0%) | 0 (0.0%) |
| 75 Years and over | 0 (0.0%) | 0 (0.0%) |
| Total | 106 (54.6%) | 12 (11.3%) |
Employment Status by Educational Attainment in Ambrose
According to labor force statistics for Ambrose, 82.1% of individuals (96) out of the total population between 25 and 64 years of age (117) are in the labor force, with 12.5% or 12 of them being unemployed. The group with the highest labor force participation rate are those with the educational attainment of bachelor's degree or higher, with 100.0% or 3 individuals in the labor force. Within the labor force, individuals with less than high school education have the highest percentage of unemployment, with 26.7% or 8 of them being unemployed.
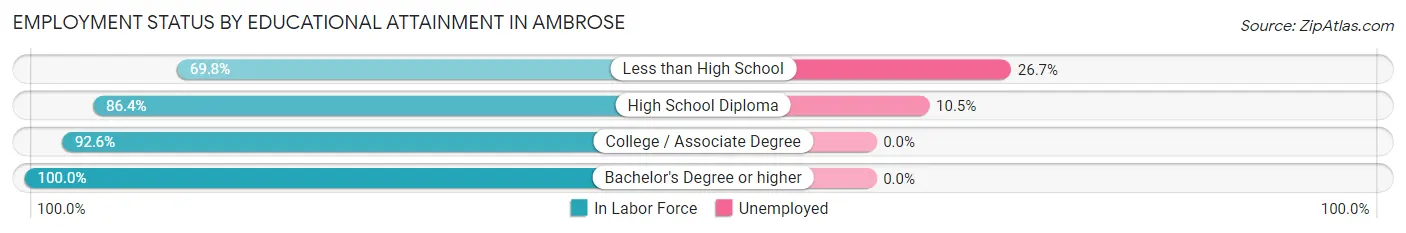
| Educational Attainment | In Labor Force | Unemployed |
| Less than High School | 30 (69.8%) | 11 (26.7%) |
| High School Diploma | 38 (86.4%) | 5 (10.5%) |
| College / Associate Degree | 25 (92.6%) | 0 (0.0%) |
| Bachelor's Degree or higher | 3 (100.0%) | 0 (0.0%) |
| Total | 96 (82.1%) | 15 (12.5%) |
Employment Occupations by Sex in Ambrose
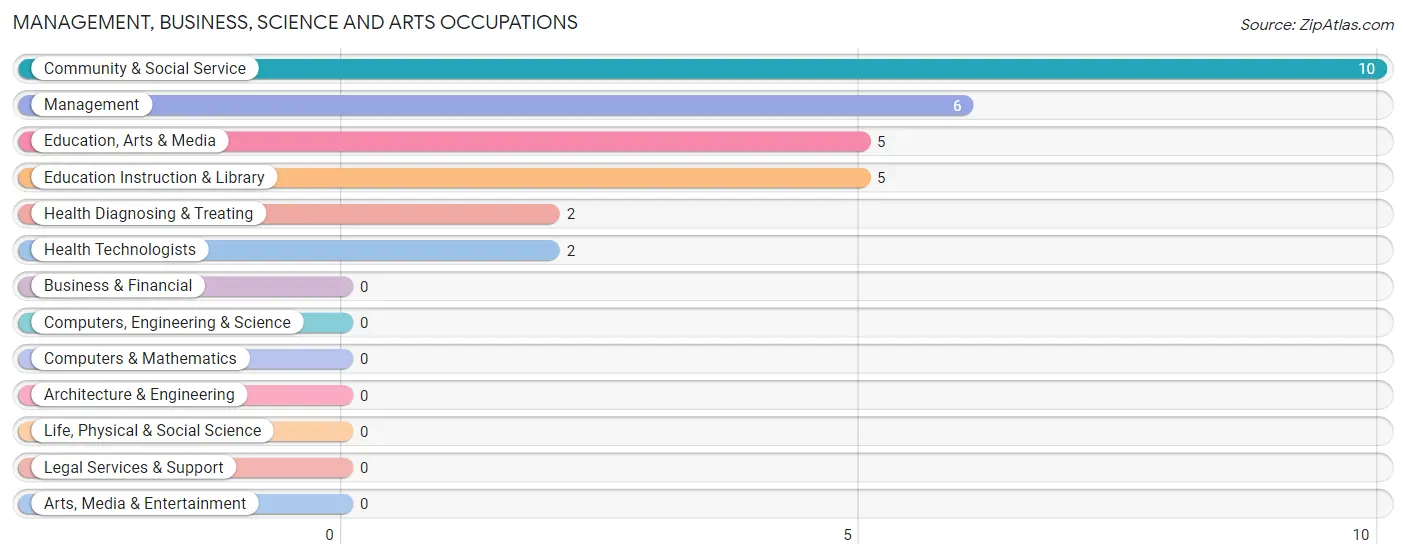
Management, Business, Science and Arts Occupations
The most common Management, Business, Science and Arts occupations in Ambrose are Community & Social Service (10 | 10.6%), Management (6 | 6.4%), Education, Arts & Media (5 | 5.3%), Education Instruction & Library (5 | 5.3%), and Health Diagnosing & Treating (2 | 2.1%).
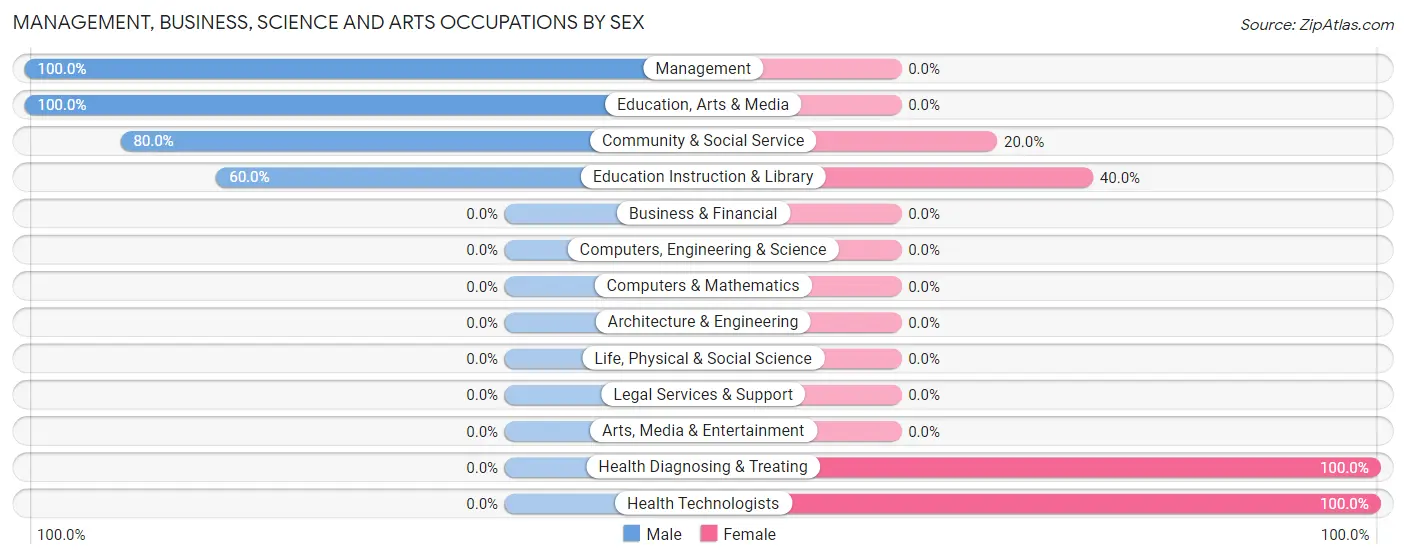
Management, Business, Science and Arts Occupations by Sex
Within the Management, Business, Science and Arts occupations in Ambrose, the most male-oriented occupations are Management (100.0%), Education, Arts & Media (100.0%), and Community & Social Service (80.0%), while the most female-oriented occupations are Health Diagnosing & Treating (100.0%), Health Technologists (100.0%), and Education Instruction & Library (40.0%).
| Occupation | Male | Female |
| Management | 6 (100.0%) | 0 (0.0%) |
| Business & Financial | 0 (0.0%) | 0 (0.0%) |
| Computers, Engineering & Science | 0 (0.0%) | 0 (0.0%) |
| Computers & Mathematics | 0 (0.0%) | 0 (0.0%) |
| Architecture & Engineering | 0 (0.0%) | 0 (0.0%) |
| Life, Physical & Social Science | 0 (0.0%) | 0 (0.0%) |
| Community & Social Service | 8 (80.0%) | 2 (20.0%) |
| Education, Arts & Media | 5 (100.0%) | 0 (0.0%) |
| Legal Services & Support | 0 (0.0%) | 0 (0.0%) |
| Education Instruction & Library | 3 (60.0%) | 2 (40.0%) |
| Arts, Media & Entertainment | 0 (0.0%) | 0 (0.0%) |
| Health Diagnosing & Treating | 0 (0.0%) | 2 (100.0%) |
| Health Technologists | 0 (0.0%) | 2 (100.0%) |
| Total (Category) | 14 (77.8%) | 4 (22.2%) |
| Total (Overall) | 43 (45.7%) | 51 (54.3%) |
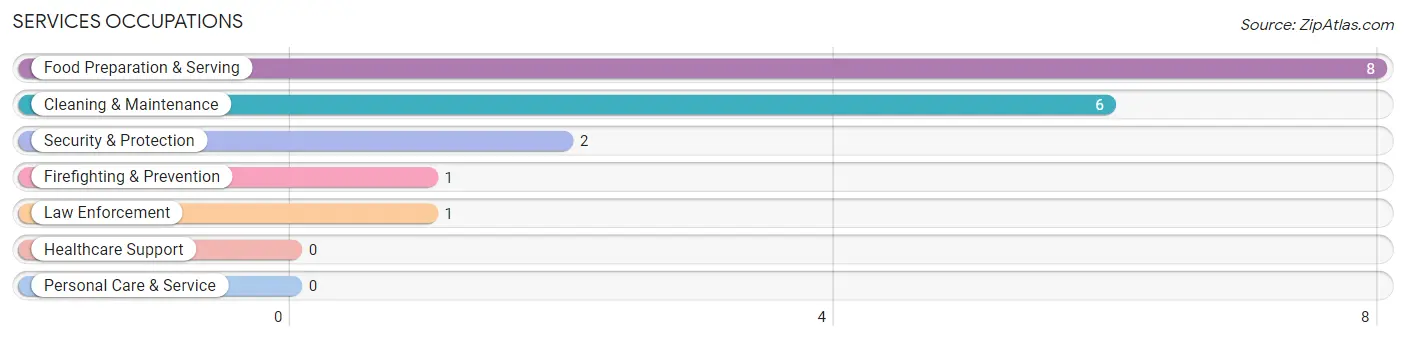
Services Occupations
The most common Services occupations in Ambrose are Food Preparation & Serving (8 | 8.5%), Cleaning & Maintenance (6 | 6.4%), Security & Protection (2 | 2.1%), Firefighting & Prevention (1 | 1.1%), and Law Enforcement (1 | 1.1%).
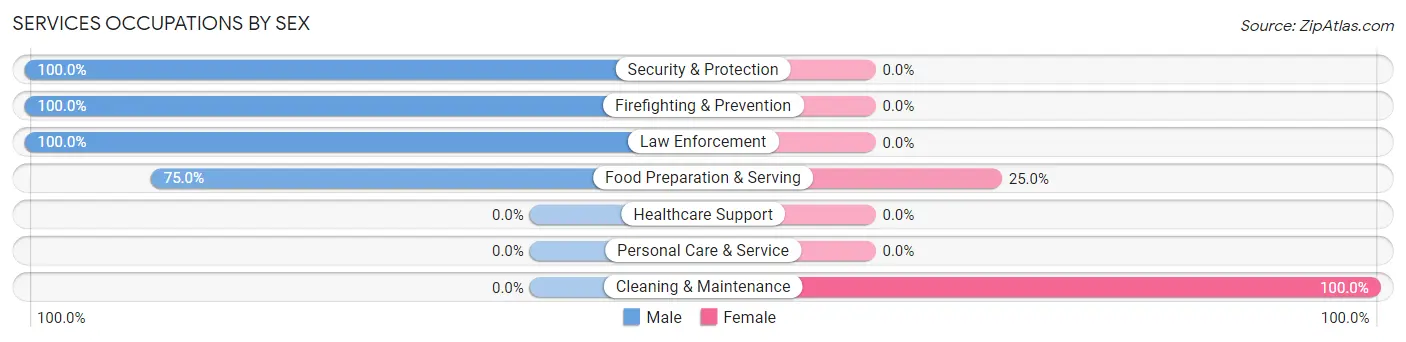
Services Occupations by Sex
Within the Services occupations in Ambrose, the most male-oriented occupations are Security & Protection (100.0%), Firefighting & Prevention (100.0%), and Law Enforcement (100.0%), while the most female-oriented occupations are Cleaning & Maintenance (100.0%), and Food Preparation & Serving (25.0%).
| Occupation | Male | Female |
| Healthcare Support | 0 (0.0%) | 0 (0.0%) |
| Security & Protection | 2 (100.0%) | 0 (0.0%) |
| Firefighting & Prevention | 1 (100.0%) | 0 (0.0%) |
| Law Enforcement | 1 (100.0%) | 0 (0.0%) |
| Food Preparation & Serving | 6 (75.0%) | 2 (25.0%) |
| Cleaning & Maintenance | 0 (0.0%) | 6 (100.0%) |
| Personal Care & Service | 0 (0.0%) | 0 (0.0%) |
| Total (Category) | 8 (50.0%) | 8 (50.0%) |
| Total (Overall) | 43 (45.7%) | 51 (54.3%) |
Sales and Office Occupations
The most common Sales and Office occupations in Ambrose are Office & Administration (12 | 12.8%), and Sales & Related (11 | 11.7%).
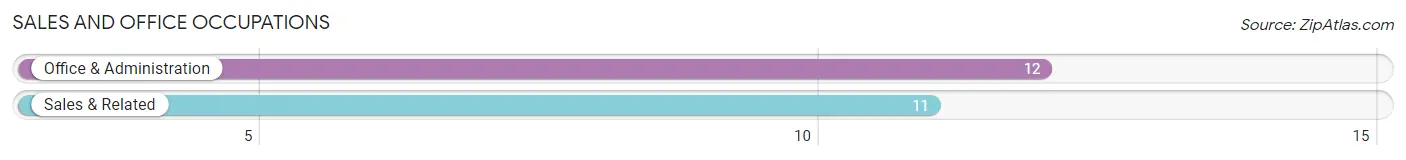
Sales and Office Occupations by Sex
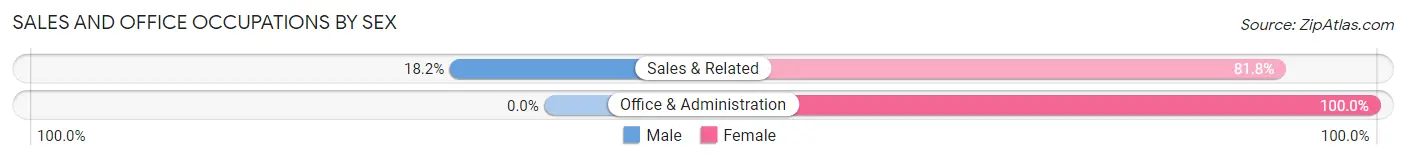
| Occupation | Male | Female |
| Sales & Related | 2 (18.2%) | 9 (81.8%) |
| Office & Administration | 0 (0.0%) | 12 (100.0%) |
| Total (Category) | 2 (8.7%) | 21 (91.3%) |
| Total (Overall) | 43 (45.7%) | 51 (54.3%) |
Natural Resources, Construction and Maintenance Occupations
The most common Natural Resources, Construction and Maintenance occupations in Ambrose are Farming, Fishing & Forestry (9 | 9.6%), and Construction & Extraction (5 | 5.3%).
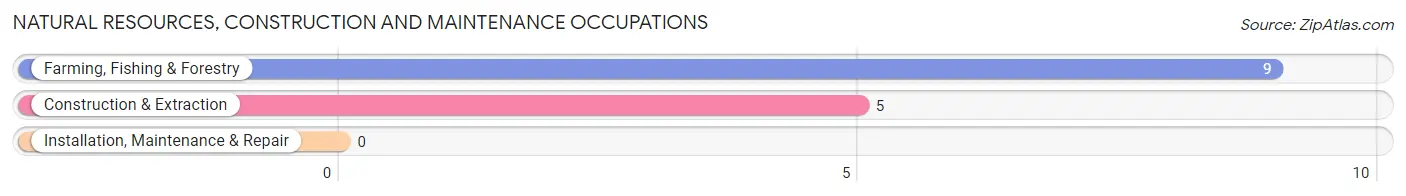
Natural Resources, Construction and Maintenance Occupations by Sex
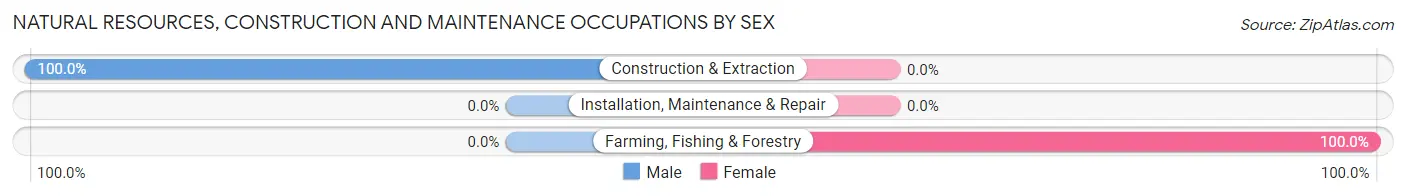
| Occupation | Male | Female |
| Farming, Fishing & Forestry | 0 (0.0%) | 9 (100.0%) |
| Construction & Extraction | 5 (100.0%) | 0 (0.0%) |
| Installation, Maintenance & Repair | 0 (0.0%) | 0 (0.0%) |
| Total (Category) | 5 (35.7%) | 9 (64.3%) |
| Total (Overall) | 43 (45.7%) | 51 (54.3%) |
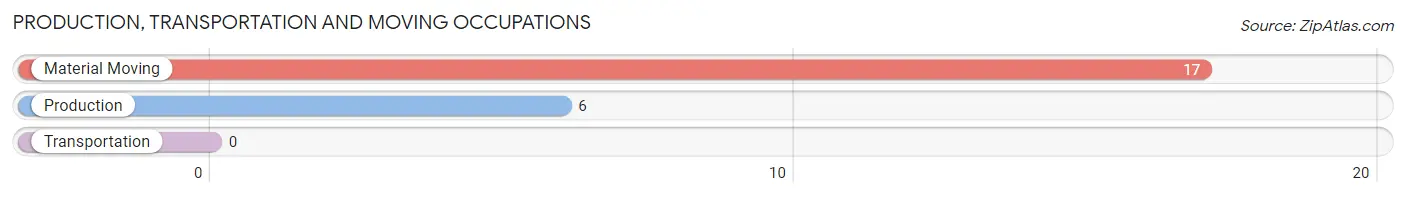
Production, Transportation and Moving Occupations
The most common Production, Transportation and Moving occupations in Ambrose are Material Moving (17 | 18.1%), and Production (6 | 6.4%).
Production, Transportation and Moving Occupations by Sex
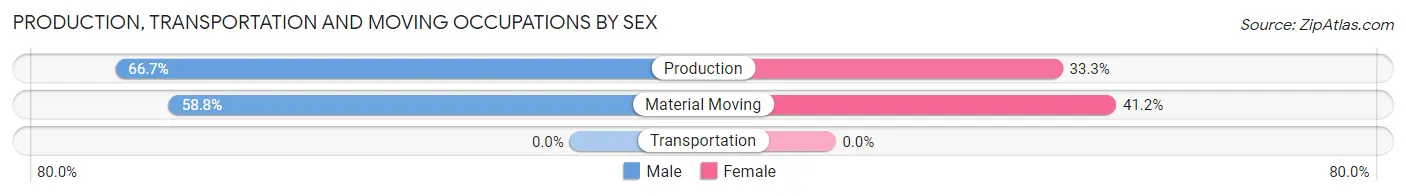
| Occupation | Male | Female |
| Production | 4 (66.7%) | 2 (33.3%) |
| Transportation | 0 (0.0%) | 0 (0.0%) |
| Material Moving | 10 (58.8%) | 7 (41.2%) |
| Total (Category) | 14 (60.9%) | 9 (39.1%) |
| Total (Overall) | 43 (45.7%) | 51 (54.3%) |
Employment Industries by Sex in Ambrose
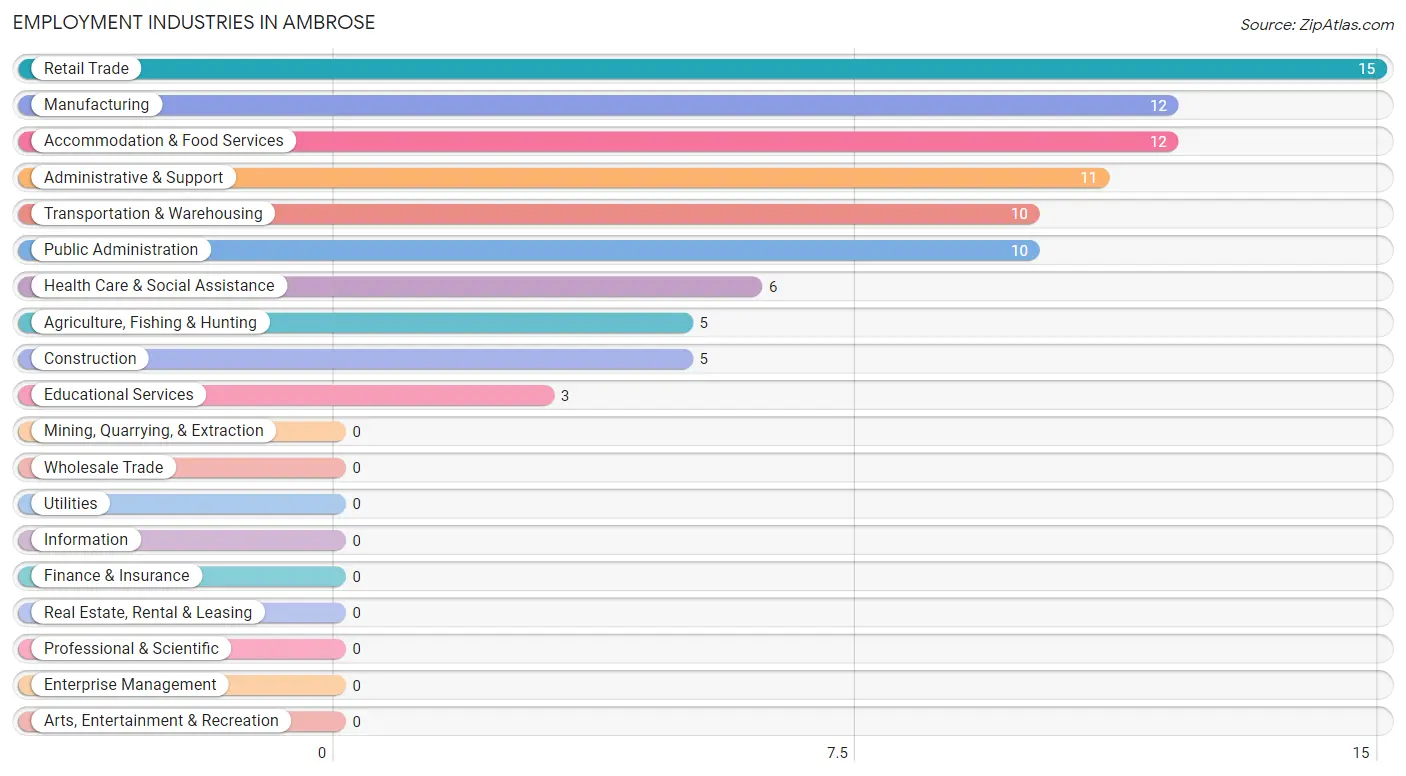
Employment Industries in Ambrose
The major employment industries in Ambrose include Retail Trade (15 | 16.0%), Manufacturing (12 | 12.8%), Accommodation & Food Services (12 | 12.8%), Administrative & Support (11 | 11.7%), and Transportation & Warehousing (10 | 10.6%).
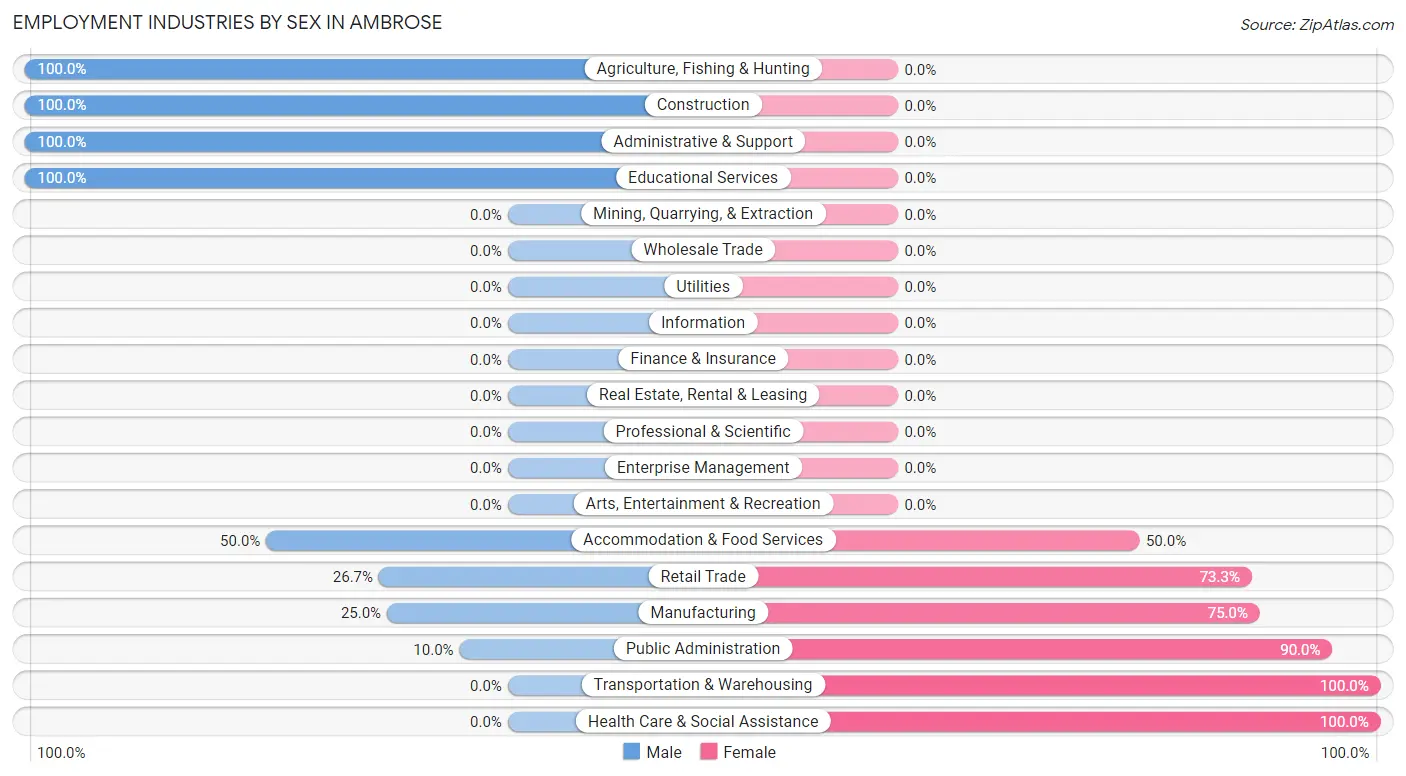
Employment Industries by Sex in Ambrose
The Ambrose industries that see more men than women are Agriculture, Fishing & Hunting (100.0%), Construction (100.0%), and Administrative & Support (100.0%), whereas the industries that tend to have a higher number of women are Transportation & Warehousing (100.0%), Health Care & Social Assistance (100.0%), and Public Administration (90.0%).
| Industry | Male | Female |
| Agriculture, Fishing & Hunting | 5 (100.0%) | 0 (0.0%) |
| Mining, Quarrying, & Extraction | 0 (0.0%) | 0 (0.0%) |
| Construction | 5 (100.0%) | 0 (0.0%) |
| Manufacturing | 3 (25.0%) | 9 (75.0%) |
| Wholesale Trade | 0 (0.0%) | 0 (0.0%) |
| Retail Trade | 4 (26.7%) | 11 (73.3%) |
| Transportation & Warehousing | 0 (0.0%) | 10 (100.0%) |
| Utilities | 0 (0.0%) | 0 (0.0%) |
| Information | 0 (0.0%) | 0 (0.0%) |
| Finance & Insurance | 0 (0.0%) | 0 (0.0%) |
| Real Estate, Rental & Leasing | 0 (0.0%) | 0 (0.0%) |
| Professional & Scientific | 0 (0.0%) | 0 (0.0%) |
| Enterprise Management | 0 (0.0%) | 0 (0.0%) |
| Administrative & Support | 11 (100.0%) | 0 (0.0%) |
| Educational Services | 3 (100.0%) | 0 (0.0%) |
| Health Care & Social Assistance | 0 (0.0%) | 6 (100.0%) |
| Arts, Entertainment & Recreation | 0 (0.0%) | 0 (0.0%) |
| Accommodation & Food Services | 6 (50.0%) | 6 (50.0%) |
| Public Administration | 1 (10.0%) | 9 (90.0%) |
| Total | 43 (45.7%) | 51 (54.3%) |
Education in Ambrose
School Enrollment in Ambrose
The most common levels of schooling among the 37 students in Ambrose are elementary school (15 | 40.5%), high school (11 | 29.7%), and middle school (6 | 16.2%).
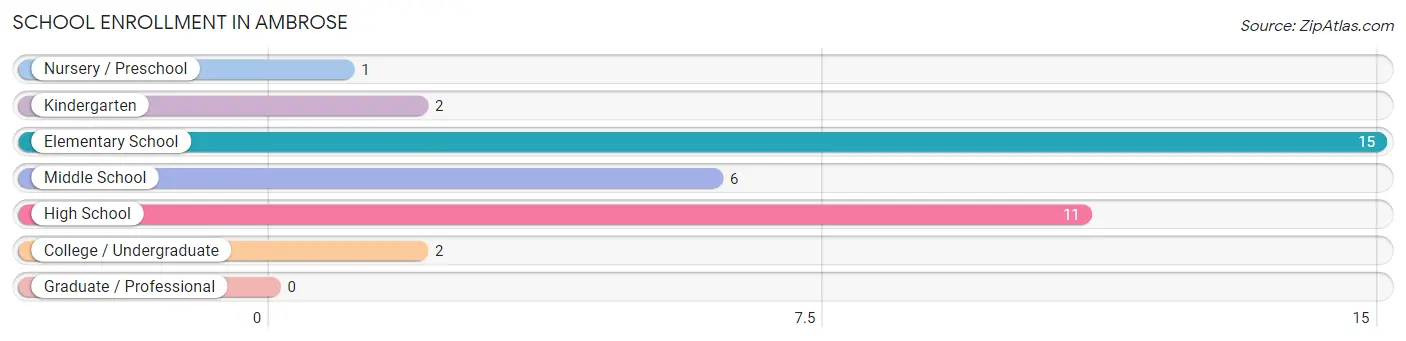
| School Level | # Students | % Students |
| Nursery / Preschool | 1 | 2.7% |
| Kindergarten | 2 | 5.4% |
| Elementary School | 15 | 40.5% |
| Middle School | 6 | 16.2% |
| High School | 11 | 29.7% |
| College / Undergraduate | 2 | 5.4% |
| Graduate / Professional | 0 | 0.0% |
| Total | 37 | 100.0% |
School Enrollment by Age by Funding Source in Ambrose
Out of a total of 37 students who are enrolled in schools in Ambrose, 3 (8.1%) attend a private institution, while the remaining 34 (91.9%) are enrolled in public schools. The age group of 15 to 17 year olds has the highest likelihood of being enrolled in private schools, with 3 (27.3% in the age bracket) enrolled. Conversely, the age group of 3 to 4 year olds has the lowest likelihood of being enrolled in a private school, with 1 (100.0% in the age bracket) attending a public institution.
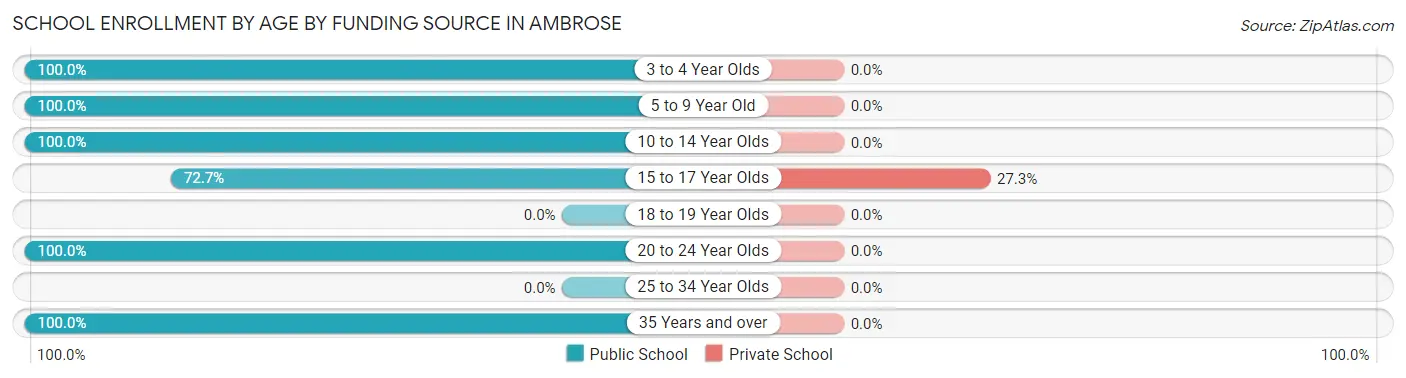
| Age Bracket | Public School | Private School |
| 3 to 4 Year Olds | 1 (100.0%) | 0 (0.0%) |
| 5 to 9 Year Old | 10 (100.0%) | 0 (0.0%) |
| 10 to 14 Year Olds | 13 (100.0%) | 0 (0.0%) |
| 15 to 17 Year Olds | 8 (72.7%) | 3 (27.3%) |
| 18 to 19 Year Olds | 0 (0.0%) | 0 (0.0%) |
| 20 to 24 Year Olds | 1 (100.0%) | 0 (0.0%) |
| 25 to 34 Year Olds | 0 (0.0%) | 0 (0.0%) |
| 35 Years and over | 1 (100.0%) | 0 (0.0%) |
| Total | 34 (91.9%) | 3 (8.1%) |
Educational Attainment by Field of Study in Ambrose
, and business (3 | 100.0%) are the most common fields of study among 3 individuals in Ambrose who have obtained a bachelor's degree or higher.
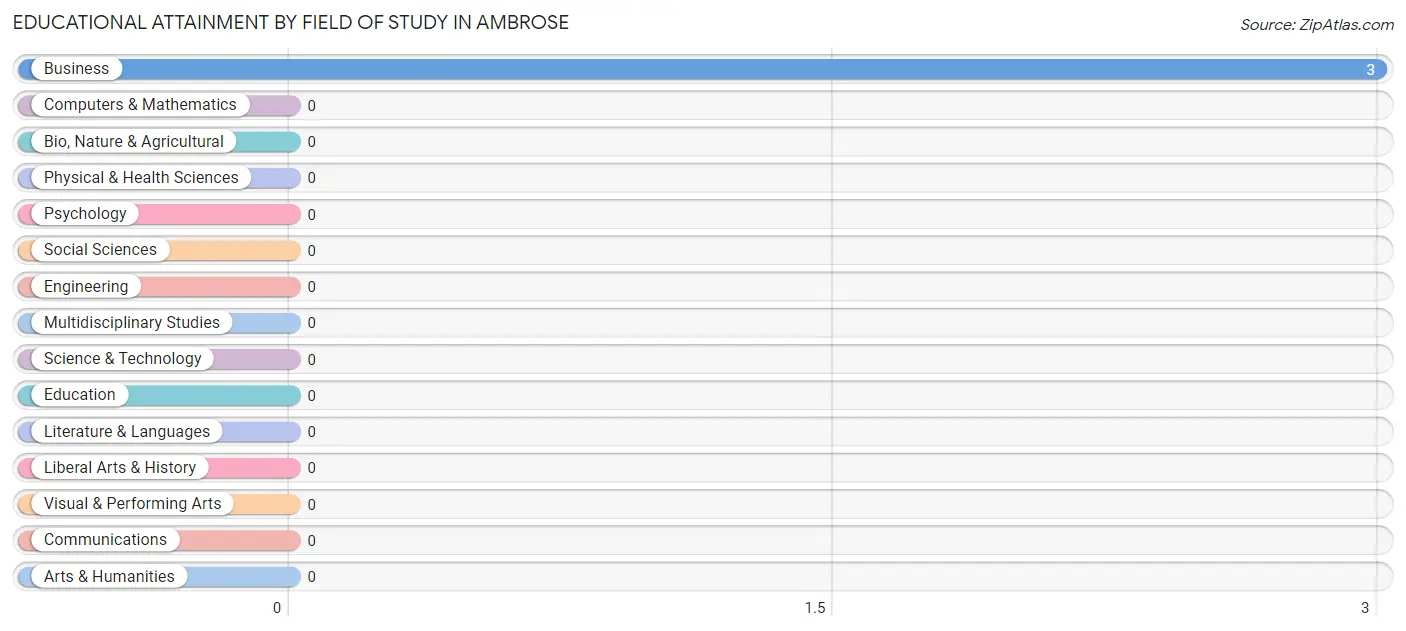
| Field of Study | # Graduates | % Graduates |
| Computers & Mathematics | 0 | 0.0% |
| Bio, Nature & Agricultural | 0 | 0.0% |
| Physical & Health Sciences | 0 | 0.0% |
| Psychology | 0 | 0.0% |
| Social Sciences | 0 | 0.0% |
| Engineering | 0 | 0.0% |
| Multidisciplinary Studies | 0 | 0.0% |
| Science & Technology | 0 | 0.0% |
| Business | 3 | 100.0% |
| Education | 0 | 0.0% |
| Literature & Languages | 0 | 0.0% |
| Liberal Arts & History | 0 | 0.0% |
| Visual & Performing Arts | 0 | 0.0% |
| Communications | 0 | 0.0% |
| Arts & Humanities | 0 | 0.0% |
| Total | 3 | 100.0% |
Transportation & Commute in Ambrose
Vehicle Availability by Sex in Ambrose
The most prevalent vehicle ownership categories in Ambrose are males with 3 vehicles (15, accounting for 39.5%) and females with 3 vehicles (14, making up 29.4%).
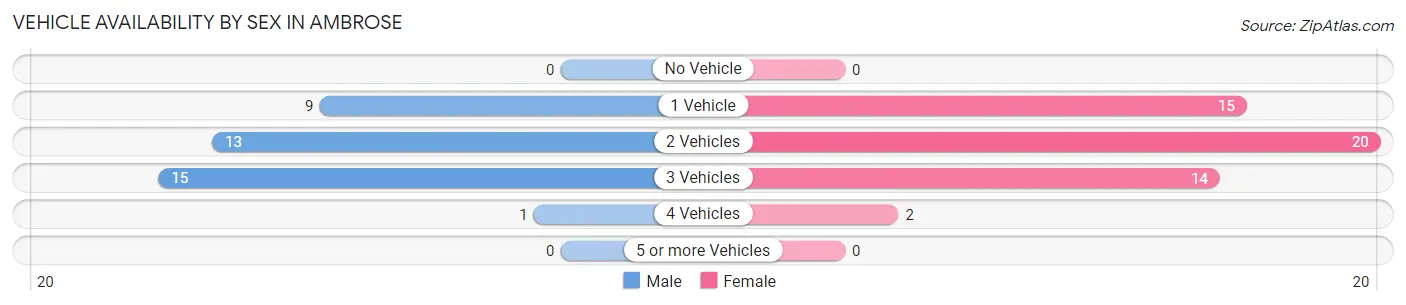
| Vehicles Available | Male | Female |
| No Vehicle | 0 (0.0%) | 0 (0.0%) |
| 1 Vehicle | 9 (23.7%) | 15 (29.4%) |
| 2 Vehicles | 13 (34.2%) | 20 (39.2%) |
| 3 Vehicles | 15 (39.5%) | 14 (27.5%) |
| 4 Vehicles | 1 (2.6%) | 2 (3.9%) |
| 5 or more Vehicles | 0 (0.0%) | 0 (0.0%) |
| Total | 38 (100.0%) | 51 (100.0%) |
Commute Time in Ambrose
The most frequently occuring commute durations in Ambrose are 5 to 9 minutes (24 commuters, 27.0%), 10 to 14 minutes (20 commuters, 22.5%), and 15 to 19 minutes (14 commuters, 15.7%).
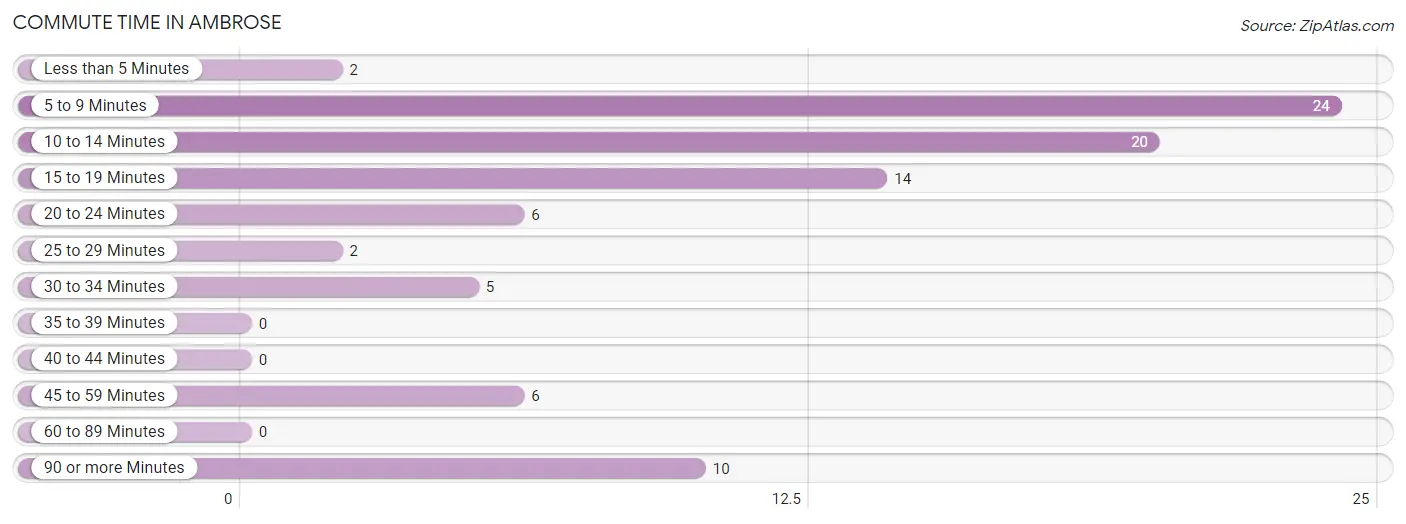
| Commute Time | # Commuters | % Commuters |
| Less than 5 Minutes | 2 | 2.2% |
| 5 to 9 Minutes | 24 | 27.0% |
| 10 to 14 Minutes | 20 | 22.5% |
| 15 to 19 Minutes | 14 | 15.7% |
| 20 to 24 Minutes | 6 | 6.7% |
| 25 to 29 Minutes | 2 | 2.2% |
| 30 to 34 Minutes | 5 | 5.6% |
| 35 to 39 Minutes | 0 | 0.0% |
| 40 to 44 Minutes | 0 | 0.0% |
| 45 to 59 Minutes | 6 | 6.7% |
| 60 to 89 Minutes | 0 | 0.0% |
| 90 or more Minutes | 10 | 11.2% |
Commute Time by Sex in Ambrose
The most common commute times in Ambrose are 5 to 9 minutes (17 commuters, 44.7%) for males and 10 to 14 minutes (19 commuters, 37.2%) for females.
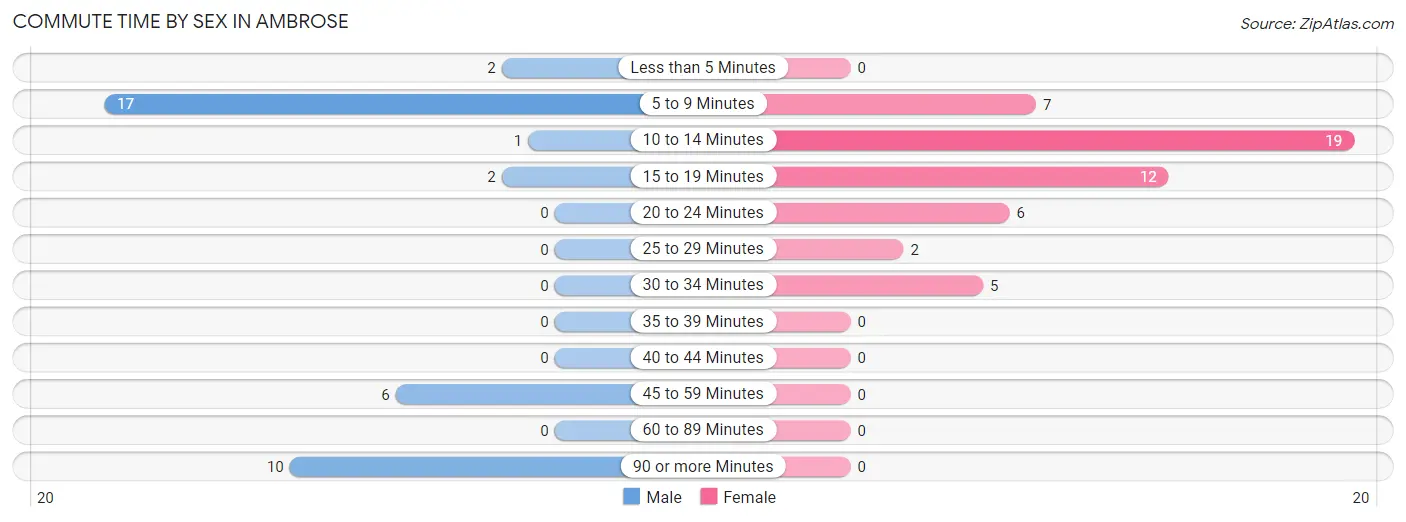
| Commute Time | Male | Female |
| Less than 5 Minutes | 2 (5.3%) | 0 (0.0%) |
| 5 to 9 Minutes | 17 (44.7%) | 7 (13.7%) |
| 10 to 14 Minutes | 1 (2.6%) | 19 (37.2%) |
| 15 to 19 Minutes | 2 (5.3%) | 12 (23.5%) |
| 20 to 24 Minutes | 0 (0.0%) | 6 (11.8%) |
| 25 to 29 Minutes | 0 (0.0%) | 2 (3.9%) |
| 30 to 34 Minutes | 0 (0.0%) | 5 (9.8%) |
| 35 to 39 Minutes | 0 (0.0%) | 0 (0.0%) |
| 40 to 44 Minutes | 0 (0.0%) | 0 (0.0%) |
| 45 to 59 Minutes | 6 (15.8%) | 0 (0.0%) |
| 60 to 89 Minutes | 0 (0.0%) | 0 (0.0%) |
| 90 or more Minutes | 10 (26.3%) | 0 (0.0%) |
Time of Departure to Work by Sex in Ambrose
The most frequent times of departure to work in Ambrose are 5:30 AM to 5:59 AM (12, 31.6%) for males and 7:00 AM to 7:29 AM (17, 33.3%) for females.
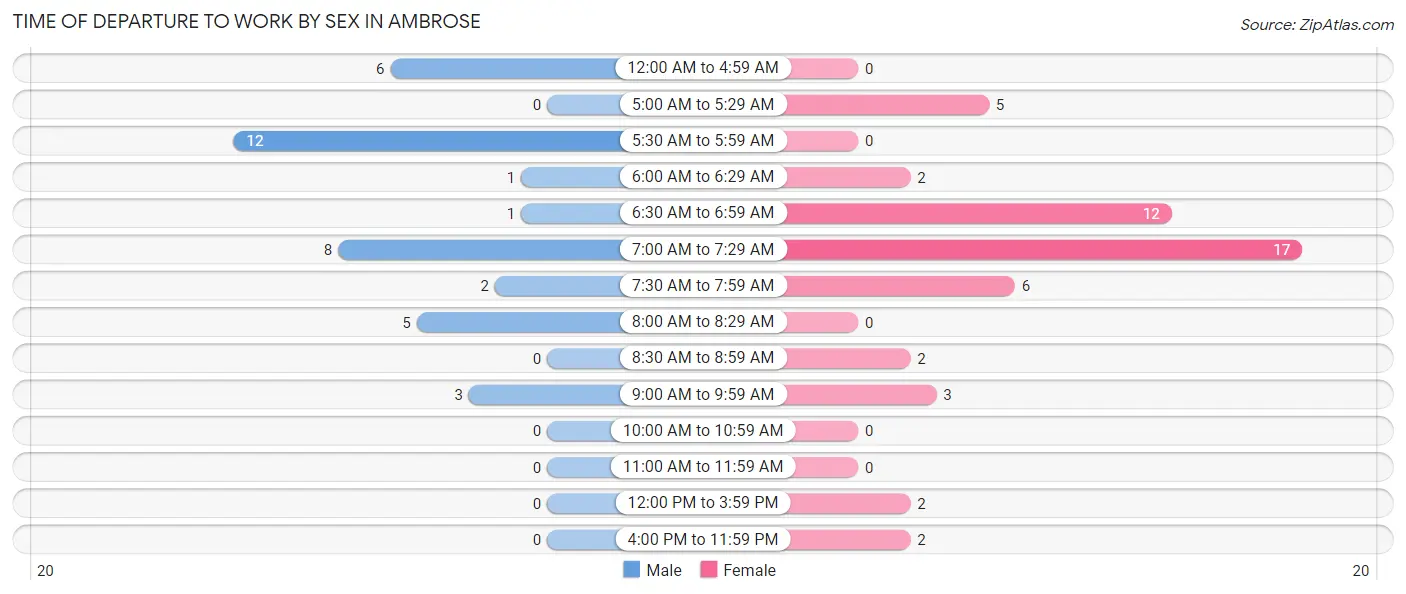
| Time of Departure | Male | Female |
| 12:00 AM to 4:59 AM | 6 (15.8%) | 0 (0.0%) |
| 5:00 AM to 5:29 AM | 0 (0.0%) | 5 (9.8%) |
| 5:30 AM to 5:59 AM | 12 (31.6%) | 0 (0.0%) |
| 6:00 AM to 6:29 AM | 1 (2.6%) | 2 (3.9%) |
| 6:30 AM to 6:59 AM | 1 (2.6%) | 12 (23.5%) |
| 7:00 AM to 7:29 AM | 8 (21.0%) | 17 (33.3%) |
| 7:30 AM to 7:59 AM | 2 (5.3%) | 6 (11.8%) |
| 8:00 AM to 8:29 AM | 5 (13.2%) | 0 (0.0%) |
| 8:30 AM to 8:59 AM | 0 (0.0%) | 2 (3.9%) |
| 9:00 AM to 9:59 AM | 3 (7.9%) | 3 (5.9%) |
| 10:00 AM to 10:59 AM | 0 (0.0%) | 0 (0.0%) |
| 11:00 AM to 11:59 AM | 0 (0.0%) | 0 (0.0%) |
| 12:00 PM to 3:59 PM | 0 (0.0%) | 2 (3.9%) |
| 4:00 PM to 11:59 PM | 0 (0.0%) | 2 (3.9%) |
| Total | 38 (100.0%) | 51 (100.0%) |
Housing Occupancy in Ambrose
Occupancy by Ownership in Ambrose
Of the total 94 dwellings in Ambrose, owner-occupied units account for 43 (45.7%), while renter-occupied units make up 51 (54.3%).
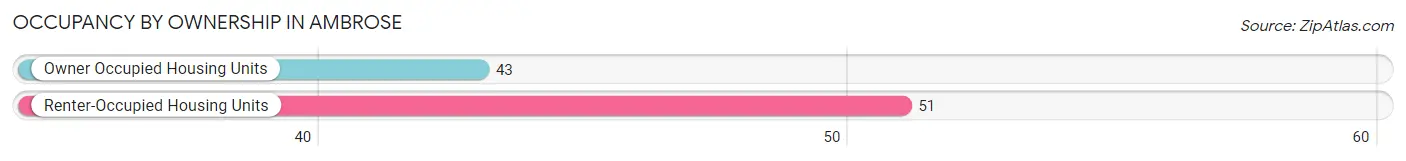
| Occupancy | # Housing Units | % Housing Units |
| Owner Occupied Housing Units | 43 | 45.7% |
| Renter-Occupied Housing Units | 51 | 54.3% |
| Total Occupied Housing Units | 94 | 100.0% |
Occupancy by Household Size in Ambrose
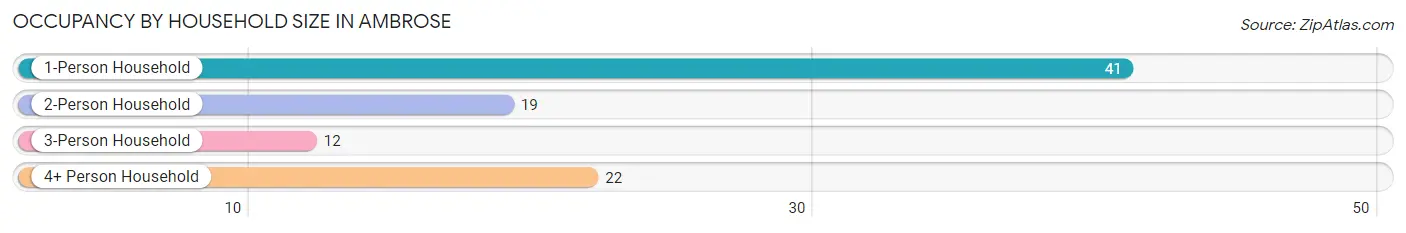
| Household Size | # Housing Units | % Housing Units |
| 1-Person Household | 41 | 43.6% |
| 2-Person Household | 19 | 20.2% |
| 3-Person Household | 12 | 12.8% |
| 4+ Person Household | 22 | 23.4% |
| Total Housing Units | 94 | 100.0% |
Occupancy by Ownership by Household Size in Ambrose
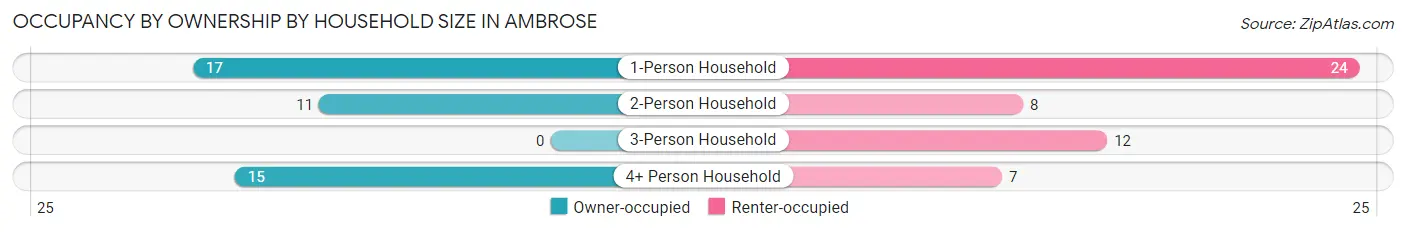
| Household Size | Owner-occupied | Renter-occupied |
| 1-Person Household | 17 (41.5%) | 24 (58.5%) |
| 2-Person Household | 11 (57.9%) | 8 (42.1%) |
| 3-Person Household | 0 (0.0%) | 12 (100.0%) |
| 4+ Person Household | 15 (68.2%) | 7 (31.8%) |
| Total Housing Units | 43 (45.7%) | 51 (54.3%) |
Occupancy by Educational Attainment in Ambrose
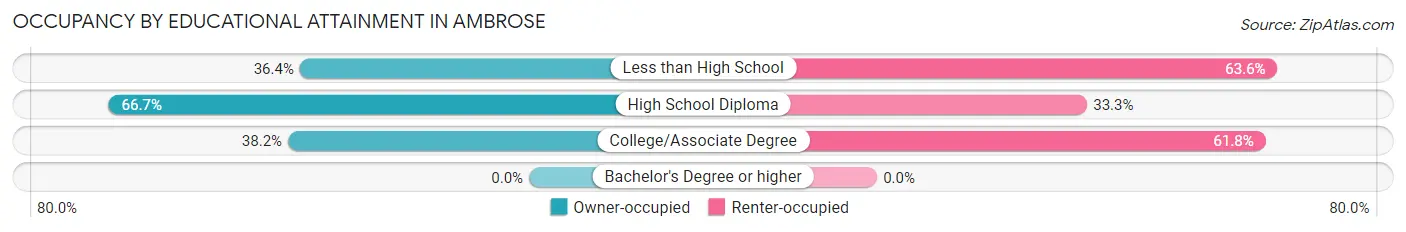
| Household Size | Owner-occupied | Renter-occupied |
| Less than High School | 12 (36.4%) | 21 (63.6%) |
| High School Diploma | 18 (66.7%) | 9 (33.3%) |
| College/Associate Degree | 13 (38.2%) | 21 (61.8%) |
| Bachelor's Degree or higher | 0 (0.0%) | 0 (0.0%) |
Occupancy by Age of Householder in Ambrose
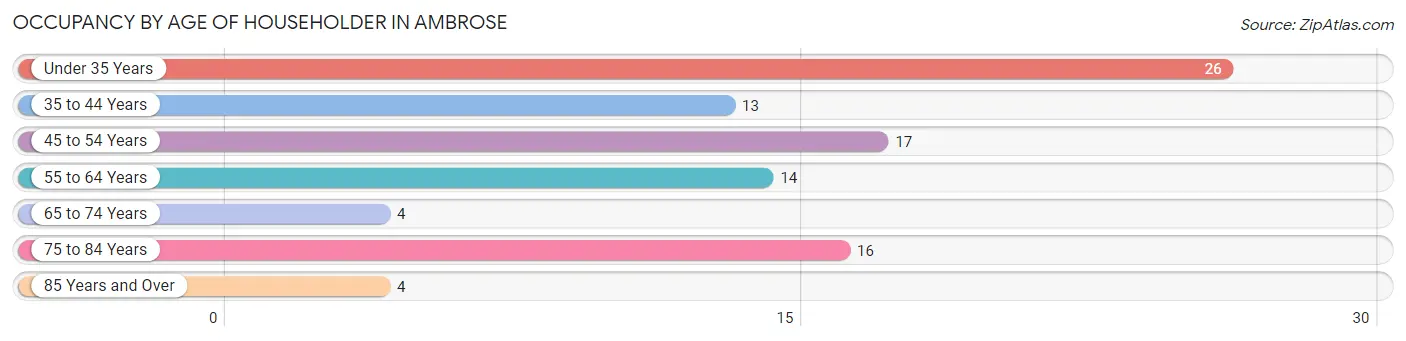
| Age Bracket | # Households | % Households |
| Under 35 Years | 26 | 27.7% |
| 35 to 44 Years | 13 | 13.8% |
| 45 to 54 Years | 17 | 18.1% |
| 55 to 64 Years | 14 | 14.9% |
| 65 to 74 Years | 4 | 4.3% |
| 75 to 84 Years | 16 | 17.0% |
| 85 Years and Over | 4 | 4.3% |
| Total | 94 | 100.0% |
Housing Finances in Ambrose
Median Income by Occupancy in Ambrose
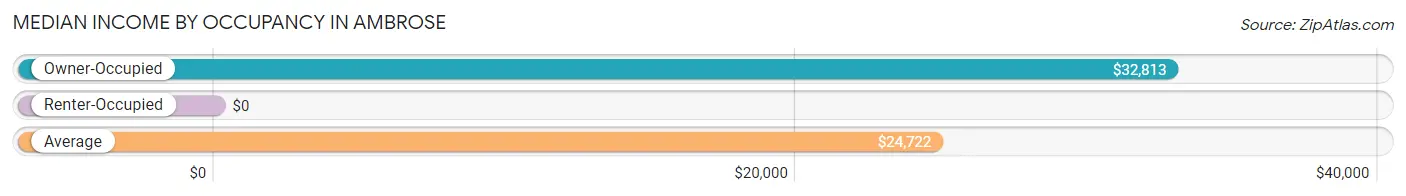
| Occupancy Type | # Households | Median Income |
| Owner-Occupied | 43 (45.7%) | $32,813 |
| Renter-Occupied | 51 (54.3%) | $0 |
| Average | 94 (100.0%) | $24,722 |
Occupancy by Householder Income Bracket in Ambrose
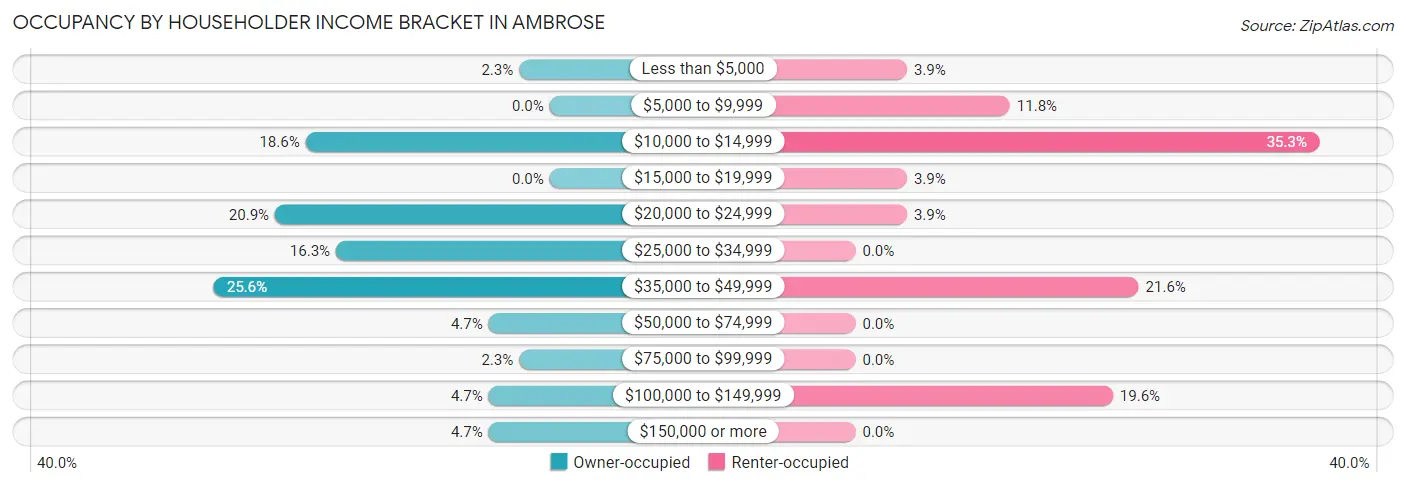
| Income Bracket | Owner-occupied | Renter-occupied |
| Less than $5,000 | 1 (2.3%) | 2 (3.9%) |
| $5,000 to $9,999 | 0 (0.0%) | 6 (11.8%) |
| $10,000 to $14,999 | 8 (18.6%) | 18 (35.3%) |
| $15,000 to $19,999 | 0 (0.0%) | 2 (3.9%) |
| $20,000 to $24,999 | 9 (20.9%) | 2 (3.9%) |
| $25,000 to $34,999 | 7 (16.3%) | 0 (0.0%) |
| $35,000 to $49,999 | 11 (25.6%) | 11 (21.6%) |
| $50,000 to $74,999 | 2 (4.6%) | 0 (0.0%) |
| $75,000 to $99,999 | 1 (2.3%) | 0 (0.0%) |
| $100,000 to $149,999 | 2 (4.6%) | 10 (19.6%) |
| $150,000 or more | 2 (4.6%) | 0 (0.0%) |
| Total | 43 (100.0%) | 51 (100.0%) |
Monthly Housing Cost Tiers in Ambrose
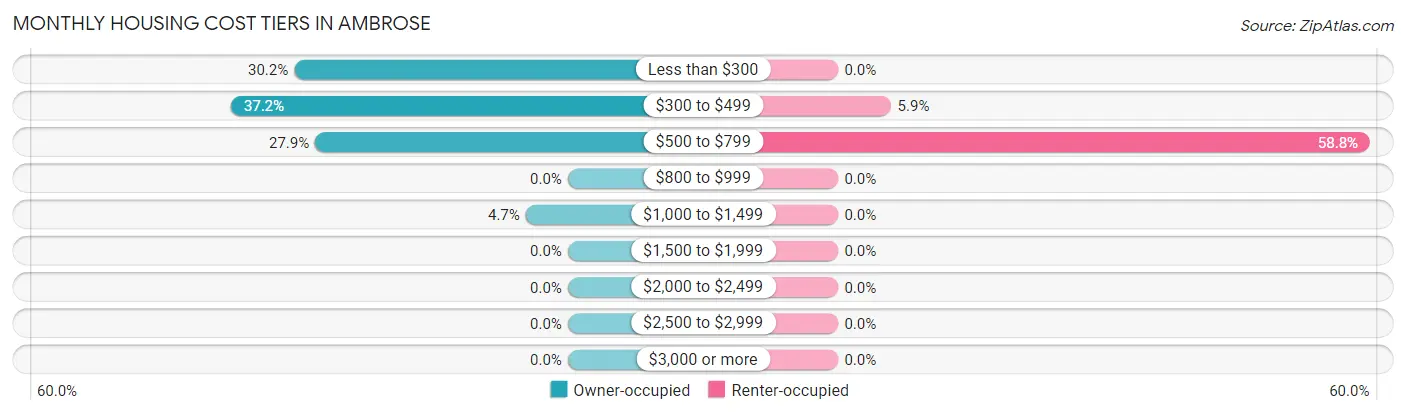
| Monthly Cost | Owner-occupied | Renter-occupied |
| Less than $300 | 13 (30.2%) | 0 (0.0%) |
| $300 to $499 | 16 (37.2%) | 3 (5.9%) |
| $500 to $799 | 12 (27.9%) | 30 (58.8%) |
| $800 to $999 | 0 (0.0%) | 0 (0.0%) |
| $1,000 to $1,499 | 2 (4.6%) | 0 (0.0%) |
| $1,500 to $1,999 | 0 (0.0%) | 0 (0.0%) |
| $2,000 to $2,499 | 0 (0.0%) | 0 (0.0%) |
| $2,500 to $2,999 | 0 (0.0%) | 0 (0.0%) |
| $3,000 or more | 0 (0.0%) | 0 (0.0%) |
| Total | 43 (100.0%) | 51 (100.0%) |
Physical Housing Characteristics in Ambrose
Housing Structures in Ambrose
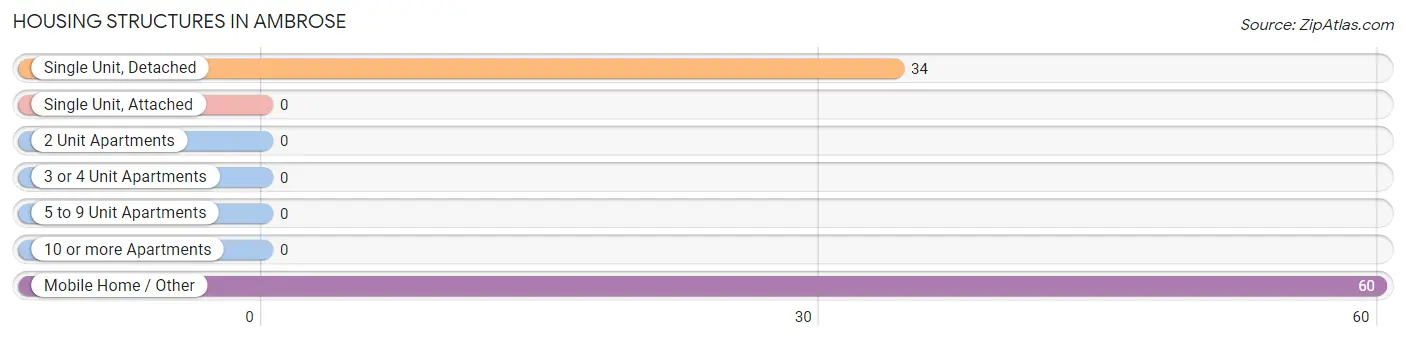
| Structure Type | # Housing Units | % Housing Units |
| Single Unit, Detached | 34 | 36.2% |
| Single Unit, Attached | 0 | 0.0% |
| 2 Unit Apartments | 0 | 0.0% |
| 3 or 4 Unit Apartments | 0 | 0.0% |
| 5 to 9 Unit Apartments | 0 | 0.0% |
| 10 or more Apartments | 0 | 0.0% |
| Mobile Home / Other | 60 | 63.8% |
| Total | 94 | 100.0% |
Housing Structures by Occupancy in Ambrose
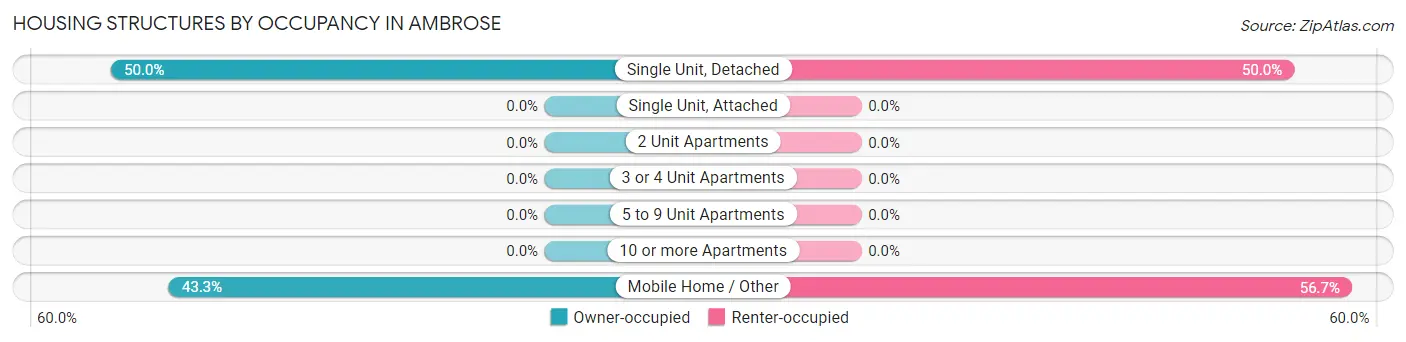
| Structure Type | Owner-occupied | Renter-occupied |
| Single Unit, Detached | 17 (50.0%) | 17 (50.0%) |
| Single Unit, Attached | 0 (0.0%) | 0 (0.0%) |
| 2 Unit Apartments | 0 (0.0%) | 0 (0.0%) |
| 3 or 4 Unit Apartments | 0 (0.0%) | 0 (0.0%) |
| 5 to 9 Unit Apartments | 0 (0.0%) | 0 (0.0%) |
| 10 or more Apartments | 0 (0.0%) | 0 (0.0%) |
| Mobile Home / Other | 26 (43.3%) | 34 (56.7%) |
| Total | 43 (45.7%) | 51 (54.3%) |
Housing Structures by Number of Rooms in Ambrose
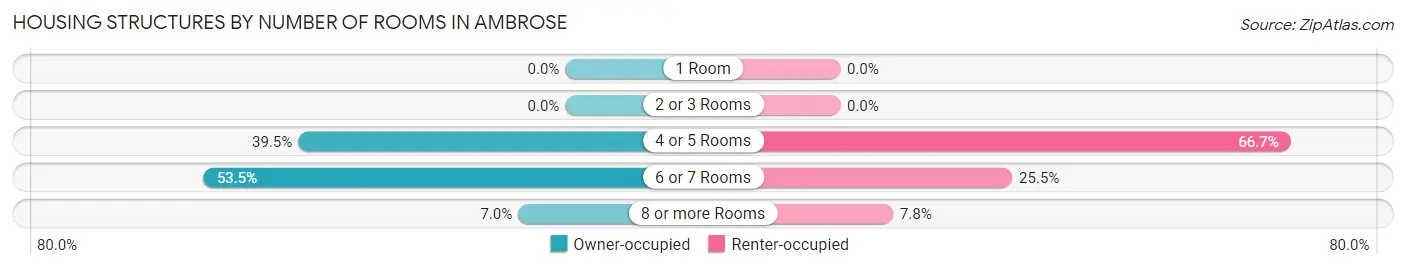
| Number of Rooms | Owner-occupied | Renter-occupied |
| 1 Room | 0 (0.0%) | 0 (0.0%) |
| 2 or 3 Rooms | 0 (0.0%) | 0 (0.0%) |
| 4 or 5 Rooms | 17 (39.5%) | 34 (66.7%) |
| 6 or 7 Rooms | 23 (53.5%) | 13 (25.5%) |
| 8 or more Rooms | 3 (7.0%) | 4 (7.8%) |
| Total | 43 (100.0%) | 51 (100.0%) |
Housing Structure by Heating Type in Ambrose
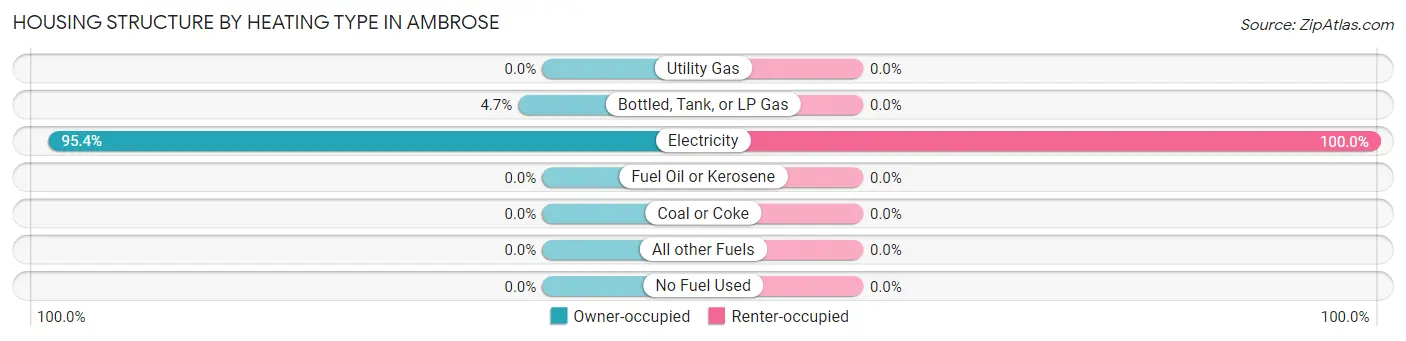
| Heating Type | Owner-occupied | Renter-occupied |
| Utility Gas | 0 (0.0%) | 0 (0.0%) |
| Bottled, Tank, or LP Gas | 2 (4.6%) | 0 (0.0%) |
| Electricity | 41 (95.4%) | 51 (100.0%) |
| Fuel Oil or Kerosene | 0 (0.0%) | 0 (0.0%) |
| Coal or Coke | 0 (0.0%) | 0 (0.0%) |
| All other Fuels | 0 (0.0%) | 0 (0.0%) |
| No Fuel Used | 0 (0.0%) | 0 (0.0%) |
| Total | 43 (100.0%) | 51 (100.0%) |
Household Vehicle Usage in Ambrose
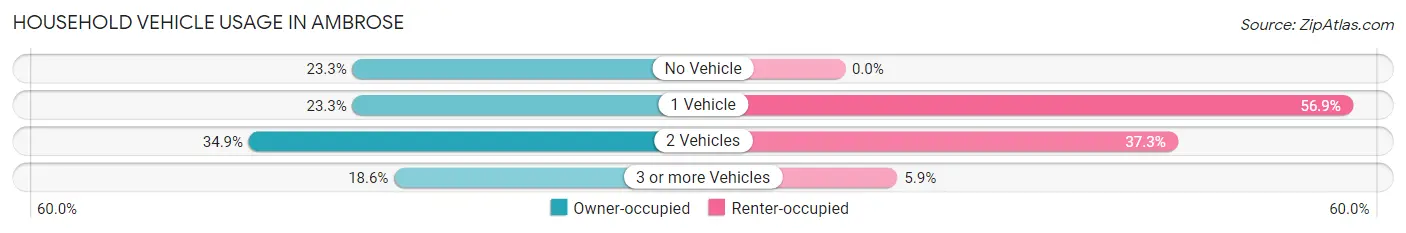
| Vehicles per Household | Owner-occupied | Renter-occupied |
| No Vehicle | 10 (23.3%) | 0 (0.0%) |
| 1 Vehicle | 10 (23.3%) | 29 (56.9%) |
| 2 Vehicles | 15 (34.9%) | 19 (37.2%) |
| 3 or more Vehicles | 8 (18.6%) | 3 (5.9%) |
| Total | 43 (100.0%) | 51 (100.0%) |
Real Estate & Mortgages in Ambrose
Real Estate and Mortgage Overview in Ambrose
| Characteristic | Without Mortgage | With Mortgage |
| Housing Units | 34 | 9 |
| Median Property Value | - | - |
| Median Household Income | $25,833 | $0 |
| Monthly Housing Costs | $355 | $0 |
| Real Estate Taxes | $525 | $2 |
Property Value by Mortgage Status in Ambrose
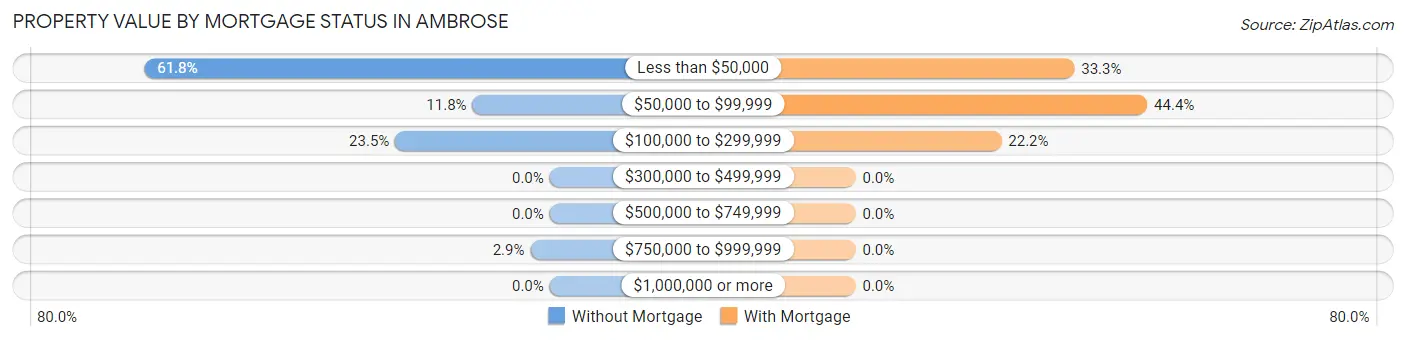
| Property Value | Without Mortgage | With Mortgage |
| Less than $50,000 | 21 (61.8%) | 3 (33.3%) |
| $50,000 to $99,999 | 4 (11.8%) | 4 (44.4%) |
| $100,000 to $299,999 | 8 (23.5%) | 2 (22.2%) |
| $300,000 to $499,999 | 0 (0.0%) | 0 (0.0%) |
| $500,000 to $749,999 | 0 (0.0%) | 0 (0.0%) |
| $750,000 to $999,999 | 1 (2.9%) | 0 (0.0%) |
| $1,000,000 or more | 0 (0.0%) | 0 (0.0%) |
| Total | 34 (100.0%) | 9 (100.0%) |
Household Income by Mortgage Status in Ambrose
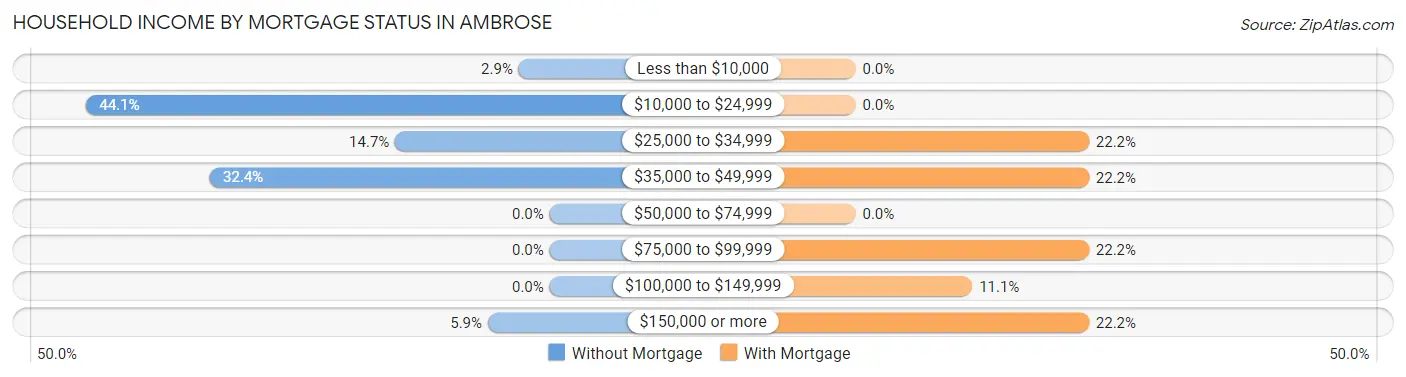
| Household Income | Without Mortgage | With Mortgage |
| Less than $10,000 | 1 (2.9%) | 0 (0.0%) |
| $10,000 to $24,999 | 15 (44.1%) | 0 (0.0%) |
| $25,000 to $34,999 | 5 (14.7%) | 2 (22.2%) |
| $35,000 to $49,999 | 11 (32.4%) | 2 (22.2%) |
| $50,000 to $74,999 | 0 (0.0%) | 0 (0.0%) |
| $75,000 to $99,999 | 0 (0.0%) | 2 (22.2%) |
| $100,000 to $149,999 | 0 (0.0%) | 1 (11.1%) |
| $150,000 or more | 2 (5.9%) | 2 (22.2%) |
| Total | 34 (100.0%) | 9 (100.0%) |
Property Value to Household Income Ratio in Ambrose
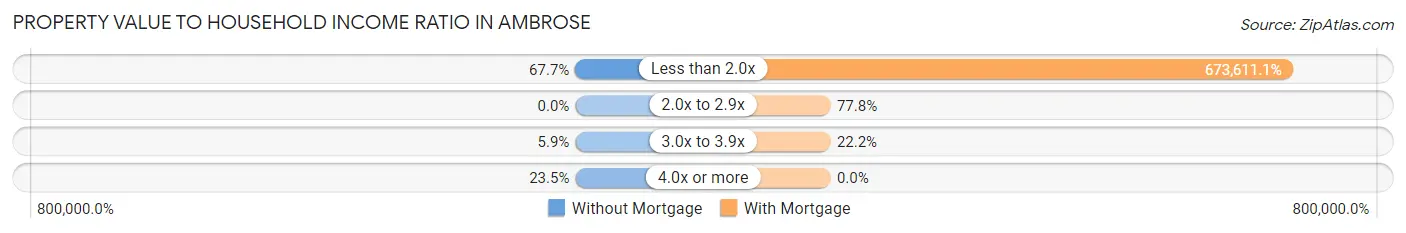
| Value-to-Income Ratio | Without Mortgage | With Mortgage |
| Less than 2.0x | 23 (67.6%) | 60,625 (673,611.1%) |
| 2.0x to 2.9x | 0 (0.0%) | 7 (77.8%) |
| 3.0x to 3.9x | 2 (5.9%) | 2 (22.2%) |
| 4.0x or more | 8 (23.5%) | 0 (0.0%) |
| Total | 34 (100.0%) | 9 (100.0%) |
Real Estate Taxes by Mortgage Status in Ambrose
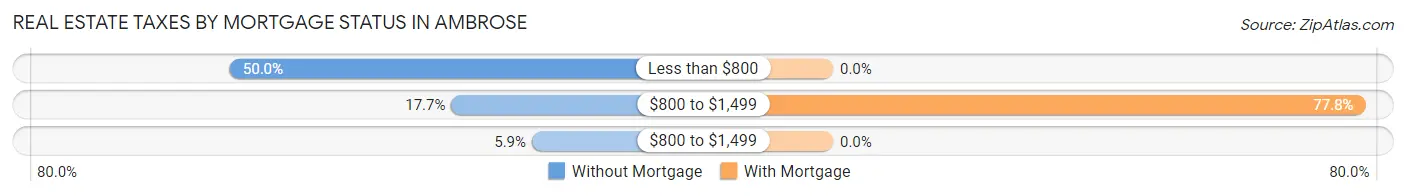
| Property Taxes | Without Mortgage | With Mortgage |
| Less than $800 | 17 (50.0%) | 0 (0.0%) |
| $800 to $1,499 | 6 (17.6%) | 7 (77.8%) |
| $800 to $1,499 | 2 (5.9%) | 0 (0.0%) |
| Total | 34 (100.0%) | 9 (100.0%) |
Health & Disability in Ambrose
Health Insurance Coverage by Age in Ambrose
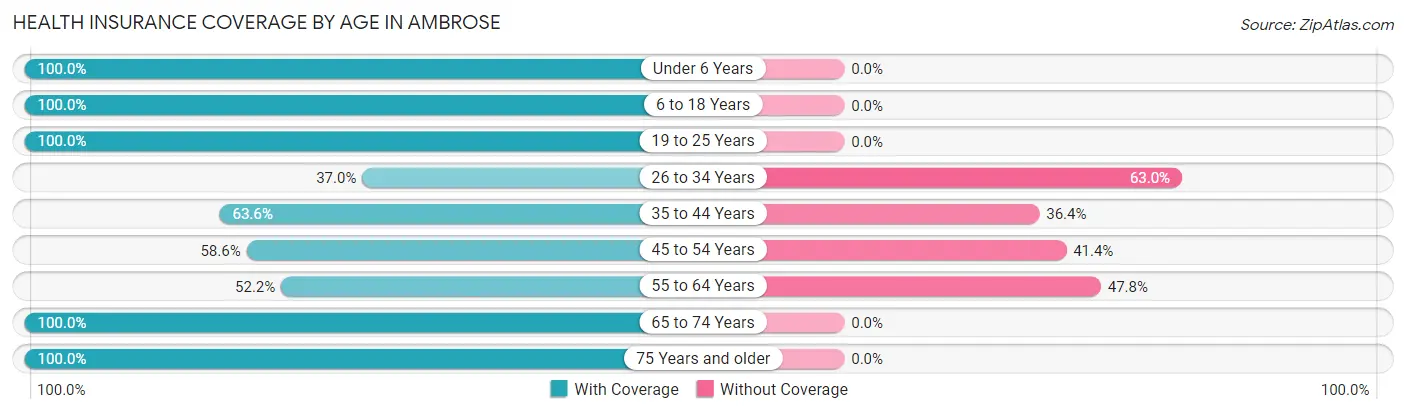
| Age Bracket | With Coverage | Without Coverage |
| Under 6 Years | 2 (100.0%) | 0 (0.0%) |
| 6 to 18 Years | 34 (100.0%) | 0 (0.0%) |
| 19 to 25 Years | 16 (100.0%) | 0 (0.0%) |
| 26 to 34 Years | 10 (37.0%) | 17 (63.0%) |
| 35 to 44 Years | 21 (63.6%) | 12 (36.4%) |
| 45 to 54 Years | 17 (58.6%) | 12 (41.4%) |
| 55 to 64 Years | 12 (52.2%) | 11 (47.8%) |
| 65 to 74 Years | 33 (100.0%) | 0 (0.0%) |
| 75 Years and older | 24 (100.0%) | 0 (0.0%) |
| Total | 169 (76.5%) | 52 (23.5%) |
Health Insurance Coverage by Citizenship Status in Ambrose
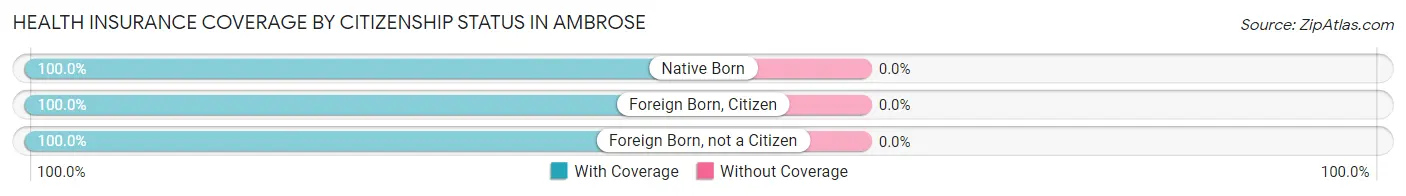
| Citizenship Status | With Coverage | Without Coverage |
| Native Born | 2 (100.0%) | 0 (0.0%) |
| Foreign Born, Citizen | 34 (100.0%) | 0 (0.0%) |
| Foreign Born, not a Citizen | 16 (100.0%) | 0 (0.0%) |
Health Insurance Coverage by Household Income in Ambrose
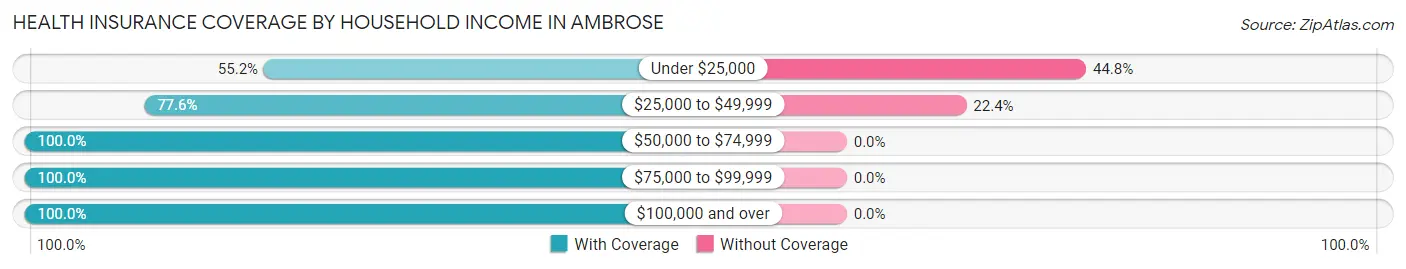
| Household Income | With Coverage | Without Coverage |
| Under $25,000 | 48 (55.2%) | 39 (44.8%) |
| $25,000 to $49,999 | 45 (77.6%) | 13 (22.4%) |
| $50,000 to $74,999 | 8 (100.0%) | 0 (0.0%) |
| $75,000 to $99,999 | 3 (100.0%) | 0 (0.0%) |
| $100,000 and over | 65 (100.0%) | 0 (0.0%) |
Public vs Private Health Insurance Coverage by Age in Ambrose
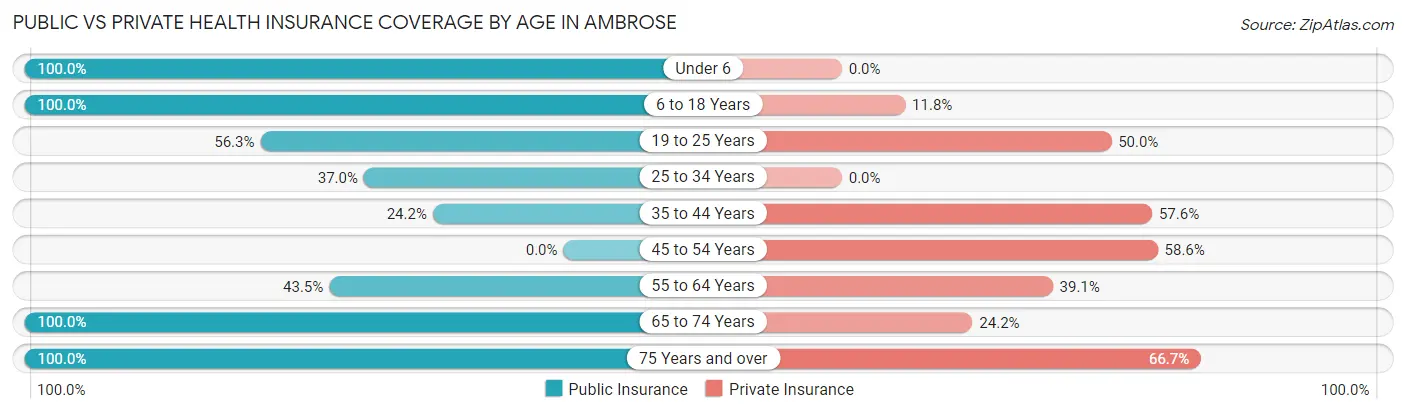
| Age Bracket | Public Insurance | Private Insurance |
| Under 6 | 2 (100.0%) | 0 (0.0%) |
| 6 to 18 Years | 34 (100.0%) | 4 (11.8%) |
| 19 to 25 Years | 9 (56.2%) | 8 (50.0%) |
| 25 to 34 Years | 10 (37.0%) | 0 (0.0%) |
| 35 to 44 Years | 8 (24.2%) | 19 (57.6%) |
| 45 to 54 Years | 0 (0.0%) | 17 (58.6%) |
| 55 to 64 Years | 10 (43.5%) | 9 (39.1%) |
| 65 to 74 Years | 33 (100.0%) | 8 (24.2%) |
| 75 Years and over | 24 (100.0%) | 16 (66.7%) |
| Total | 130 (58.8%) | 81 (36.6%) |
Disability Status by Sex by Age in Ambrose
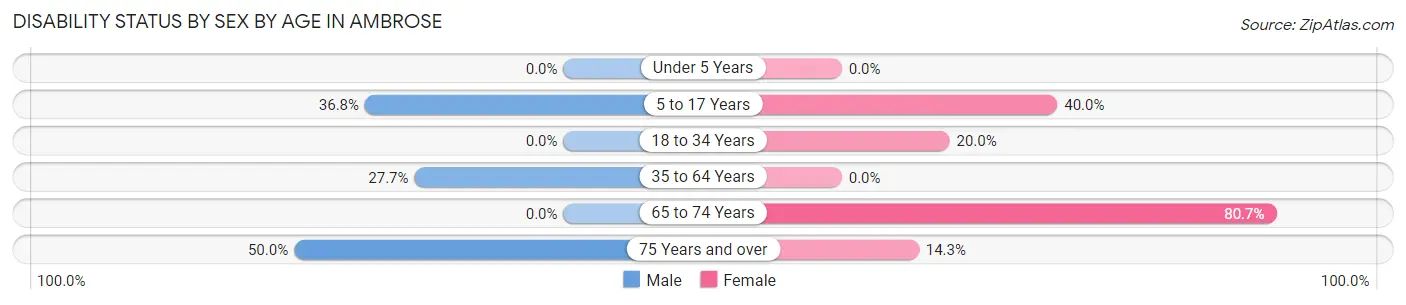
| Age Bracket | Male | Female |
| Under 5 Years | 0 (0.0%) | 0 (0.0%) |
| 5 to 17 Years | 7 (36.8%) | 6 (40.0%) |
| 18 to 34 Years | 0 (0.0%) | 6 (20.0%) |
| 35 to 64 Years | 13 (27.7%) | 0 (0.0%) |
| 65 to 74 Years | 0 (0.0%) | 25 (80.6%) |
| 75 Years and over | 5 (50.0%) | 2 (14.3%) |
Disability Class by Sex by Age in Ambrose
Disability Class: Hearing Difficulty
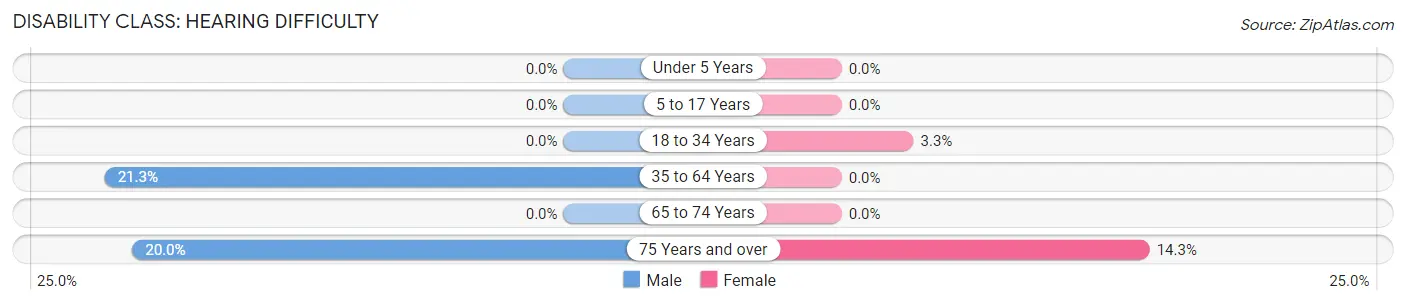
| Age Bracket | Male | Female |
| Under 5 Years | 0 (0.0%) | 0 (0.0%) |
| 5 to 17 Years | 0 (0.0%) | 0 (0.0%) |
| 18 to 34 Years | 0 (0.0%) | 1 (3.3%) |
| 35 to 64 Years | 10 (21.3%) | 0 (0.0%) |
| 65 to 74 Years | 0 (0.0%) | 0 (0.0%) |
| 75 Years and over | 2 (20.0%) | 2 (14.3%) |
Disability Class: Vision Difficulty
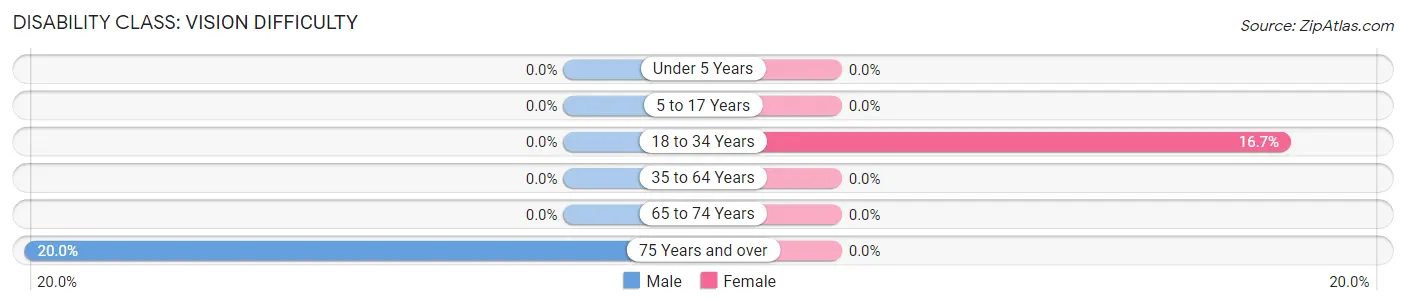
| Age Bracket | Male | Female |
| Under 5 Years | 0 (0.0%) | 0 (0.0%) |
| 5 to 17 Years | 0 (0.0%) | 0 (0.0%) |
| 18 to 34 Years | 0 (0.0%) | 5 (16.7%) |
| 35 to 64 Years | 0 (0.0%) | 0 (0.0%) |
| 65 to 74 Years | 0 (0.0%) | 0 (0.0%) |
| 75 Years and over | 2 (20.0%) | 0 (0.0%) |
Disability Class: Cognitive Difficulty
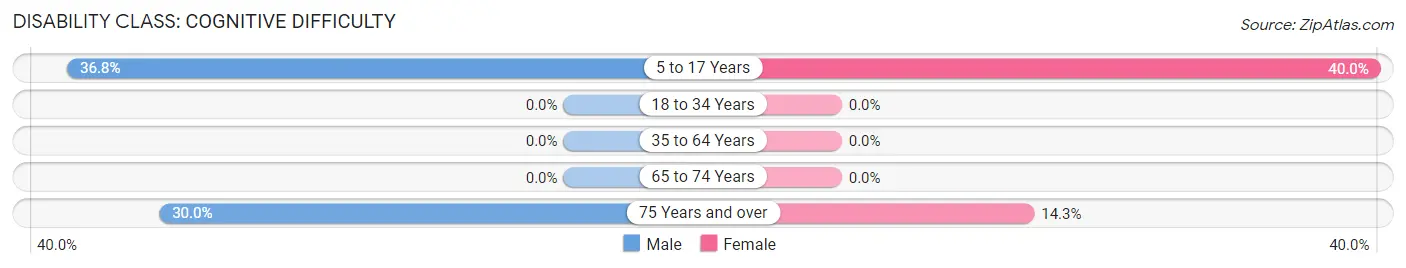
| Age Bracket | Male | Female |
| 5 to 17 Years | 7 (36.8%) | 6 (40.0%) |
| 18 to 34 Years | 0 (0.0%) | 0 (0.0%) |
| 35 to 64 Years | 0 (0.0%) | 0 (0.0%) |
| 65 to 74 Years | 0 (0.0%) | 0 (0.0%) |
| 75 Years and over | 3 (30.0%) | 2 (14.3%) |
Disability Class: Ambulatory Difficulty
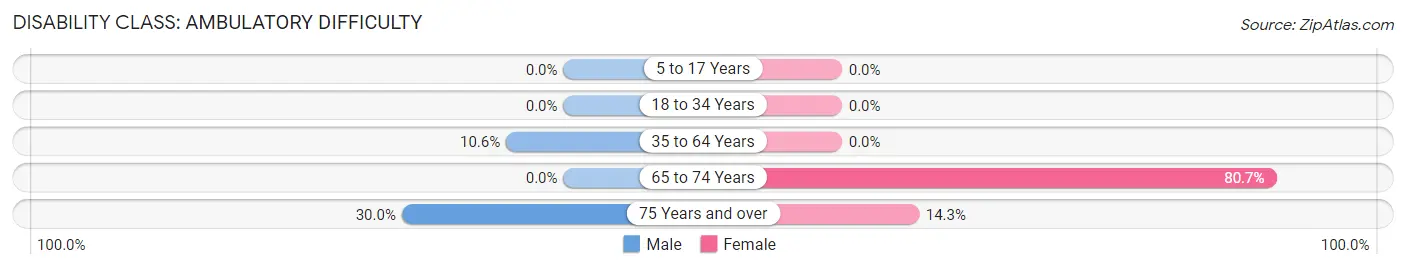
| Age Bracket | Male | Female |
| 5 to 17 Years | 0 (0.0%) | 0 (0.0%) |
| 18 to 34 Years | 0 (0.0%) | 0 (0.0%) |
| 35 to 64 Years | 5 (10.6%) | 0 (0.0%) |
| 65 to 74 Years | 0 (0.0%) | 25 (80.6%) |
| 75 Years and over | 3 (30.0%) | 2 (14.3%) |
Disability Class: Self-Care Difficulty
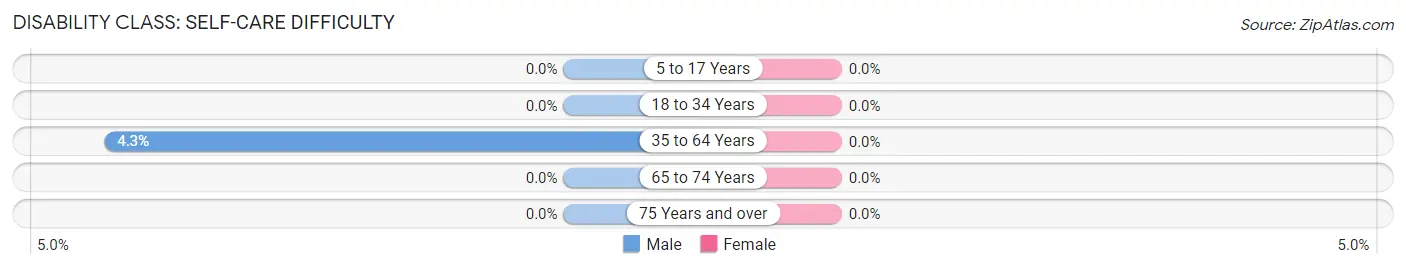
| Age Bracket | Male | Female |
| 5 to 17 Years | 0 (0.0%) | 0 (0.0%) |
| 18 to 34 Years | 0 (0.0%) | 0 (0.0%) |
| 35 to 64 Years | 2 (4.3%) | 0 (0.0%) |
| 65 to 74 Years | 0 (0.0%) | 0 (0.0%) |
| 75 Years and over | 0 (0.0%) | 0 (0.0%) |
Technology Access in Ambrose
Computing Device Access in Ambrose
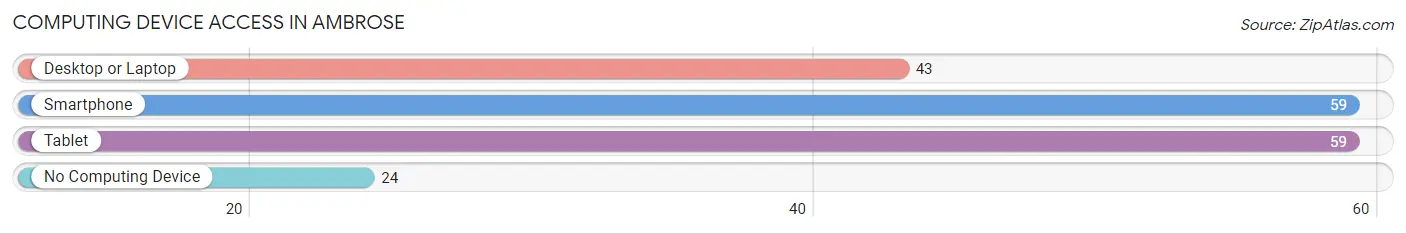
| Device Type | # Households | % Households |
| Desktop or Laptop | 43 | 45.7% |
| Smartphone | 59 | 62.8% |
| Tablet | 59 | 62.8% |
| No Computing Device | 24 | 25.5% |
| Total | 94 | 100.0% |
Internet Access in Ambrose
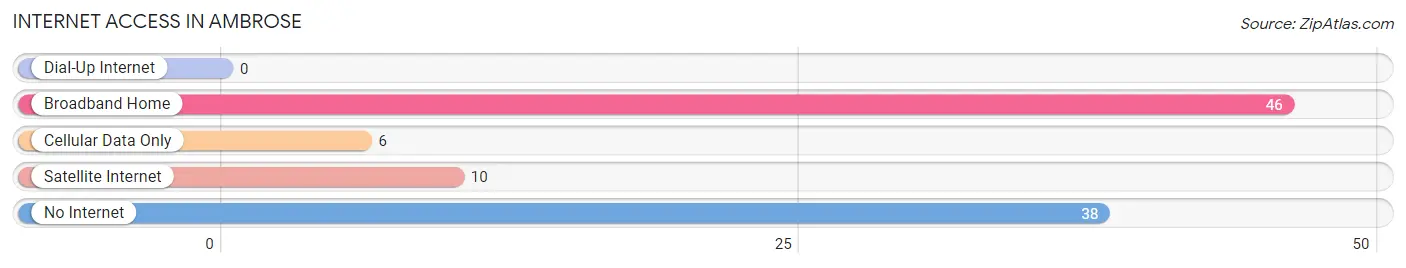
| Internet Type | # Households | % Households |
| Dial-Up Internet | 0 | 0.0% |
| Broadband Home | 46 | 48.9% |
| Cellular Data Only | 6 | 6.4% |
| Satellite Internet | 10 | 10.6% |
| No Internet | 38 | 40.4% |
| Total | 94 | 100.0% |
Ambrose Summary
Ambrose, Georgia is a small town located in Coffee County, Georgia. It is situated about 20 miles south of Douglas, Georgia and about 40 miles north of Valdosta, Georgia. The town was founded in 1891 and was named after Ambrose B. Smith, a prominent local businessman. The population of Ambrose was estimated to be around 1,000 people in 2020.
Geography
Ambrose is located in the southeastern corner of Coffee County, Georgia. It is situated on the banks of the Satilla River, which flows through the town. The town is surrounded by a variety of natural features, including the Satilla River, the Okefenokee Swamp, and the Okefenokee National Wildlife Refuge. The town is also located near the Georgia-Florida border, which is about 40 miles away.
The town of Ambrose is located in a humid subtropical climate zone, which is characterized by hot, humid summers and mild winters. The average annual temperature is around 70 degrees Fahrenheit, with the average high temperature in the summer months reaching into the mid-90s. The average low temperature in the winter months is around 40 degrees Fahrenheit.
Economy
The economy of Ambrose is largely based on agriculture and forestry. The town is home to several farms, which produce a variety of crops, including cotton, corn, soybeans, and peanuts. The town is also home to several timber companies, which harvest timber from the surrounding forests.
In addition to agriculture and forestry, Ambrose is home to several small businesses, including restaurants, retail stores, and service providers. The town is also home to a few manufacturing companies, which produce a variety of products, including furniture, clothing, and electronics.
Demographics
As of 2020, the population of Ambrose was estimated to be around 1,000 people. The town is predominantly white, with about 90% of the population identifying as white. The remaining 10% of the population is made up of African Americans, Hispanics, and other ethnicities.
The median household income in Ambrose is around $35,000, which is slightly lower than the median household income in Coffee County. The median home value in Ambrose is around $90,000, which is slightly lower than the median home value in Coffee County.
The town of Ambrose is served by the Coffee County School District, which includes two elementary schools, one middle school, and one high school. The town is also home to a few churches, including the First Baptist Church of Ambrose and the Church of God of Prophecy.
Conclusion
Ambrose, Georgia is a small town located in Coffee County, Georgia. It is situated on the banks of the Satilla River and is surrounded by a variety of natural features, including the Okefenokee Swamp and the Okefenokee National Wildlife Refuge. The town is predominantly white, with about 90% of the population identifying as white. The economy of Ambrose is largely based on agriculture and forestry, and the town is also home to several small businesses. The town is served by the Coffee County School District and is home to a few churches.
Common Questions
What is Per Capita Income in Ambrose?
Per Capita income in Ambrose is $24,172.
What is the Median Household income in Ambrose?
Median Household Income in Ambrose is $24,722.
What is Inequality or Gini Index in Ambrose?
Inequality or Gini Index in Ambrose is 0.59.
What is the Total Population of Ambrose?
Total Population of Ambrose is 221.
What is the Total Male Population of Ambrose?
Total Male Population of Ambrose is 92.
What is the Total Female Population of Ambrose?
Total Female Population of Ambrose is 129.
What is the Ratio of Males per 100 Females in Ambrose?
There are 71.32 Males per 100 Females in Ambrose.
What is the Ratio of Females per 100 Males in Ambrose?
There are 140.22 Females per 100 Males in Ambrose.
What is the Median Population Age in Ambrose?
Median Population Age in Ambrose is 42.0 Years.
What is the Average Family Size in Ambrose
Average Family Size in Ambrose is 3.3 People.
What is the Average Household Size in Ambrose
Average Household Size in Ambrose is 2.4 People.
How Large is the Labor Force in Ambrose?
There are 106 People in the Labor Forcein in Ambrose.
What is the Percentage of People in the Labor Force in Ambrose?
54.6% of People are in the Labor Force in Ambrose.
What is the Unemployment Rate in Ambrose?
Unemployment Rate in Ambrose is 11.3%.