Smithville, GA Map & Demographics
Smithville Map
Smithville Overview
$27,968
PER CAPITA INCOME
$71,607
AVG FAMILY INCOME
$46,250
AVG HOUSEHOLD INCOME
0.39
INEQUALITY / GINI INDEX
320
TOTAL POPULATION
177
MALE POPULATION
143
FEMALE POPULATION
123.78
MALES / 100 FEMALES
80.79
FEMALES / 100 MALES
43.3
MEDIAN AGE
2.6
AVG FAMILY SIZE
2.0
AVG HOUSEHOLD SIZE
144
LABOR FORCE [ PEOPLE ]
49.7%
PERCENT IN LABOR FORCE
2.8%
UNEMPLOYMENT RATE
Smithville Zip Codes
Smithville Area Codes
Income in Smithville
Income Overview in Smithville
Per Capita Income in Smithville is $27,968, while median incomes of families and households are $71,607 and $46,250 respectively.
| Characteristic | Number | Measure |
| Per Capita Income | 320 | $27,968 |
| Median Family Income | 101 | $71,607 |
| Mean Family Income | 101 | $74,732 |
| Median Household Income | 156 | $46,250 |
| Mean Household Income | 156 | $61,912 |
| Income Deficit | 101 | $0 |
| Wage / Income Gap (%) | 320 | 0.00% |
| Wage / Income Gap ($) | 320 | 100.00¢ per $1 |
| Gini / Inequality Index | 320 | 0.39 |
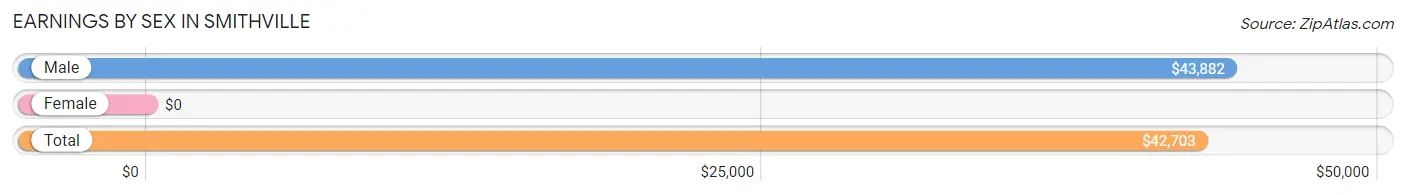
Earnings by Sex in Smithville
| Sex | Number | Average Earnings |
| Male | 87 (55.8%) | $43,882 |
| Female | 69 (44.2%) | $0 |
| Total | 156 (100.0%) | $42,703 |
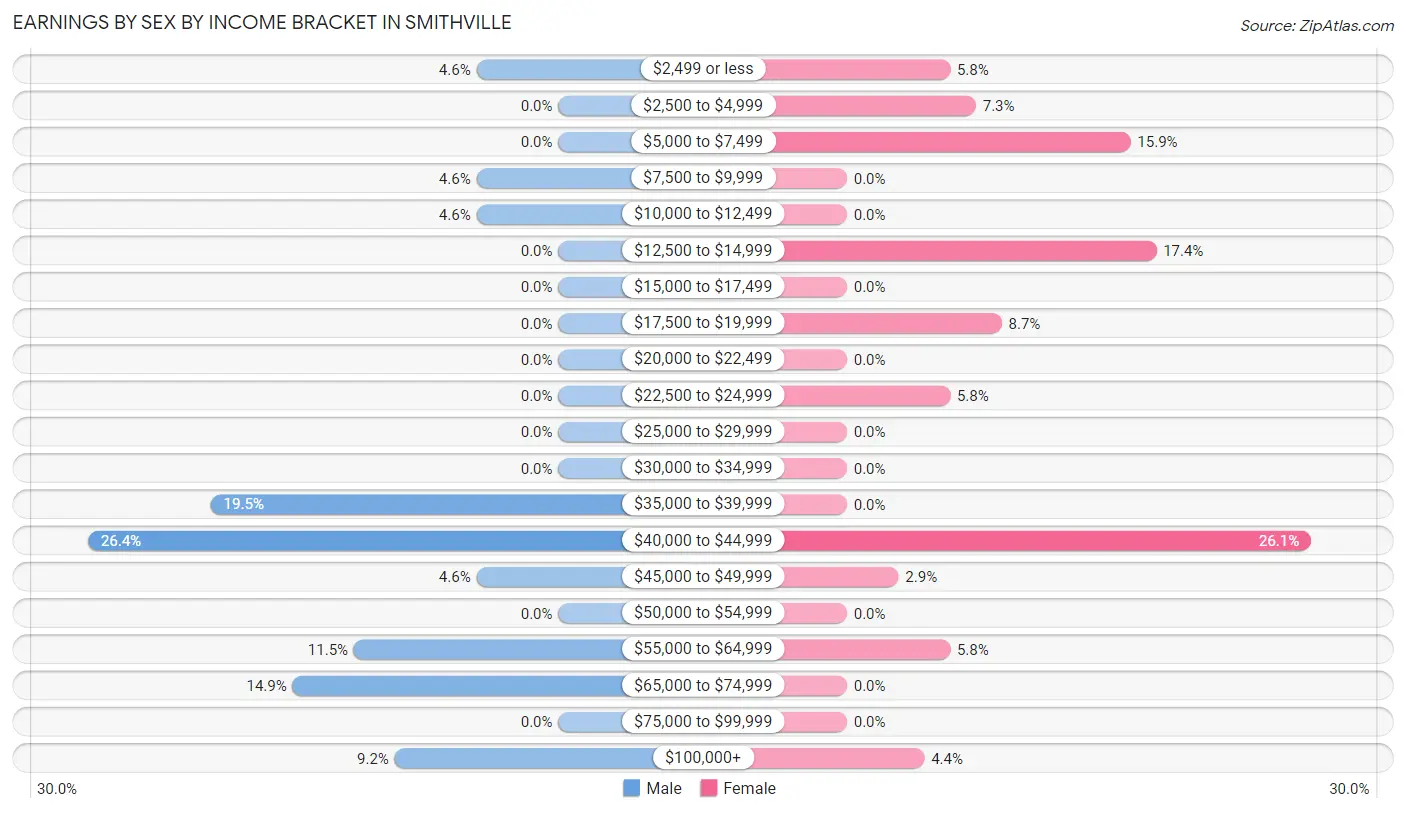
Earnings by Sex by Income Bracket in Smithville
The most common earnings brackets in Smithville are $40,000 to $44,999 for men (23 | 26.4%) and $40,000 to $44,999 for women (18 | 26.1%).
| Income | Male | Female |
| $2,499 or less | 4 (4.6%) | 4 (5.8%) |
| $2,500 to $4,999 | 0 (0.0%) | 5 (7.2%) |
| $5,000 to $7,499 | 0 (0.0%) | 11 (15.9%) |
| $7,500 to $9,999 | 4 (4.6%) | 0 (0.0%) |
| $10,000 to $12,499 | 4 (4.6%) | 0 (0.0%) |
| $12,500 to $14,999 | 0 (0.0%) | 12 (17.4%) |
| $15,000 to $17,499 | 0 (0.0%) | 0 (0.0%) |
| $17,500 to $19,999 | 0 (0.0%) | 6 (8.7%) |
| $20,000 to $22,499 | 0 (0.0%) | 0 (0.0%) |
| $22,500 to $24,999 | 0 (0.0%) | 4 (5.8%) |
| $25,000 to $29,999 | 0 (0.0%) | 0 (0.0%) |
| $30,000 to $34,999 | 0 (0.0%) | 0 (0.0%) |
| $35,000 to $39,999 | 17 (19.5%) | 0 (0.0%) |
| $40,000 to $44,999 | 23 (26.4%) | 18 (26.1%) |
| $45,000 to $49,999 | 4 (4.6%) | 2 (2.9%) |
| $50,000 to $54,999 | 0 (0.0%) | 0 (0.0%) |
| $55,000 to $64,999 | 10 (11.5%) | 4 (5.8%) |
| $65,000 to $74,999 | 13 (14.9%) | 0 (0.0%) |
| $75,000 to $99,999 | 0 (0.0%) | 0 (0.0%) |
| $100,000+ | 8 (9.2%) | 3 (4.3%) |
| Total | 87 (100.0%) | 69 (100.0%) |
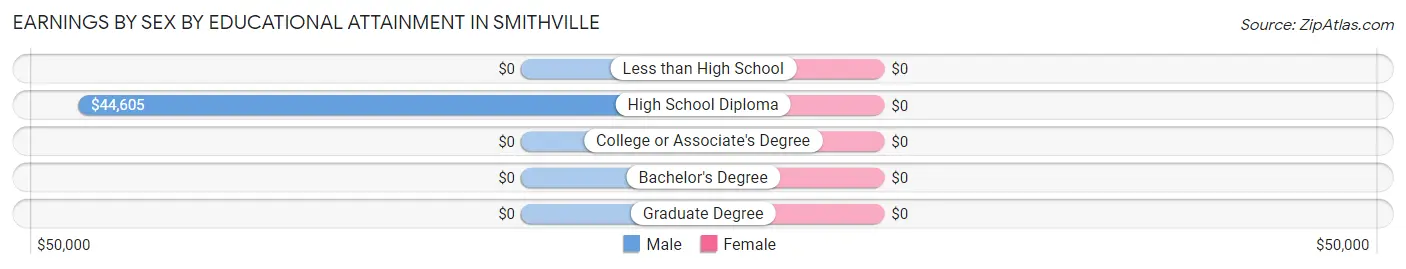
Earnings by Sex by Educational Attainment in Smithville
| Educational Attainment | Male Income | Female Income |
| Less than High School | - | - |
| High School Diploma | $44,605 | $0 |
| College or Associate's Degree | - | - |
| Bachelor's Degree | - | - |
| Graduate Degree | - | - |
| Total | $44,145 | $0 |
Family Income in Smithville
Family Income Brackets in Smithville
According to the Smithville family income data, there are 31 families falling into the $35,000 to $49,999 income range, which is the most common income bracket and makes up 30.7% of all families.
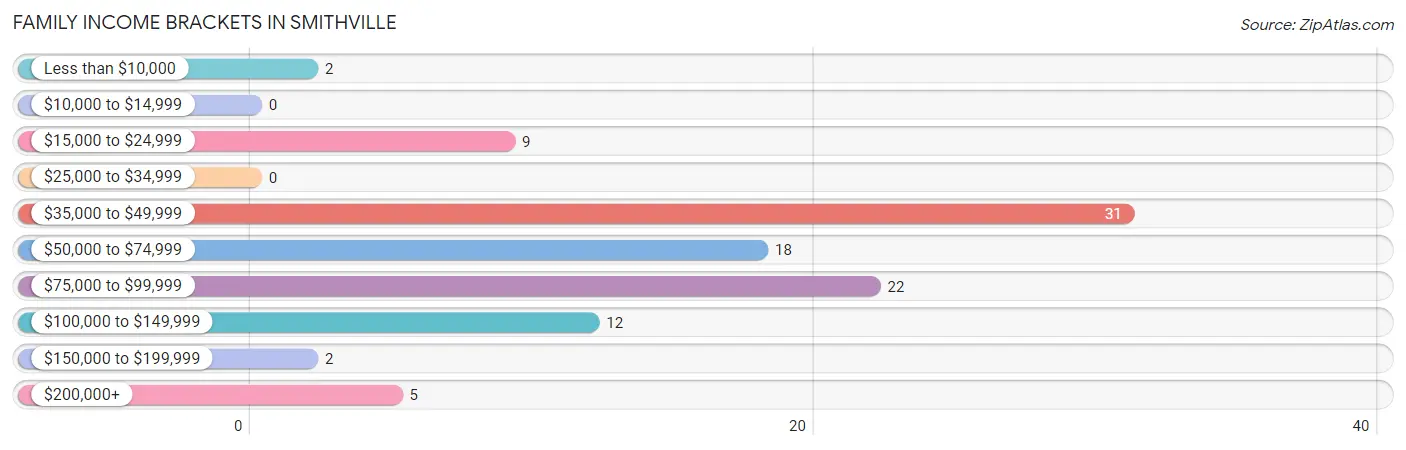
| Income Bracket | # Families | % Families |
| Less than $10,000 | 2 | 2.0% |
| $10,000 to $14,999 | 0 | 0.0% |
| $15,000 to $24,999 | 9 | 8.9% |
| $25,000 to $34,999 | 0 | 0.0% |
| $35,000 to $49,999 | 31 | 30.7% |
| $50,000 to $74,999 | 18 | 17.8% |
| $75,000 to $99,999 | 22 | 21.8% |
| $100,000 to $149,999 | 12 | 11.9% |
| $150,000 to $199,999 | 2 | 2.0% |
| $200,000+ | 5 | 5.0% |
Family Income by Famaliy Size in Smithville
2-person families (48 | 47.5%) account for the highest median family income in Smithville with $72,143 per family, while 2-person families (48 | 47.5%) have the highest median income of $36,072 per family member.
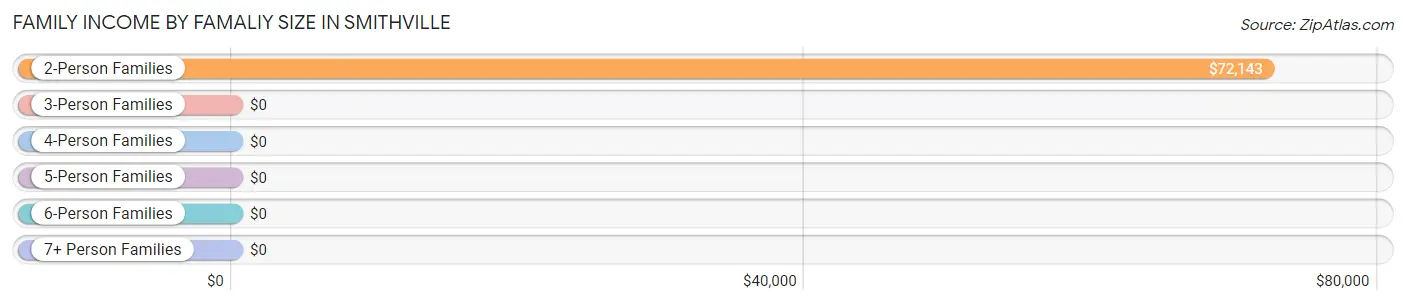
| Income Bracket | # Families | Median Income |
| 2-Person Families | 48 (47.5%) | $72,143 |
| 3-Person Families | 36 (35.6%) | $0 |
| 4-Person Families | 7 (6.9%) | $0 |
| 5-Person Families | 3 (3.0%) | $0 |
| 6-Person Families | 0 (0.0%) | $0 |
| 7+ Person Families | 7 (6.9%) | $0 |
| Total | 101 (100.0%) | $71,607 |
Family Income by Number of Earners in Smithville
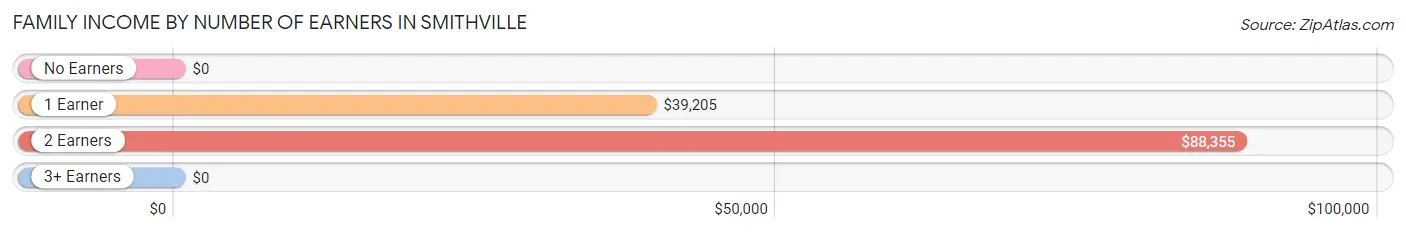
| Number of Earners | # Families | Median Income |
| No Earners | 14 (13.9%) | $0 |
| 1 Earner | 40 (39.6%) | $39,205 |
| 2 Earners | 35 (34.6%) | $88,355 |
| 3+ Earners | 12 (11.9%) | $0 |
| Total | 101 (100.0%) | $71,607 |
Household Income in Smithville
Household Income Brackets in Smithville
With 39 households falling in the category, the $35,000 to $49,999 income range is the most frequent in Smithville, accounting for 25.0% of all households. In contrast, only 2 households (1.3%) fall into the $150,000 to $199,999 income bracket, making it the least populous group.
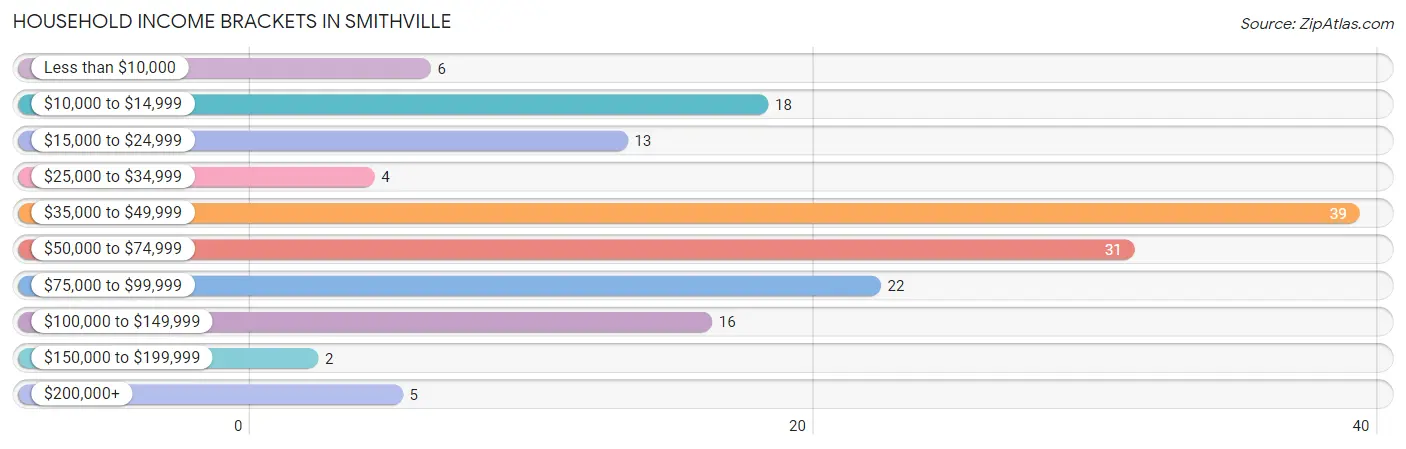
| Income Bracket | # Households | % Households |
| Less than $10,000 | 6 | 3.8% |
| $10,000 to $14,999 | 18 | 11.5% |
| $15,000 to $24,999 | 13 | 8.3% |
| $25,000 to $34,999 | 4 | 2.6% |
| $35,000 to $49,999 | 39 | 25.0% |
| $50,000 to $74,999 | 31 | 19.9% |
| $75,000 to $99,999 | 22 | 14.1% |
| $100,000 to $149,999 | 16 | 10.3% |
| $150,000 to $199,999 | 2 | 1.3% |
| $200,000+ | 5 | 3.2% |
Household Income by Householder Age in Smithville
The median household income in Smithville is $46,250, with the highest median household income of $71,731 found in the 25 to 44 years age bracket for the primary householder. A total of 74 households (47.4%) fall into this category.
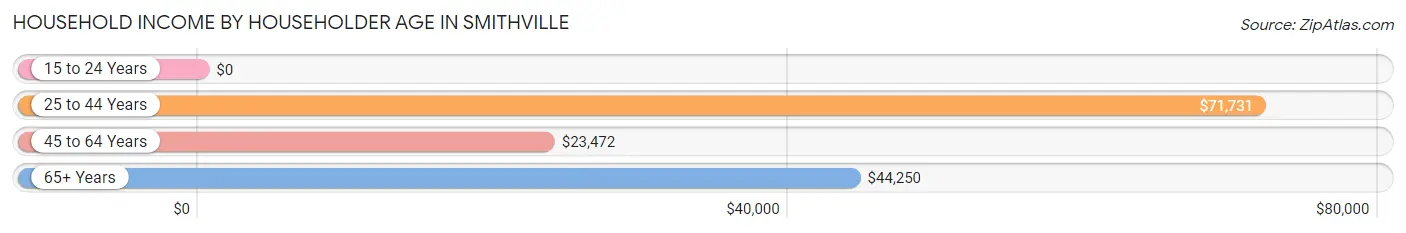
| Income Bracket | # Households | Median Income |
| 15 to 24 Years | 0 (0.0%) | $0 |
| 25 to 44 Years | 74 (47.4%) | $71,731 |
| 45 to 64 Years | 33 (21.1%) | $23,472 |
| 65+ Years | 49 (31.4%) | $44,250 |
| Total | 156 (100.0%) | $46,250 |
Poverty in Smithville
Income Below Poverty by Sex and Age in Smithville
With 9.6% poverty level for males and 18.9% for females among the residents of Smithville, 55 to 64 year old males and 5 year old females are the most vulnerable to poverty, with 13 males (44.8%) and 8 females (100.0%) in their respective age groups living below the poverty level.
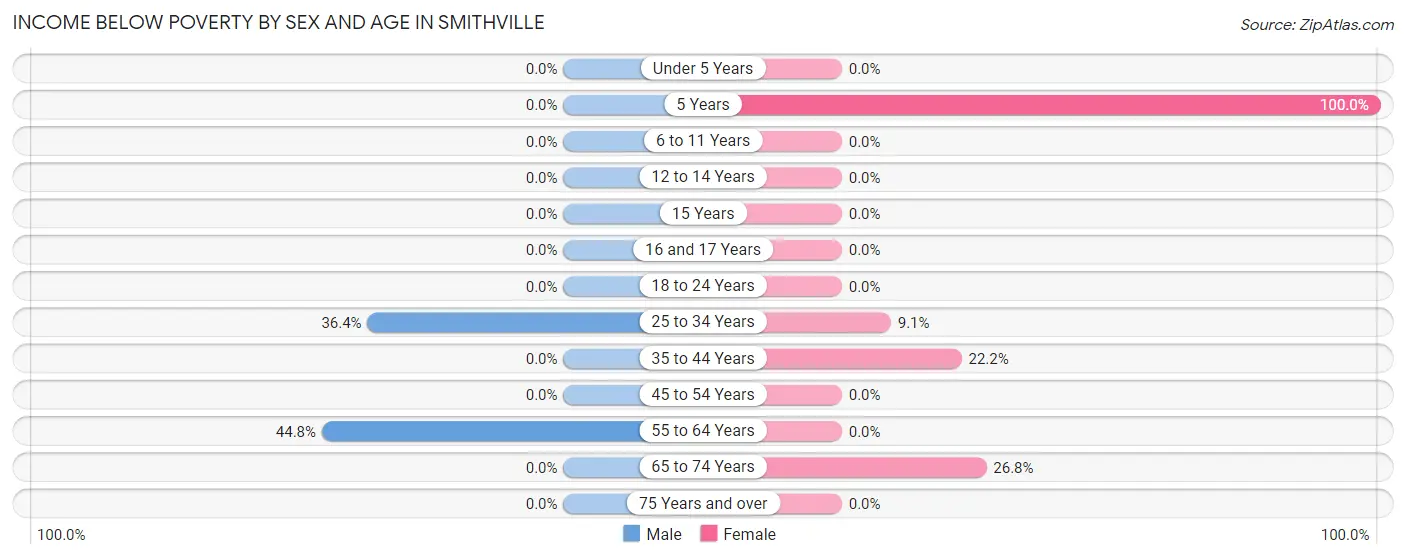
| Age Bracket | Male | Female |
| Under 5 Years | 0 (0.0%) | 0 (0.0%) |
| 5 Years | 0 (0.0%) | 8 (100.0%) |
| 6 to 11 Years | 0 (0.0%) | 0 (0.0%) |
| 12 to 14 Years | 0 (0.0%) | 0 (0.0%) |
| 15 Years | 0 (0.0%) | 0 (0.0%) |
| 16 and 17 Years | 0 (0.0%) | 0 (0.0%) |
| 18 to 24 Years | 0 (0.0%) | 0 (0.0%) |
| 25 to 34 Years | 4 (36.4%) | 4 (9.1%) |
| 35 to 44 Years | 0 (0.0%) | 4 (22.2%) |
| 45 to 54 Years | 0 (0.0%) | 0 (0.0%) |
| 55 to 64 Years | 13 (44.8%) | 0 (0.0%) |
| 65 to 74 Years | 0 (0.0%) | 11 (26.8%) |
| 75 Years and over | 0 (0.0%) | 0 (0.0%) |
| Total | 17 (9.6%) | 27 (18.9%) |
Income Above Poverty by Sex and Age in Smithville
According to the poverty statistics in Smithville, males aged under 5 years and females aged under 5 years are the age groups that are most secure financially, with 100.0% of males and 100.0% of females in these age groups living above the poverty line.
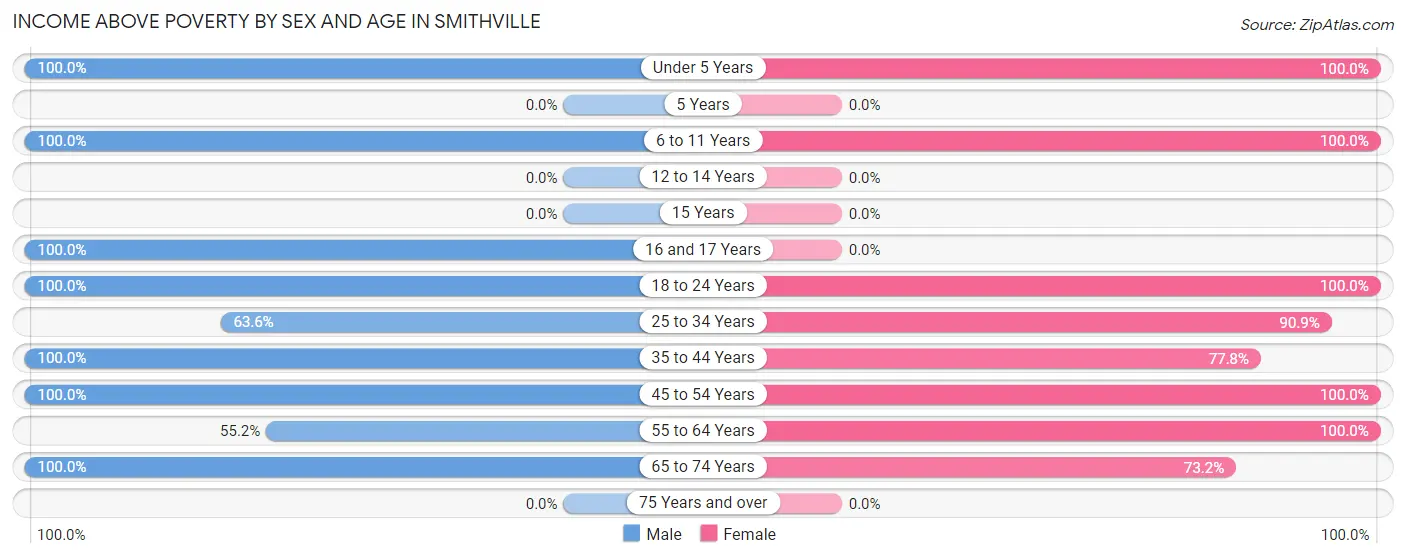
| Age Bracket | Male | Female |
| Under 5 Years | 3 (100.0%) | 4 (100.0%) |
| 5 Years | 0 (0.0%) | 0 (0.0%) |
| 6 to 11 Years | 13 (100.0%) | 2 (100.0%) |
| 12 to 14 Years | 0 (0.0%) | 0 (0.0%) |
| 15 Years | 0 (0.0%) | 0 (0.0%) |
| 16 and 17 Years | 8 (100.0%) | 0 (0.0%) |
| 18 to 24 Years | 14 (100.0%) | 10 (100.0%) |
| 25 to 34 Years | 7 (63.6%) | 40 (90.9%) |
| 35 to 44 Years | 60 (100.0%) | 14 (77.8%) |
| 45 to 54 Years | 3 (100.0%) | 4 (100.0%) |
| 55 to 64 Years | 16 (55.2%) | 12 (100.0%) |
| 65 to 74 Years | 36 (100.0%) | 30 (73.2%) |
| 75 Years and over | 0 (0.0%) | 0 (0.0%) |
| Total | 160 (90.4%) | 116 (81.1%) |
Income Below Poverty Among Married-Couple Families in Smithville
The poverty statistics for married-couple families in Smithville show that 4.6% or 4 of the total 87 families live below the poverty line. Families with 1 or 2 children have the highest poverty rate of 12.1%, comprising of 4 families. On the other hand, families with no children have the lowest poverty rate of 0.0%, which includes 0 families.
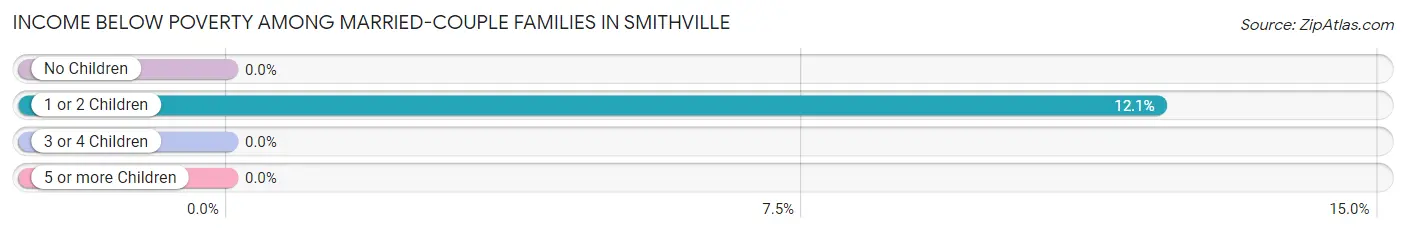
| Children | Above Poverty | Below Poverty |
| No Children | 47 (100.0%) | 0 (0.0%) |
| 1 or 2 Children | 29 (87.9%) | 4 (12.1%) |
| 3 or 4 Children | 7 (100.0%) | 0 (0.0%) |
| 5 or more Children | 0 (0.0%) | 0 (0.0%) |
| Total | 83 (95.4%) | 4 (4.6%) |
Income Below Poverty Among Single-Parent Households in Smithville
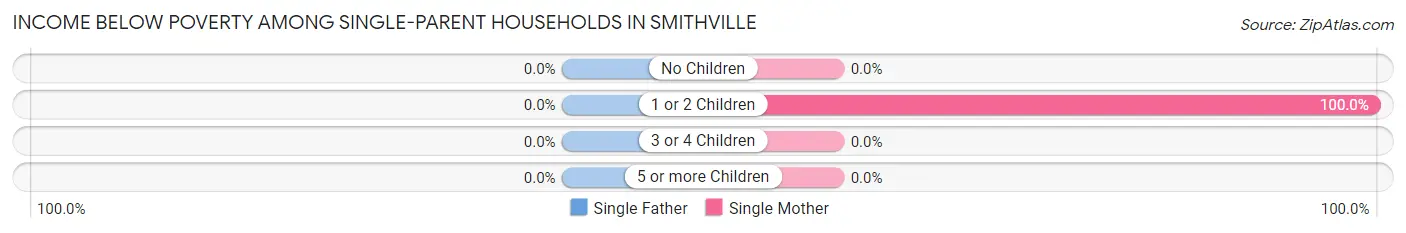
| Children | Single Father | Single Mother |
| No Children | 0 (0.0%) | 0 (0.0%) |
| 1 or 2 Children | 0 (0.0%) | 2 (100.0%) |
| 3 or 4 Children | 0 (0.0%) | 0 (0.0%) |
| 5 or more Children | 0 (0.0%) | 0 (0.0%) |
| Total | 0 (0.0%) | 2 (20.0%) |
Income Below Poverty Among Married-Couple vs Single-Parent Households in Smithville
The poverty data for Smithville shows that 4 of the married-couple family households (4.6%) and 2 of the single-parent households (14.3%) are living below the poverty level. Within the married-couple family households, those with 1 or 2 children have the highest poverty rate, with 4 households (12.1%) falling below the poverty line. Among the single-parent households, those with 1 or 2 children have the highest poverty rate, with 2 household (100.0%) living below poverty.
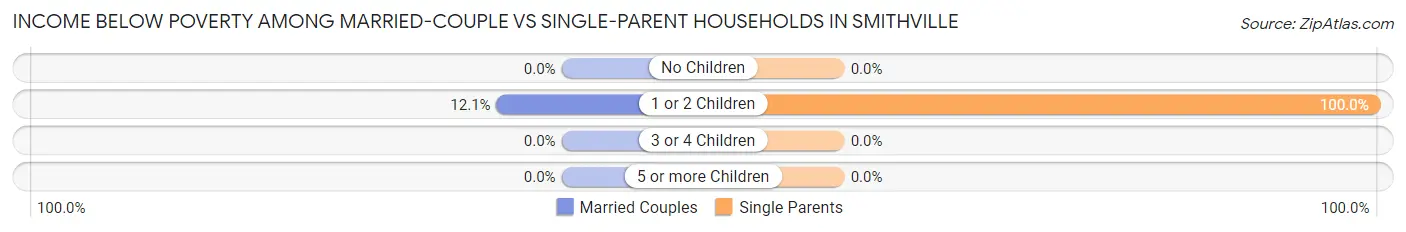
| Children | Married-Couple Families | Single-Parent Households |
| No Children | 0 (0.0%) | 0 (0.0%) |
| 1 or 2 Children | 4 (12.1%) | 2 (100.0%) |
| 3 or 4 Children | 0 (0.0%) | 0 (0.0%) |
| 5 or more Children | 0 (0.0%) | 0 (0.0%) |
| Total | 4 (4.6%) | 2 (14.3%) |
Race in Smithville
The most populous races in Smithville are White / Caucasian (179 | 55.9%), and Black / African American (141 | 44.1%).
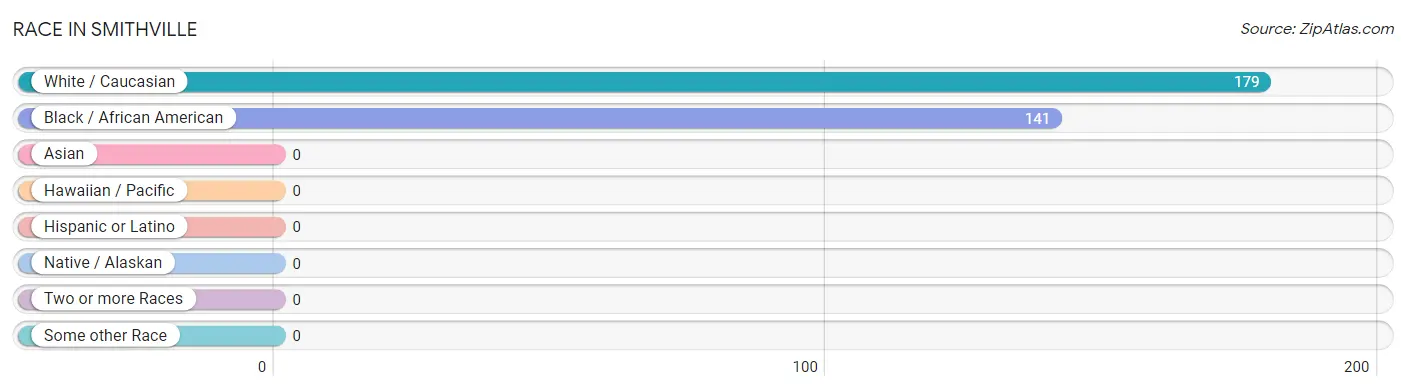
| Race | # Population | % Population |
| Asian | 0 | 0.0% |
| Black / African American | 141 | 44.1% |
| Hawaiian / Pacific | 0 | 0.0% |
| Hispanic or Latino | 0 | 0.0% |
| Native / Alaskan | 0 | 0.0% |
| White / Caucasian | 179 | 55.9% |
| Two or more Races | 0 | 0.0% |
| Some other Race | 0 | 0.0% |
| Total | 320 | 100.0% |
Ancestry in Smithville
The most populous ancestries reported in Smithville are American (51 | 15.9%), African (8 | 2.5%), English (8 | 2.5%), German (8 | 2.5%), and Subsaharan African (8 | 2.5%), together accounting for 25.9% of all Smithville residents.
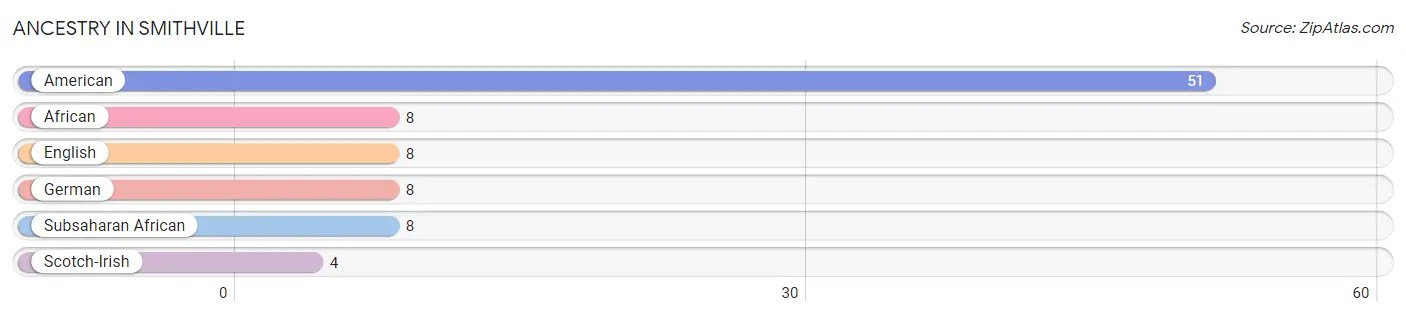
| Ancestry | # Population | % Population |
| African | 8 | 2.5% |
| American | 51 | 15.9% |
| English | 8 | 2.5% |
| German | 8 | 2.5% |
| Scotch-Irish | 4 | 1.3% |
| Subsaharan African | 8 | 2.5% | View All 6 Rows |
Immigrants in Smithville
The most numerous immigrant groups reported in Smithville came from Caribbean (2 | 0.6%), Jamaica (2 | 0.6%), and Latin America (2 | 0.6%), together accounting for 1.9% of all Smithville residents.
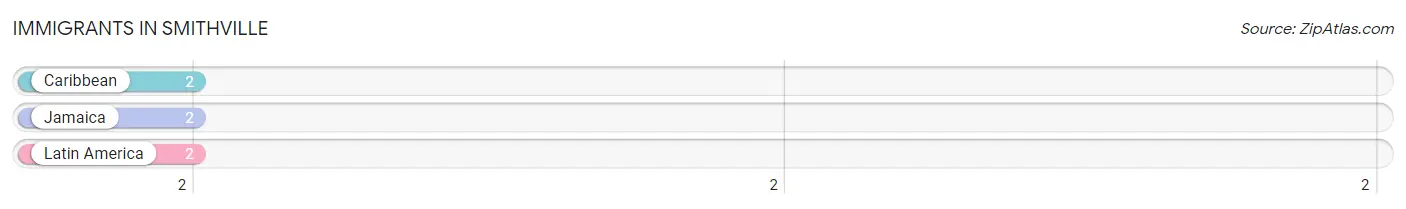
| Immigration Origin | # Population | % Population |
| Caribbean | 2 | 0.6% |
| Jamaica | 2 | 0.6% |
| Latin America | 2 | 0.6% | View All 3 Rows |
Sex and Age in Smithville
Sex and Age in Smithville
The most populous age groups in Smithville are 40 to 44 Years (60 | 33.9%) for men and 25 to 29 Years (22 | 15.4%) for women.
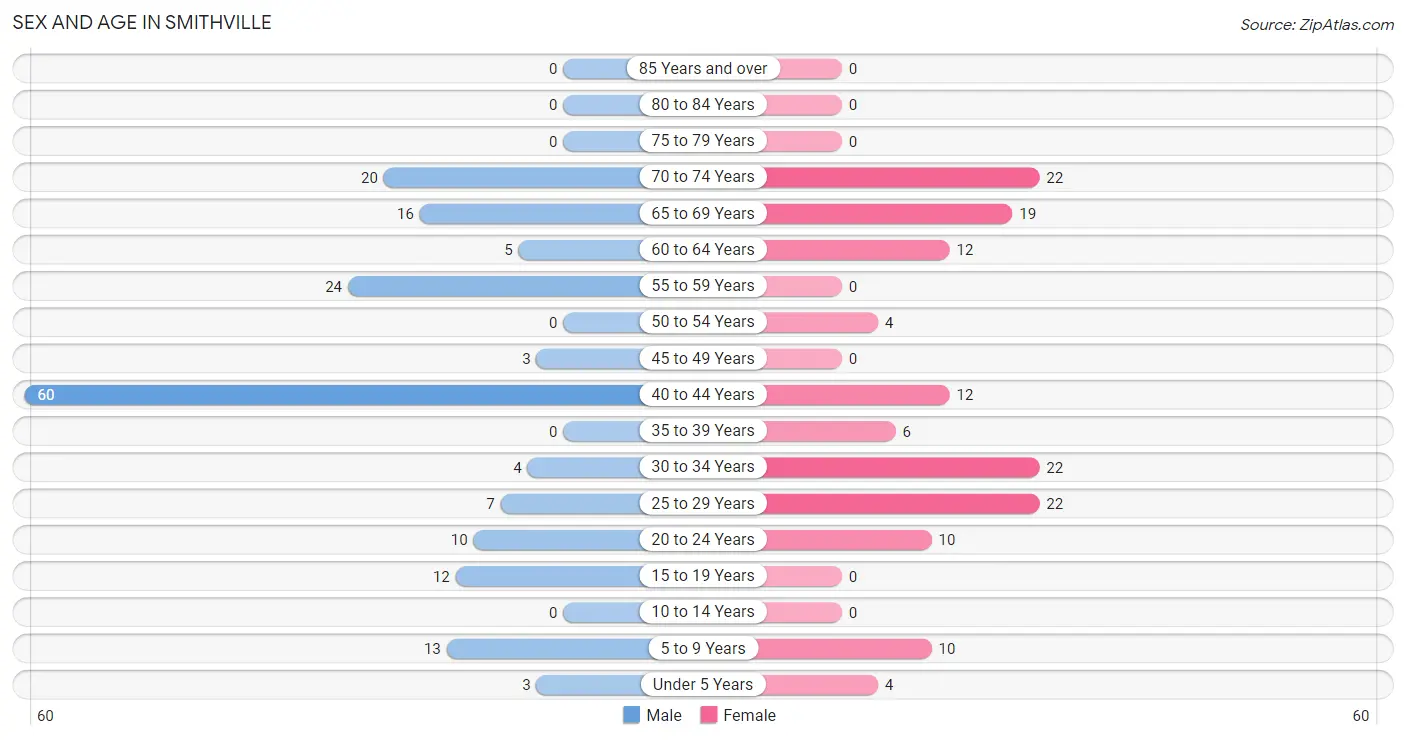
| Age Bracket | Male | Female |
| Under 5 Years | 3 (1.7%) | 4 (2.8%) |
| 5 to 9 Years | 13 (7.3%) | 10 (7.0%) |
| 10 to 14 Years | 0 (0.0%) | 0 (0.0%) |
| 15 to 19 Years | 12 (6.8%) | 0 (0.0%) |
| 20 to 24 Years | 10 (5.7%) | 10 (7.0%) |
| 25 to 29 Years | 7 (4.0%) | 22 (15.4%) |
| 30 to 34 Years | 4 (2.3%) | 22 (15.4%) |
| 35 to 39 Years | 0 (0.0%) | 6 (4.2%) |
| 40 to 44 Years | 60 (33.9%) | 12 (8.4%) |
| 45 to 49 Years | 3 (1.7%) | 0 (0.0%) |
| 50 to 54 Years | 0 (0.0%) | 4 (2.8%) |
| 55 to 59 Years | 24 (13.6%) | 0 (0.0%) |
| 60 to 64 Years | 5 (2.8%) | 12 (8.4%) |
| 65 to 69 Years | 16 (9.0%) | 19 (13.3%) |
| 70 to 74 Years | 20 (11.3%) | 22 (15.4%) |
| 75 to 79 Years | 0 (0.0%) | 0 (0.0%) |
| 80 to 84 Years | 0 (0.0%) | 0 (0.0%) |
| 85 Years and over | 0 (0.0%) | 0 (0.0%) |
| Total | 177 (100.0%) | 143 (100.0%) |
Families and Households in Smithville
Median Family Size in Smithville
The median family size in Smithville is 2.57 persons per family, with single female/mother families (10 | 9.9%) accounting for the largest median family size of 4 persons per family. On the other hand, single male/father families (4 | 4.0%) represent the smallest median family size with 1.75 persons per family.
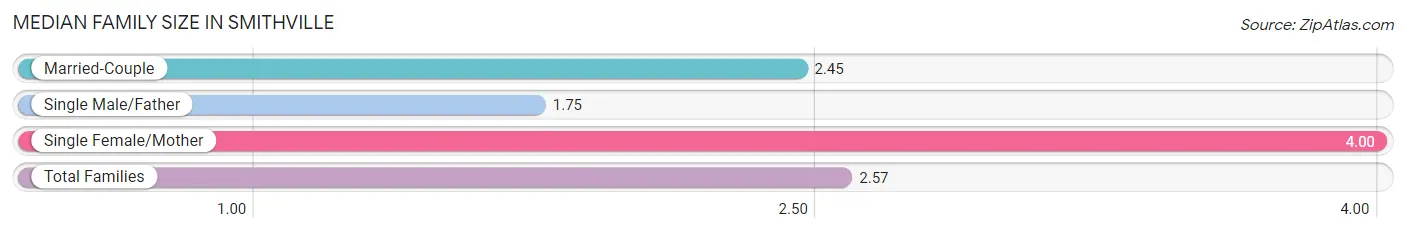
| Family Type | # Families | Family Size |
| Married-Couple | 87 (86.1%) | 2.45 |
| Single Male/Father | 4 (4.0%) | 1.75 |
| Single Female/Mother | 10 (9.9%) | 4.00 |
| Total Families | 101 (100.0%) | 2.57 |
Median Household Size in Smithville
The median household size in Smithville is 2.05 persons per household, with single female/mother households (10 | 6.4%) accounting for the largest median household size of 4 persons per household. non-family households (55 | 35.3%) represent the smallest median household size with 1.09 persons per household.
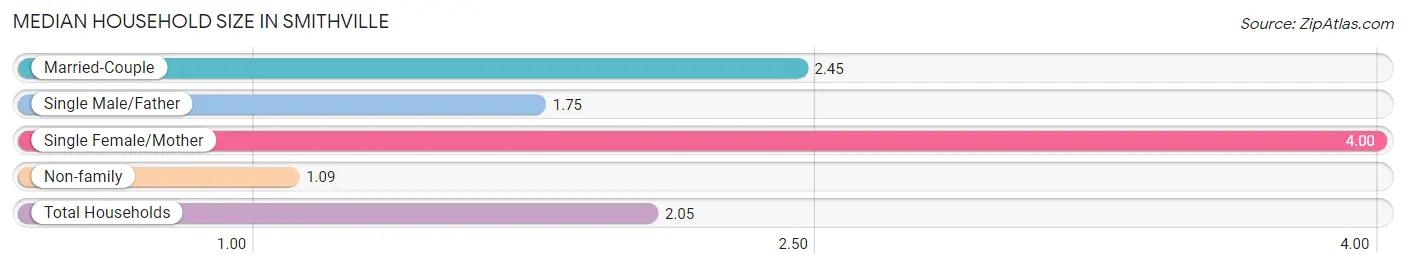
| Household Type | # Households | Household Size |
| Married-Couple | 87 (55.8%) | 2.45 |
| Single Male/Father | 4 (2.6%) | 1.75 |
| Single Female/Mother | 10 (6.4%) | 4.00 |
| Non-family | 55 (35.3%) | 1.09 |
| Total Households | 156 (100.0%) | 2.05 |
Household Size by Marriage Status in Smithville
Out of a total of 156 households in Smithville, 101 (64.7%) are family households, while 55 (35.3%) are nonfamily households. The most numerous type of family households are 2-person households, comprising 48, and the most common type of nonfamily households are 1-person households, comprising 51.
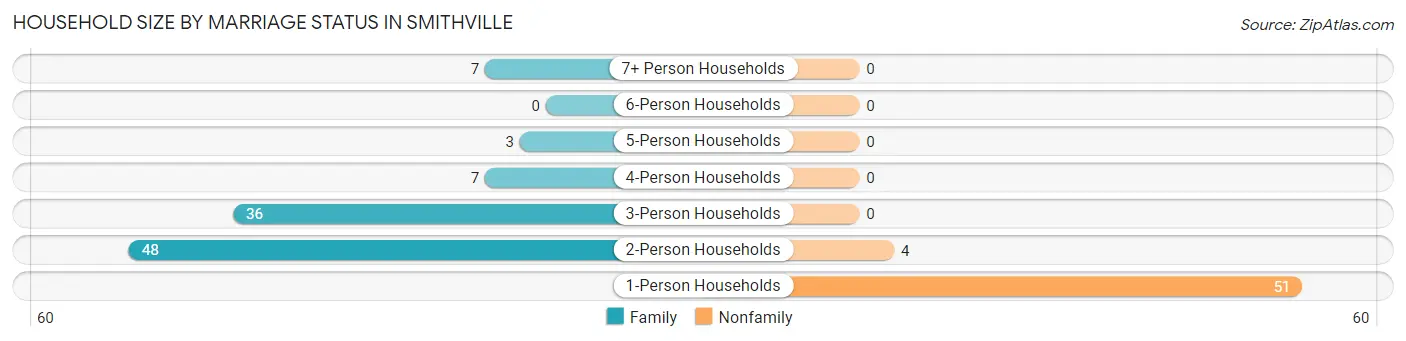
| Household Size | Family Households | Nonfamily Households |
| 1-Person Households | - | 51 (32.7%) |
| 2-Person Households | 48 (30.8%) | 4 (2.6%) |
| 3-Person Households | 36 (23.1%) | 0 (0.0%) |
| 4-Person Households | 7 (4.5%) | 0 (0.0%) |
| 5-Person Households | 3 (1.9%) | 0 (0.0%) |
| 6-Person Households | 0 (0.0%) | 0 (0.0%) |
| 7+ Person Households | 7 (4.5%) | 0 (0.0%) |
| Total | 101 (64.7%) | 55 (35.3%) |
Female Fertility in Smithville
Fertility by Age in Smithville
| Age Bracket | Women with Births | Births / 1,000 Women |
| 15 to 19 years | 0 (0.0%) | 0.0 |
| 20 to 34 years | 0 (0.0%) | 0.0 |
| 35 to 50 years | 0 (0.0%) | 0.0 |
| Total | 0 (0.0%) | 0.0 |
Fertility by Age by Marriage Status in Smithville
| Age Bracket | Married | Unmarried |
| 15 to 19 years | 0 (0.0%) | 0 (0.0%) |
| 20 to 34 years | 0 (0.0%) | 0 (0.0%) |
| 35 to 50 years | 0 (0.0%) | 0 (0.0%) |
| Total | 0 (0.0%) | 0 (0.0%) |
Fertility by Education in Smithville
| Educational Attainment | Women with Births | Births / 1,000 Women |
| Less than High School | 0 (0.0%) | 0.0 |
| High School Diploma | 0 (0.0%) | 0.0 |
| College or Associate's Degree | 0 (0.0%) | 0.0 |
| Bachelor's Degree | 0 (0.0%) | 0.0 |
| Graduate Degree | 0 (0.0%) | 0.0 |
| Total | 0 (0.0%) | 0.0 |
Fertility by Education by Marriage Status in Smithville
| Educational Attainment | Married | Unmarried |
| Less than High School | 0 (0.0%) | 0 (0.0%) |
| High School Diploma | 0 (0.0%) | 0 (0.0%) |
| College or Associate's Degree | 0 (0.0%) | 0 (0.0%) |
| Bachelor's Degree | 0 (0.0%) | 0 (0.0%) |
| Graduate Degree | 0 (0.0%) | 0 (0.0%) |
| Total | 0 (0.0%) | 0 (0.0%) |
Employment Characteristics in Smithville
Employment by Class of Employer in Smithville
Among the 140 employed individuals in Smithville, private company employees (89 | 63.6%), local government employees (30 | 21.4%), and state government employees (9 | 6.4%) make up the most common classes of employment.
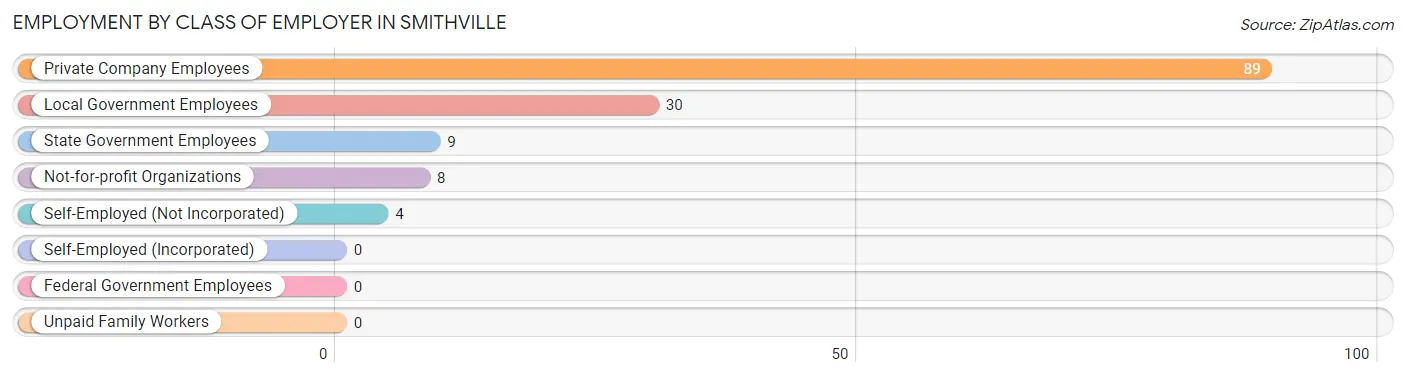
| Employer Class | # Employees | % Employees |
| Private Company Employees | 89 | 63.6% |
| Self-Employed (Incorporated) | 0 | 0.0% |
| Self-Employed (Not Incorporated) | 4 | 2.9% |
| Not-for-profit Organizations | 8 | 5.7% |
| Local Government Employees | 30 | 21.4% |
| State Government Employees | 9 | 6.4% |
| Federal Government Employees | 0 | 0.0% |
| Unpaid Family Workers | 0 | 0.0% |
| Total | 140 | 100.0% |
Employment Status by Age in Smithville
According to the labor force statistics for Smithville, out of the total population over 16 years of age (290), 49.7% or 144 individuals are in the labor force, with 2.8% or 4 of them unemployed. The age group with the highest labor force participation rate is 30 to 34 years, with 100.0% or 26 individuals in the labor force. Within the labor force, the 30 to 34 years age range has the highest percentage of unemployed individuals, with 15.4% or 4 of them being unemployed.
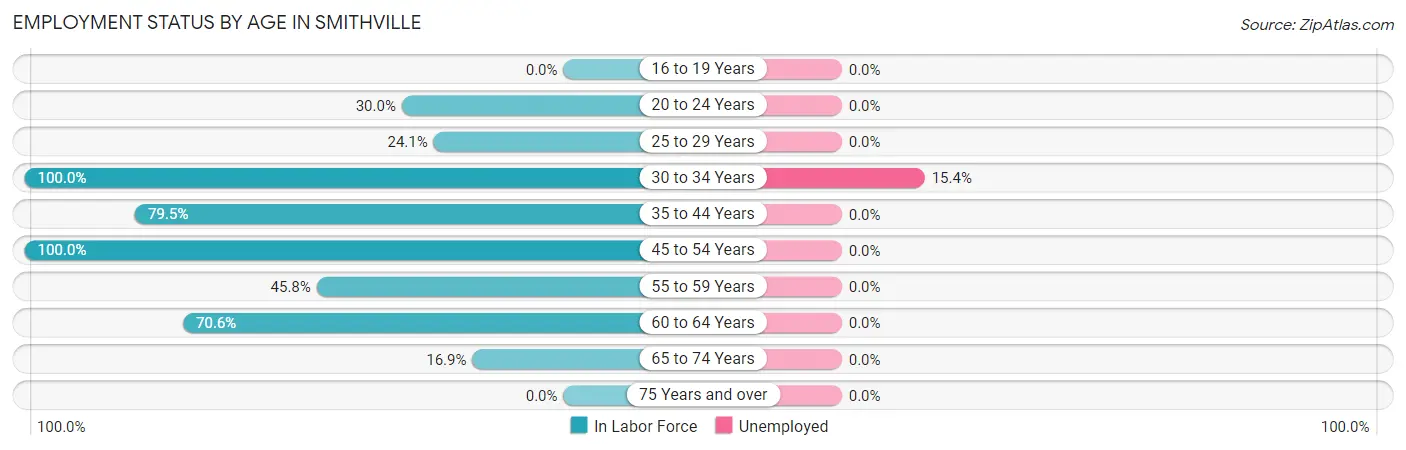
| Age Bracket | In Labor Force | Unemployed |
| 16 to 19 Years | 0 (0.0%) | 0 (0.0%) |
| 20 to 24 Years | 6 (30.0%) | 0 (0.0%) |
| 25 to 29 Years | 7 (24.1%) | 0 (0.0%) |
| 30 to 34 Years | 26 (100.0%) | 4 (15.4%) |
| 35 to 44 Years | 62 (79.5%) | 0 (0.0%) |
| 45 to 54 Years | 7 (100.0%) | 0 (0.0%) |
| 55 to 59 Years | 11 (45.8%) | 0 (0.0%) |
| 60 to 64 Years | 12 (70.6%) | 0 (0.0%) |
| 65 to 74 Years | 13 (16.9%) | 0 (0.0%) |
| 75 Years and over | 0 (0.0%) | 0 (0.0%) |
| Total | 144 (49.7%) | 4 (2.8%) |
Employment Status by Educational Attainment in Smithville
According to labor force statistics for Smithville, 69.1% of individuals (125) out of the total population between 25 and 64 years of age (181) are in the labor force, with 3.2% or 4 of them being unemployed. The group with the highest labor force participation rate are those with the educational attainment of bachelor's degree or higher, with 100.0% or 28 individuals in the labor force. Within the labor force, individuals with college / associate degree education have the highest percentage of unemployment, with 36.4% or 4 of them being unemployed.
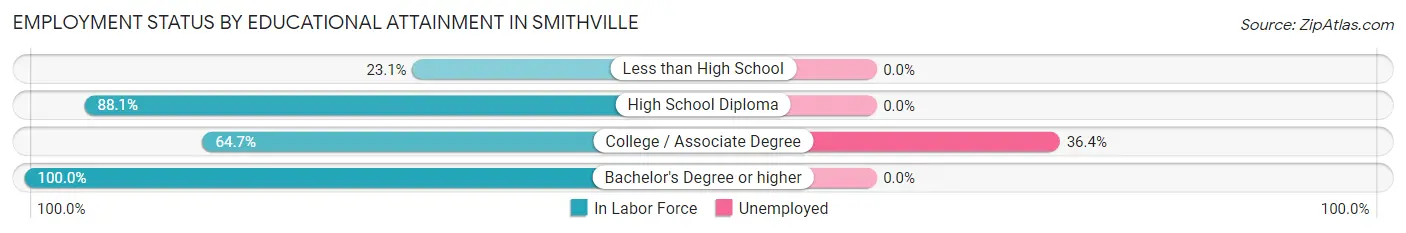
| Educational Attainment | In Labor Force | Unemployed |
| Less than High School | 12 (23.1%) | 0 (0.0%) |
| High School Diploma | 74 (88.1%) | 0 (0.0%) |
| College / Associate Degree | 11 (64.7%) | 6 (36.4%) |
| Bachelor's Degree or higher | 28 (100.0%) | 0 (0.0%) |
| Total | 125 (69.1%) | 6 (3.2%) |
Employment Occupations by Sex in Smithville
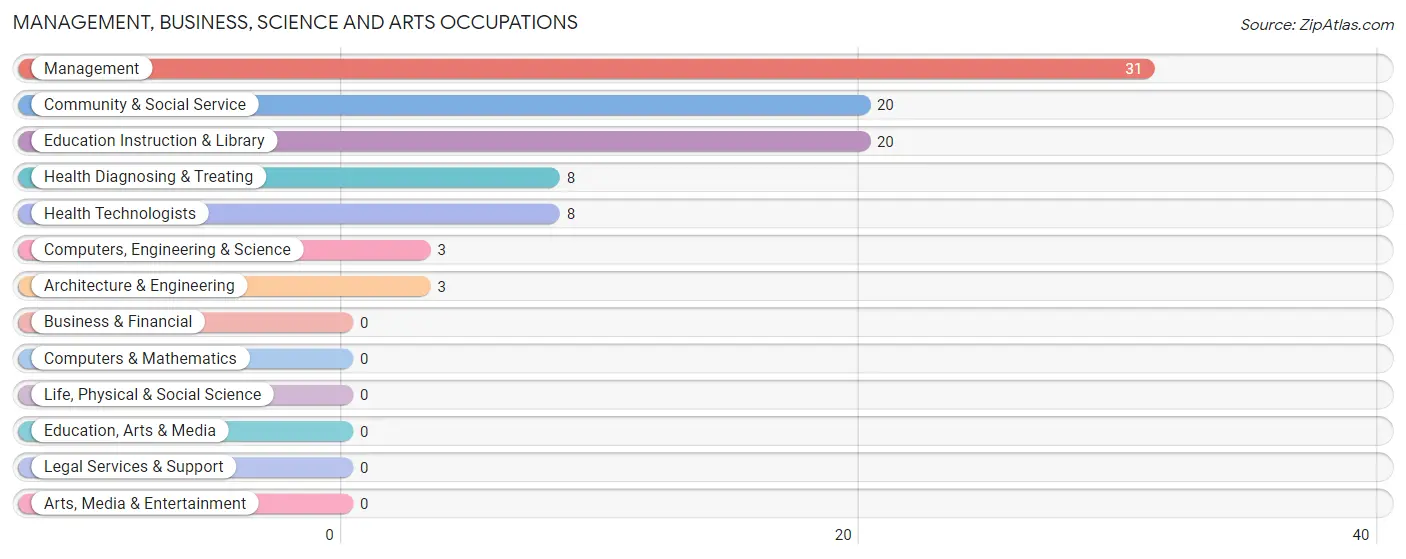
Management, Business, Science and Arts Occupations
The most common Management, Business, Science and Arts occupations in Smithville are Management (31 | 22.1%), Community & Social Service (20 | 14.3%), Education Instruction & Library (20 | 14.3%), Health Diagnosing & Treating (8 | 5.7%), and Health Technologists (8 | 5.7%).
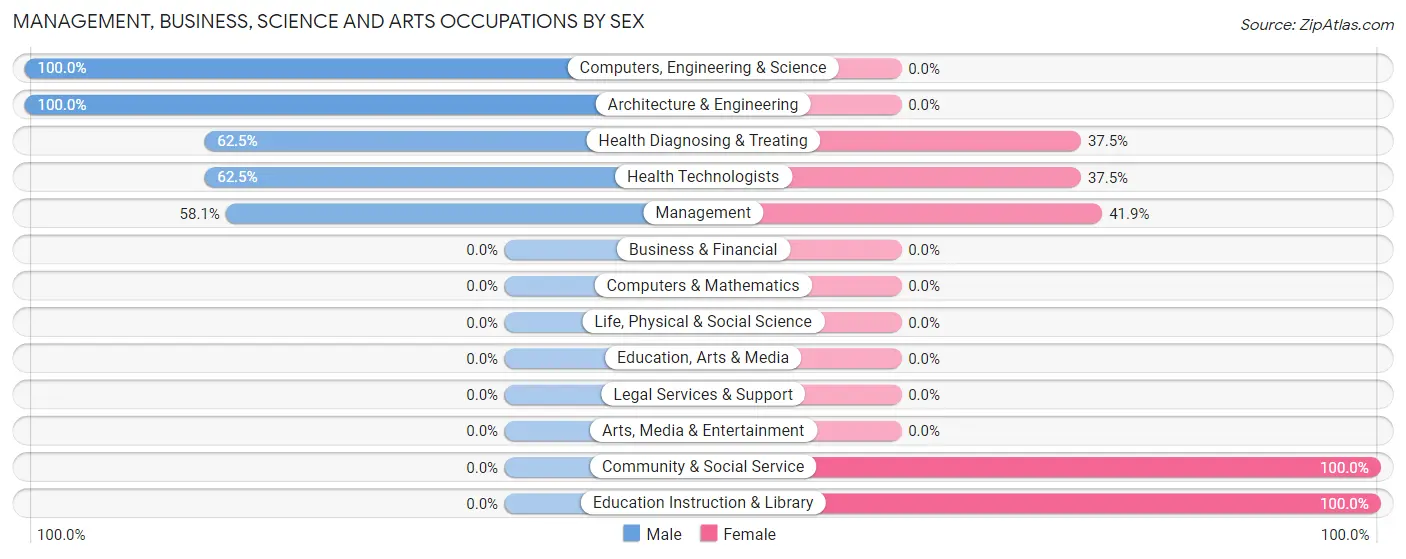
Management, Business, Science and Arts Occupations by Sex
Within the Management, Business, Science and Arts occupations in Smithville, the most male-oriented occupations are Computers, Engineering & Science (100.0%), Architecture & Engineering (100.0%), and Health Diagnosing & Treating (62.5%), while the most female-oriented occupations are Community & Social Service (100.0%), Education Instruction & Library (100.0%), and Management (41.9%).
| Occupation | Male | Female |
| Management | 18 (58.1%) | 13 (41.9%) |
| Business & Financial | 0 (0.0%) | 0 (0.0%) |
| Computers, Engineering & Science | 3 (100.0%) | 0 (0.0%) |
| Computers & Mathematics | 0 (0.0%) | 0 (0.0%) |
| Architecture & Engineering | 3 (100.0%) | 0 (0.0%) |
| Life, Physical & Social Science | 0 (0.0%) | 0 (0.0%) |
| Community & Social Service | 0 (0.0%) | 20 (100.0%) |
| Education, Arts & Media | 0 (0.0%) | 0 (0.0%) |
| Legal Services & Support | 0 (0.0%) | 0 (0.0%) |
| Education Instruction & Library | 0 (0.0%) | 20 (100.0%) |
| Arts, Media & Entertainment | 0 (0.0%) | 0 (0.0%) |
| Health Diagnosing & Treating | 5 (62.5%) | 3 (37.5%) |
| Health Technologists | 5 (62.5%) | 3 (37.5%) |
| Total (Category) | 26 (41.9%) | 36 (58.1%) |
| Total (Overall) | 79 (56.4%) | 61 (43.6%) |
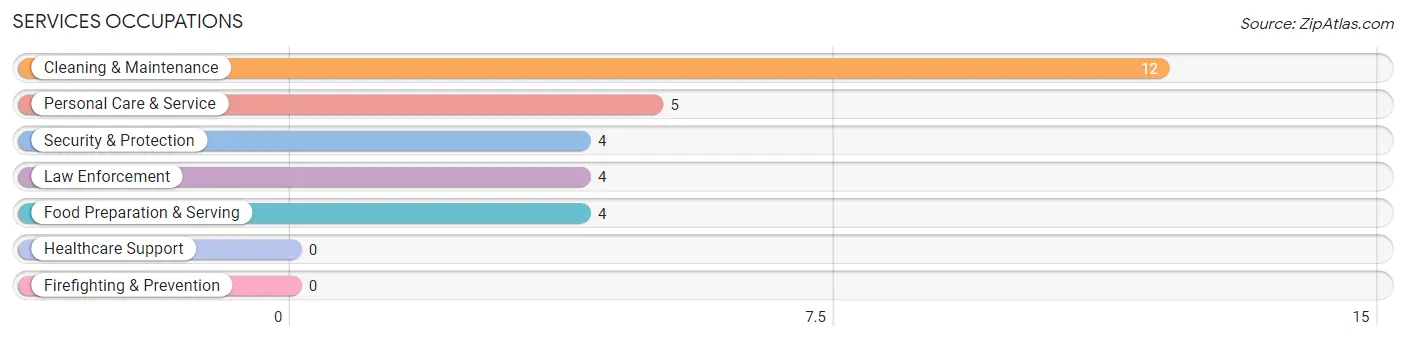
Services Occupations
The most common Services occupations in Smithville are Cleaning & Maintenance (12 | 8.6%), Personal Care & Service (5 | 3.6%), Security & Protection (4 | 2.9%), Law Enforcement (4 | 2.9%), and Food Preparation & Serving (4 | 2.9%).
Services Occupations by Sex
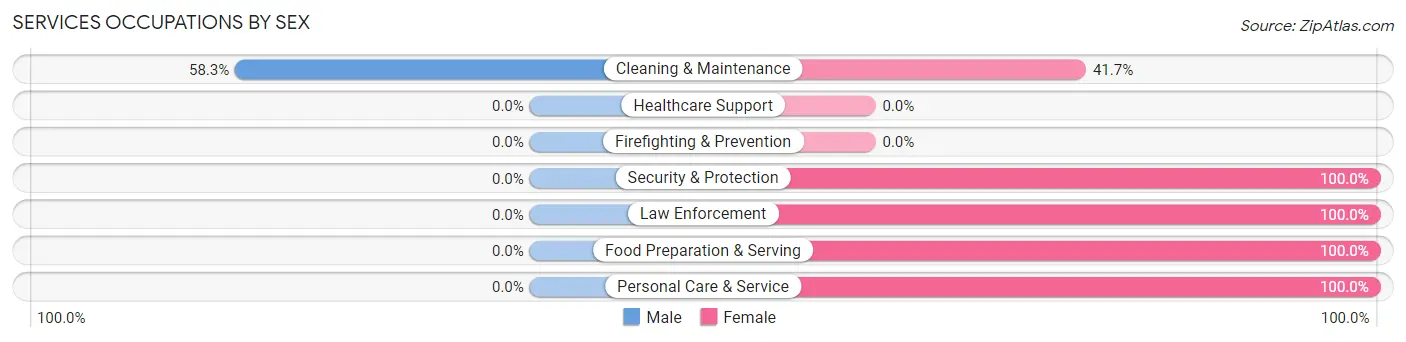
| Occupation | Male | Female |
| Healthcare Support | 0 (0.0%) | 0 (0.0%) |
| Security & Protection | 0 (0.0%) | 4 (100.0%) |
| Firefighting & Prevention | 0 (0.0%) | 0 (0.0%) |
| Law Enforcement | 0 (0.0%) | 4 (100.0%) |
| Food Preparation & Serving | 0 (0.0%) | 4 (100.0%) |
| Cleaning & Maintenance | 7 (58.3%) | 5 (41.7%) |
| Personal Care & Service | 0 (0.0%) | 5 (100.0%) |
| Total (Category) | 7 (28.0%) | 18 (72.0%) |
| Total (Overall) | 79 (56.4%) | 61 (43.6%) |
Sales and Office Occupations
The most common Sales and Office occupations in Smithville are , and Sales & Related (7 | 5.0%).
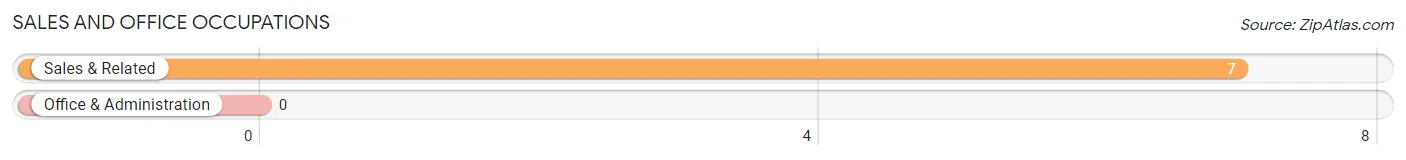
Sales and Office Occupations by Sex
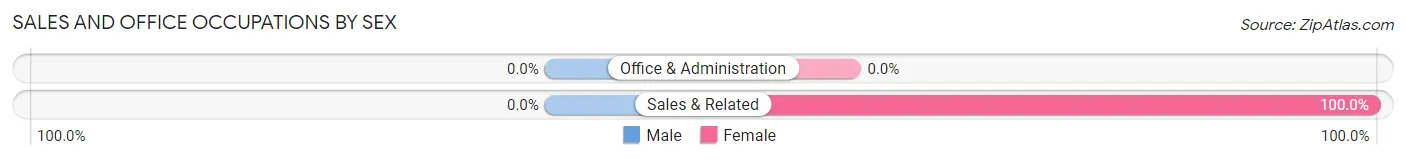
| Occupation | Male | Female |
| Sales & Related | 0 (0.0%) | 7 (100.0%) |
| Office & Administration | 0 (0.0%) | 0 (0.0%) |
| Total (Category) | 0 (0.0%) | 7 (100.0%) |
| Total (Overall) | 79 (56.4%) | 61 (43.6%) |
Natural Resources, Construction and Maintenance Occupations
The most common Natural Resources, Construction and Maintenance occupations in Smithville are Construction & Extraction (29 | 20.7%), and Installation, Maintenance & Repair (4 | 2.9%).
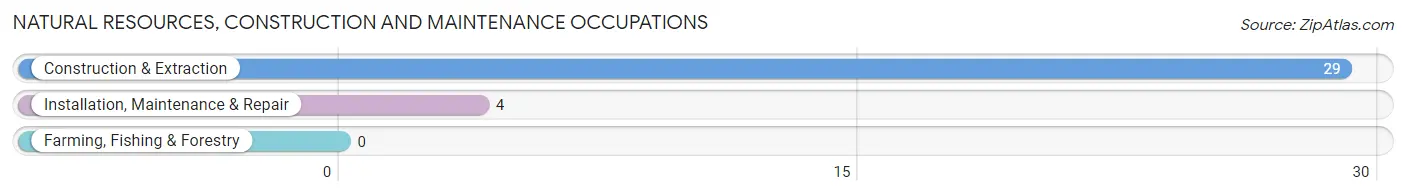
Natural Resources, Construction and Maintenance Occupations by Sex
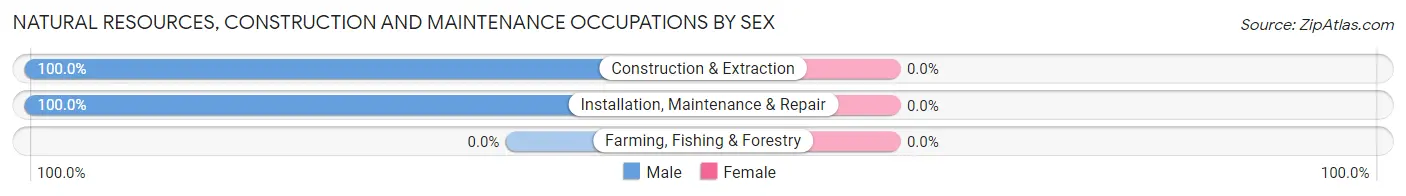
| Occupation | Male | Female |
| Farming, Fishing & Forestry | 0 (0.0%) | 0 (0.0%) |
| Construction & Extraction | 29 (100.0%) | 0 (0.0%) |
| Installation, Maintenance & Repair | 4 (100.0%) | 0 (0.0%) |
| Total (Category) | 33 (100.0%) | 0 (0.0%) |
| Total (Overall) | 79 (56.4%) | 61 (43.6%) |
Production, Transportation and Moving Occupations
The most common Production, Transportation and Moving occupations in Smithville are , and Transportation (13 | 9.3%).
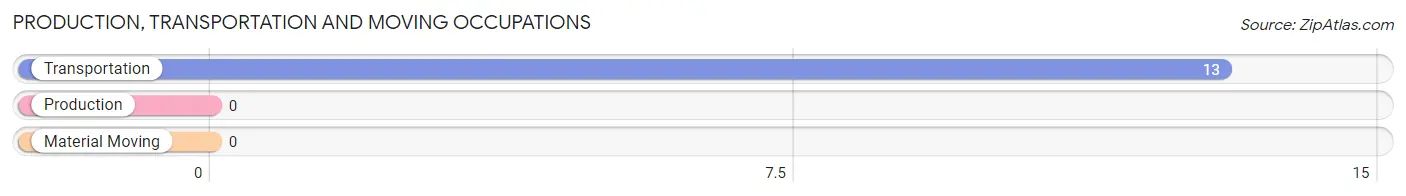
Production, Transportation and Moving Occupations by Sex
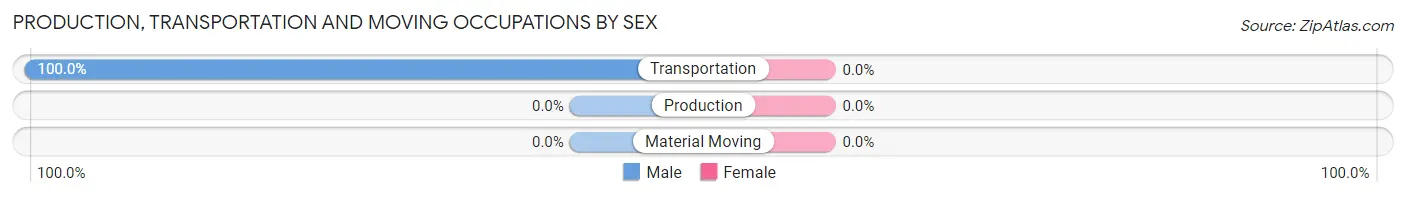
| Occupation | Male | Female |
| Production | 0 (0.0%) | 0 (0.0%) |
| Transportation | 13 (100.0%) | 0 (0.0%) |
| Material Moving | 0 (0.0%) | 0 (0.0%) |
| Total (Category) | 13 (100.0%) | 0 (0.0%) |
| Total (Overall) | 79 (56.4%) | 61 (43.6%) |
Employment Industries by Sex in Smithville
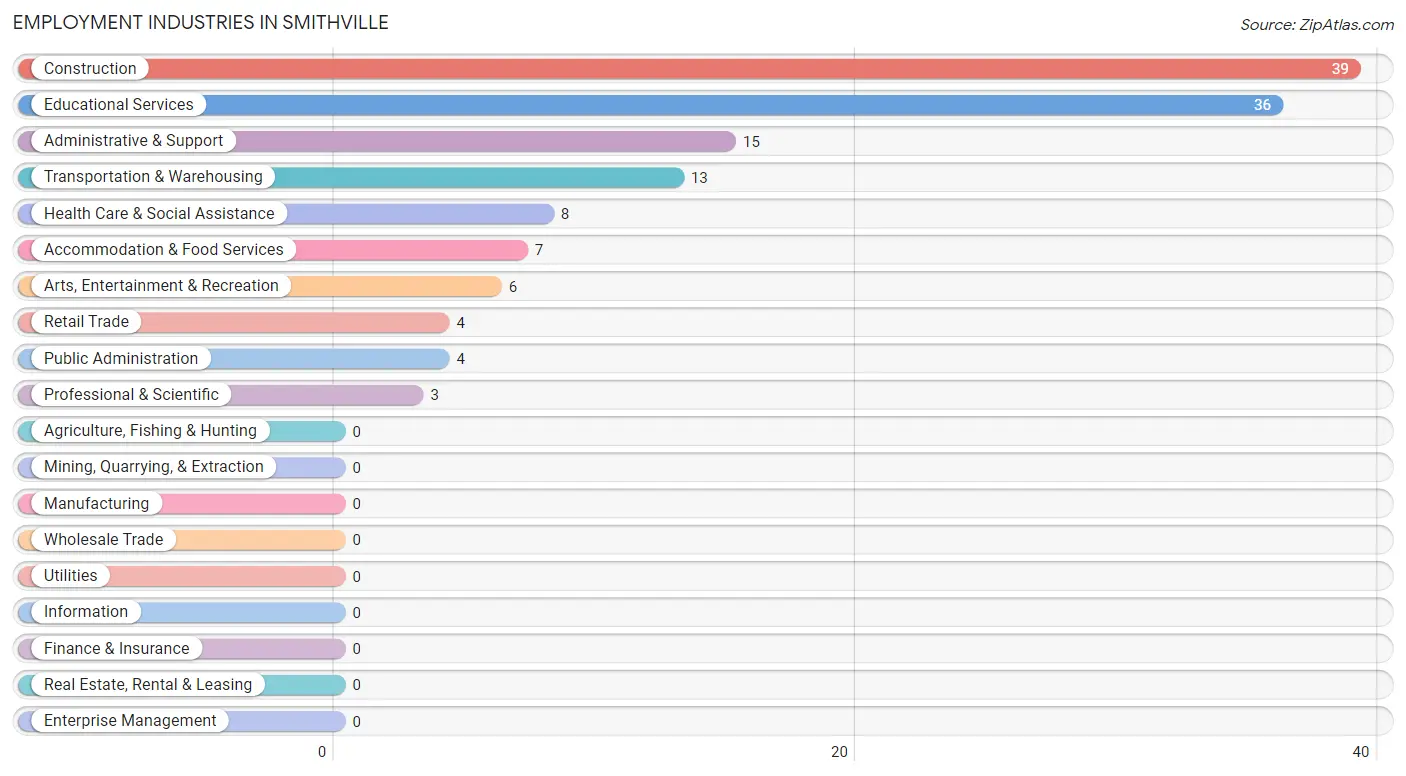
Employment Industries in Smithville
The major employment industries in Smithville include Construction (39 | 27.9%), Educational Services (36 | 25.7%), Administrative & Support (15 | 10.7%), Transportation & Warehousing (13 | 9.3%), and Health Care & Social Assistance (8 | 5.7%).
Employment Industries by Sex in Smithville
The Smithville industries that see more men than women are Construction (100.0%), Retail Trade (100.0%), and Transportation & Warehousing (100.0%), whereas the industries that tend to have a higher number of women are Educational Services (100.0%), Arts, Entertainment & Recreation (100.0%), and Accommodation & Food Services (100.0%).
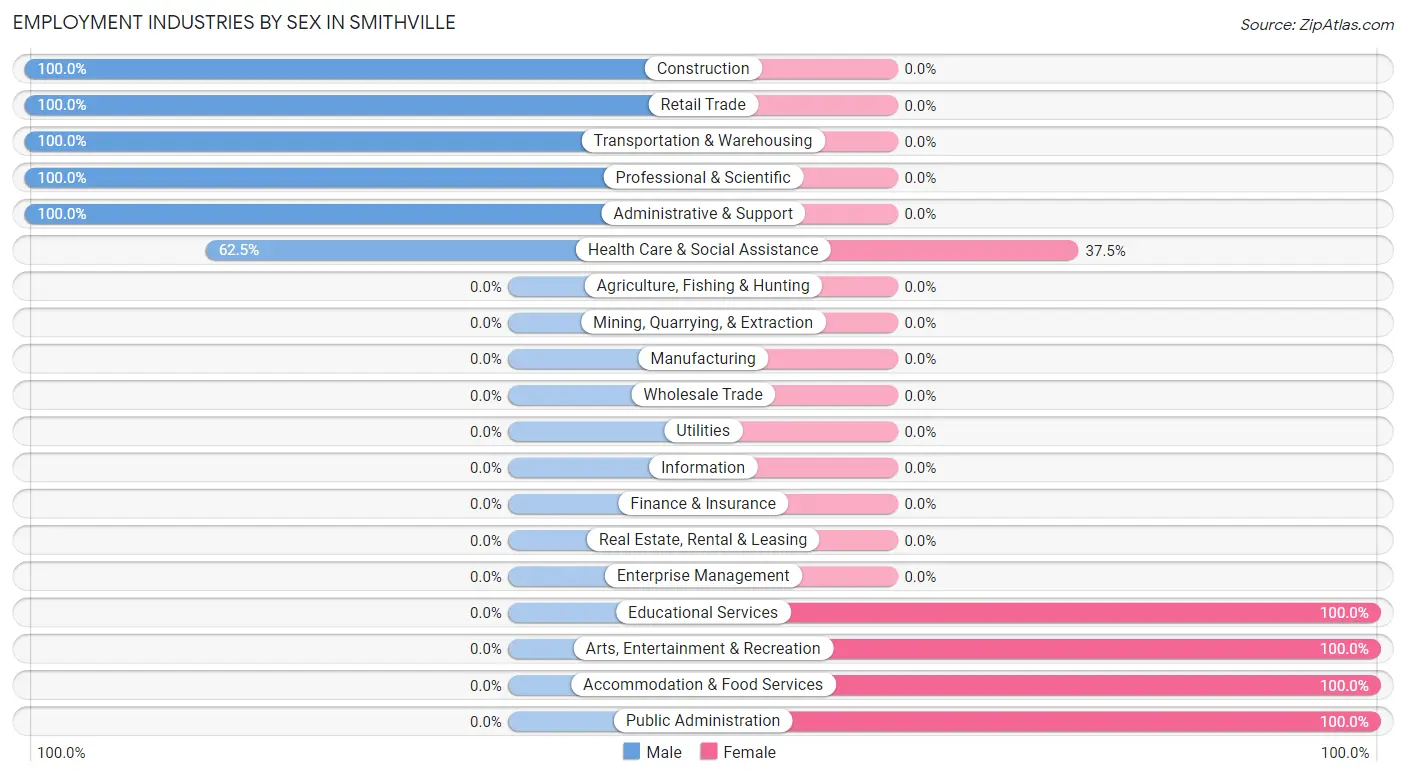
| Industry | Male | Female |
| Agriculture, Fishing & Hunting | 0 (0.0%) | 0 (0.0%) |
| Mining, Quarrying, & Extraction | 0 (0.0%) | 0 (0.0%) |
| Construction | 39 (100.0%) | 0 (0.0%) |
| Manufacturing | 0 (0.0%) | 0 (0.0%) |
| Wholesale Trade | 0 (0.0%) | 0 (0.0%) |
| Retail Trade | 4 (100.0%) | 0 (0.0%) |
| Transportation & Warehousing | 13 (100.0%) | 0 (0.0%) |
| Utilities | 0 (0.0%) | 0 (0.0%) |
| Information | 0 (0.0%) | 0 (0.0%) |
| Finance & Insurance | 0 (0.0%) | 0 (0.0%) |
| Real Estate, Rental & Leasing | 0 (0.0%) | 0 (0.0%) |
| Professional & Scientific | 3 (100.0%) | 0 (0.0%) |
| Enterprise Management | 0 (0.0%) | 0 (0.0%) |
| Administrative & Support | 15 (100.0%) | 0 (0.0%) |
| Educational Services | 0 (0.0%) | 36 (100.0%) |
| Health Care & Social Assistance | 5 (62.5%) | 3 (37.5%) |
| Arts, Entertainment & Recreation | 0 (0.0%) | 6 (100.0%) |
| Accommodation & Food Services | 0 (0.0%) | 7 (100.0%) |
| Public Administration | 0 (0.0%) | 4 (100.0%) |
| Total | 79 (56.4%) | 61 (43.6%) |
Education in Smithville
School Enrollment in Smithville
The most common levels of schooling among the 42 students in Smithville are high school (13 | 30.9%), elementary school (11 | 26.2%), and college / undergraduate (10 | 23.8%).
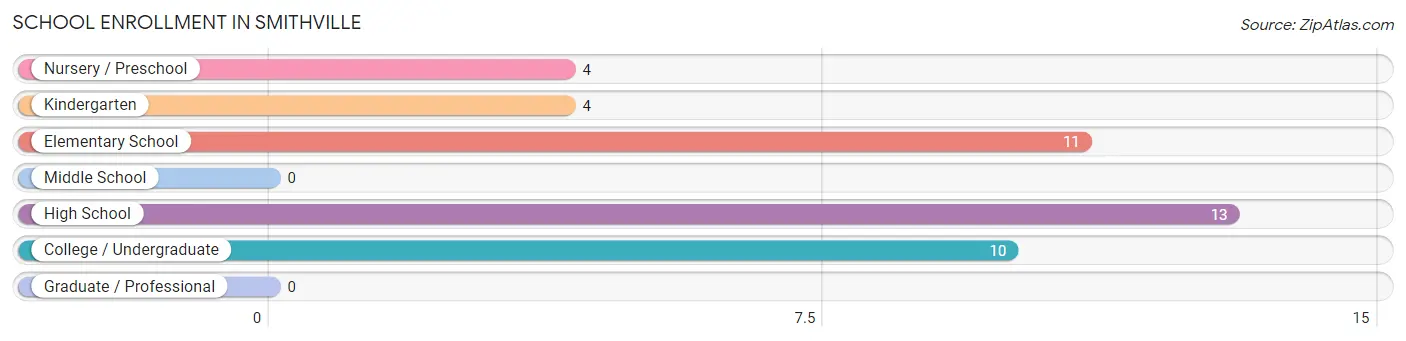
| School Level | # Students | % Students |
| Nursery / Preschool | 4 | 9.5% |
| Kindergarten | 4 | 9.5% |
| Elementary School | 11 | 26.2% |
| Middle School | 0 | 0.0% |
| High School | 13 | 30.9% |
| College / Undergraduate | 10 | 23.8% |
| Graduate / Professional | 0 | 0.0% |
| Total | 42 | 100.0% |
School Enrollment by Age by Funding Source in Smithville
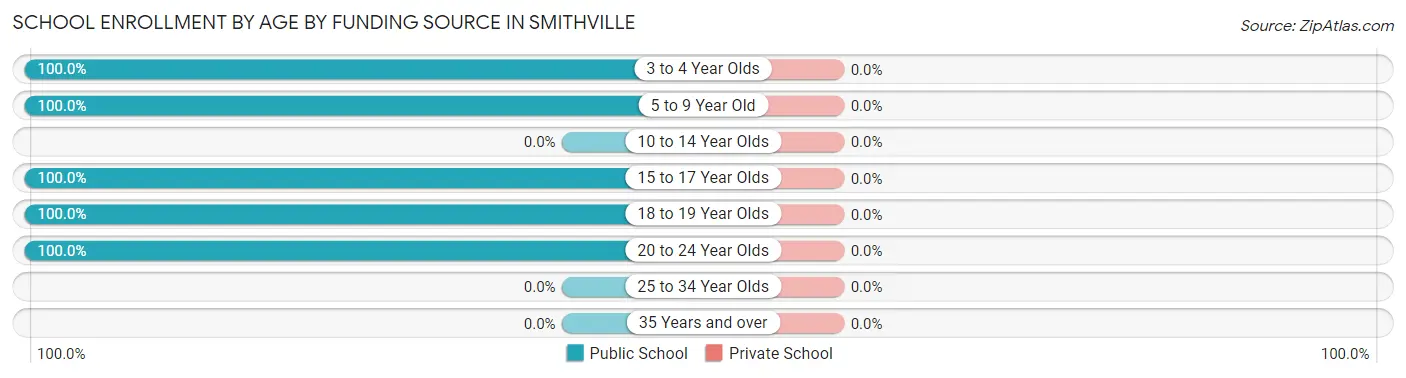
| Age Bracket | Public School | Private School |
| 3 to 4 Year Olds | 4 (100.0%) | 0 (0.0%) |
| 5 to 9 Year Old | 15 (100.0%) | 0 (0.0%) |
| 10 to 14 Year Olds | 0 (0.0%) | 0 (0.0%) |
| 15 to 17 Year Olds | 8 (100.0%) | 0 (0.0%) |
| 18 to 19 Year Olds | 4 (100.0%) | 0 (0.0%) |
| 20 to 24 Year Olds | 11 (100.0%) | 0 (0.0%) |
| 25 to 34 Year Olds | 0 (0.0%) | 0 (0.0%) |
| 35 Years and over | 0 (0.0%) | 0 (0.0%) |
| Total | 42 (100.0%) | 0 (0.0%) |
Educational Attainment by Field of Study in Smithville
Education (18 | 64.3%), science & technology (8 | 28.6%), and liberal arts & history (2 | 7.1%) are the most common fields of study among 28 individuals in Smithville who have obtained a bachelor's degree or higher.
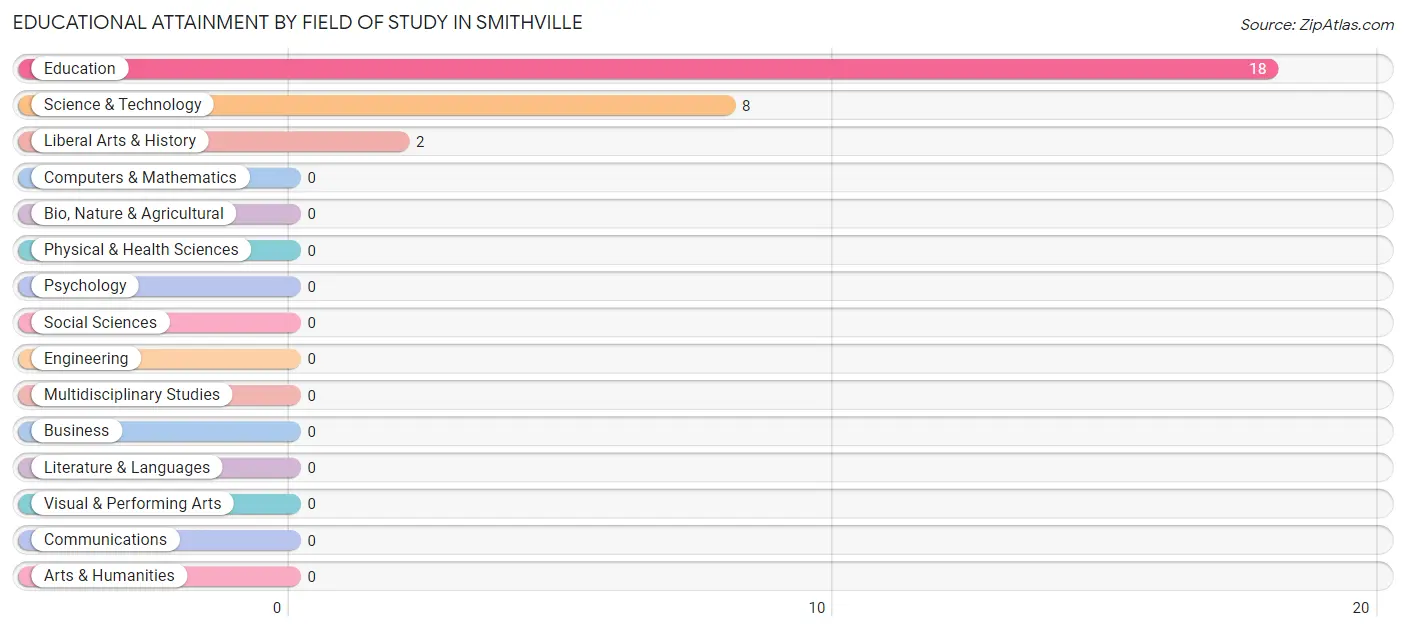
| Field of Study | # Graduates | % Graduates |
| Computers & Mathematics | 0 | 0.0% |
| Bio, Nature & Agricultural | 0 | 0.0% |
| Physical & Health Sciences | 0 | 0.0% |
| Psychology | 0 | 0.0% |
| Social Sciences | 0 | 0.0% |
| Engineering | 0 | 0.0% |
| Multidisciplinary Studies | 0 | 0.0% |
| Science & Technology | 8 | 28.6% |
| Business | 0 | 0.0% |
| Education | 18 | 64.3% |
| Literature & Languages | 0 | 0.0% |
| Liberal Arts & History | 2 | 7.1% |
| Visual & Performing Arts | 0 | 0.0% |
| Communications | 0 | 0.0% |
| Arts & Humanities | 0 | 0.0% |
| Total | 28 | 100.0% |
Transportation & Commute in Smithville
Vehicle Availability by Sex in Smithville
The most prevalent vehicle ownership categories in Smithville are males with 1 vehicle (27, accounting for 34.2%) and females with 1 vehicle (16, making up 44.3%).
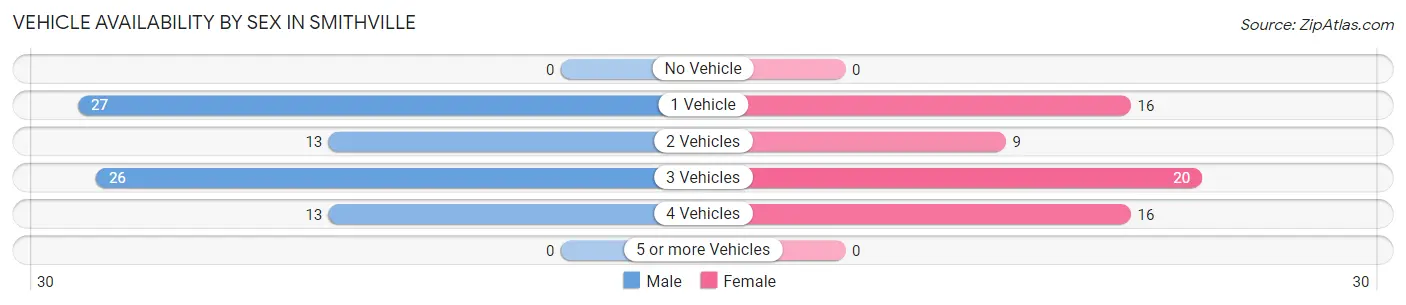
| Vehicles Available | Male | Female |
| No Vehicle | 0 (0.0%) | 0 (0.0%) |
| 1 Vehicle | 27 (34.2%) | 16 (26.2%) |
| 2 Vehicles | 13 (16.5%) | 9 (14.7%) |
| 3 Vehicles | 26 (32.9%) | 20 (32.8%) |
| 4 Vehicles | 13 (16.5%) | 16 (26.2%) |
| 5 or more Vehicles | 0 (0.0%) | 0 (0.0%) |
| Total | 79 (100.0%) | 61 (100.0%) |
Commute Time in Smithville
The most frequently occuring commute durations in Smithville are 45 to 59 minutes (48 commuters, 34.3%), 15 to 19 minutes (18 commuters, 12.9%), and 90 or more minutes (17 commuters, 12.1%).
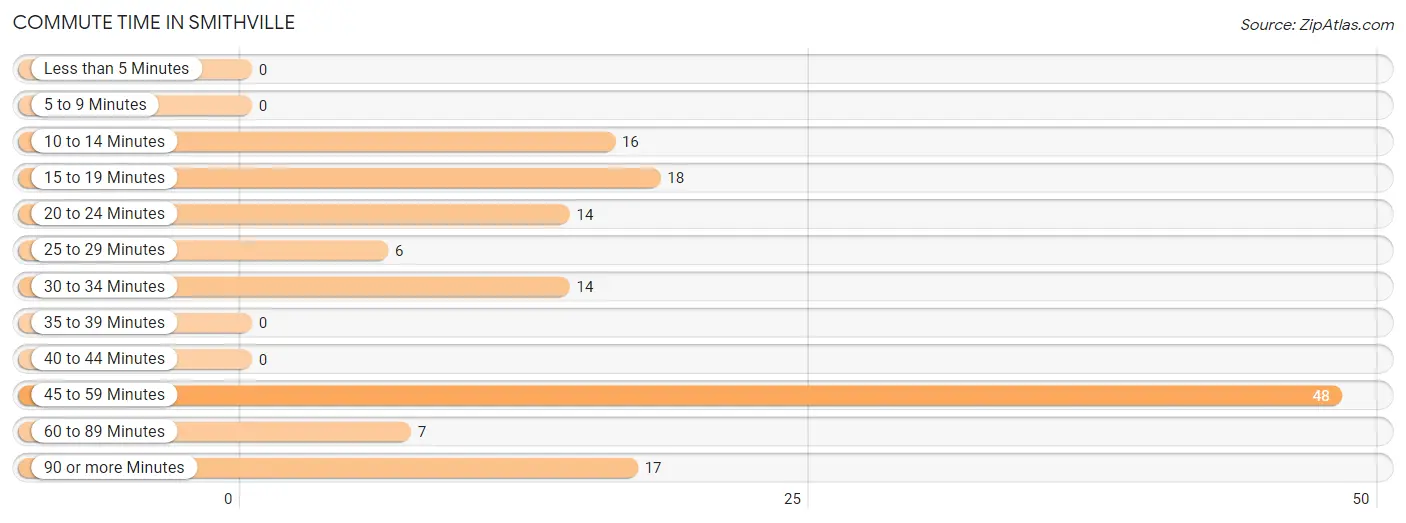
| Commute Time | # Commuters | % Commuters |
| Less than 5 Minutes | 0 | 0.0% |
| 5 to 9 Minutes | 0 | 0.0% |
| 10 to 14 Minutes | 16 | 11.4% |
| 15 to 19 Minutes | 18 | 12.9% |
| 20 to 24 Minutes | 14 | 10.0% |
| 25 to 29 Minutes | 6 | 4.3% |
| 30 to 34 Minutes | 14 | 10.0% |
| 35 to 39 Minutes | 0 | 0.0% |
| 40 to 44 Minutes | 0 | 0.0% |
| 45 to 59 Minutes | 48 | 34.3% |
| 60 to 89 Minutes | 7 | 5.0% |
| 90 or more Minutes | 17 | 12.1% |
Commute Time by Sex in Smithville
The most common commute times in Smithville are 45 to 59 minutes (30 commuters, 38.0%) for males and 15 to 19 minutes (18 commuters, 29.5%) for females.
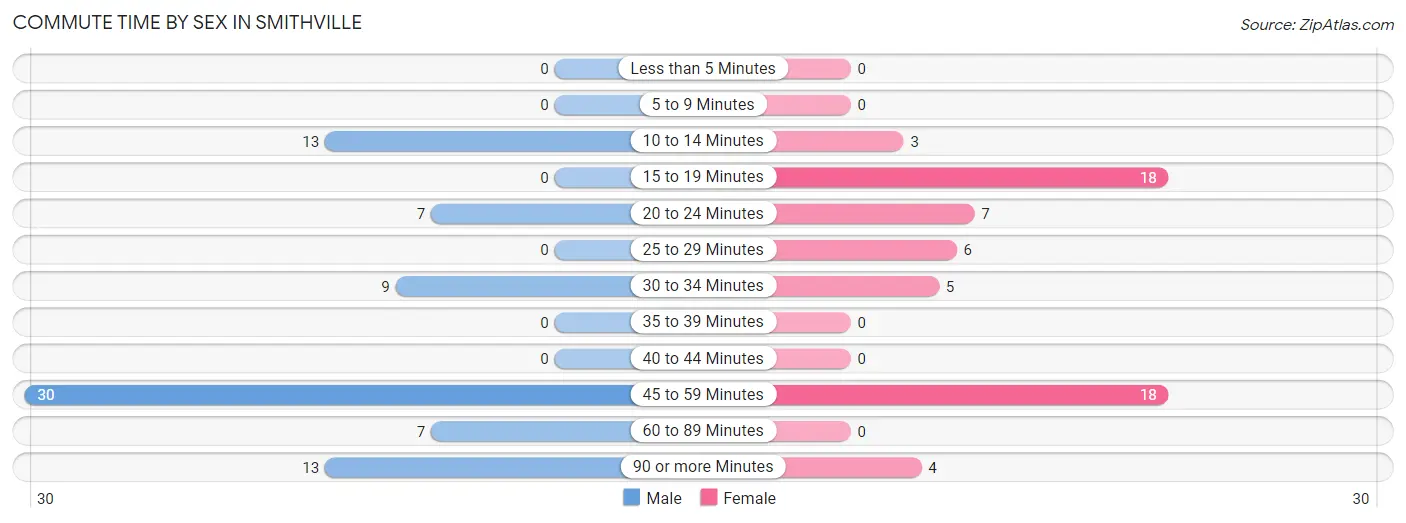
| Commute Time | Male | Female |
| Less than 5 Minutes | 0 (0.0%) | 0 (0.0%) |
| 5 to 9 Minutes | 0 (0.0%) | 0 (0.0%) |
| 10 to 14 Minutes | 13 (16.5%) | 3 (4.9%) |
| 15 to 19 Minutes | 0 (0.0%) | 18 (29.5%) |
| 20 to 24 Minutes | 7 (8.9%) | 7 (11.5%) |
| 25 to 29 Minutes | 0 (0.0%) | 6 (9.8%) |
| 30 to 34 Minutes | 9 (11.4%) | 5 (8.2%) |
| 35 to 39 Minutes | 0 (0.0%) | 0 (0.0%) |
| 40 to 44 Minutes | 0 (0.0%) | 0 (0.0%) |
| 45 to 59 Minutes | 30 (38.0%) | 18 (29.5%) |
| 60 to 89 Minutes | 7 (8.9%) | 0 (0.0%) |
| 90 or more Minutes | 13 (16.5%) | 4 (6.6%) |
Time of Departure to Work by Sex in Smithville
The most frequent times of departure to work in Smithville are 6:30 AM to 6:59 AM (21, 26.6%) for males and 6:00 AM to 6:29 AM (21, 34.4%) for females.
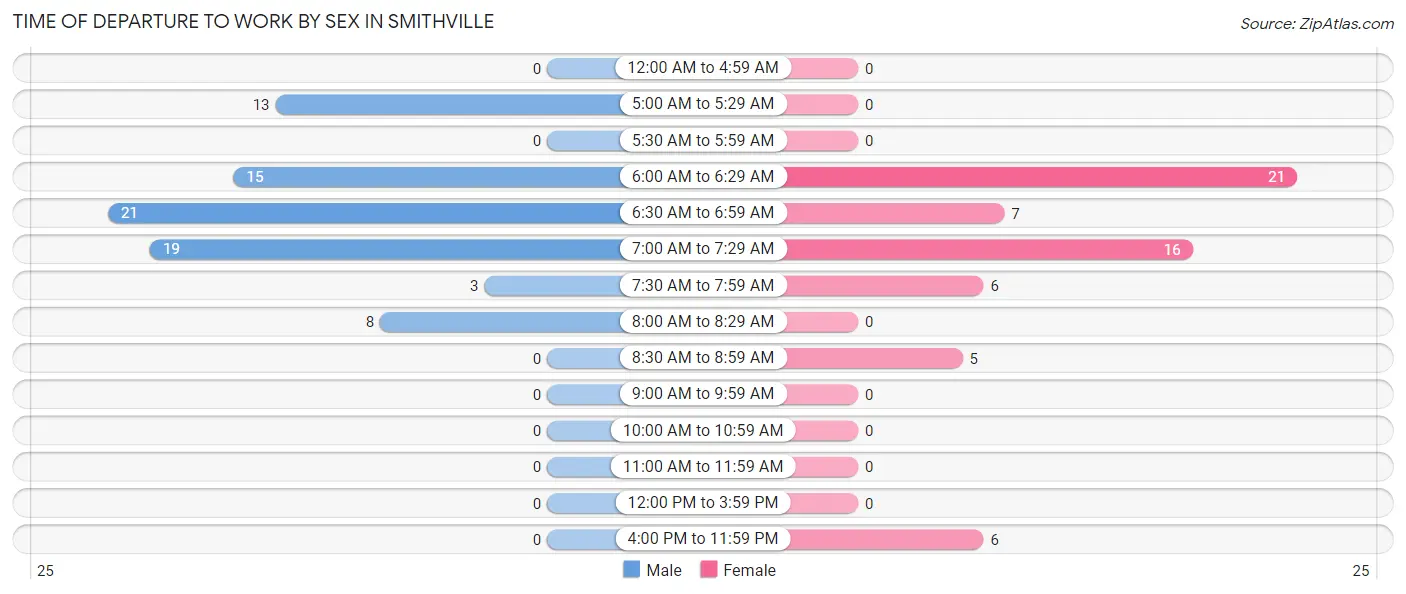
| Time of Departure | Male | Female |
| 12:00 AM to 4:59 AM | 0 (0.0%) | 0 (0.0%) |
| 5:00 AM to 5:29 AM | 13 (16.5%) | 0 (0.0%) |
| 5:30 AM to 5:59 AM | 0 (0.0%) | 0 (0.0%) |
| 6:00 AM to 6:29 AM | 15 (19.0%) | 21 (34.4%) |
| 6:30 AM to 6:59 AM | 21 (26.6%) | 7 (11.5%) |
| 7:00 AM to 7:29 AM | 19 (24.0%) | 16 (26.2%) |
| 7:30 AM to 7:59 AM | 3 (3.8%) | 6 (9.8%) |
| 8:00 AM to 8:29 AM | 8 (10.1%) | 0 (0.0%) |
| 8:30 AM to 8:59 AM | 0 (0.0%) | 5 (8.2%) |
| 9:00 AM to 9:59 AM | 0 (0.0%) | 0 (0.0%) |
| 10:00 AM to 10:59 AM | 0 (0.0%) | 0 (0.0%) |
| 11:00 AM to 11:59 AM | 0 (0.0%) | 0 (0.0%) |
| 12:00 PM to 3:59 PM | 0 (0.0%) | 0 (0.0%) |
| 4:00 PM to 11:59 PM | 0 (0.0%) | 6 (9.8%) |
| Total | 79 (100.0%) | 61 (100.0%) |
Housing Occupancy in Smithville
Occupancy by Ownership in Smithville
Of the total 156 dwellings in Smithville, owner-occupied units account for 97 (62.2%), while renter-occupied units make up 59 (37.8%).
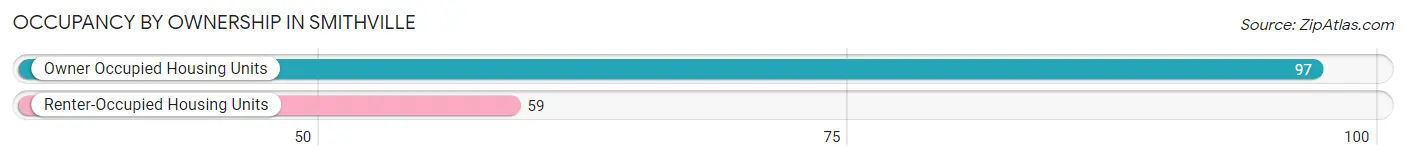
| Occupancy | # Housing Units | % Housing Units |
| Owner Occupied Housing Units | 97 | 62.2% |
| Renter-Occupied Housing Units | 59 | 37.8% |
| Total Occupied Housing Units | 156 | 100.0% |
Occupancy by Household Size in Smithville
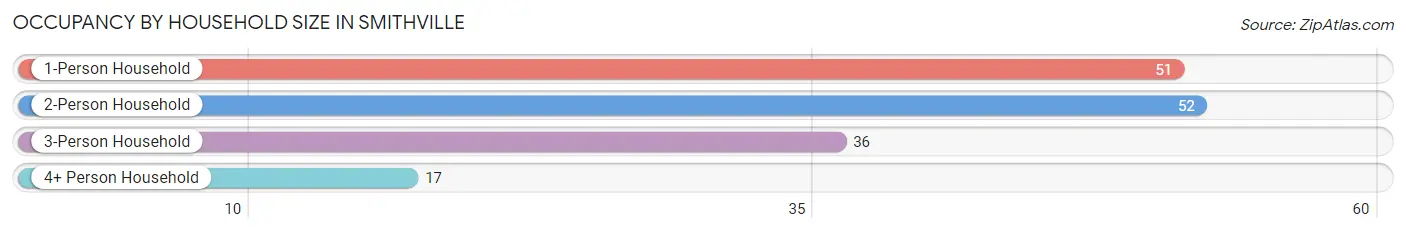
| Household Size | # Housing Units | % Housing Units |
| 1-Person Household | 51 | 32.7% |
| 2-Person Household | 52 | 33.3% |
| 3-Person Household | 36 | 23.1% |
| 4+ Person Household | 17 | 10.9% |
| Total Housing Units | 156 | 100.0% |
Occupancy by Ownership by Household Size in Smithville
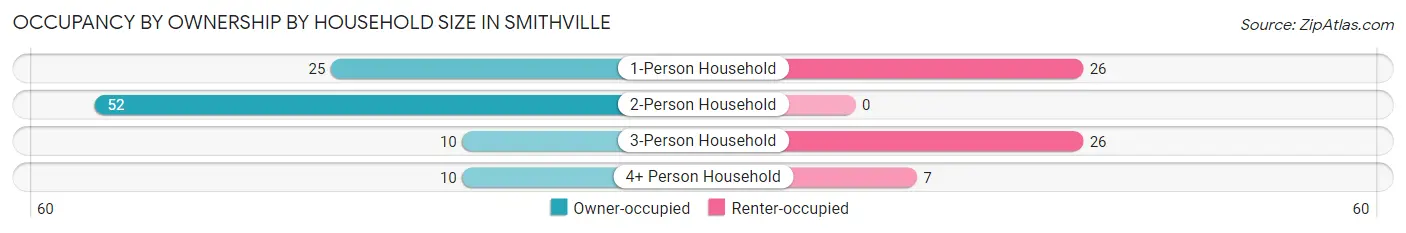
| Household Size | Owner-occupied | Renter-occupied |
| 1-Person Household | 25 (49.0%) | 26 (51.0%) |
| 2-Person Household | 52 (100.0%) | 0 (0.0%) |
| 3-Person Household | 10 (27.8%) | 26 (72.2%) |
| 4+ Person Household | 10 (58.8%) | 7 (41.2%) |
| Total Housing Units | 97 (62.2%) | 59 (37.8%) |
Occupancy by Educational Attainment in Smithville
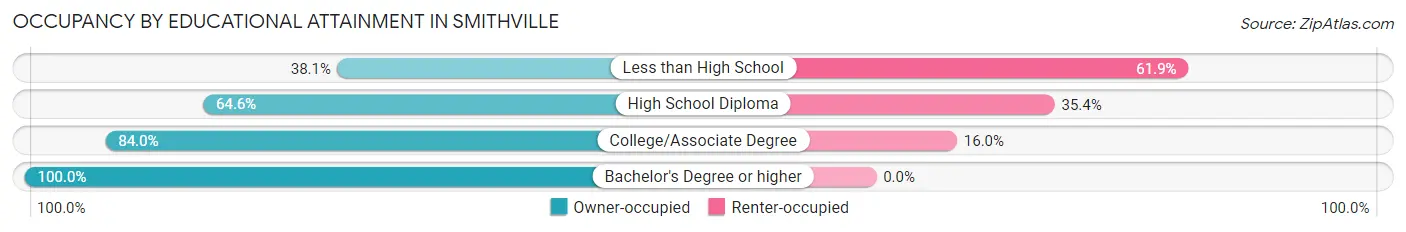
| Household Size | Owner-occupied | Renter-occupied |
| Less than High School | 16 (38.1%) | 26 (61.9%) |
| High School Diploma | 53 (64.6%) | 29 (35.4%) |
| College/Associate Degree | 21 (84.0%) | 4 (16.0%) |
| Bachelor's Degree or higher | 7 (100.0%) | 0 (0.0%) |
Occupancy by Age of Householder in Smithville
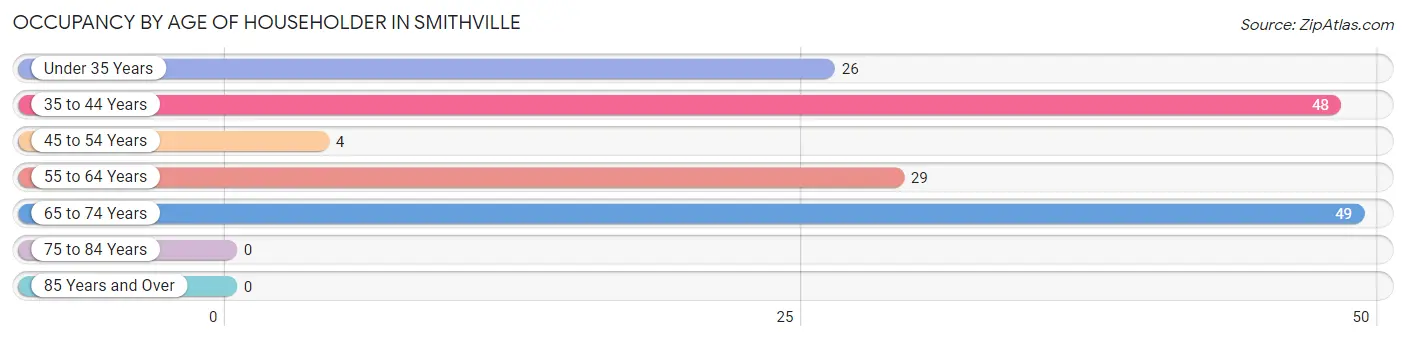
| Age Bracket | # Households | % Households |
| Under 35 Years | 26 | 16.7% |
| 35 to 44 Years | 48 | 30.8% |
| 45 to 54 Years | 4 | 2.6% |
| 55 to 64 Years | 29 | 18.6% |
| 65 to 74 Years | 49 | 31.4% |
| 75 to 84 Years | 0 | 0.0% |
| 85 Years and Over | 0 | 0.0% |
| Total | 156 | 100.0% |
Housing Finances in Smithville
Median Income by Occupancy in Smithville
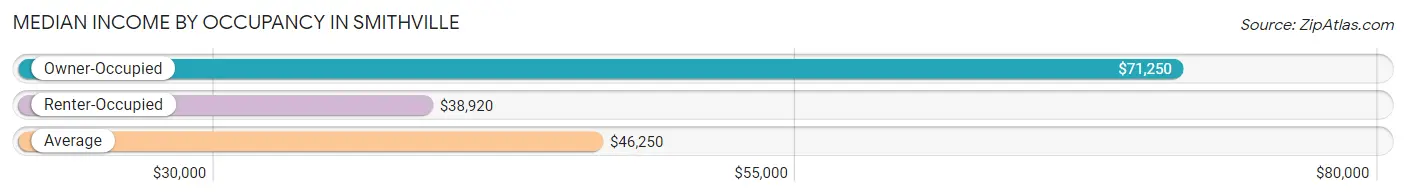
| Occupancy Type | # Households | Median Income |
| Owner-Occupied | 97 (62.2%) | $71,250 |
| Renter-Occupied | 59 (37.8%) | $38,920 |
| Average | 156 (100.0%) | $46,250 |
Occupancy by Householder Income Bracket in Smithville
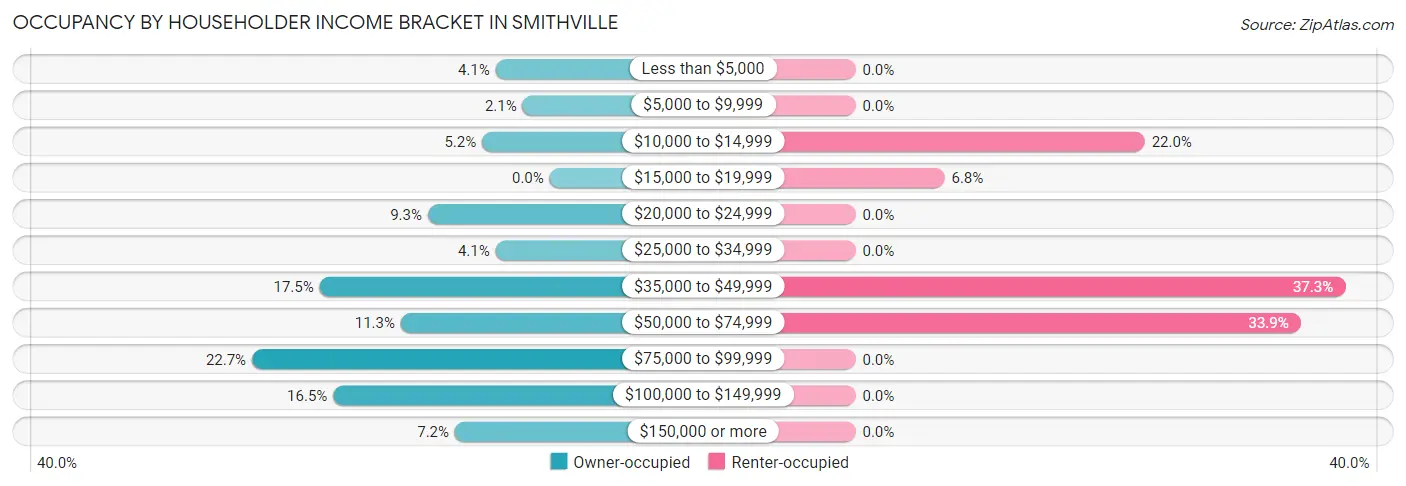
| Income Bracket | Owner-occupied | Renter-occupied |
| Less than $5,000 | 4 (4.1%) | 0 (0.0%) |
| $5,000 to $9,999 | 2 (2.1%) | 0 (0.0%) |
| $10,000 to $14,999 | 5 (5.1%) | 13 (22.0%) |
| $15,000 to $19,999 | 0 (0.0%) | 4 (6.8%) |
| $20,000 to $24,999 | 9 (9.3%) | 0 (0.0%) |
| $25,000 to $34,999 | 4 (4.1%) | 0 (0.0%) |
| $35,000 to $49,999 | 17 (17.5%) | 22 (37.3%) |
| $50,000 to $74,999 | 11 (11.3%) | 20 (33.9%) |
| $75,000 to $99,999 | 22 (22.7%) | 0 (0.0%) |
| $100,000 to $149,999 | 16 (16.5%) | 0 (0.0%) |
| $150,000 or more | 7 (7.2%) | 0 (0.0%) |
| Total | 97 (100.0%) | 59 (100.0%) |
Monthly Housing Cost Tiers in Smithville
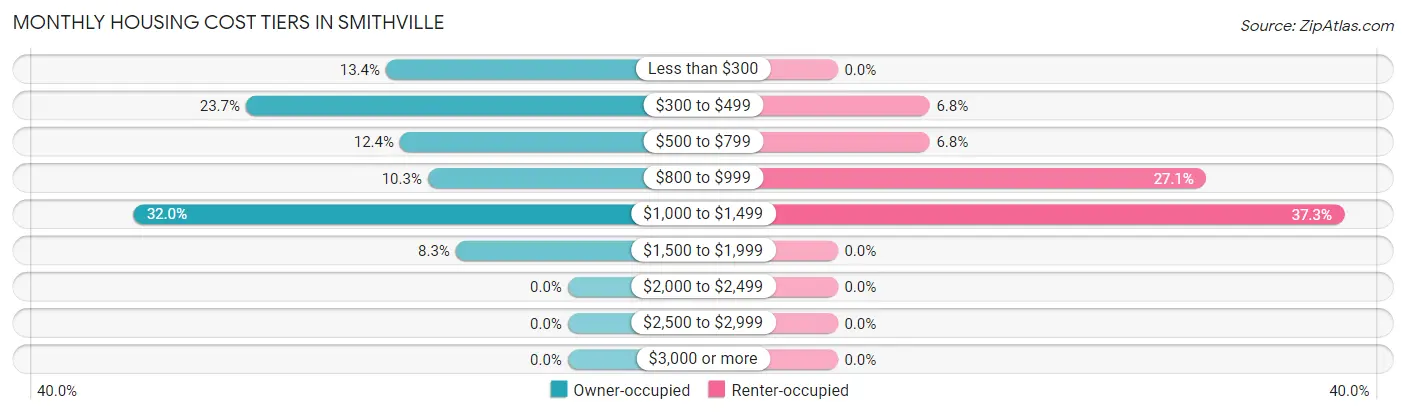
| Monthly Cost | Owner-occupied | Renter-occupied |
| Less than $300 | 13 (13.4%) | 0 (0.0%) |
| $300 to $499 | 23 (23.7%) | 4 (6.8%) |
| $500 to $799 | 12 (12.4%) | 4 (6.8%) |
| $800 to $999 | 10 (10.3%) | 16 (27.1%) |
| $1,000 to $1,499 | 31 (32.0%) | 22 (37.3%) |
| $1,500 to $1,999 | 8 (8.3%) | 0 (0.0%) |
| $2,000 to $2,499 | 0 (0.0%) | 0 (0.0%) |
| $2,500 to $2,999 | 0 (0.0%) | 0 (0.0%) |
| $3,000 or more | 0 (0.0%) | 0 (0.0%) |
| Total | 97 (100.0%) | 59 (100.0%) |
Physical Housing Characteristics in Smithville
Housing Structures in Smithville
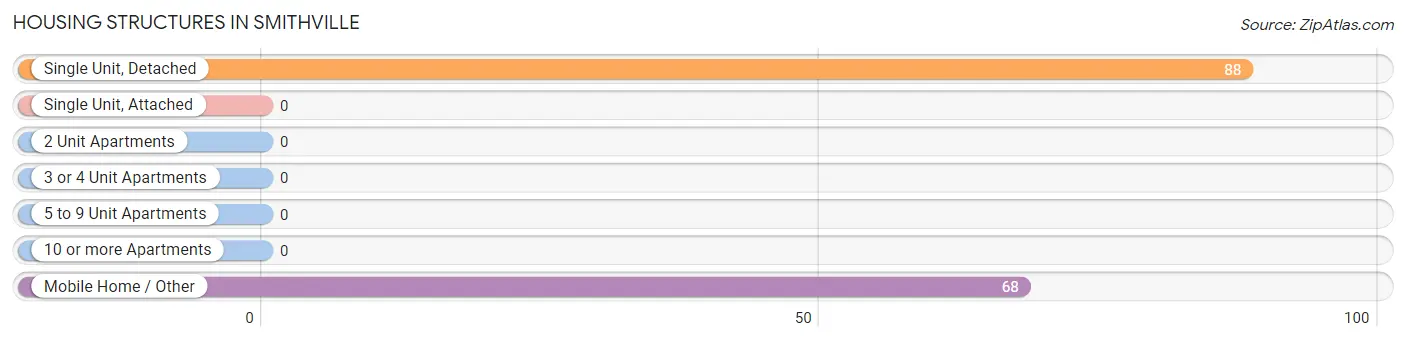
| Structure Type | # Housing Units | % Housing Units |
| Single Unit, Detached | 88 | 56.4% |
| Single Unit, Attached | 0 | 0.0% |
| 2 Unit Apartments | 0 | 0.0% |
| 3 or 4 Unit Apartments | 0 | 0.0% |
| 5 to 9 Unit Apartments | 0 | 0.0% |
| 10 or more Apartments | 0 | 0.0% |
| Mobile Home / Other | 68 | 43.6% |
| Total | 156 | 100.0% |
Housing Structures by Occupancy in Smithville
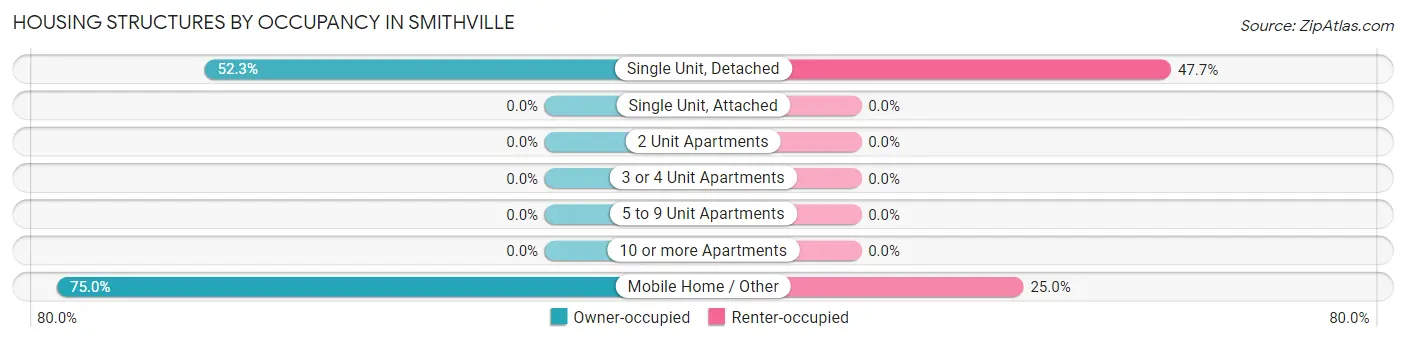
| Structure Type | Owner-occupied | Renter-occupied |
| Single Unit, Detached | 46 (52.3%) | 42 (47.7%) |
| Single Unit, Attached | 0 (0.0%) | 0 (0.0%) |
| 2 Unit Apartments | 0 (0.0%) | 0 (0.0%) |
| 3 or 4 Unit Apartments | 0 (0.0%) | 0 (0.0%) |
| 5 to 9 Unit Apartments | 0 (0.0%) | 0 (0.0%) |
| 10 or more Apartments | 0 (0.0%) | 0 (0.0%) |
| Mobile Home / Other | 51 (75.0%) | 17 (25.0%) |
| Total | 97 (62.2%) | 59 (37.8%) |
Housing Structures by Number of Rooms in Smithville
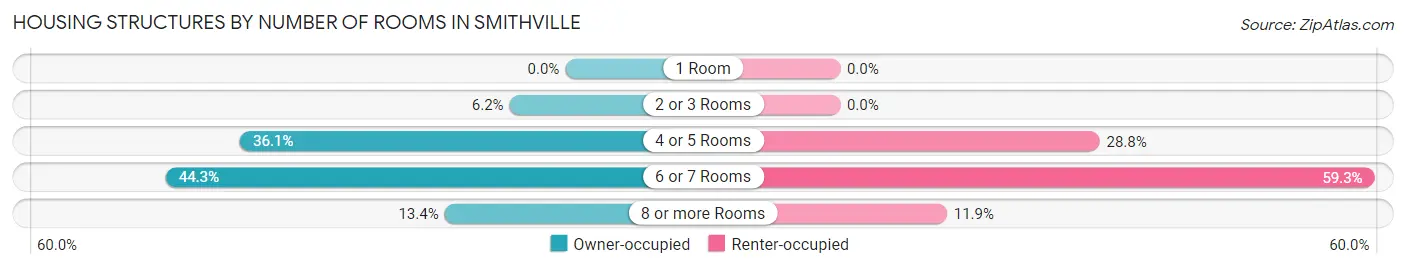
| Number of Rooms | Owner-occupied | Renter-occupied |
| 1 Room | 0 (0.0%) | 0 (0.0%) |
| 2 or 3 Rooms | 6 (6.2%) | 0 (0.0%) |
| 4 or 5 Rooms | 35 (36.1%) | 17 (28.8%) |
| 6 or 7 Rooms | 43 (44.3%) | 35 (59.3%) |
| 8 or more Rooms | 13 (13.4%) | 7 (11.9%) |
| Total | 97 (100.0%) | 59 (100.0%) |
Housing Structure by Heating Type in Smithville
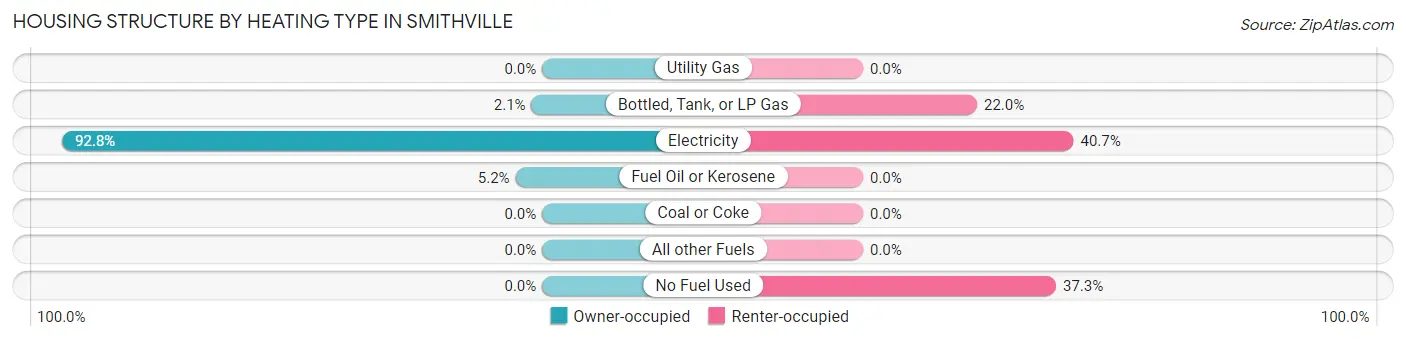
| Heating Type | Owner-occupied | Renter-occupied |
| Utility Gas | 0 (0.0%) | 0 (0.0%) |
| Bottled, Tank, or LP Gas | 2 (2.1%) | 13 (22.0%) |
| Electricity | 90 (92.8%) | 24 (40.7%) |
| Fuel Oil or Kerosene | 5 (5.1%) | 0 (0.0%) |
| Coal or Coke | 0 (0.0%) | 0 (0.0%) |
| All other Fuels | 0 (0.0%) | 0 (0.0%) |
| No Fuel Used | 0 (0.0%) | 22 (37.3%) |
| Total | 97 (100.0%) | 59 (100.0%) |
Household Vehicle Usage in Smithville
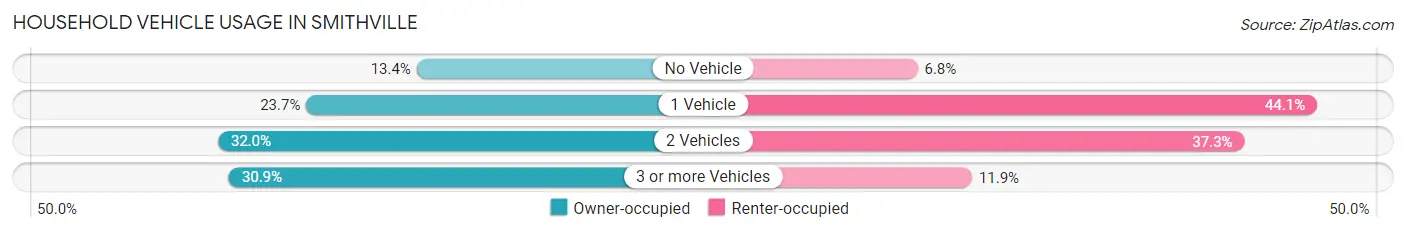
| Vehicles per Household | Owner-occupied | Renter-occupied |
| No Vehicle | 13 (13.4%) | 4 (6.8%) |
| 1 Vehicle | 23 (23.7%) | 26 (44.1%) |
| 2 Vehicles | 31 (32.0%) | 22 (37.3%) |
| 3 or more Vehicles | 30 (30.9%) | 7 (11.9%) |
| Total | 97 (100.0%) | 59 (100.0%) |
Real Estate & Mortgages in Smithville
Real Estate and Mortgage Overview in Smithville
| Characteristic | Without Mortgage | With Mortgage |
| Housing Units | 36 | 61 |
| Median Property Value | $97,100 | $106,000 |
| Median Household Income | $40,417 | $7 |
| Monthly Housing Costs | $323 | $0 |
| Real Estate Taxes | $850 | $4 |
Property Value by Mortgage Status in Smithville
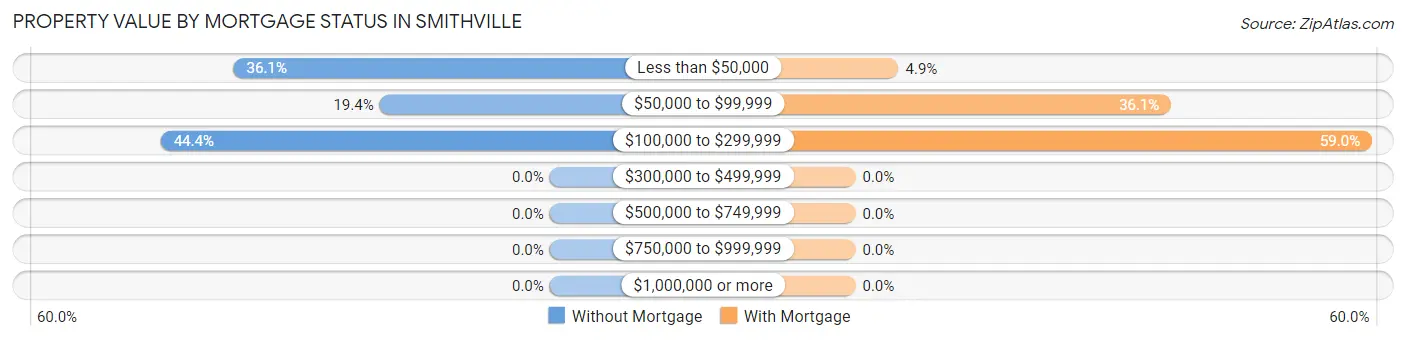
| Property Value | Without Mortgage | With Mortgage |
| Less than $50,000 | 13 (36.1%) | 3 (4.9%) |
| $50,000 to $99,999 | 7 (19.4%) | 22 (36.1%) |
| $100,000 to $299,999 | 16 (44.4%) | 36 (59.0%) |
| $300,000 to $499,999 | 0 (0.0%) | 0 (0.0%) |
| $500,000 to $749,999 | 0 (0.0%) | 0 (0.0%) |
| $750,000 to $999,999 | 0 (0.0%) | 0 (0.0%) |
| $1,000,000 or more | 0 (0.0%) | 0 (0.0%) |
| Total | 36 (100.0%) | 61 (100.0%) |
Household Income by Mortgage Status in Smithville
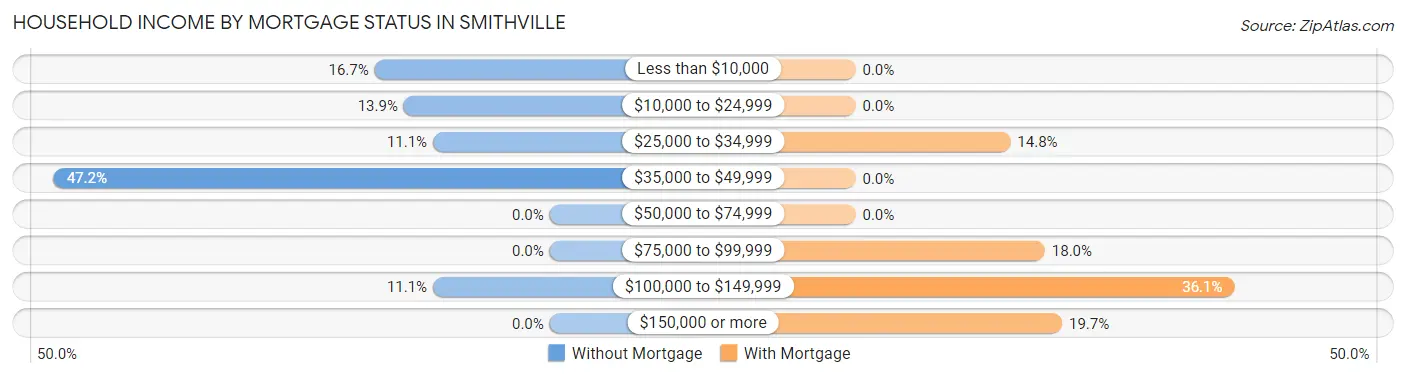
| Household Income | Without Mortgage | With Mortgage |
| Less than $10,000 | 6 (16.7%) | 0 (0.0%) |
| $10,000 to $24,999 | 5 (13.9%) | 0 (0.0%) |
| $25,000 to $34,999 | 4 (11.1%) | 9 (14.7%) |
| $35,000 to $49,999 | 17 (47.2%) | 0 (0.0%) |
| $50,000 to $74,999 | 0 (0.0%) | 0 (0.0%) |
| $75,000 to $99,999 | 0 (0.0%) | 11 (18.0%) |
| $100,000 to $149,999 | 4 (11.1%) | 22 (36.1%) |
| $150,000 or more | 0 (0.0%) | 12 (19.7%) |
| Total | 36 (100.0%) | 61 (100.0%) |
Property Value to Household Income Ratio in Smithville
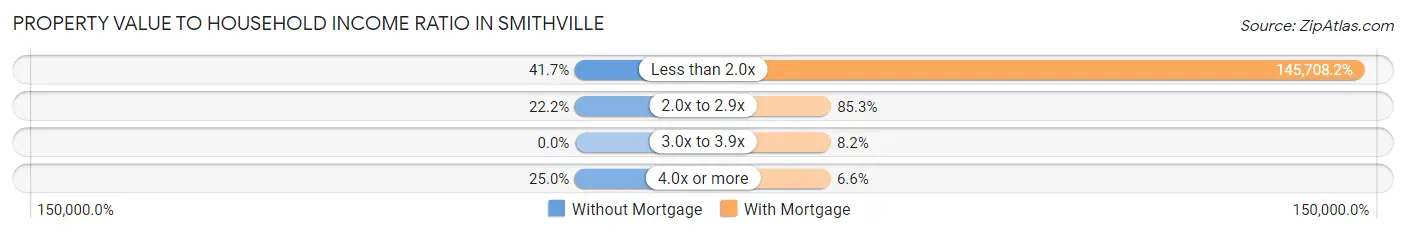
| Value-to-Income Ratio | Without Mortgage | With Mortgage |
| Less than 2.0x | 15 (41.7%) | 88,882 (145,708.2%) |
| 2.0x to 2.9x | 8 (22.2%) | 52 (85.3%) |
| 3.0x to 3.9x | 0 (0.0%) | 5 (8.2%) |
| 4.0x or more | 9 (25.0%) | 4 (6.6%) |
| Total | 36 (100.0%) | 61 (100.0%) |
Real Estate Taxes by Mortgage Status in Smithville
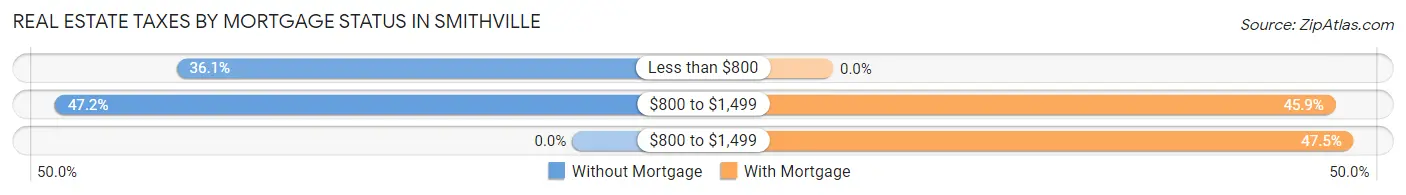
| Property Taxes | Without Mortgage | With Mortgage |
| Less than $800 | 13 (36.1%) | 0 (0.0%) |
| $800 to $1,499 | 17 (47.2%) | 28 (45.9%) |
| $800 to $1,499 | 0 (0.0%) | 29 (47.5%) |
| Total | 36 (100.0%) | 61 (100.0%) |
Health & Disability in Smithville
Health Insurance Coverage by Age in Smithville
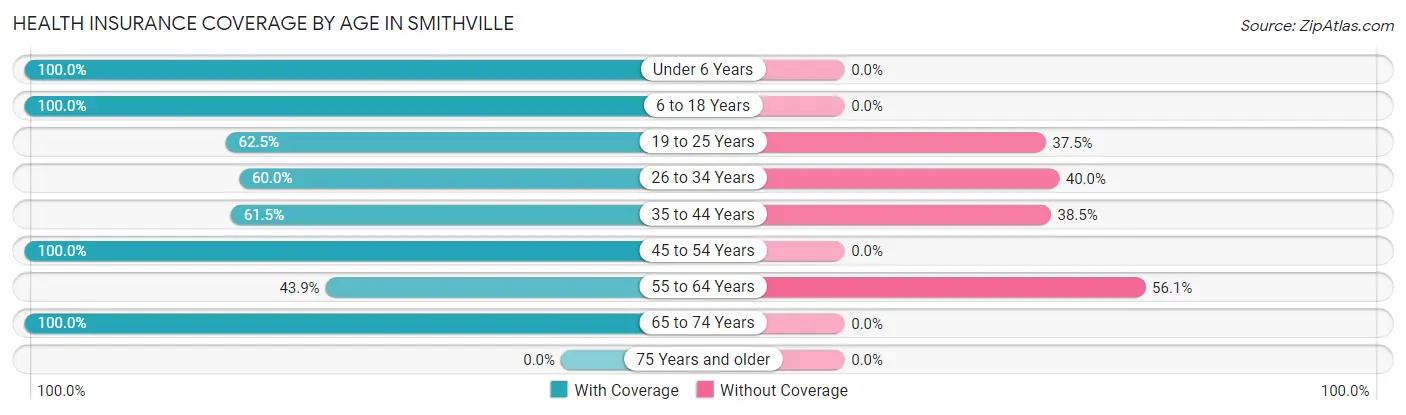
| Age Bracket | With Coverage | Without Coverage |
| Under 6 Years | 15 (100.0%) | 0 (0.0%) |
| 6 to 18 Years | 23 (100.0%) | 0 (0.0%) |
| 19 to 25 Years | 15 (62.5%) | 9 (37.5%) |
| 26 to 34 Years | 33 (60.0%) | 22 (40.0%) |
| 35 to 44 Years | 48 (61.5%) | 30 (38.5%) |
| 45 to 54 Years | 7 (100.0%) | 0 (0.0%) |
| 55 to 64 Years | 18 (43.9%) | 23 (56.1%) |
| 65 to 74 Years | 77 (100.0%) | 0 (0.0%) |
| 75 Years and older | 0 (0.0%) | 0 (0.0%) |
| Total | 236 (73.8%) | 84 (26.3%) |
Health Insurance Coverage by Citizenship Status in Smithville
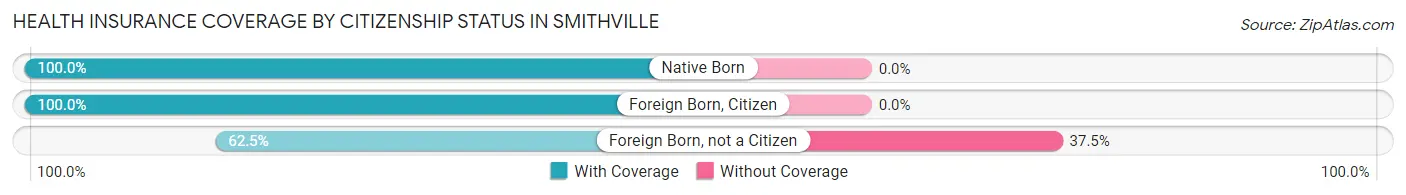
| Citizenship Status | With Coverage | Without Coverage |
| Native Born | 15 (100.0%) | 0 (0.0%) |
| Foreign Born, Citizen | 23 (100.0%) | 0 (0.0%) |
| Foreign Born, not a Citizen | 15 (62.5%) | 9 (37.5%) |
Health Insurance Coverage by Household Income in Smithville
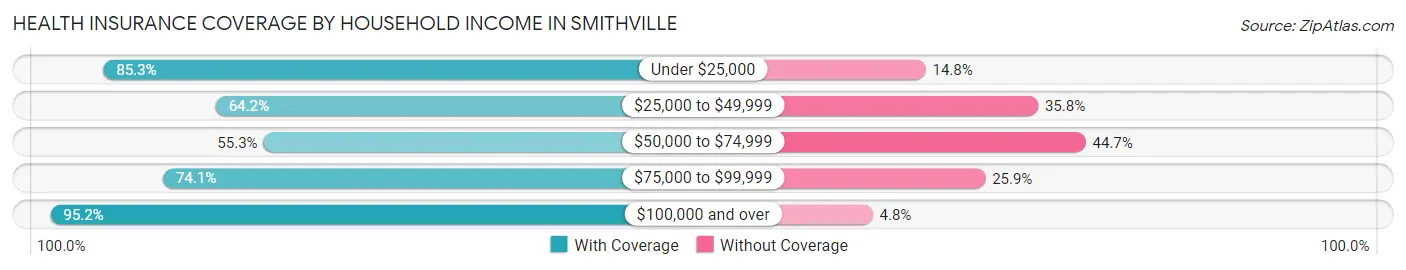
| Household Income | With Coverage | Without Coverage |
| Under $25,000 | 52 (85.3%) | 9 (14.7%) |
| $25,000 to $49,999 | 43 (64.2%) | 24 (35.8%) |
| $50,000 to $74,999 | 42 (55.3%) | 34 (44.7%) |
| $75,000 to $99,999 | 40 (74.1%) | 14 (25.9%) |
| $100,000 and over | 59 (95.2%) | 3 (4.8%) |
Public vs Private Health Insurance Coverage by Age in Smithville
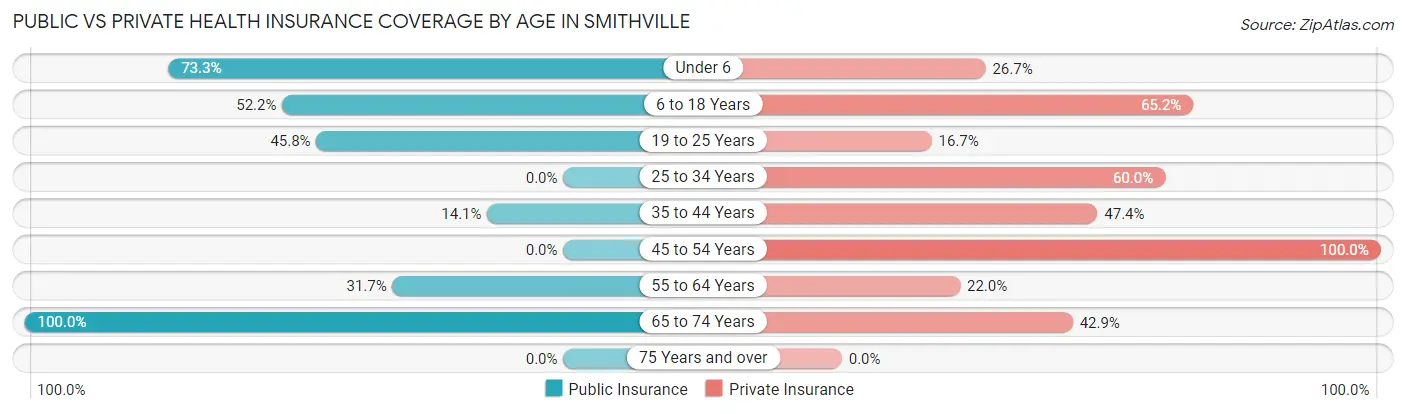
| Age Bracket | Public Insurance | Private Insurance |
| Under 6 | 11 (73.3%) | 4 (26.7%) |
| 6 to 18 Years | 12 (52.2%) | 15 (65.2%) |
| 19 to 25 Years | 11 (45.8%) | 4 (16.7%) |
| 25 to 34 Years | 0 (0.0%) | 33 (60.0%) |
| 35 to 44 Years | 11 (14.1%) | 37 (47.4%) |
| 45 to 54 Years | 0 (0.0%) | 7 (100.0%) |
| 55 to 64 Years | 13 (31.7%) | 9 (22.0%) |
| 65 to 74 Years | 77 (100.0%) | 33 (42.9%) |
| 75 Years and over | 0 (0.0%) | 0 (0.0%) |
| Total | 135 (42.2%) | 142 (44.4%) |
Disability Status by Sex by Age in Smithville
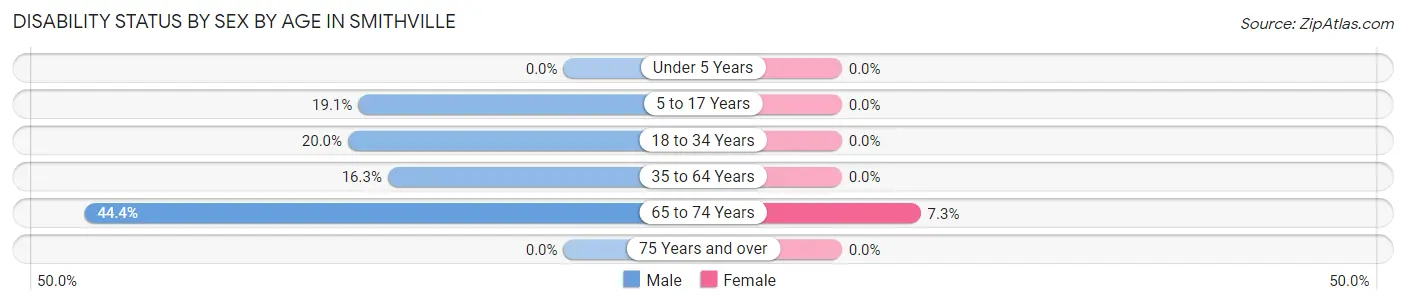
| Age Bracket | Male | Female |
| Under 5 Years | 0 (0.0%) | 0 (0.0%) |
| 5 to 17 Years | 4 (19.1%) | 0 (0.0%) |
| 18 to 34 Years | 5 (20.0%) | 0 (0.0%) |
| 35 to 64 Years | 15 (16.3%) | 0 (0.0%) |
| 65 to 74 Years | 16 (44.4%) | 3 (7.3%) |
| 75 Years and over | 0 (0.0%) | 0 (0.0%) |
Disability Class by Sex by Age in Smithville
Disability Class: Hearing Difficulty
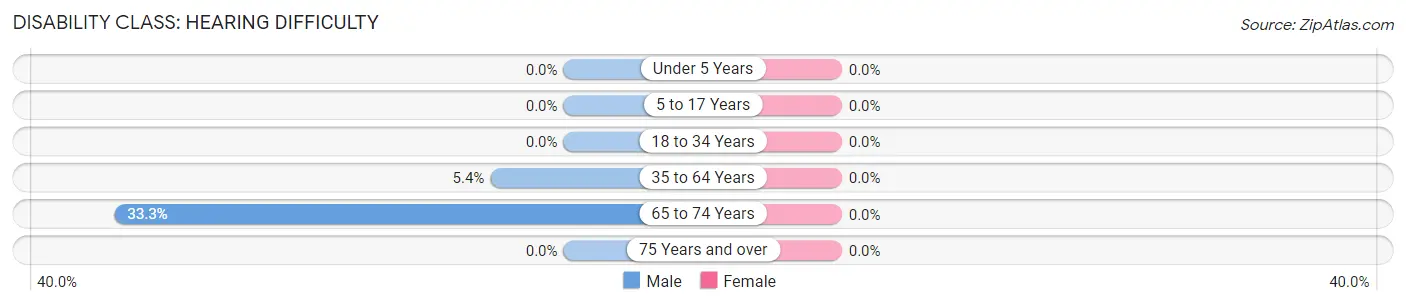
| Age Bracket | Male | Female |
| Under 5 Years | 0 (0.0%) | 0 (0.0%) |
| 5 to 17 Years | 0 (0.0%) | 0 (0.0%) |
| 18 to 34 Years | 0 (0.0%) | 0 (0.0%) |
| 35 to 64 Years | 5 (5.4%) | 0 (0.0%) |
| 65 to 74 Years | 12 (33.3%) | 0 (0.0%) |
| 75 Years and over | 0 (0.0%) | 0 (0.0%) |
Disability Class: Vision Difficulty
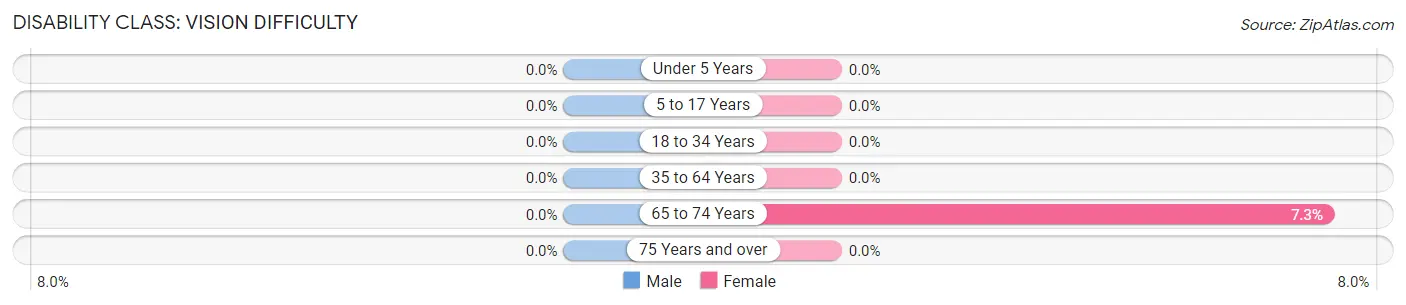
| Age Bracket | Male | Female |
| Under 5 Years | 0 (0.0%) | 0 (0.0%) |
| 5 to 17 Years | 0 (0.0%) | 0 (0.0%) |
| 18 to 34 Years | 0 (0.0%) | 0 (0.0%) |
| 35 to 64 Years | 0 (0.0%) | 0 (0.0%) |
| 65 to 74 Years | 0 (0.0%) | 3 (7.3%) |
| 75 Years and over | 0 (0.0%) | 0 (0.0%) |
Disability Class: Cognitive Difficulty
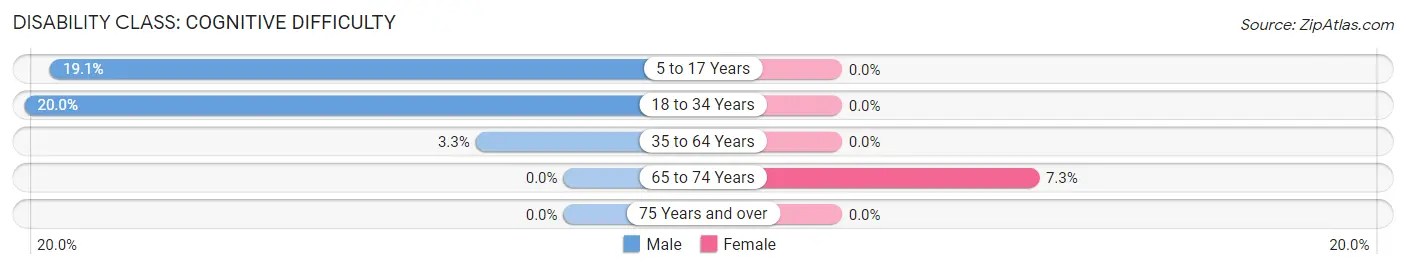
| Age Bracket | Male | Female |
| 5 to 17 Years | 4 (19.1%) | 0 (0.0%) |
| 18 to 34 Years | 5 (20.0%) | 0 (0.0%) |
| 35 to 64 Years | 3 (3.3%) | 0 (0.0%) |
| 65 to 74 Years | 0 (0.0%) | 3 (7.3%) |
| 75 Years and over | 0 (0.0%) | 0 (0.0%) |
Disability Class: Ambulatory Difficulty
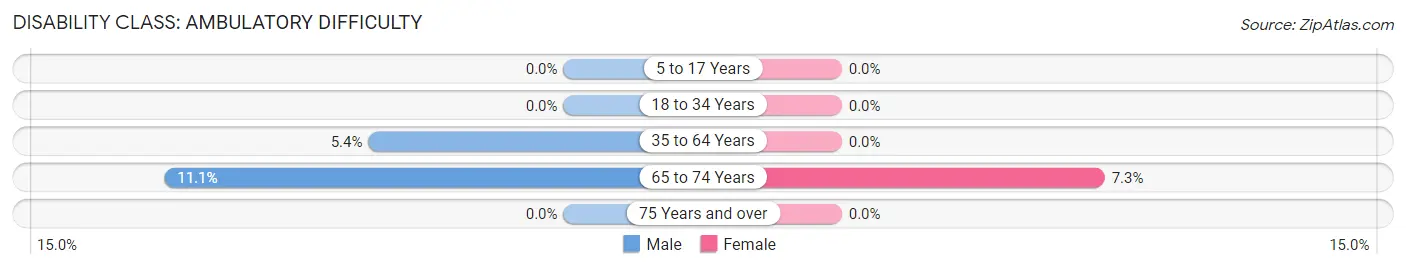
| Age Bracket | Male | Female |
| 5 to 17 Years | 0 (0.0%) | 0 (0.0%) |
| 18 to 34 Years | 0 (0.0%) | 0 (0.0%) |
| 35 to 64 Years | 5 (5.4%) | 0 (0.0%) |
| 65 to 74 Years | 4 (11.1%) | 3 (7.3%) |
| 75 Years and over | 0 (0.0%) | 0 (0.0%) |
Disability Class: Self-Care Difficulty
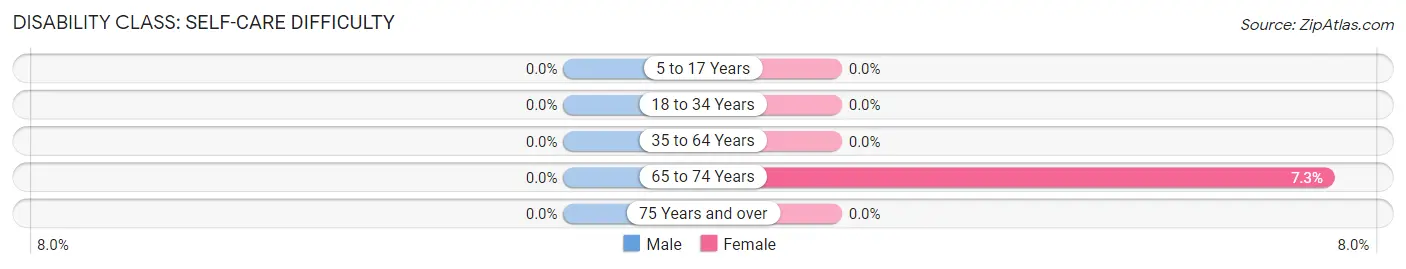
| Age Bracket | Male | Female |
| 5 to 17 Years | 0 (0.0%) | 0 (0.0%) |
| 18 to 34 Years | 0 (0.0%) | 0 (0.0%) |
| 35 to 64 Years | 0 (0.0%) | 0 (0.0%) |
| 65 to 74 Years | 0 (0.0%) | 3 (7.3%) |
| 75 Years and over | 0 (0.0%) | 0 (0.0%) |
Technology Access in Smithville
Computing Device Access in Smithville
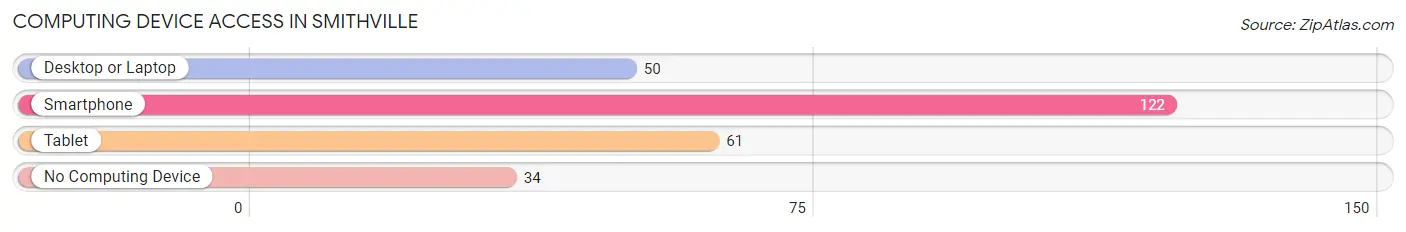
| Device Type | # Households | % Households |
| Desktop or Laptop | 50 | 32.1% |
| Smartphone | 122 | 78.2% |
| Tablet | 61 | 39.1% |
| No Computing Device | 34 | 21.8% |
| Total | 156 | 100.0% |
Internet Access in Smithville
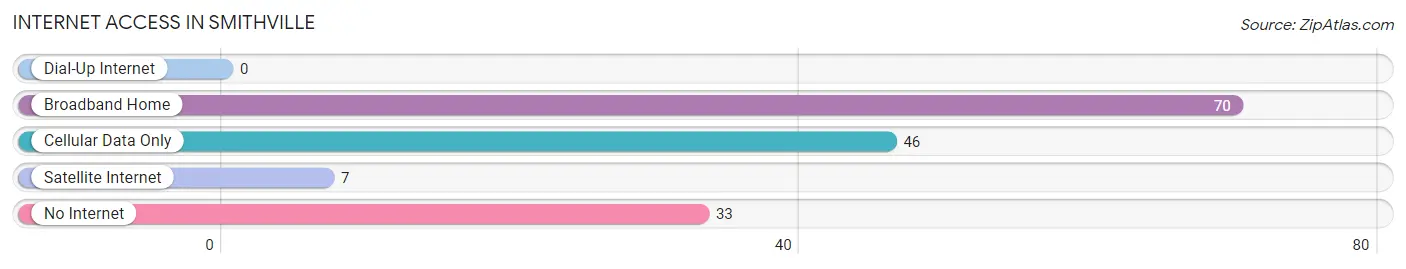
| Internet Type | # Households | % Households |
| Dial-Up Internet | 0 | 0.0% |
| Broadband Home | 70 | 44.9% |
| Cellular Data Only | 46 | 29.5% |
| Satellite Internet | 7 | 4.5% |
| No Internet | 33 | 21.1% |
| Total | 156 | 100.0% |
Smithville Summary
History
The small town of Smithville, Georgia is located in the southwestern corner of the state, in the county of Early. It is situated on the banks of the Ocmulgee River, and is the county seat of Early County. The town was founded in 1818, and was named after the Smith family, who were among the first settlers in the area.
The town was originally a trading post, and the Smith family built a grist mill and a sawmill on the river. The town grew slowly, but steadily, and by the mid-1800s, it had become a thriving agricultural center. Cotton was the main crop, and the town was home to several cotton gins and warehouses.
In the late 1800s, the town began to diversify its economy, and several new industries were established. The first bank was opened in 1891, and the first newspaper was published in 1895. The town also became a center for timber production, and several sawmills were built in the area.
In the early 1900s, the town experienced a period of rapid growth. The population increased from just over 500 in 1900 to over 1,500 by 1910. The town was incorporated in 1910, and the first mayor was elected in 1911.
The town continued to grow throughout the 20th century, and by 2000, the population had reached 2,500. The town has remained relatively small, but it has become a popular tourist destination due to its proximity to the Ocmulgee River and its historic downtown area.
Geography
Smithville is located in the southwestern corner of Georgia, in Early County. It is situated on the banks of the Ocmulgee River, and is approximately 30 miles from the state capital of Atlanta. The town is located in a rural area, and is surrounded by farmland and forests.
The town has a total area of 2.2 square miles, and the elevation is approximately 400 feet above sea level. The climate is humid subtropical, with hot summers and mild winters. The average annual temperature is around 70 degrees Fahrenheit, and the average annual precipitation is around 50 inches.
Economy
The economy of Smithville is largely based on agriculture and tourism. The town is home to several farms, and the surrounding area is known for its production of cotton, peanuts, corn, and soybeans. The town is also home to several sawmills and timber companies, and the timber industry is an important part of the local economy.
The town is also a popular tourist destination, and the downtown area is home to several historic buildings and attractions. The town is also home to several restaurants, shops, and other businesses.
Demographics
As of the 2010 census, the population of Smithville was 2,541. The racial makeup of the town was 79.3% White, 17.2% African American, 0.3% Native American, 0.4% Asian, 0.1% Pacific Islander, 1.2% from other races, and 1.5% from two or more races. Hispanic or Latino of any race were 2.7% of the population.
The median household income in Smithville was $30,938, and the median family income was $37,813. The per capita income was $17,845. About 17.2% of families and 20.3% of the population were below the poverty line, including 28.3% of those under age 18 and 15.2% of those age 65 or over.
Common Questions
What is Per Capita Income in Smithville?
Per Capita income in Smithville is $27,968.
What is the Median Family Income in Smithville?
Median Family Income in Smithville is $71,607.
What is the Median Household income in Smithville?
Median Household Income in Smithville is $46,250.
What is Inequality or Gini Index in Smithville?
Inequality or Gini Index in Smithville is 0.39.
What is the Total Population of Smithville?
Total Population of Smithville is 320.
What is the Total Male Population of Smithville?
Total Male Population of Smithville is 177.
What is the Total Female Population of Smithville?
Total Female Population of Smithville is 143.
What is the Ratio of Males per 100 Females in Smithville?
There are 123.78 Males per 100 Females in Smithville.
What is the Ratio of Females per 100 Males in Smithville?
There are 80.79 Females per 100 Males in Smithville.
What is the Median Population Age in Smithville?
Median Population Age in Smithville is 43.3 Years.
What is the Average Family Size in Smithville
Average Family Size in Smithville is 2.6 People.
What is the Average Household Size in Smithville
Average Household Size in Smithville is 2.0 People.
How Large is the Labor Force in Smithville?
There are 144 People in the Labor Forcein in Smithville.
What is the Percentage of People in the Labor Force in Smithville?
49.7% of People are in the Labor Force in Smithville.
What is the Unemployment Rate in Smithville?
Unemployment Rate in Smithville is 2.8%.