Cairo, GA Map & Demographics
Cairo Map
Cairo Overview
$21,542
PER CAPITA INCOME
$60,279
AVG FAMILY INCOME
$39,784
AVG HOUSEHOLD INCOME
31.7%
WAGE / INCOME GAP [ % ]
68.3¢/ $1
WAGE / INCOME GAP [ $ ]
0.49
INEQUALITY / GINI INDEX
10,091
TOTAL POPULATION
4,772
MALE POPULATION
5,319
FEMALE POPULATION
89.72
MALES / 100 FEMALES
111.46
FEMALES / 100 MALES
31.9
MEDIAN AGE
3.7
AVG FAMILY SIZE
2.8
AVG HOUSEHOLD SIZE
4,180
LABOR FORCE [ PEOPLE ]
56.2%
PERCENT IN LABOR FORCE
7.6%
UNEMPLOYMENT RATE
Cairo Area Codes
Income in Cairo
Income Overview in Cairo
Per Capita Income in Cairo is $21,542, while median incomes of families and households are $60,279 and $39,784 respectively.
| Characteristic | Number | Measure |
| Per Capita Income | 10,091 | $21,542 |
| Median Family Income | 2,181 | $60,279 |
| Mean Family Income | 2,181 | $68,010 |
| Median Household Income | 3,594 | $39,784 |
| Mean Household Income | 3,594 | $56,954 |
| Income Deficit | 2,181 | $0 |
| Wage / Income Gap (%) | 10,091 | 31.67% |
| Wage / Income Gap ($) | 10,091 | 68.33¢ per $1 |
| Gini / Inequality Index | 10,091 | 0.49 |
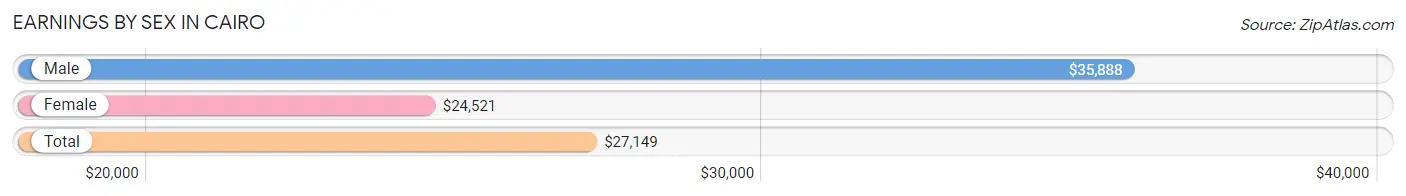
Earnings by Sex in Cairo
Average Earnings in Cairo are $27,149, $35,888 for men and $24,521 for women, a difference of 31.7%.
| Sex | Number | Average Earnings |
| Male | 1,916 (43.3%) | $35,888 |
| Female | 2,511 (56.7%) | $24,521 |
| Total | 4,427 (100.0%) | $27,149 |
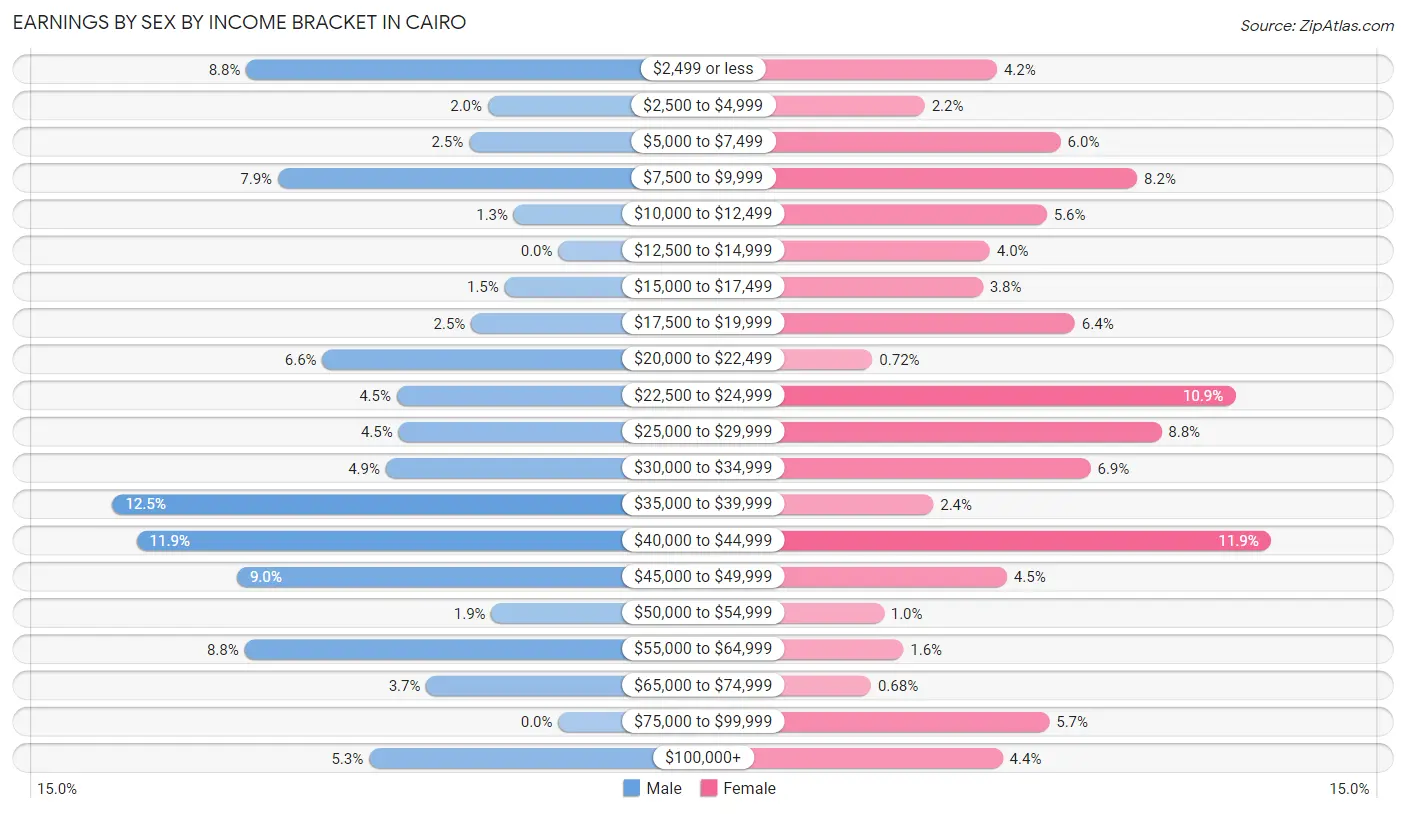
Earnings by Sex by Income Bracket in Cairo
The most common earnings brackets in Cairo are $35,000 to $39,999 for men (240 | 12.5%) and $40,000 to $44,999 for women (299 | 11.9%).
| Income | Male | Female |
| $2,499 or less | 168 (8.8%) | 106 (4.2%) |
| $2,500 to $4,999 | 38 (2.0%) | 55 (2.2%) |
| $5,000 to $7,499 | 48 (2.5%) | 151 (6.0%) |
| $7,500 to $9,999 | 151 (7.9%) | 205 (8.2%) |
| $10,000 to $12,499 | 24 (1.3%) | 141 (5.6%) |
| $12,500 to $14,999 | 0 (0.0%) | 101 (4.0%) |
| $15,000 to $17,499 | 29 (1.5%) | 96 (3.8%) |
| $17,500 to $19,999 | 47 (2.5%) | 161 (6.4%) |
| $20,000 to $22,499 | 127 (6.6%) | 18 (0.7%) |
| $22,500 to $24,999 | 87 (4.5%) | 274 (10.9%) |
| $25,000 to $29,999 | 86 (4.5%) | 222 (8.8%) |
| $30,000 to $34,999 | 93 (4.9%) | 172 (6.9%) |
| $35,000 to $39,999 | 240 (12.5%) | 61 (2.4%) |
| $40,000 to $44,999 | 227 (11.8%) | 299 (11.9%) |
| $45,000 to $49,999 | 173 (9.0%) | 113 (4.5%) |
| $50,000 to $54,999 | 36 (1.9%) | 26 (1.0%) |
| $55,000 to $64,999 | 169 (8.8%) | 40 (1.6%) |
| $65,000 to $74,999 | 71 (3.7%) | 17 (0.7%) |
| $75,000 to $99,999 | 0 (0.0%) | 143 (5.7%) |
| $100,000+ | 102 (5.3%) | 110 (4.4%) |
| Total | 1,916 (100.0%) | 2,511 (100.0%) |
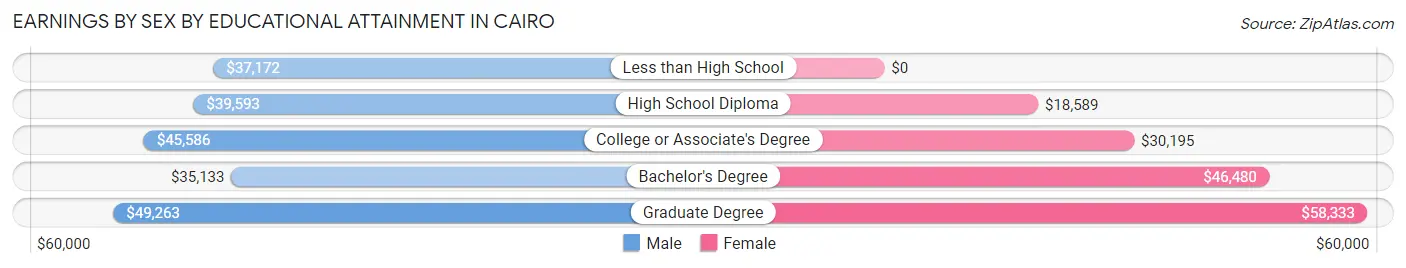
Earnings by Sex by Educational Attainment in Cairo
Average earnings in Cairo are $40,215 for men and $27,480 for women, a difference of 31.7%. Men with an educational attainment of graduate degree enjoy the highest average annual earnings of $49,263, while those with bachelor's degree education earn the least with $35,133. Women with an educational attainment of graduate degree earn the most with the average annual earnings of $58,333, while those with high school diploma education have the smallest earnings of $18,589.
| Educational Attainment | Male Income | Female Income |
| Less than High School | $37,172 | $0 |
| High School Diploma | $39,593 | $18,589 |
| College or Associate's Degree | $45,586 | $30,195 |
| Bachelor's Degree | $35,133 | $46,480 |
| Graduate Degree | $49,263 | $58,333 |
| Total | $40,215 | $27,480 |
Family Income in Cairo
Family Income Brackets in Cairo
According to the Cairo family income data, there are 432 families falling into the $50,000 to $74,999 income range, which is the most common income bracket and makes up 19.8% of all families. Conversely, the $150,000 to $199,999 income bracket is the least frequent group with only 48 families (2.2%) belonging to this category.
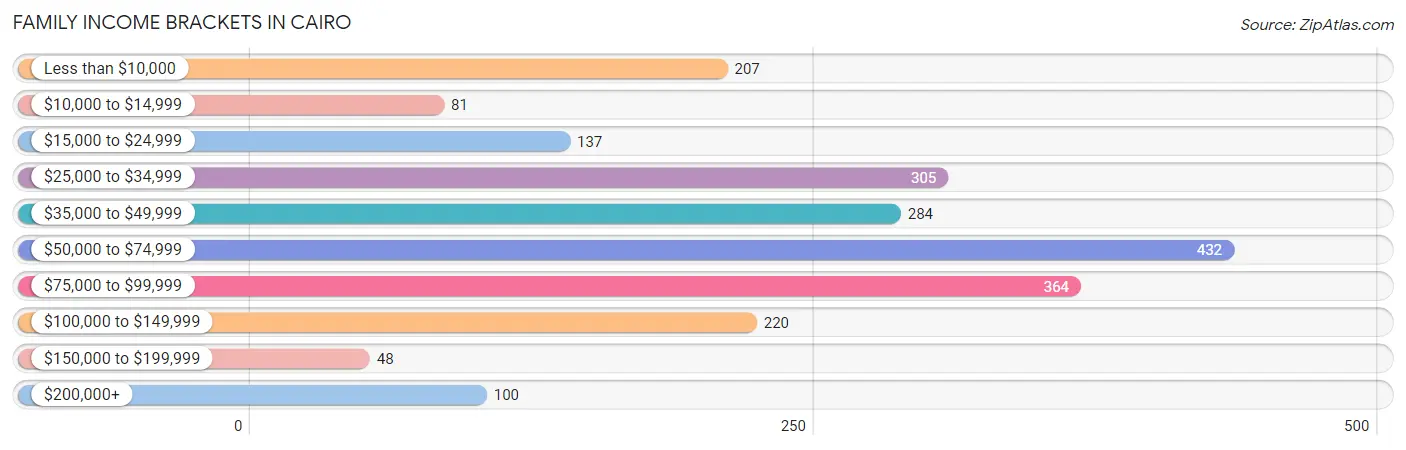
| Income Bracket | # Families | % Families |
| Less than $10,000 | 207 | 9.5% |
| $10,000 to $14,999 | 81 | 3.7% |
| $15,000 to $24,999 | 137 | 6.3% |
| $25,000 to $34,999 | 305 | 14.0% |
| $35,000 to $49,999 | 284 | 13.0% |
| $50,000 to $74,999 | 432 | 19.8% |
| $75,000 to $99,999 | 364 | 16.7% |
| $100,000 to $149,999 | 220 | 10.1% |
| $150,000 to $199,999 | 48 | 2.2% |
| $200,000+ | 100 | 4.6% |
Family Income by Famaliy Size in Cairo
5-person families (156 | 7.1%) account for the highest median family income in Cairo with $67,830 per family, while 2-person families (785 | 36.0%) have the highest median income of $26,914 per family member.
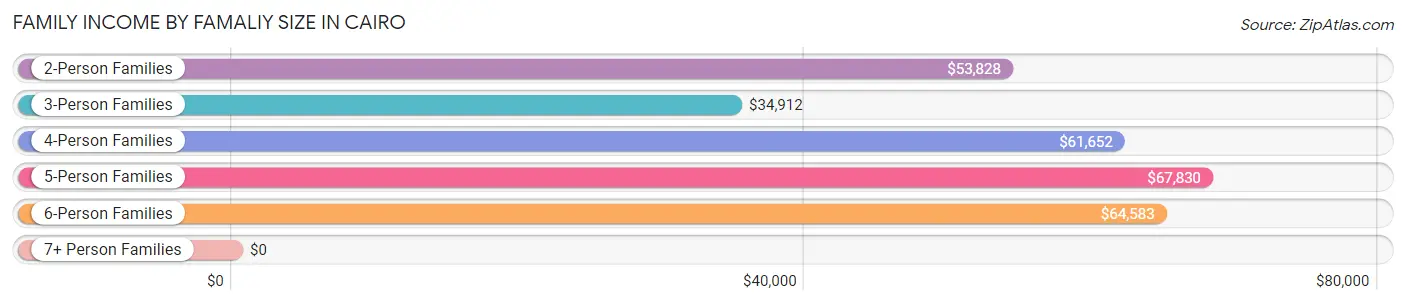
| Income Bracket | # Families | Median Income |
| 2-Person Families | 785 (36.0%) | $53,828 |
| 3-Person Families | 451 (20.7%) | $34,912 |
| 4-Person Families | 617 (28.3%) | $61,652 |
| 5-Person Families | 156 (7.1%) | $67,830 |
| 6-Person Families | 166 (7.6%) | $64,583 |
| 7+ Person Families | 6 (0.3%) | $0 |
| Total | 2,181 (100.0%) | $60,279 |
Family Income by Number of Earners in Cairo
The median family income in Cairo is $60,279, with families comprising 3+ earners (209) having the highest median family income of $99,023, while families with no earners (361) have the lowest median family income of $36,680, accounting for 9.6% and 16.6% of families, respectively.
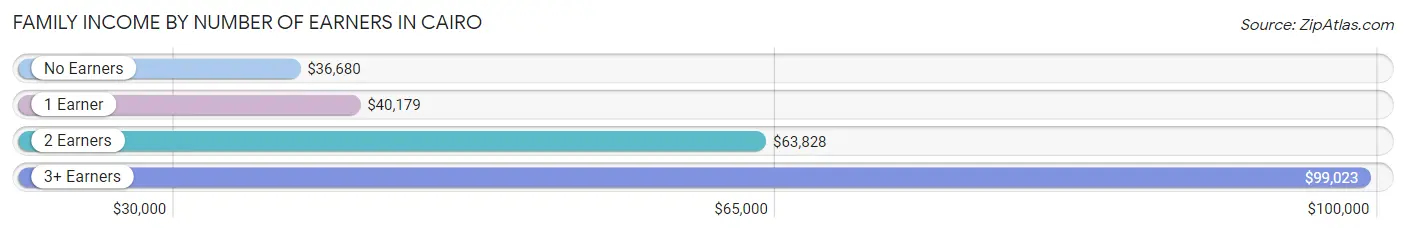
| Number of Earners | # Families | Median Income |
| No Earners | 361 (16.6%) | $36,680 |
| 1 Earner | 814 (37.3%) | $40,179 |
| 2 Earners | 797 (36.5%) | $63,828 |
| 3+ Earners | 209 (9.6%) | $99,023 |
| Total | 2,181 (100.0%) | $60,279 |
Household Income in Cairo
Household Income Brackets in Cairo
With 503 households falling in the category, the less than $10,000 income range is the most frequent in Cairo, accounting for 14.0% of all households. In contrast, only 47 households (1.3%) fall into the $150,000 to $199,999 income bracket, making it the least populous group.
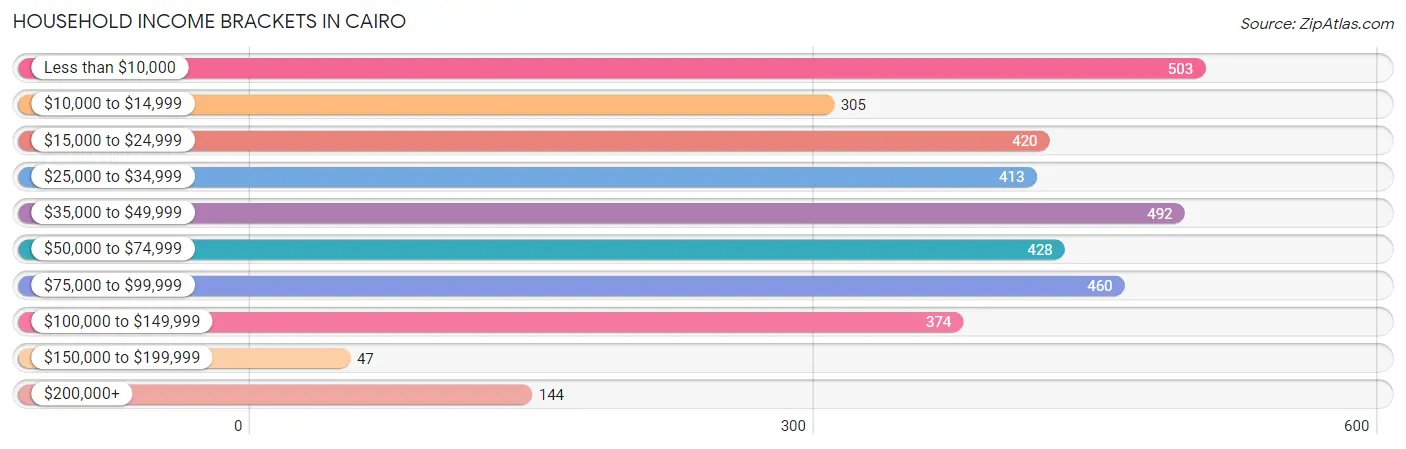
| Income Bracket | # Households | % Households |
| Less than $10,000 | 503 | 14.0% |
| $10,000 to $14,999 | 305 | 8.5% |
| $15,000 to $24,999 | 420 | 11.7% |
| $25,000 to $34,999 | 413 | 11.5% |
| $35,000 to $49,999 | 492 | 13.7% |
| $50,000 to $74,999 | 428 | 11.9% |
| $75,000 to $99,999 | 460 | 12.8% |
| $100,000 to $149,999 | 374 | 10.4% |
| $150,000 to $199,999 | 47 | 1.3% |
| $200,000+ | 144 | 4.0% |
Household Income by Householder Age in Cairo
The median household income in Cairo is $39,784, with the highest median household income of $51,328 found in the 45 to 64 years age bracket for the primary householder. A total of 1,389 households (38.7%) fall into this category. Meanwhile, the 15 to 24 years age bracket for the primary householder has the lowest median household income of $0, with 56 households (1.6%) in this group.
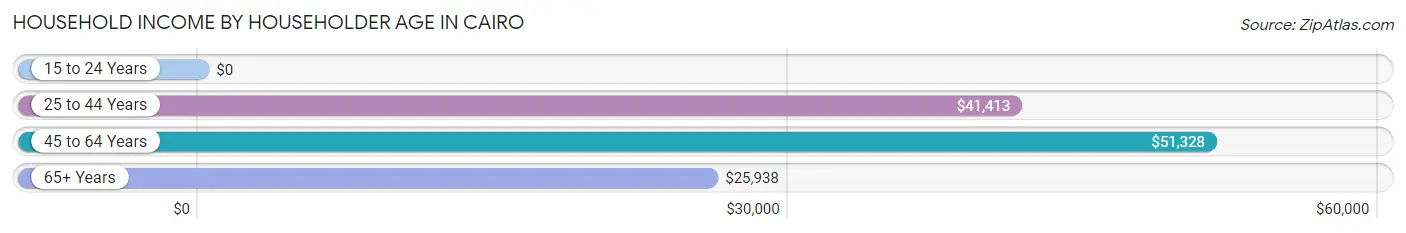
| Income Bracket | # Households | Median Income |
| 15 to 24 Years | 56 (1.6%) | $0 |
| 25 to 44 Years | 988 (27.5%) | $41,413 |
| 45 to 64 Years | 1,389 (38.7%) | $51,328 |
| 65+ Years | 1,161 (32.3%) | $25,938 |
| Total | 3,594 (100.0%) | $39,784 |
Poverty in Cairo
Income Below Poverty by Sex and Age in Cairo
With 19.8% poverty level for males and 27.6% for females among the residents of Cairo, 16 and 17 year old males and under 5 year old females are the most vulnerable to poverty, with 100 males (54.6%) and 97 females (44.1%) in their respective age groups living below the poverty level.
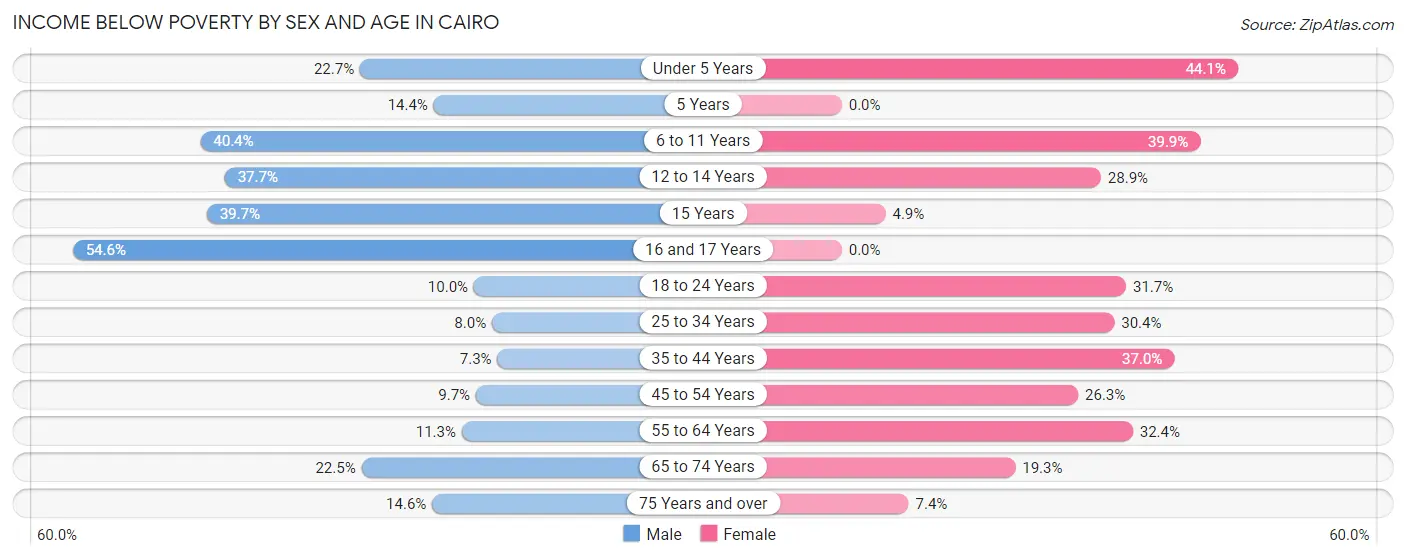
| Age Bracket | Male | Female |
| Under 5 Years | 101 (22.7%) | 97 (44.1%) |
| 5 Years | 13 (14.4%) | 0 (0.0%) |
| 6 to 11 Years | 230 (40.4%) | 158 (39.9%) |
| 12 to 14 Years | 112 (37.7%) | 86 (28.9%) |
| 15 Years | 27 (39.7%) | 11 (4.9%) |
| 16 and 17 Years | 100 (54.6%) | 0 (0.0%) |
| 18 to 24 Years | 45 (10.0%) | 195 (31.7%) |
| 25 to 34 Years | 53 (8.0%) | 214 (30.3%) |
| 35 to 44 Years | 29 (7.3%) | 161 (37.0%) |
| 45 to 54 Years | 38 (9.7%) | 179 (26.3%) |
| 55 to 64 Years | 56 (11.3%) | 235 (32.4%) |
| 65 to 74 Years | 87 (22.5%) | 91 (19.3%) |
| 75 Years and over | 32 (14.6%) | 38 (7.4%) |
| Total | 923 (19.8%) | 1,465 (27.6%) |
Income Above Poverty by Sex and Age in Cairo
According to the poverty statistics in Cairo, males aged 35 to 44 years and females aged 16 and 17 years are the age groups that are most secure financially, with 92.7% of males and 100.0% of females in these age groups living above the poverty line.
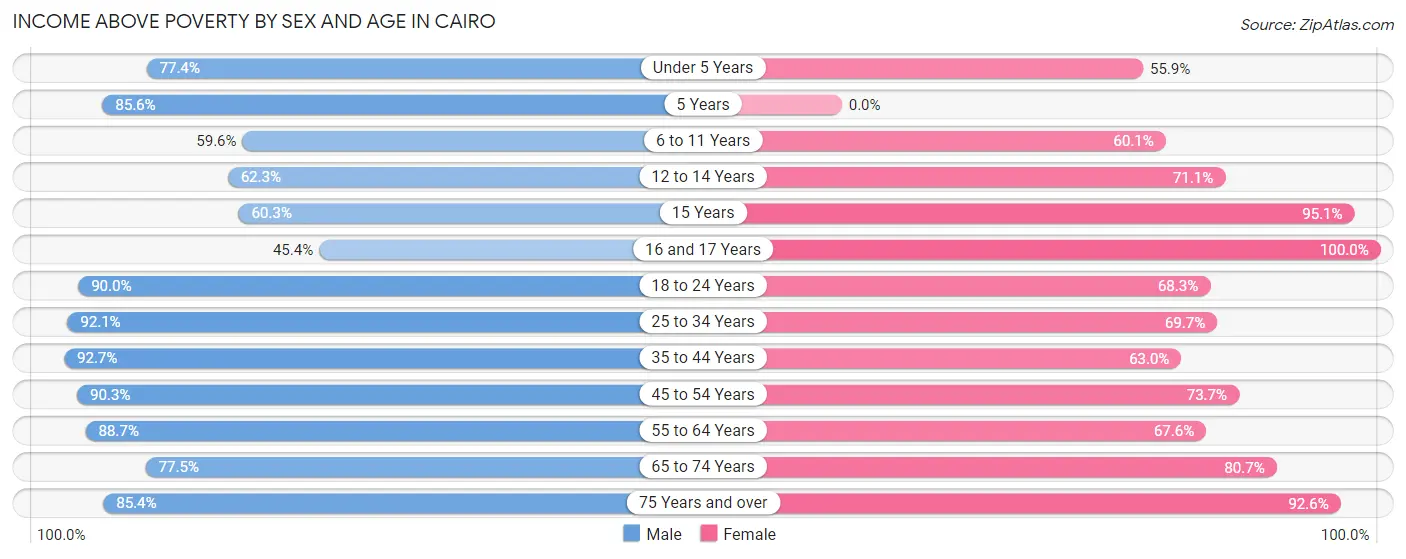
| Age Bracket | Male | Female |
| Under 5 Years | 345 (77.3%) | 123 (55.9%) |
| 5 Years | 77 (85.6%) | 0 (0.0%) |
| 6 to 11 Years | 339 (59.6%) | 238 (60.1%) |
| 12 to 14 Years | 185 (62.3%) | 212 (71.1%) |
| 15 Years | 41 (60.3%) | 215 (95.1%) |
| 16 and 17 Years | 83 (45.4%) | 28 (100.0%) |
| 18 to 24 Years | 407 (90.0%) | 421 (68.3%) |
| 25 to 34 Years | 614 (92.0%) | 491 (69.7%) |
| 35 to 44 Years | 366 (92.7%) | 274 (63.0%) |
| 45 to 54 Years | 352 (90.3%) | 501 (73.7%) |
| 55 to 64 Years | 439 (88.7%) | 490 (67.6%) |
| 65 to 74 Years | 300 (77.5%) | 380 (80.7%) |
| 75 Years and over | 187 (85.4%) | 473 (92.6%) |
| Total | 3,735 (80.2%) | 3,846 (72.4%) |
Income Below Poverty Among Married-Couple Families in Cairo
The poverty statistics for married-couple families in Cairo show that 1.7% or 17 of the total 1,029 families live below the poverty line. Families with 3 or 4 children have the highest poverty rate of 7.1%, comprising of 7 families. On the other hand, families with no children have the lowest poverty rate of 0.2%, which includes 1 families.
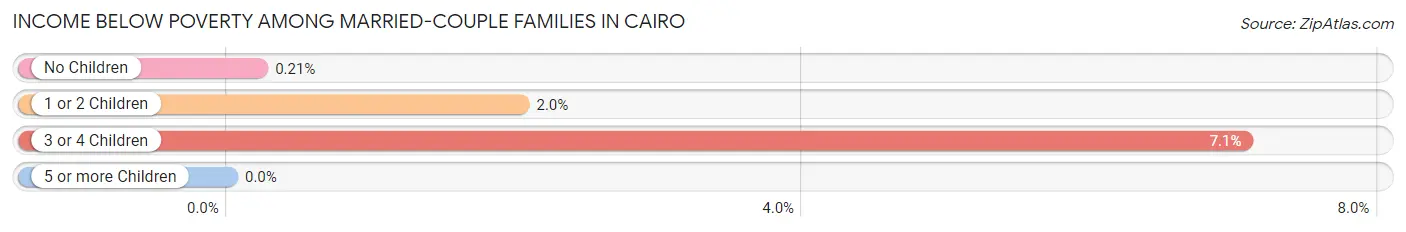
| Children | Above Poverty | Below Poverty |
| No Children | 485 (99.8%) | 1 (0.2%) |
| 1 or 2 Children | 435 (98.0%) | 9 (2.0%) |
| 3 or 4 Children | 92 (92.9%) | 7 (7.1%) |
| 5 or more Children | 0 (0.0%) | 0 (0.0%) |
| Total | 1,012 (98.4%) | 17 (1.7%) |
Income Below Poverty Among Single-Parent Households in Cairo
According to the poverty data in Cairo, 14.8% or 39 single-father households and 42.7% or 380 single-mother households are living below the poverty line. Among single-father households, those with 5 or more children have the highest poverty rate, with 26 households (100.0%) experiencing poverty. Likewise, among single-mother households, those with 3 or 4 children have the highest poverty rate, with 206 households (92.8%) falling below the poverty line.
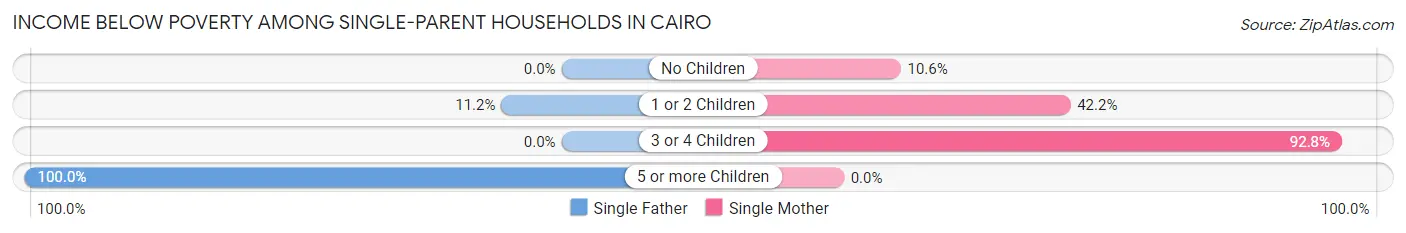
| Children | Single Father | Single Mother |
| No Children | 0 (0.0%) | 36 (10.6%) |
| 1 or 2 Children | 13 (11.2%) | 138 (42.2%) |
| 3 or 4 Children | 0 (0.0%) | 206 (92.8%) |
| 5 or more Children | 26 (100.0%) | 0 (0.0%) |
| Total | 39 (14.8%) | 380 (42.7%) |
Income Below Poverty Among Married-Couple vs Single-Parent Households in Cairo
The poverty data for Cairo shows that 17 of the married-couple family households (1.7%) and 419 of the single-parent households (36.4%) are living below the poverty level. Within the married-couple family households, those with 3 or 4 children have the highest poverty rate, with 7 households (7.1%) falling below the poverty line. Among the single-parent households, those with 5 or more children have the highest poverty rate, with 26 household (100.0%) living below poverty.
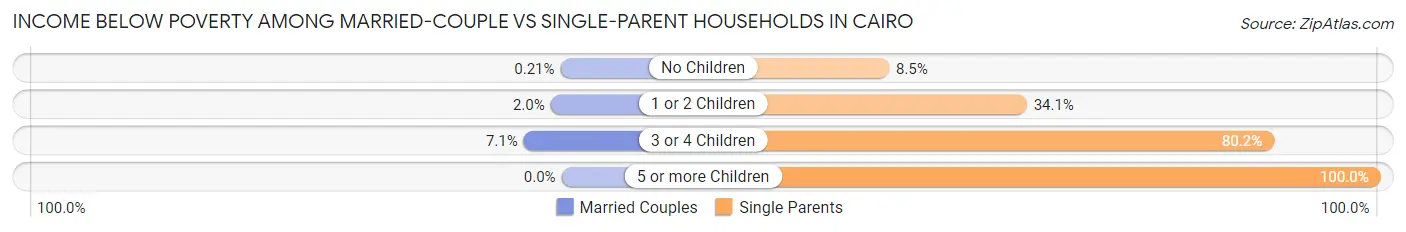
| Children | Married-Couple Families | Single-Parent Households |
| No Children | 1 (0.2%) | 36 (8.5%) |
| 1 or 2 Children | 9 (2.0%) | 151 (34.1%) |
| 3 or 4 Children | 7 (7.1%) | 206 (80.2%) |
| 5 or more Children | 0 (0.0%) | 26 (100.0%) |
| Total | 17 (1.7%) | 419 (36.4%) |
Race in Cairo
The most populous races in Cairo are Black / African American (4,707 | 46.7%), White / Caucasian (4,488 | 44.5%), and Hispanic or Latino (1,290 | 12.8%).
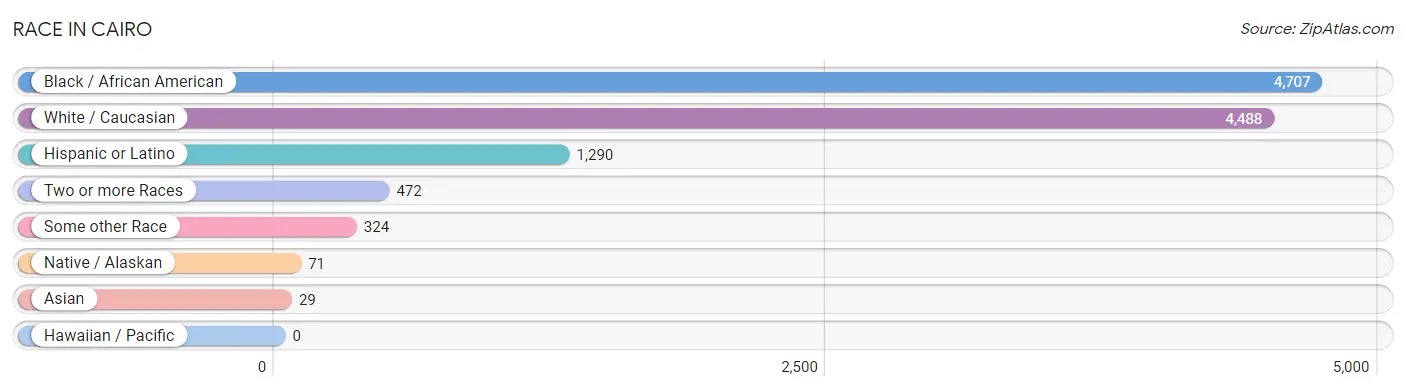
| Race | # Population | % Population |
| Asian | 29 | 0.3% |
| Black / African American | 4,707 | 46.7% |
| Hawaiian / Pacific | 0 | 0.0% |
| Hispanic or Latino | 1,290 | 12.8% |
| Native / Alaskan | 71 | 0.7% |
| White / Caucasian | 4,488 | 44.5% |
| Two or more Races | 472 | 4.7% |
| Some other Race | 324 | 3.2% |
| Total | 10,091 | 100.0% |
Ancestry in Cairo
The most populous ancestries reported in Cairo are Irish (938 | 9.3%), Mexican (901 | 8.9%), American (452 | 4.5%), English (367 | 3.6%), and Central American (310 | 3.1%), together accounting for 29.4% of all Cairo residents.
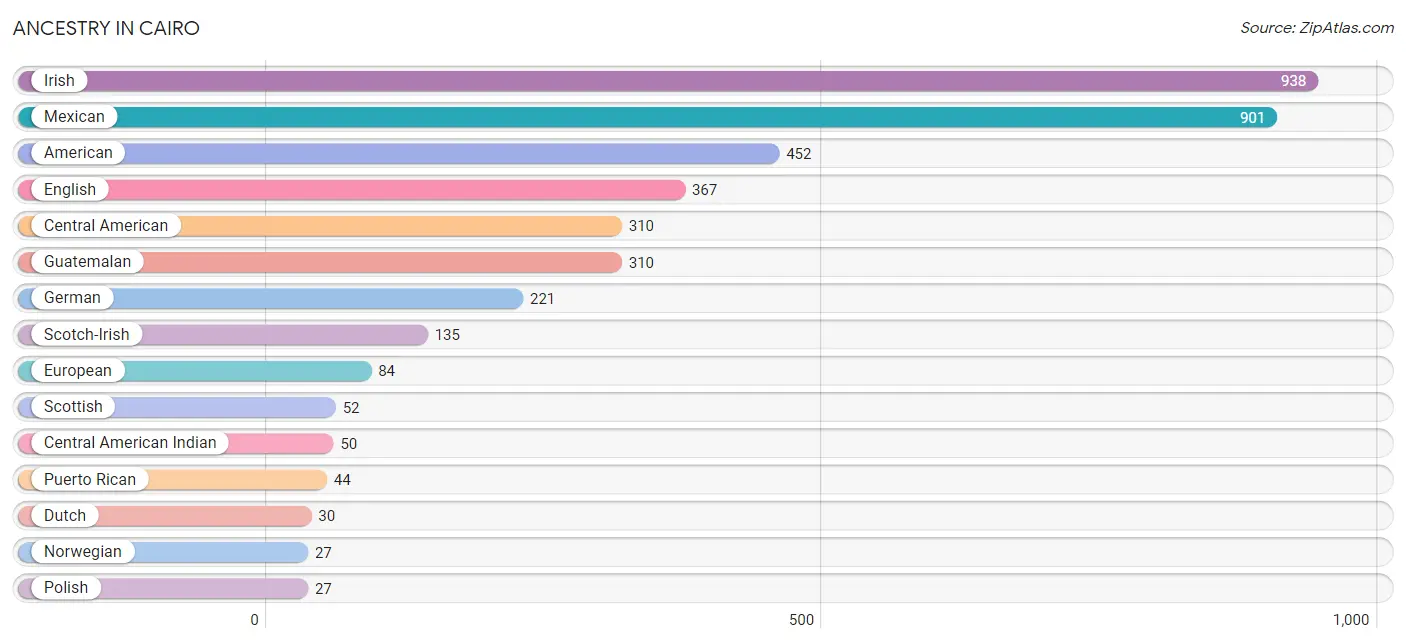
| Ancestry | # Population | % Population |
| American | 452 | 4.5% |
| British | 9 | 0.1% |
| Canadian | 16 | 0.2% |
| Central American | 310 | 3.1% |
| Central American Indian | 50 | 0.5% |
| Cherokee | 19 | 0.2% |
| Creek | 17 | 0.2% |
| Dutch | 30 | 0.3% |
| English | 367 | 3.6% |
| European | 84 | 0.8% |
| French | 11 | 0.1% |
| German | 221 | 2.2% |
| Greek | 3 | 0.0% |
| Guatemalan | 310 | 3.1% |
| Hungarian | 10 | 0.1% |
| Irish | 938 | 9.3% |
| Italian | 18 | 0.2% |
| Korean | 15 | 0.2% |
| Mexican | 901 | 8.9% |
| Norwegian | 27 | 0.3% |
| Peruvian | 7 | 0.1% |
| Polish | 27 | 0.3% |
| Puerto Rican | 44 | 0.4% |
| Russian | 4 | 0.0% |
| Scotch-Irish | 135 | 1.3% |
| Scottish | 52 | 0.5% |
| South American | 7 | 0.1% |
| Sri Lankan | 16 | 0.2% |
| Swedish | 11 | 0.1% |
| Swiss | 9 | 0.1% | View All 30 Rows |
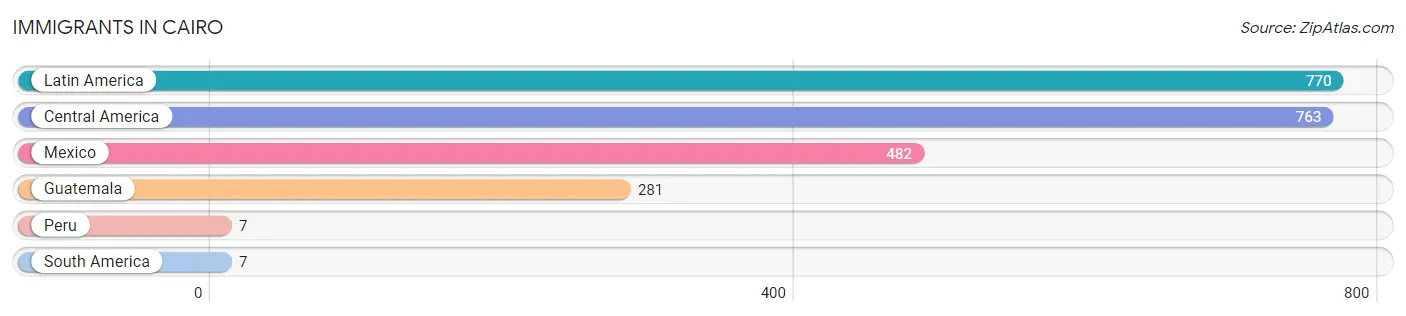
Immigrants in Cairo
The most numerous immigrant groups reported in Cairo came from Latin America (770 | 7.6%), Central America (763 | 7.6%), Mexico (482 | 4.8%), Guatemala (281 | 2.8%), and Peru (7 | 0.1%), together accounting for 22.8% of all Cairo residents.
| Immigration Origin | # Population | % Population |
| Central America | 763 | 7.6% |
| Guatemala | 281 | 2.8% |
| Latin America | 770 | 7.6% |
| Mexico | 482 | 4.8% |
| Peru | 7 | 0.1% |
| South America | 7 | 0.1% | View All 6 Rows |
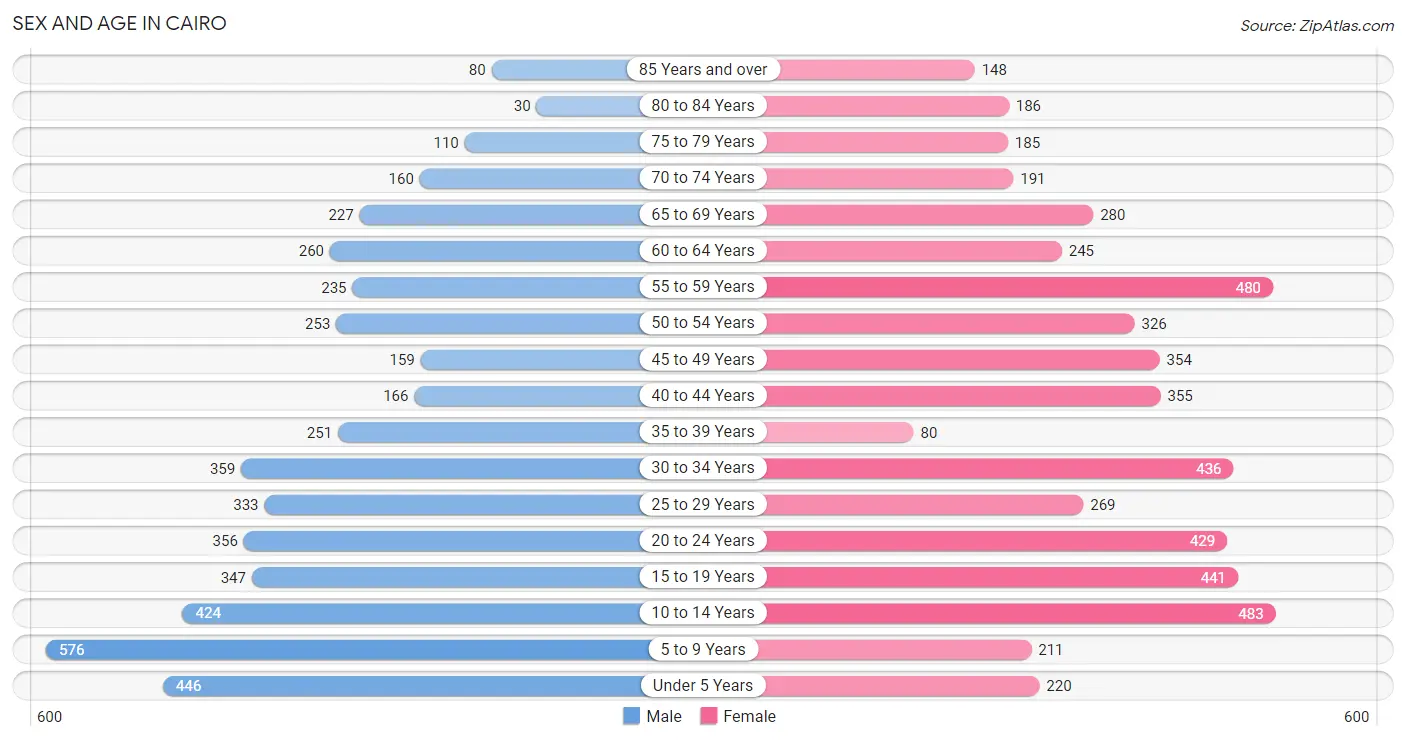
Sex and Age in Cairo
Sex and Age in Cairo
The most populous age groups in Cairo are 5 to 9 Years (576 | 12.1%) for men and 10 to 14 Years (483 | 9.1%) for women.
| Age Bracket | Male | Female |
| Under 5 Years | 446 (9.3%) | 220 (4.1%) |
| 5 to 9 Years | 576 (12.1%) | 211 (4.0%) |
| 10 to 14 Years | 424 (8.9%) | 483 (9.1%) |
| 15 to 19 Years | 347 (7.3%) | 441 (8.3%) |
| 20 to 24 Years | 356 (7.5%) | 429 (8.1%) |
| 25 to 29 Years | 333 (7.0%) | 269 (5.1%) |
| 30 to 34 Years | 359 (7.5%) | 436 (8.2%) |
| 35 to 39 Years | 251 (5.3%) | 80 (1.5%) |
| 40 to 44 Years | 166 (3.5%) | 355 (6.7%) |
| 45 to 49 Years | 159 (3.3%) | 354 (6.7%) |
| 50 to 54 Years | 253 (5.3%) | 326 (6.1%) |
| 55 to 59 Years | 235 (4.9%) | 480 (9.0%) |
| 60 to 64 Years | 260 (5.4%) | 245 (4.6%) |
| 65 to 69 Years | 227 (4.8%) | 280 (5.3%) |
| 70 to 74 Years | 160 (3.4%) | 191 (3.6%) |
| 75 to 79 Years | 110 (2.3%) | 185 (3.5%) |
| 80 to 84 Years | 30 (0.6%) | 186 (3.5%) |
| 85 Years and over | 80 (1.7%) | 148 (2.8%) |
| Total | 4,772 (100.0%) | 5,319 (100.0%) |
Families and Households in Cairo
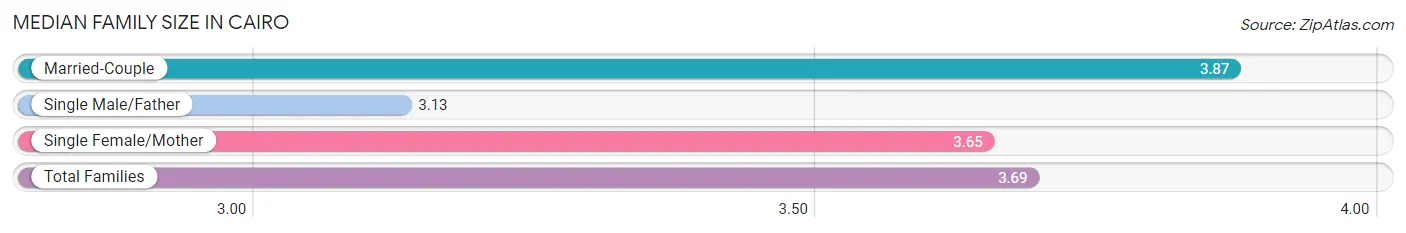
Median Family Size in Cairo
The median family size in Cairo is 3.69 persons per family, with married-couple families (1,029 | 47.2%) accounting for the largest median family size of 3.87 persons per family. On the other hand, single male/father families (263 | 12.1%) represent the smallest median family size with 3.13 persons per family.
| Family Type | # Families | Family Size |
| Married-Couple | 1,029 (47.2%) | 3.87 |
| Single Male/Father | 263 (12.1%) | 3.13 |
| Single Female/Mother | 889 (40.8%) | 3.65 |
| Total Families | 2,181 (100.0%) | 3.69 |
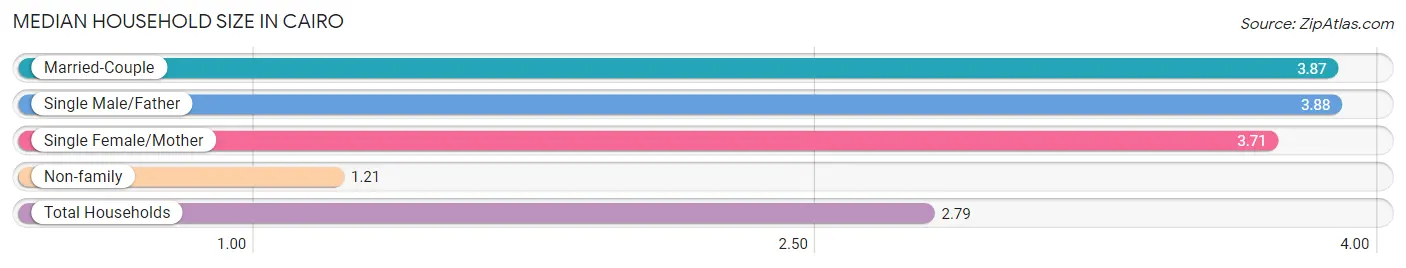
Median Household Size in Cairo
The median household size in Cairo is 2.79 persons per household, with single male/father households (263 | 7.3%) accounting for the largest median household size of 3.88 persons per household. non-family households (1,413 | 39.3%) represent the smallest median household size with 1.21 persons per household.
| Household Type | # Households | Household Size |
| Married-Couple | 1,029 (28.6%) | 3.87 |
| Single Male/Father | 263 (7.3%) | 3.88 |
| Single Female/Mother | 889 (24.7%) | 3.71 |
| Non-family | 1,413 (39.3%) | 1.21 |
| Total Households | 3,594 (100.0%) | 2.79 |
Household Size by Marriage Status in Cairo
Out of a total of 3,594 households in Cairo, 2,181 (60.7%) are family households, while 1,413 (39.3%) are nonfamily households. The most numerous type of family households are 2-person households, comprising 725, and the most common type of nonfamily households are 1-person households, comprising 1,227.
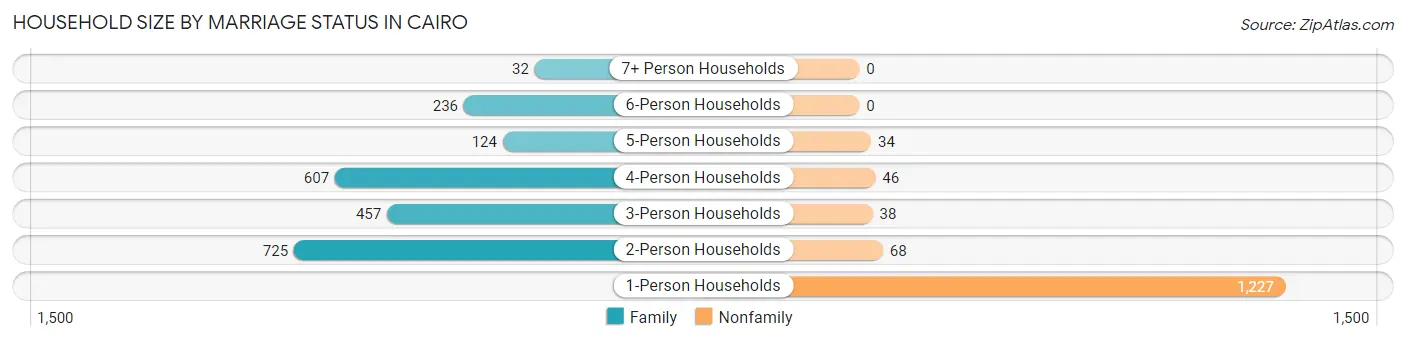
| Household Size | Family Households | Nonfamily Households |
| 1-Person Households | - | 1,227 (34.1%) |
| 2-Person Households | 725 (20.2%) | 68 (1.9%) |
| 3-Person Households | 457 (12.7%) | 38 (1.1%) |
| 4-Person Households | 607 (16.9%) | 46 (1.3%) |
| 5-Person Households | 124 (3.5%) | 34 (0.9%) |
| 6-Person Households | 236 (6.6%) | 0 (0.0%) |
| 7+ Person Households | 32 (0.9%) | 0 (0.0%) |
| Total | 2,181 (60.7%) | 1,413 (39.3%) |
Female Fertility in Cairo
Fertility by Age in Cairo
Average fertility rate in Cairo is 44.0 births per 1,000 women. Women in the age bracket of 20 to 34 years have the highest fertility rate with 78.0 births per 1,000 women. Women in the age bracket of 20 to 34 years acount for 84.0% of all women with births.
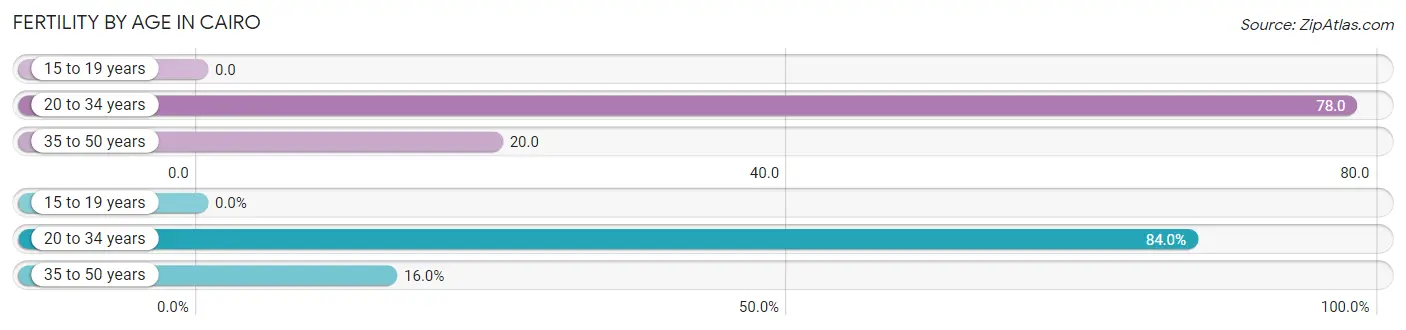
| Age Bracket | Women with Births | Births / 1,000 Women |
| 15 to 19 years | 0 (0.0%) | 0.0 |
| 20 to 34 years | 89 (84.0%) | 78.0 |
| 35 to 50 years | 17 (16.0%) | 20.0 |
| Total | 106 (100.0%) | 44.0 |
Fertility by Age by Marriage Status in Cairo
31.1% of women with births (106) in Cairo are married. The highest percentage of unmarried women with births falls into 20 to 34 years age bracket with 82.0% of them unmarried at the time of birth, while the lowest percentage of unmarried women with births belong to 35 to 50 years age bracket with 0.0% of them unmarried.
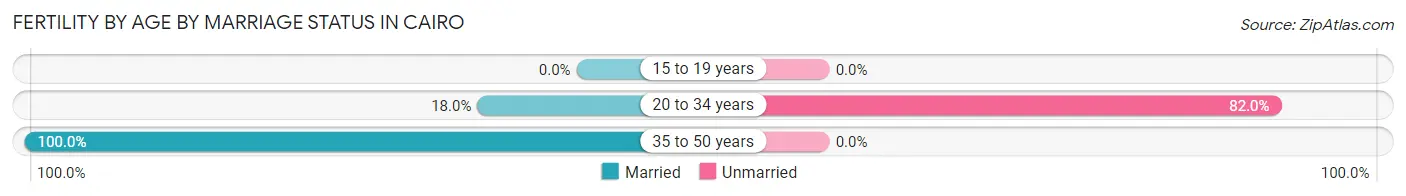
| Age Bracket | Married | Unmarried |
| 15 to 19 years | 0 (0.0%) | 0 (0.0%) |
| 20 to 34 years | 16 (18.0%) | 73 (82.0%) |
| 35 to 50 years | 17 (100.0%) | 0 (0.0%) |
| Total | 33 (31.1%) | 73 (68.9%) |
Fertility by Education in Cairo
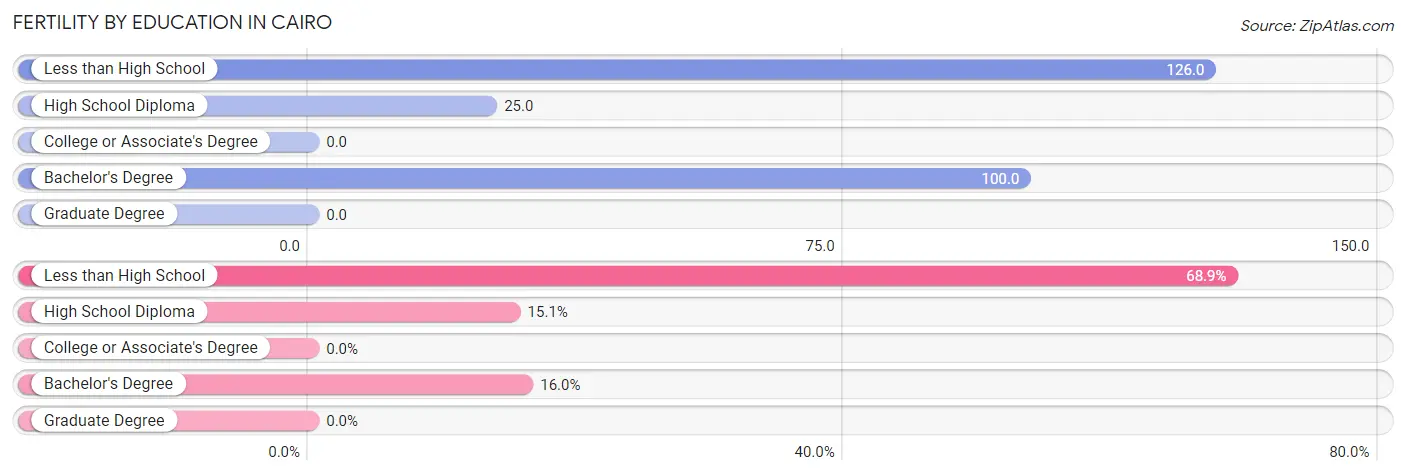
| Educational Attainment | Women with Births | Births / 1,000 Women |
| Less than High School | 73 (68.9%) | 126.0 |
| High School Diploma | 16 (15.1%) | 25.0 |
| College or Associate's Degree | 0 (0.0%) | 0.0 |
| Bachelor's Degree | 17 (16.0%) | 100.0 |
| Graduate Degree | 0 (0.0%) | 0.0 |
| Total | 106 (100.0%) | 44.0 |
Fertility by Education by Marriage Status in Cairo
68.9% of women with births in Cairo are unmarried. Women with the educational attainment of high school diploma are most likely to be married with 100.0% of them married at childbirth, while women with the educational attainment of less than high school are least likely to be married with 100.0% of them unmarried at childbirth.
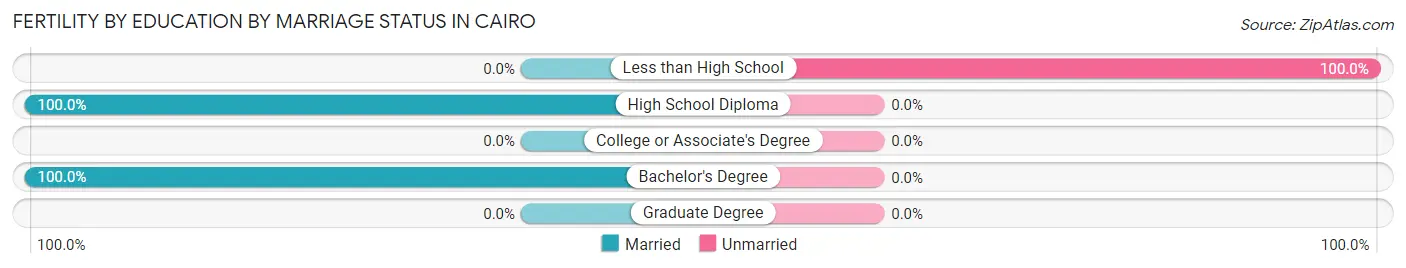
| Educational Attainment | Married | Unmarried |
| Less than High School | 0 (0.0%) | 73 (100.0%) |
| High School Diploma | 16 (100.0%) | 0 (0.0%) |
| College or Associate's Degree | 0 (0.0%) | 0 (0.0%) |
| Bachelor's Degree | 17 (100.0%) | 0 (0.0%) |
| Graduate Degree | 0 (0.0%) | 0 (0.0%) |
| Total | 33 (31.1%) | 73 (68.9%) |
Employment Characteristics in Cairo
Employment by Class of Employer in Cairo
Among the 3,689 employed individuals in Cairo, private company employees (2,651 | 71.9%), local government employees (409 | 11.1%), and not-for-profit organizations (270 | 7.3%) make up the most common classes of employment.
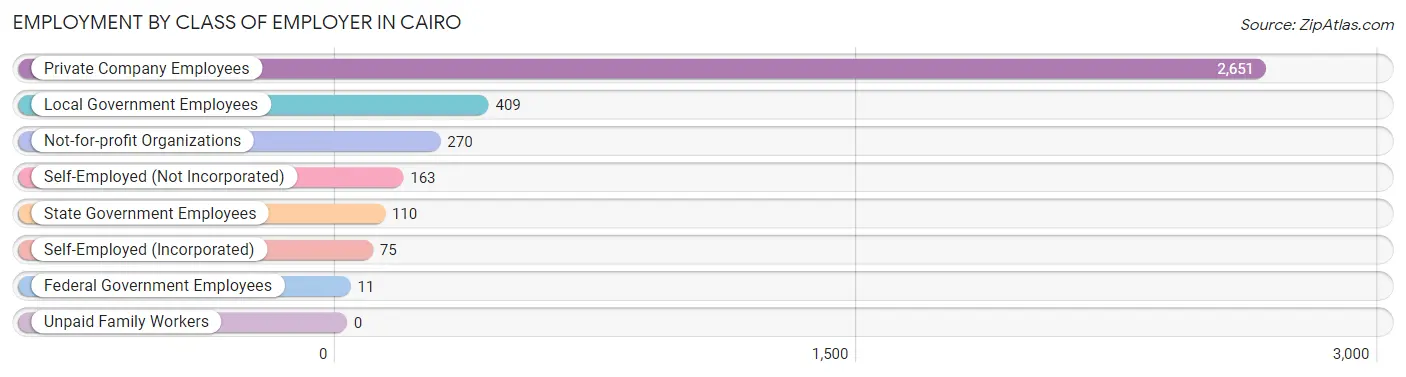
| Employer Class | # Employees | % Employees |
| Private Company Employees | 2,651 | 71.9% |
| Self-Employed (Incorporated) | 75 | 2.0% |
| Self-Employed (Not Incorporated) | 163 | 4.4% |
| Not-for-profit Organizations | 270 | 7.3% |
| Local Government Employees | 409 | 11.1% |
| State Government Employees | 110 | 3.0% |
| Federal Government Employees | 11 | 0.3% |
| Unpaid Family Workers | 0 | 0.0% |
| Total | 3,689 | 100.0% |
Employment Status by Age in Cairo
According to the labor force statistics for Cairo, out of the total population over 16 years of age (7,437), 56.2% or 4,180 individuals are in the labor force, with 7.6% or 318 of them unemployed. The age group with the highest labor force participation rate is 25 to 29 years, with 90.0% or 542 individuals in the labor force. Within the labor force, the 25 to 29 years age range has the highest percentage of unemployed individuals, with 22.5% or 122 of them being unemployed.
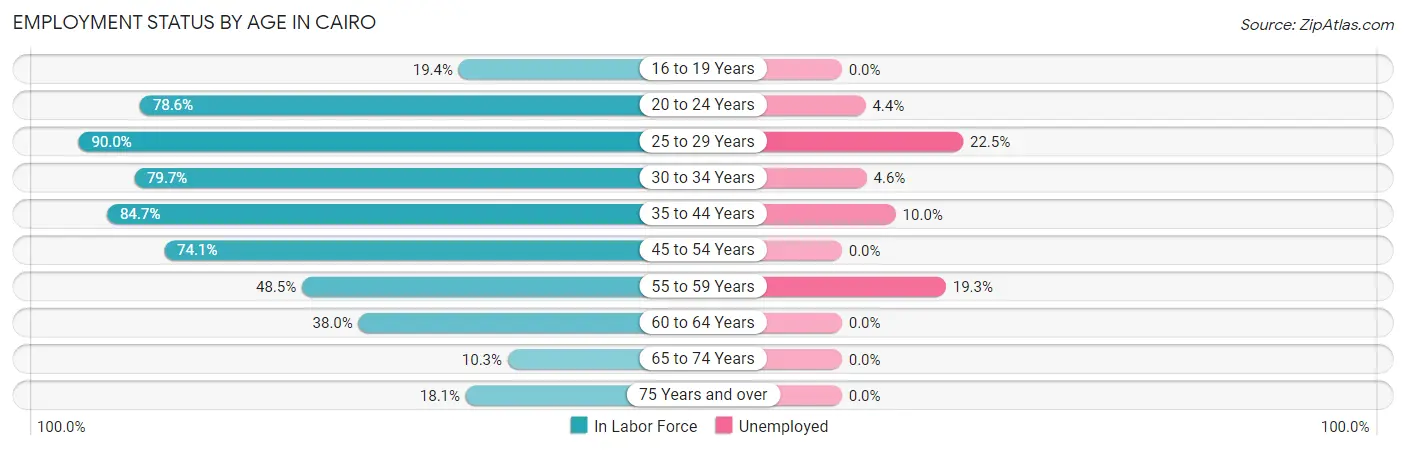
| Age Bracket | In Labor Force | Unemployed |
| 16 to 19 Years | 96 (19.4%) | 0 (0.0%) |
| 20 to 24 Years | 617 (78.6%) | 27 (4.4%) |
| 25 to 29 Years | 542 (90.0%) | 122 (22.5%) |
| 30 to 34 Years | 634 (79.7%) | 29 (4.6%) |
| 35 to 44 Years | 722 (84.7%) | 72 (10.0%) |
| 45 to 54 Years | 809 (74.1%) | 0 (0.0%) |
| 55 to 59 Years | 347 (48.5%) | 67 (19.3%) |
| 60 to 64 Years | 192 (38.0%) | 0 (0.0%) |
| 65 to 74 Years | 88 (10.3%) | 0 (0.0%) |
| 75 Years and over | 134 (18.1%) | 0 (0.0%) |
| Total | 4,180 (56.2%) | 318 (7.6%) |
Employment Status by Educational Attainment in Cairo
According to labor force statistics for Cairo, 71.2% of individuals (3,247) out of the total population between 25 and 64 years of age (4,561) are in the labor force, with 8.9% or 289 of them being unemployed. The group with the highest labor force participation rate are those with the educational attainment of bachelor's degree or higher, with 88.6% or 543 individuals in the labor force. Within the labor force, individuals with high school diploma education have the highest percentage of unemployment, with 17.9% or 189 of them being unemployed.
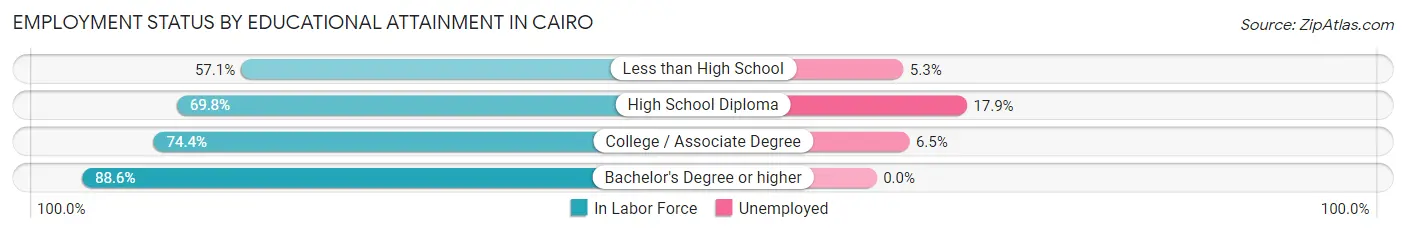
| Educational Attainment | In Labor Force | Unemployed |
| Less than High School | 548 (57.1%) | 51 (5.3%) |
| High School Diploma | 1,055 (69.8%) | 270 (17.9%) |
| College / Associate Degree | 1,100 (74.4%) | 96 (6.5%) |
| Bachelor's Degree or higher | 543 (88.6%) | 0 (0.0%) |
| Total | 3,247 (71.2%) | 406 (8.9%) |
Employment Occupations by Sex in Cairo
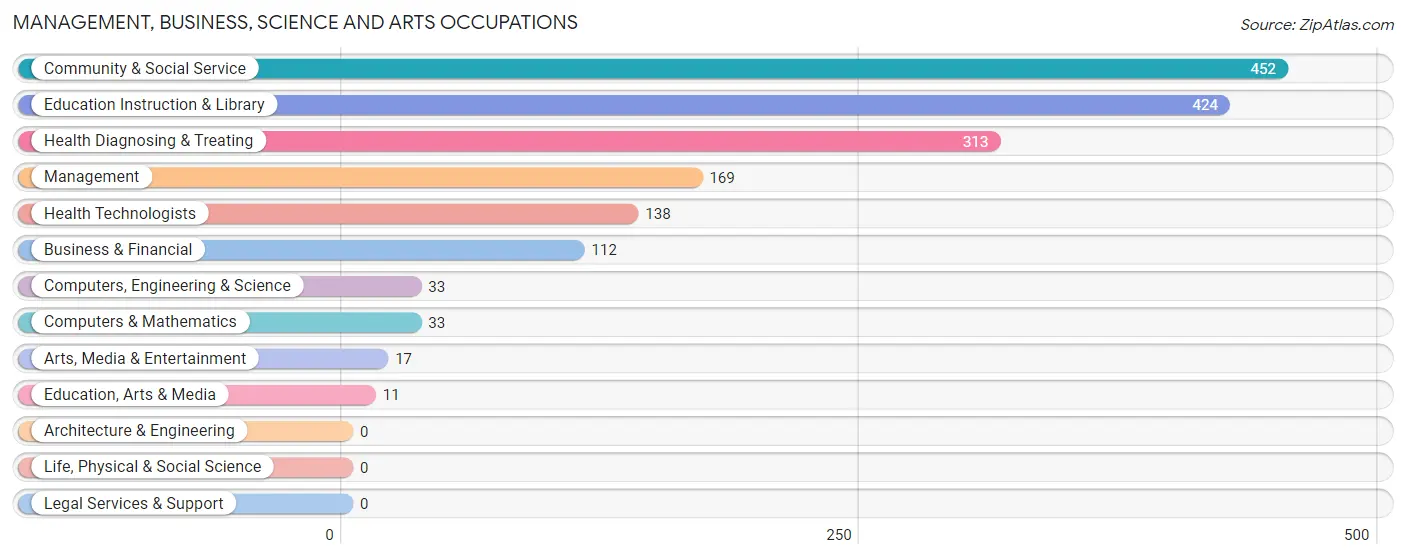
Management, Business, Science and Arts Occupations
The most common Management, Business, Science and Arts occupations in Cairo are Community & Social Service (452 | 11.7%), Education Instruction & Library (424 | 11.0%), Health Diagnosing & Treating (313 | 8.1%), Management (169 | 4.4%), and Health Technologists (138 | 3.6%).
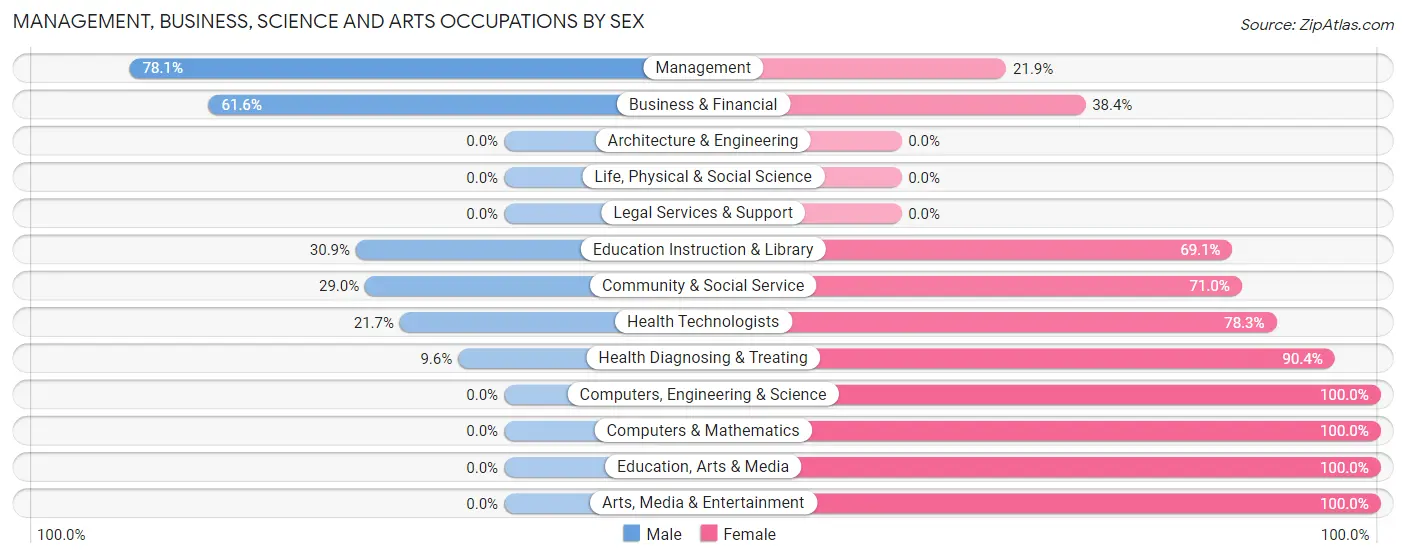
Management, Business, Science and Arts Occupations by Sex
Within the Management, Business, Science and Arts occupations in Cairo, the most male-oriented occupations are Management (78.1%), Business & Financial (61.6%), and Education Instruction & Library (30.9%), while the most female-oriented occupations are Computers, Engineering & Science (100.0%), Computers & Mathematics (100.0%), and Education, Arts & Media (100.0%).
| Occupation | Male | Female |
| Management | 132 (78.1%) | 37 (21.9%) |
| Business & Financial | 69 (61.6%) | 43 (38.4%) |
| Computers, Engineering & Science | 0 (0.0%) | 33 (100.0%) |
| Computers & Mathematics | 0 (0.0%) | 33 (100.0%) |
| Architecture & Engineering | 0 (0.0%) | 0 (0.0%) |
| Life, Physical & Social Science | 0 (0.0%) | 0 (0.0%) |
| Community & Social Service | 131 (29.0%) | 321 (71.0%) |
| Education, Arts & Media | 0 (0.0%) | 11 (100.0%) |
| Legal Services & Support | 0 (0.0%) | 0 (0.0%) |
| Education Instruction & Library | 131 (30.9%) | 293 (69.1%) |
| Arts, Media & Entertainment | 0 (0.0%) | 17 (100.0%) |
| Health Diagnosing & Treating | 30 (9.6%) | 283 (90.4%) |
| Health Technologists | 30 (21.7%) | 108 (78.3%) |
| Total (Category) | 362 (33.6%) | 717 (66.4%) |
| Total (Overall) | 1,693 (44.0%) | 2,153 (56.0%) |
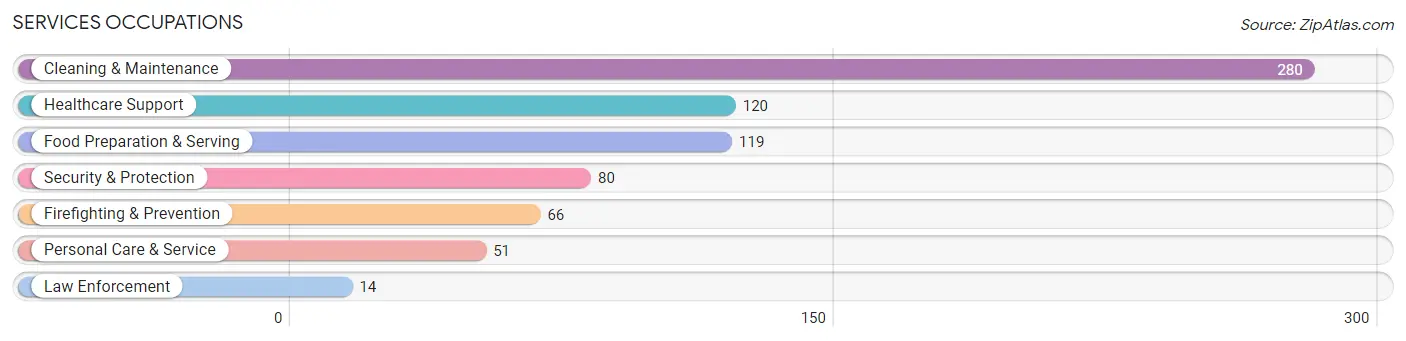
Services Occupations
The most common Services occupations in Cairo are Cleaning & Maintenance (280 | 7.3%), Healthcare Support (120 | 3.1%), Food Preparation & Serving (119 | 3.1%), Security & Protection (80 | 2.1%), and Firefighting & Prevention (66 | 1.7%).
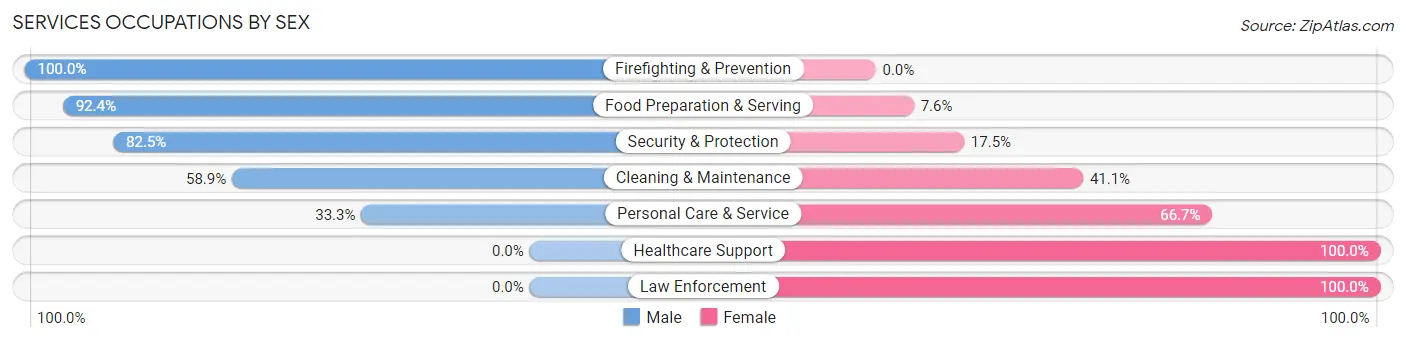
Services Occupations by Sex
Within the Services occupations in Cairo, the most male-oriented occupations are Firefighting & Prevention (100.0%), Food Preparation & Serving (92.4%), and Security & Protection (82.5%), while the most female-oriented occupations are Healthcare Support (100.0%), Law Enforcement (100.0%), and Personal Care & Service (66.7%).
| Occupation | Male | Female |
| Healthcare Support | 0 (0.0%) | 120 (100.0%) |
| Security & Protection | 66 (82.5%) | 14 (17.5%) |
| Firefighting & Prevention | 66 (100.0%) | 0 (0.0%) |
| Law Enforcement | 0 (0.0%) | 14 (100.0%) |
| Food Preparation & Serving | 110 (92.4%) | 9 (7.6%) |
| Cleaning & Maintenance | 165 (58.9%) | 115 (41.1%) |
| Personal Care & Service | 17 (33.3%) | 34 (66.7%) |
| Total (Category) | 358 (55.1%) | 292 (44.9%) |
| Total (Overall) | 1,693 (44.0%) | 2,153 (56.0%) |
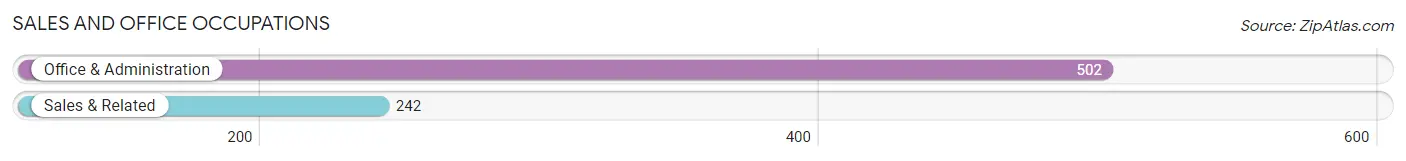
Sales and Office Occupations
The most common Sales and Office occupations in Cairo are Office & Administration (502 | 13.1%), and Sales & Related (242 | 6.3%).
Sales and Office Occupations by Sex
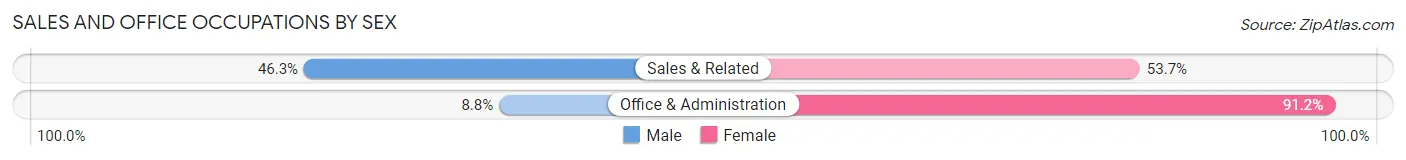
| Occupation | Male | Female |
| Sales & Related | 112 (46.3%) | 130 (53.7%) |
| Office & Administration | 44 (8.8%) | 458 (91.2%) |
| Total (Category) | 156 (21.0%) | 588 (79.0%) |
| Total (Overall) | 1,693 (44.0%) | 2,153 (56.0%) |
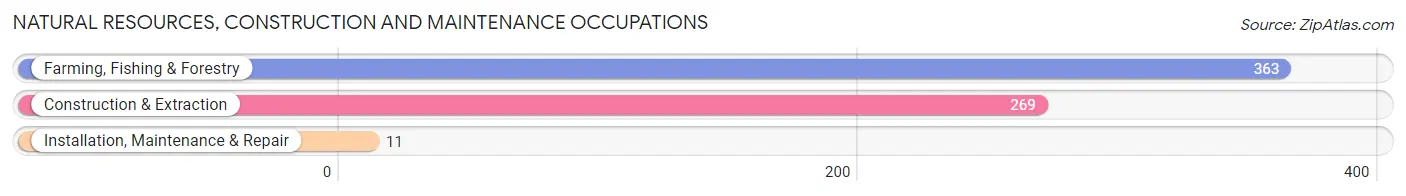
Natural Resources, Construction and Maintenance Occupations
The most common Natural Resources, Construction and Maintenance occupations in Cairo are Farming, Fishing & Forestry (363 | 9.4%), Construction & Extraction (269 | 7.0%), and Installation, Maintenance & Repair (11 | 0.3%).
Natural Resources, Construction and Maintenance Occupations by Sex
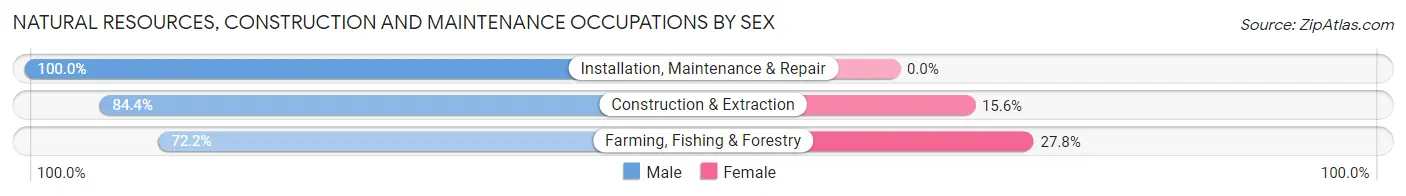
| Occupation | Male | Female |
| Farming, Fishing & Forestry | 262 (72.2%) | 101 (27.8%) |
| Construction & Extraction | 227 (84.4%) | 42 (15.6%) |
| Installation, Maintenance & Repair | 11 (100.0%) | 0 (0.0%) |
| Total (Category) | 500 (77.8%) | 143 (22.2%) |
| Total (Overall) | 1,693 (44.0%) | 2,153 (56.0%) |
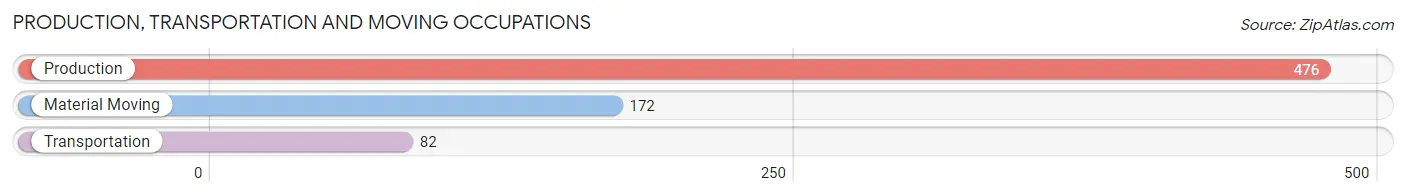
Production, Transportation and Moving Occupations
The most common Production, Transportation and Moving occupations in Cairo are Production (476 | 12.4%), Material Moving (172 | 4.5%), and Transportation (82 | 2.1%).
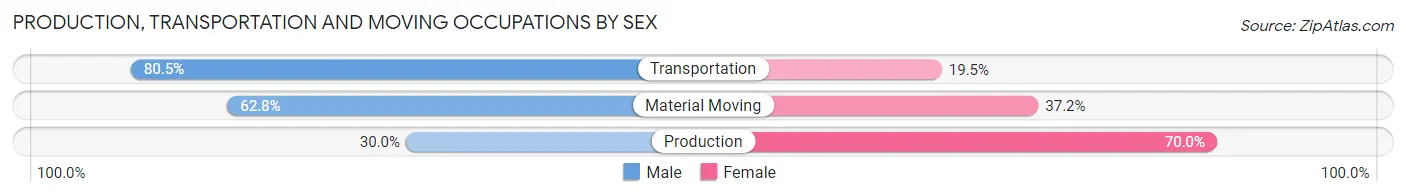
Production, Transportation and Moving Occupations by Sex
| Occupation | Male | Female |
| Production | 143 (30.0%) | 333 (70.0%) |
| Transportation | 66 (80.5%) | 16 (19.5%) |
| Material Moving | 108 (62.8%) | 64 (37.2%) |
| Total (Category) | 317 (43.4%) | 413 (56.6%) |
| Total (Overall) | 1,693 (44.0%) | 2,153 (56.0%) |
Employment Industries by Sex in Cairo
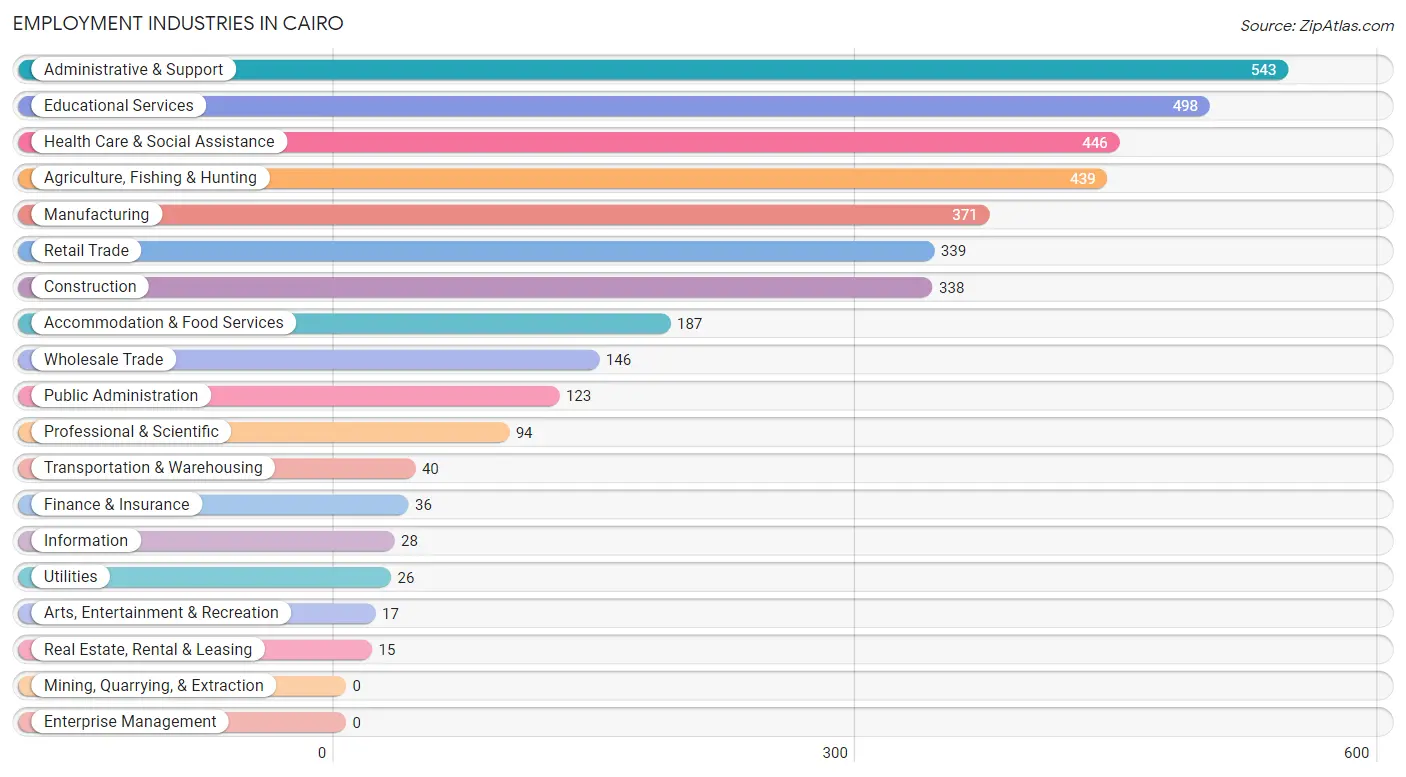
Employment Industries in Cairo
The major employment industries in Cairo include Administrative & Support (543 | 14.1%), Educational Services (498 | 13.0%), Health Care & Social Assistance (446 | 11.6%), Agriculture, Fishing & Hunting (439 | 11.4%), and Manufacturing (371 | 9.7%).
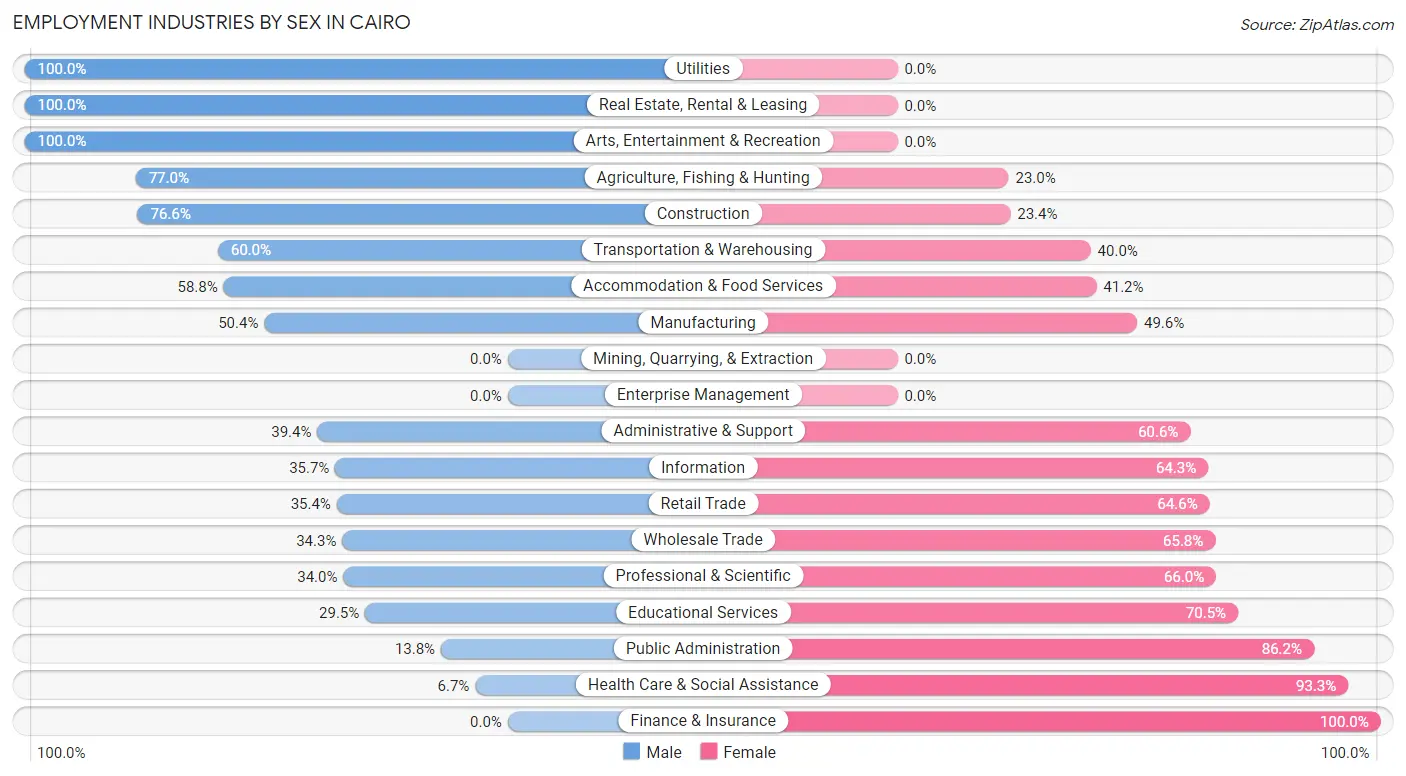
Employment Industries by Sex in Cairo
The Cairo industries that see more men than women are Utilities (100.0%), Real Estate, Rental & Leasing (100.0%), and Arts, Entertainment & Recreation (100.0%), whereas the industries that tend to have a higher number of women are Finance & Insurance (100.0%), Health Care & Social Assistance (93.3%), and Public Administration (86.2%).
| Industry | Male | Female |
| Agriculture, Fishing & Hunting | 338 (77.0%) | 101 (23.0%) |
| Mining, Quarrying, & Extraction | 0 (0.0%) | 0 (0.0%) |
| Construction | 259 (76.6%) | 79 (23.4%) |
| Manufacturing | 187 (50.4%) | 184 (49.6%) |
| Wholesale Trade | 50 (34.3%) | 96 (65.7%) |
| Retail Trade | 120 (35.4%) | 219 (64.6%) |
| Transportation & Warehousing | 24 (60.0%) | 16 (40.0%) |
| Utilities | 26 (100.0%) | 0 (0.0%) |
| Information | 10 (35.7%) | 18 (64.3%) |
| Finance & Insurance | 0 (0.0%) | 36 (100.0%) |
| Real Estate, Rental & Leasing | 15 (100.0%) | 0 (0.0%) |
| Professional & Scientific | 32 (34.0%) | 62 (66.0%) |
| Enterprise Management | 0 (0.0%) | 0 (0.0%) |
| Administrative & Support | 214 (39.4%) | 329 (60.6%) |
| Educational Services | 147 (29.5%) | 351 (70.5%) |
| Health Care & Social Assistance | 30 (6.7%) | 416 (93.3%) |
| Arts, Entertainment & Recreation | 17 (100.0%) | 0 (0.0%) |
| Accommodation & Food Services | 110 (58.8%) | 77 (41.2%) |
| Public Administration | 17 (13.8%) | 106 (86.2%) |
| Total | 1,693 (44.0%) | 2,153 (56.0%) |
Education in Cairo
School Enrollment in Cairo
The most common levels of schooling among the 2,866 students in Cairo are middle school (758 | 26.5%), elementary school (661 | 23.1%), and high school (629 | 22.0%).
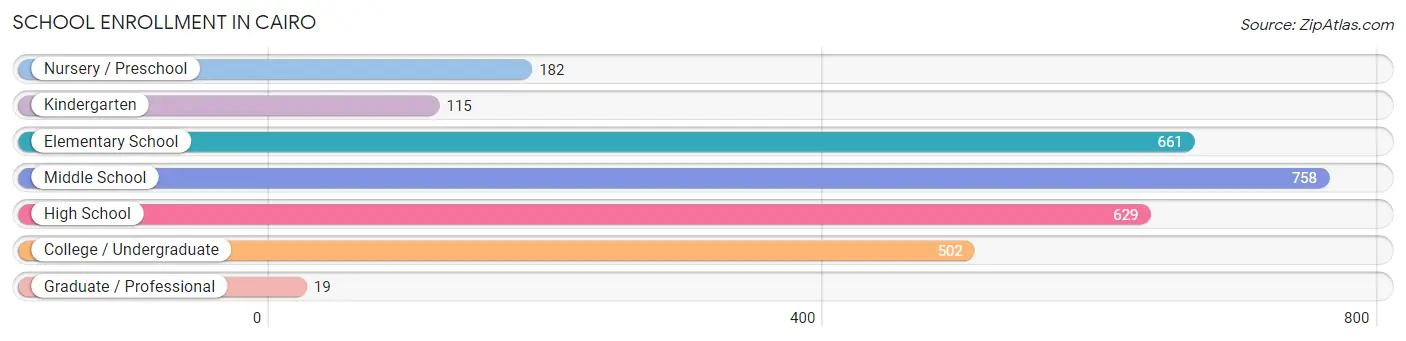
| School Level | # Students | % Students |
| Nursery / Preschool | 182 | 6.4% |
| Kindergarten | 115 | 4.0% |
| Elementary School | 661 | 23.1% |
| Middle School | 758 | 26.5% |
| High School | 629 | 22.0% |
| College / Undergraduate | 502 | 17.5% |
| Graduate / Professional | 19 | 0.7% |
| Total | 2,866 | 100.0% |
School Enrollment by Age by Funding Source in Cairo
Out of a total of 2,866 students who are enrolled in schools in Cairo, 401 (14.0%) attend a private institution, while the remaining 2,465 (86.0%) are enrolled in public schools. The age group of 20 to 24 year olds has the highest likelihood of being enrolled in private schools, with 128 (51.2% in the age bracket) enrolled. Conversely, the age group of 3 to 4 year olds has the lowest likelihood of being enrolled in a private school, with 119 (100.0% in the age bracket) attending a public institution.
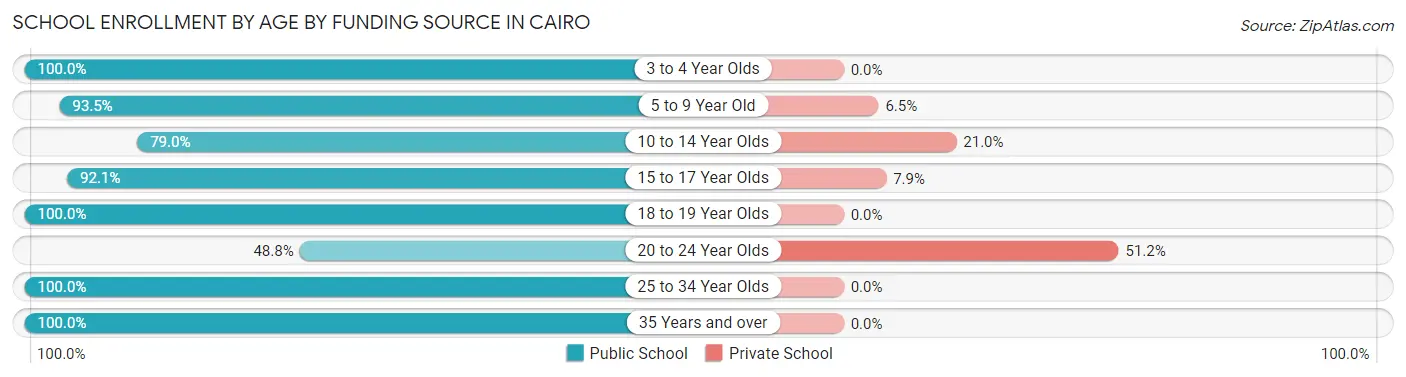
| Age Bracket | Public School | Private School |
| 3 to 4 Year Olds | 119 (100.0%) | 0 (0.0%) |
| 5 to 9 Year Old | 721 (93.5%) | 50 (6.5%) |
| 10 to 14 Year Olds | 689 (79.0%) | 183 (21.0%) |
| 15 to 17 Year Olds | 465 (92.1%) | 40 (7.9%) |
| 18 to 19 Year Olds | 174 (100.0%) | 0 (0.0%) |
| 20 to 24 Year Olds | 122 (48.8%) | 128 (51.2%) |
| 25 to 34 Year Olds | 127 (100.0%) | 0 (0.0%) |
| 35 Years and over | 48 (100.0%) | 0 (0.0%) |
| Total | 2,465 (86.0%) | 401 (14.0%) |
Educational Attainment by Field of Study in Cairo
Education (269 | 31.8%), arts & humanities (123 | 14.6%), business (119 | 14.1%), liberal arts & history (86 | 10.2%), and science & technology (65 | 7.7%) are the most common fields of study among 845 individuals in Cairo who have obtained a bachelor's degree or higher.
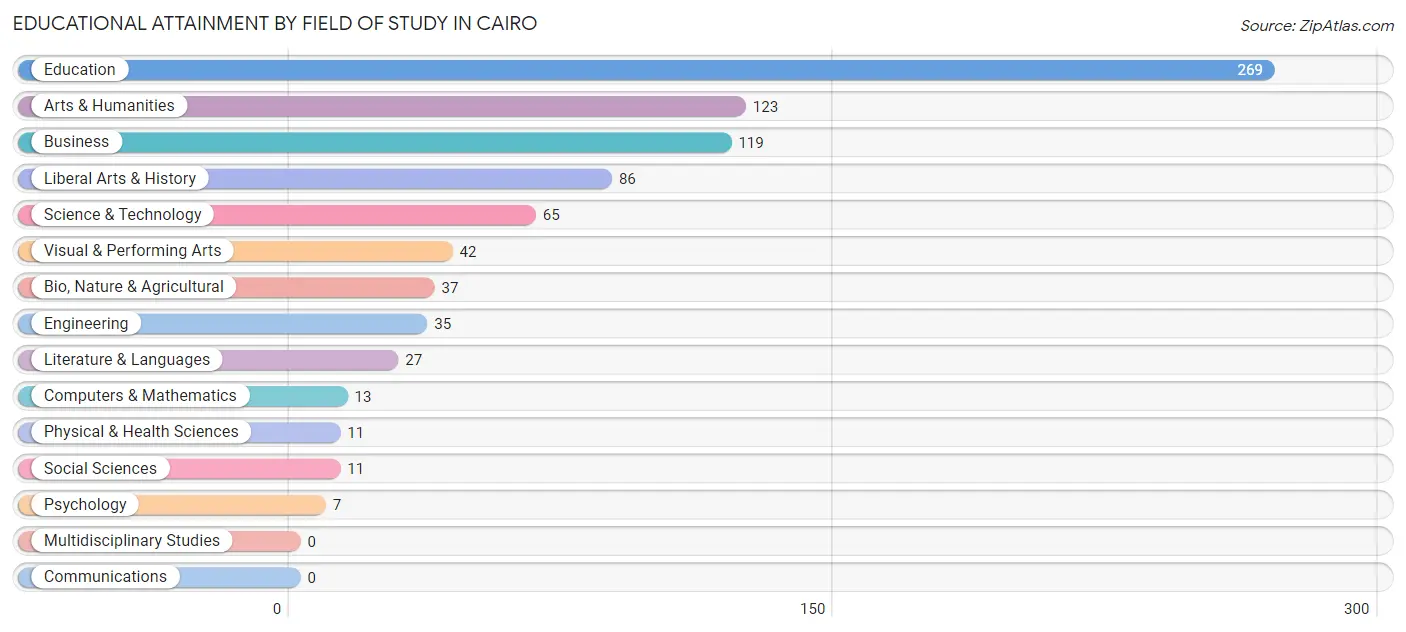
| Field of Study | # Graduates | % Graduates |
| Computers & Mathematics | 13 | 1.5% |
| Bio, Nature & Agricultural | 37 | 4.4% |
| Physical & Health Sciences | 11 | 1.3% |
| Psychology | 7 | 0.8% |
| Social Sciences | 11 | 1.3% |
| Engineering | 35 | 4.1% |
| Multidisciplinary Studies | 0 | 0.0% |
| Science & Technology | 65 | 7.7% |
| Business | 119 | 14.1% |
| Education | 269 | 31.8% |
| Literature & Languages | 27 | 3.2% |
| Liberal Arts & History | 86 | 10.2% |
| Visual & Performing Arts | 42 | 5.0% |
| Communications | 0 | 0.0% |
| Arts & Humanities | 123 | 14.6% |
| Total | 845 | 100.0% |
Transportation & Commute in Cairo
Vehicle Availability by Sex in Cairo
The most prevalent vehicle ownership categories in Cairo are males with 2 vehicles (703, accounting for 44.4%) and females with 2 vehicles (740, making up 33.4%).
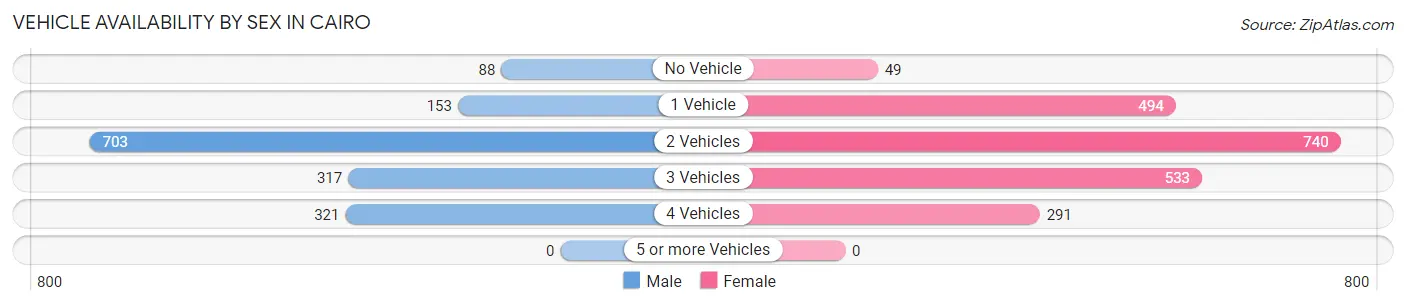
| Vehicles Available | Male | Female |
| No Vehicle | 88 (5.6%) | 49 (2.3%) |
| 1 Vehicle | 153 (9.7%) | 494 (23.4%) |
| 2 Vehicles | 703 (44.4%) | 740 (35.1%) |
| 3 Vehicles | 317 (20.0%) | 533 (25.3%) |
| 4 Vehicles | 321 (20.3%) | 291 (13.8%) |
| 5 or more Vehicles | 0 (0.0%) | 0 (0.0%) |
| Total | 1,582 (100.0%) | 2,107 (100.0%) |
Commute Time in Cairo
The most frequently occuring commute durations in Cairo are 5 to 9 minutes (728 commuters, 20.2%), 30 to 34 minutes (610 commuters, 16.9%), and 10 to 14 minutes (356 commuters, 9.9%).
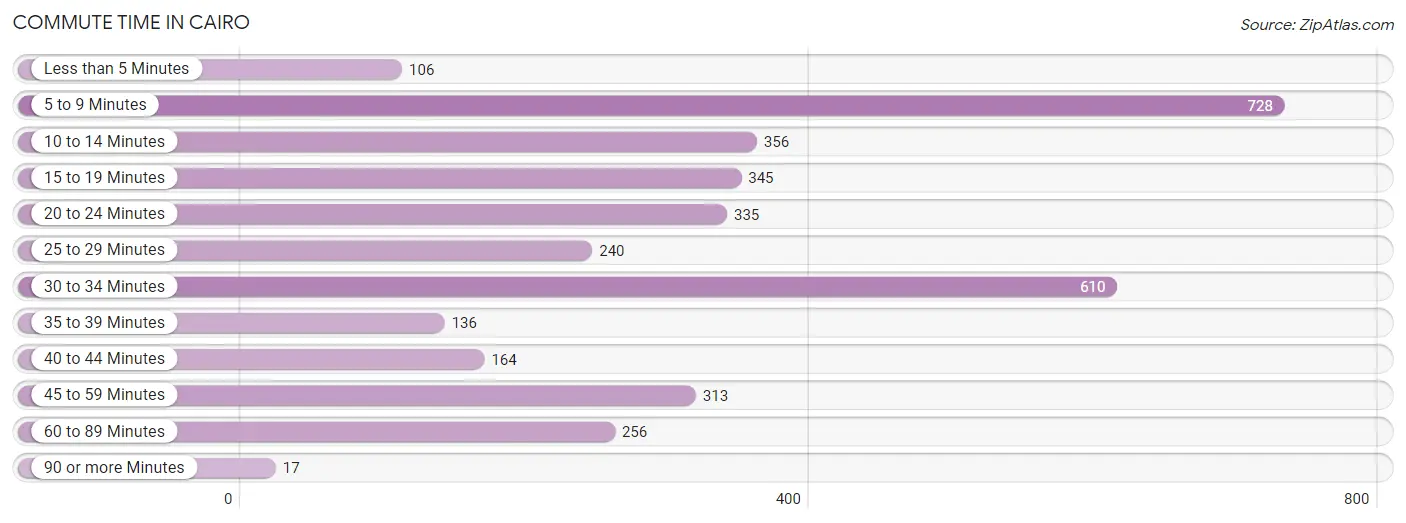
| Commute Time | # Commuters | % Commuters |
| Less than 5 Minutes | 106 | 2.9% |
| 5 to 9 Minutes | 728 | 20.2% |
| 10 to 14 Minutes | 356 | 9.9% |
| 15 to 19 Minutes | 345 | 9.6% |
| 20 to 24 Minutes | 335 | 9.3% |
| 25 to 29 Minutes | 240 | 6.7% |
| 30 to 34 Minutes | 610 | 16.9% |
| 35 to 39 Minutes | 136 | 3.8% |
| 40 to 44 Minutes | 164 | 4.5% |
| 45 to 59 Minutes | 313 | 8.7% |
| 60 to 89 Minutes | 256 | 7.1% |
| 90 or more Minutes | 17 | 0.5% |
Commute Time by Sex in Cairo
The most common commute times in Cairo are 5 to 9 minutes (329 commuters, 21.4%) for males and 5 to 9 minutes (399 commuters, 19.3%) for females.
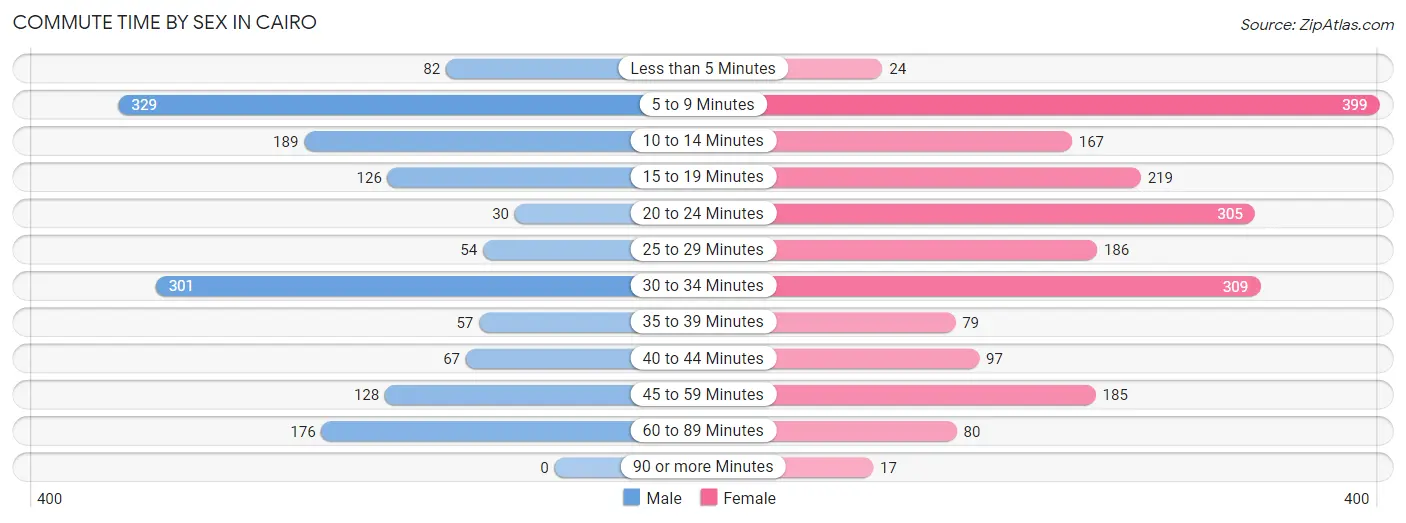
| Commute Time | Male | Female |
| Less than 5 Minutes | 82 (5.3%) | 24 (1.2%) |
| 5 to 9 Minutes | 329 (21.4%) | 399 (19.3%) |
| 10 to 14 Minutes | 189 (12.3%) | 167 (8.1%) |
| 15 to 19 Minutes | 126 (8.2%) | 219 (10.6%) |
| 20 to 24 Minutes | 30 (1.9%) | 305 (14.8%) |
| 25 to 29 Minutes | 54 (3.5%) | 186 (9.0%) |
| 30 to 34 Minutes | 301 (19.6%) | 309 (14.9%) |
| 35 to 39 Minutes | 57 (3.7%) | 79 (3.8%) |
| 40 to 44 Minutes | 67 (4.3%) | 97 (4.7%) |
| 45 to 59 Minutes | 128 (8.3%) | 185 (8.9%) |
| 60 to 89 Minutes | 176 (11.4%) | 80 (3.9%) |
| 90 or more Minutes | 0 (0.0%) | 17 (0.8%) |
Time of Departure to Work by Sex in Cairo
The most frequent times of departure to work in Cairo are 7:00 AM to 7:29 AM (334, 21.7%) for males and 7:00 AM to 7:29 AM (506, 24.5%) for females.
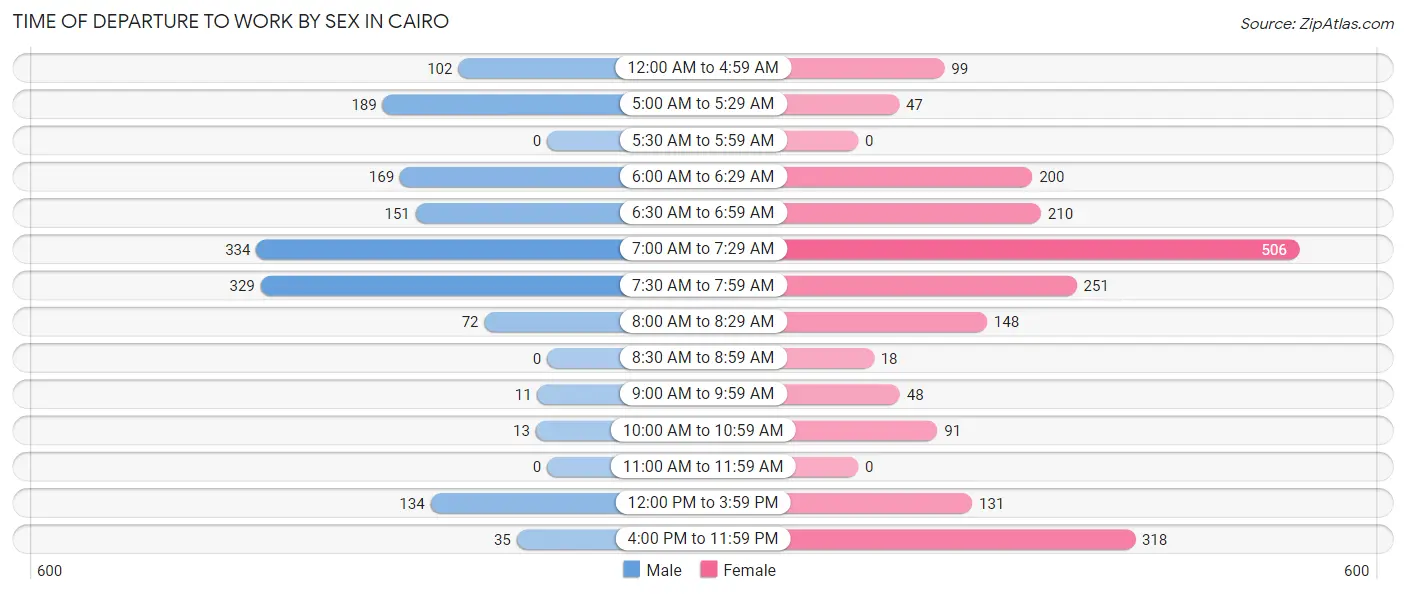
| Time of Departure | Male | Female |
| 12:00 AM to 4:59 AM | 102 (6.6%) | 99 (4.8%) |
| 5:00 AM to 5:29 AM | 189 (12.3%) | 47 (2.3%) |
| 5:30 AM to 5:59 AM | 0 (0.0%) | 0 (0.0%) |
| 6:00 AM to 6:29 AM | 169 (11.0%) | 200 (9.7%) |
| 6:30 AM to 6:59 AM | 151 (9.8%) | 210 (10.2%) |
| 7:00 AM to 7:29 AM | 334 (21.7%) | 506 (24.5%) |
| 7:30 AM to 7:59 AM | 329 (21.4%) | 251 (12.1%) |
| 8:00 AM to 8:29 AM | 72 (4.7%) | 148 (7.2%) |
| 8:30 AM to 8:59 AM | 0 (0.0%) | 18 (0.9%) |
| 9:00 AM to 9:59 AM | 11 (0.7%) | 48 (2.3%) |
| 10:00 AM to 10:59 AM | 13 (0.8%) | 91 (4.4%) |
| 11:00 AM to 11:59 AM | 0 (0.0%) | 0 (0.0%) |
| 12:00 PM to 3:59 PM | 134 (8.7%) | 131 (6.3%) |
| 4:00 PM to 11:59 PM | 35 (2.3%) | 318 (15.4%) |
| Total | 1,539 (100.0%) | 2,067 (100.0%) |
Housing Occupancy in Cairo
Occupancy by Ownership in Cairo
Of the total 3,594 dwellings in Cairo, owner-occupied units account for 1,748 (48.6%), while renter-occupied units make up 1,846 (51.4%).
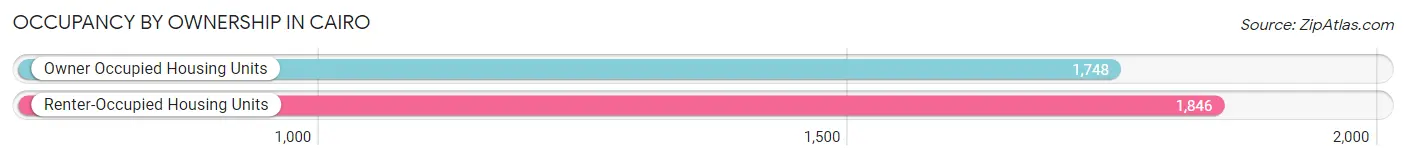
| Occupancy | # Housing Units | % Housing Units |
| Owner Occupied Housing Units | 1,748 | 48.6% |
| Renter-Occupied Housing Units | 1,846 | 51.4% |
| Total Occupied Housing Units | 3,594 | 100.0% |
Occupancy by Household Size in Cairo
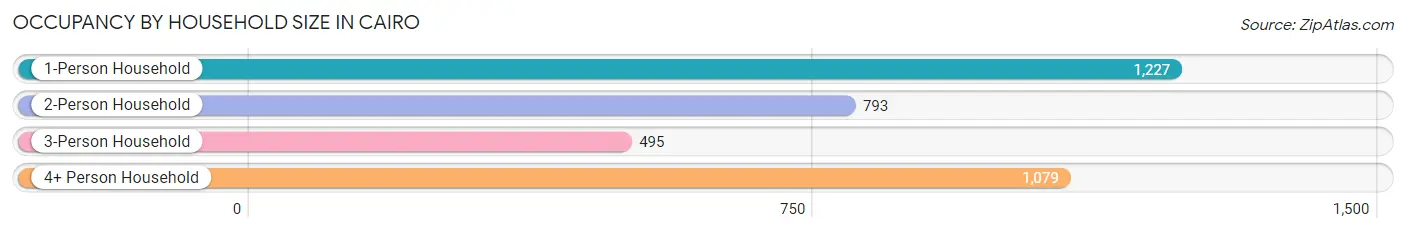
| Household Size | # Housing Units | % Housing Units |
| 1-Person Household | 1,227 | 34.1% |
| 2-Person Household | 793 | 22.1% |
| 3-Person Household | 495 | 13.8% |
| 4+ Person Household | 1,079 | 30.0% |
| Total Housing Units | 3,594 | 100.0% |
Occupancy by Ownership by Household Size in Cairo
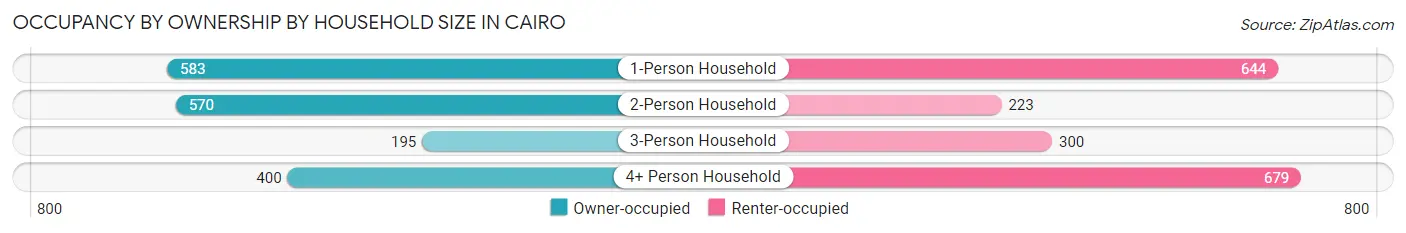
| Household Size | Owner-occupied | Renter-occupied |
| 1-Person Household | 583 (47.5%) | 644 (52.5%) |
| 2-Person Household | 570 (71.9%) | 223 (28.1%) |
| 3-Person Household | 195 (39.4%) | 300 (60.6%) |
| 4+ Person Household | 400 (37.1%) | 679 (62.9%) |
| Total Housing Units | 1,748 (48.6%) | 1,846 (51.4%) |
Occupancy by Educational Attainment in Cairo
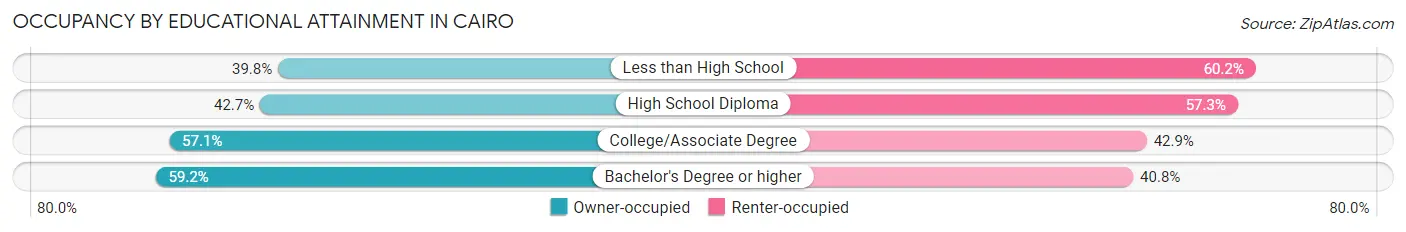
| Household Size | Owner-occupied | Renter-occupied |
| Less than High School | 283 (39.8%) | 428 (60.2%) |
| High School Diploma | 567 (42.7%) | 762 (57.3%) |
| College/Associate Degree | 600 (57.1%) | 451 (42.9%) |
| Bachelor's Degree or higher | 298 (59.2%) | 205 (40.8%) |
Occupancy by Age of Householder in Cairo
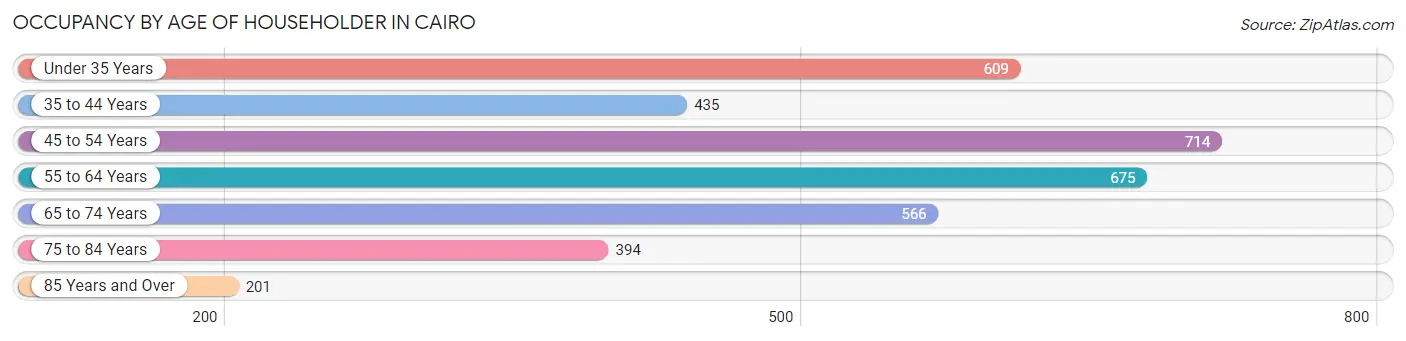
| Age Bracket | # Households | % Households |
| Under 35 Years | 609 | 16.9% |
| 35 to 44 Years | 435 | 12.1% |
| 45 to 54 Years | 714 | 19.9% |
| 55 to 64 Years | 675 | 18.8% |
| 65 to 74 Years | 566 | 15.8% |
| 75 to 84 Years | 394 | 11.0% |
| 85 Years and Over | 201 | 5.6% |
| Total | 3,594 | 100.0% |
Housing Finances in Cairo
Median Income by Occupancy in Cairo
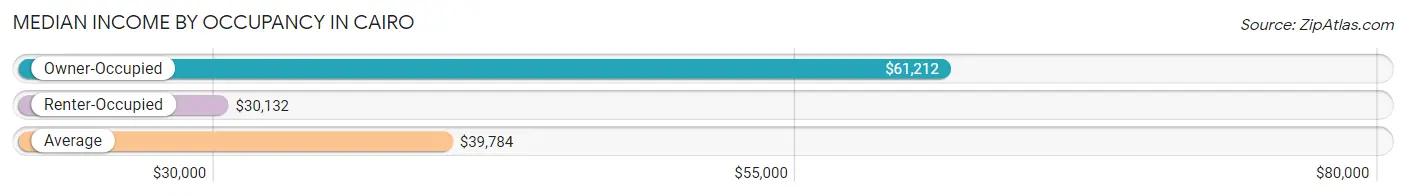
| Occupancy Type | # Households | Median Income |
| Owner-Occupied | 1,748 (48.6%) | $61,212 |
| Renter-Occupied | 1,846 (51.4%) | $30,132 |
| Average | 3,594 (100.0%) | $39,784 |
Occupancy by Householder Income Bracket in Cairo
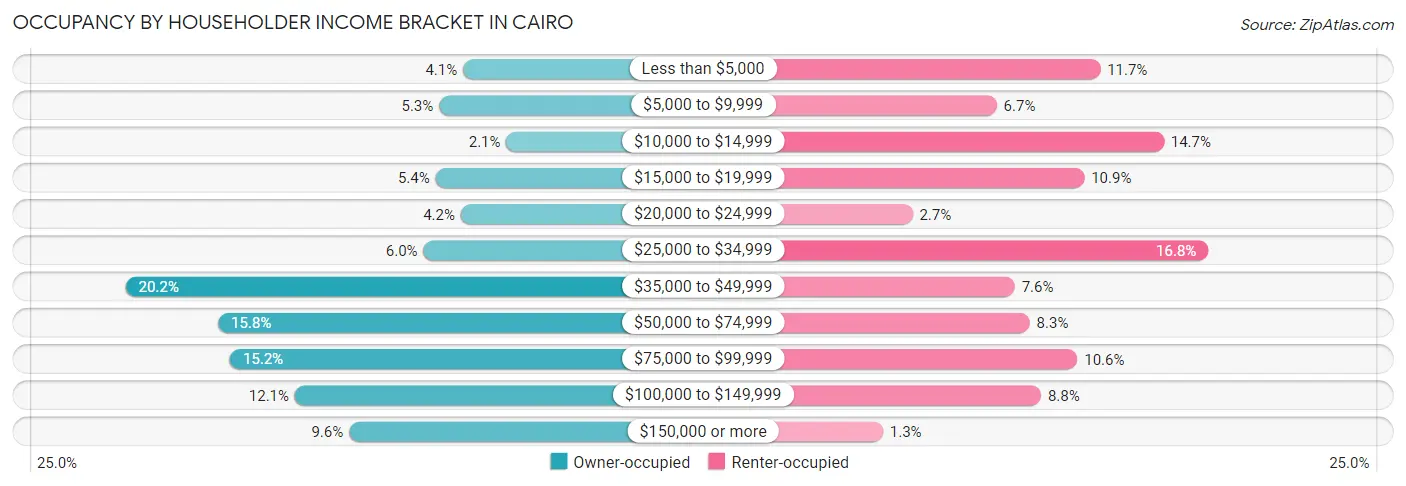
| Income Bracket | Owner-occupied | Renter-occupied |
| Less than $5,000 | 72 (4.1%) | 215 (11.7%) |
| $5,000 to $9,999 | 92 (5.3%) | 124 (6.7%) |
| $10,000 to $14,999 | 36 (2.1%) | 271 (14.7%) |
| $15,000 to $19,999 | 95 (5.4%) | 201 (10.9%) |
| $20,000 to $24,999 | 74 (4.2%) | 50 (2.7%) |
| $25,000 to $34,999 | 105 (6.0%) | 310 (16.8%) |
| $35,000 to $49,999 | 353 (20.2%) | 140 (7.6%) |
| $50,000 to $74,999 | 276 (15.8%) | 153 (8.3%) |
| $75,000 to $99,999 | 266 (15.2%) | 195 (10.6%) |
| $100,000 to $149,999 | 212 (12.1%) | 163 (8.8%) |
| $150,000 or more | 167 (9.6%) | 24 (1.3%) |
| Total | 1,748 (100.0%) | 1,846 (100.0%) |
Monthly Housing Cost Tiers in Cairo
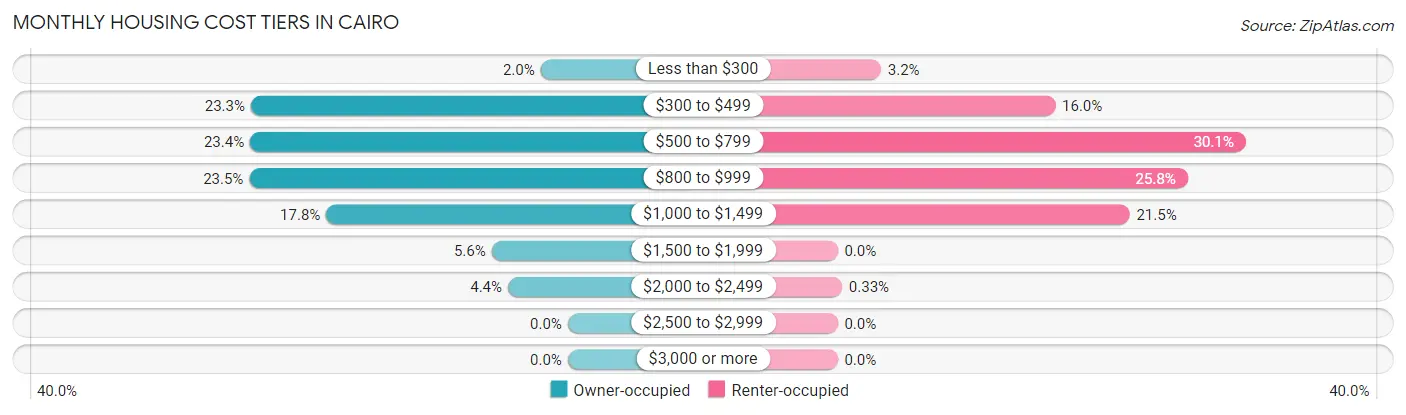
| Monthly Cost | Owner-occupied | Renter-occupied |
| Less than $300 | 35 (2.0%) | 59 (3.2%) |
| $300 to $499 | 408 (23.3%) | 296 (16.0%) |
| $500 to $799 | 409 (23.4%) | 555 (30.1%) |
| $800 to $999 | 410 (23.5%) | 476 (25.8%) |
| $1,000 to $1,499 | 311 (17.8%) | 397 (21.5%) |
| $1,500 to $1,999 | 98 (5.6%) | 0 (0.0%) |
| $2,000 to $2,499 | 77 (4.4%) | 6 (0.3%) |
| $2,500 to $2,999 | 0 (0.0%) | 0 (0.0%) |
| $3,000 or more | 0 (0.0%) | 0 (0.0%) |
| Total | 1,748 (100.0%) | 1,846 (100.0%) |
Physical Housing Characteristics in Cairo
Housing Structures in Cairo
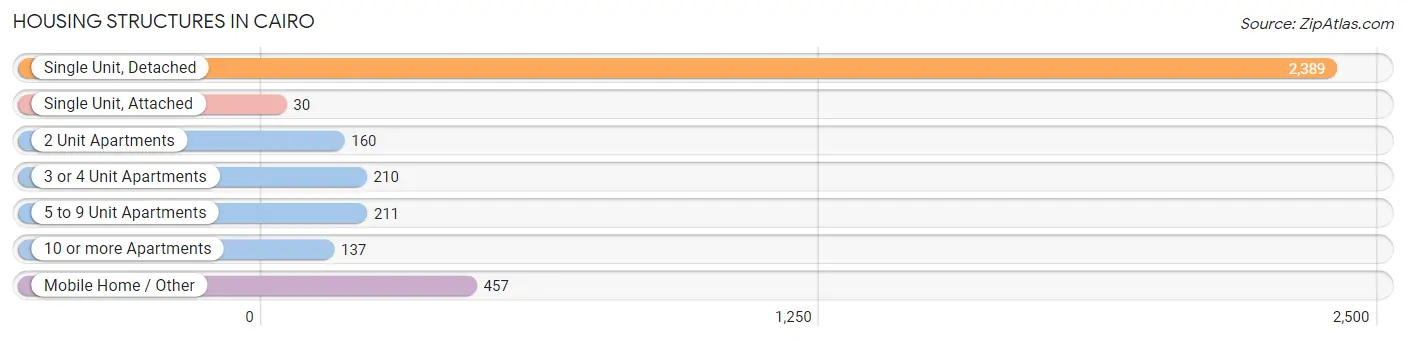
| Structure Type | # Housing Units | % Housing Units |
| Single Unit, Detached | 2,389 | 66.5% |
| Single Unit, Attached | 30 | 0.8% |
| 2 Unit Apartments | 160 | 4.4% |
| 3 or 4 Unit Apartments | 210 | 5.8% |
| 5 to 9 Unit Apartments | 211 | 5.9% |
| 10 or more Apartments | 137 | 3.8% |
| Mobile Home / Other | 457 | 12.7% |
| Total | 3,594 | 100.0% |
Housing Structures by Occupancy in Cairo
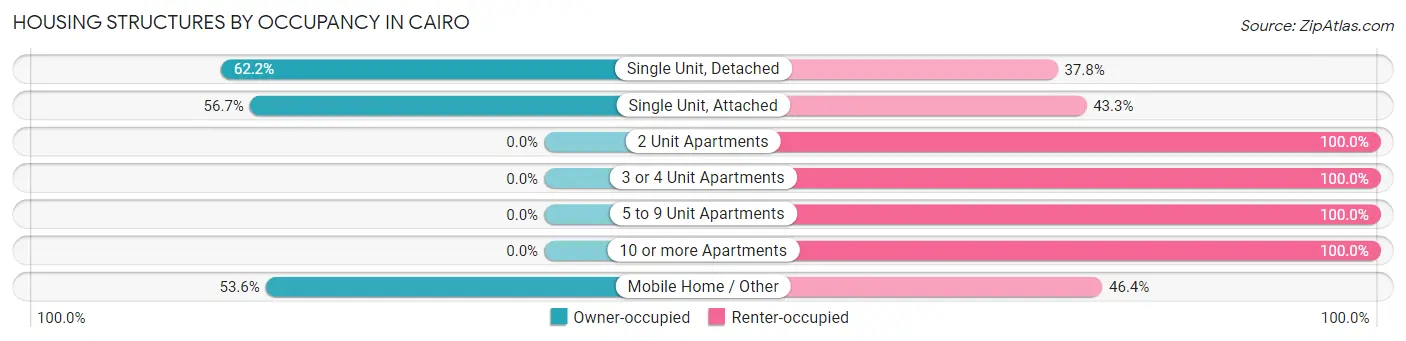
| Structure Type | Owner-occupied | Renter-occupied |
| Single Unit, Detached | 1,486 (62.2%) | 903 (37.8%) |
| Single Unit, Attached | 17 (56.7%) | 13 (43.3%) |
| 2 Unit Apartments | 0 (0.0%) | 160 (100.0%) |
| 3 or 4 Unit Apartments | 0 (0.0%) | 210 (100.0%) |
| 5 to 9 Unit Apartments | 0 (0.0%) | 211 (100.0%) |
| 10 or more Apartments | 0 (0.0%) | 137 (100.0%) |
| Mobile Home / Other | 245 (53.6%) | 212 (46.4%) |
| Total | 1,748 (48.6%) | 1,846 (51.4%) |
Housing Structures by Number of Rooms in Cairo
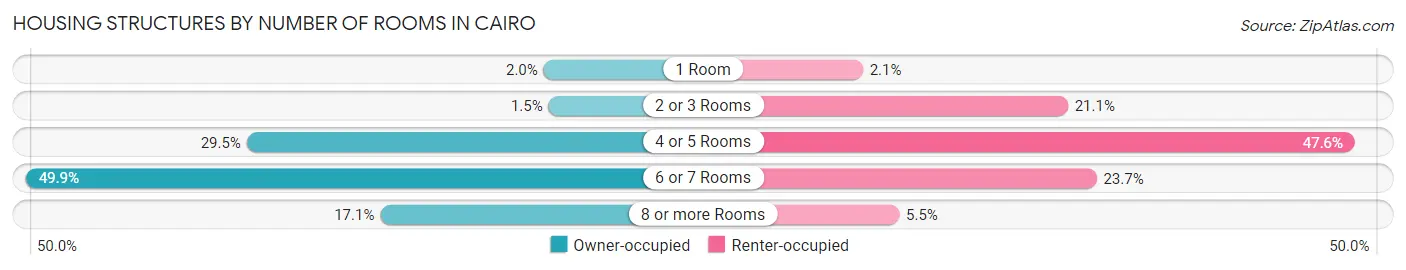
| Number of Rooms | Owner-occupied | Renter-occupied |
| 1 Room | 35 (2.0%) | 39 (2.1%) |
| 2 or 3 Rooms | 27 (1.5%) | 389 (21.1%) |
| 4 or 5 Rooms | 515 (29.5%) | 879 (47.6%) |
| 6 or 7 Rooms | 872 (49.9%) | 438 (23.7%) |
| 8 or more Rooms | 299 (17.1%) | 101 (5.5%) |
| Total | 1,748 (100.0%) | 1,846 (100.0%) |
Housing Structure by Heating Type in Cairo
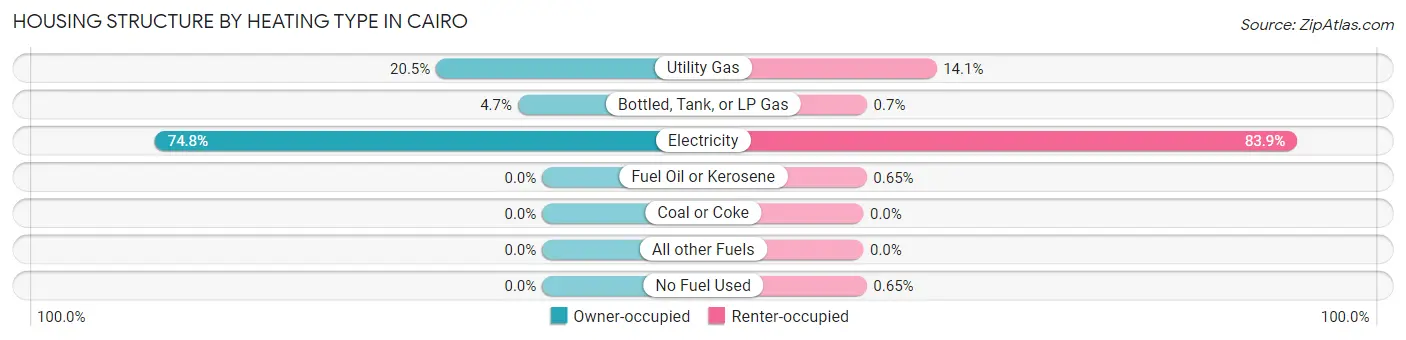
| Heating Type | Owner-occupied | Renter-occupied |
| Utility Gas | 358 (20.5%) | 261 (14.1%) |
| Bottled, Tank, or LP Gas | 82 (4.7%) | 13 (0.7%) |
| Electricity | 1,308 (74.8%) | 1,548 (83.9%) |
| Fuel Oil or Kerosene | 0 (0.0%) | 12 (0.6%) |
| Coal or Coke | 0 (0.0%) | 0 (0.0%) |
| All other Fuels | 0 (0.0%) | 0 (0.0%) |
| No Fuel Used | 0 (0.0%) | 12 (0.6%) |
| Total | 1,748 (100.0%) | 1,846 (100.0%) |
Household Vehicle Usage in Cairo
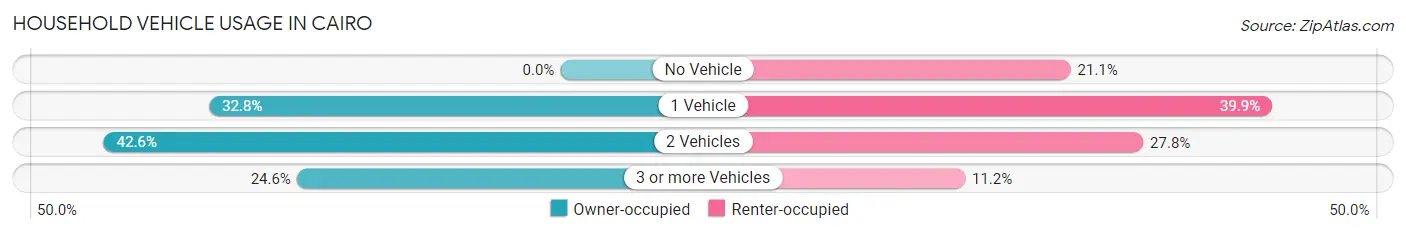
| Vehicles per Household | Owner-occupied | Renter-occupied |
| No Vehicle | 0 (0.0%) | 389 (21.1%) |
| 1 Vehicle | 573 (32.8%) | 736 (39.9%) |
| 2 Vehicles | 745 (42.6%) | 514 (27.8%) |
| 3 or more Vehicles | 430 (24.6%) | 207 (11.2%) |
| Total | 1,748 (100.0%) | 1,846 (100.0%) |
Real Estate & Mortgages in Cairo
Real Estate and Mortgage Overview in Cairo
| Characteristic | Without Mortgage | With Mortgage |
| Housing Units | 1,070 | 678 |
| Median Property Value | $116,200 | $115,500 |
| Median Household Income | $43,720 | $57 |
| Monthly Housing Costs | $539 | $0 |
| Real Estate Taxes | $1,364 | $30 |
Property Value by Mortgage Status in Cairo
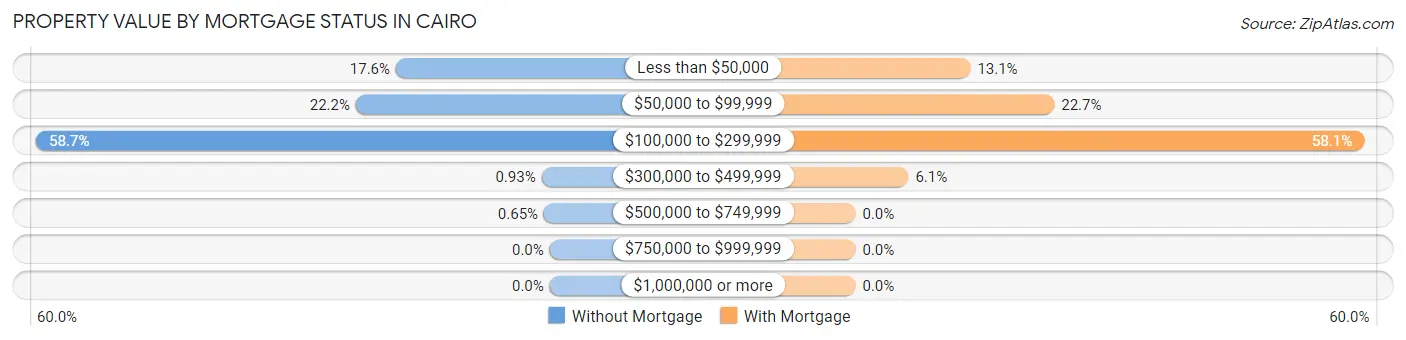
| Property Value | Without Mortgage | With Mortgage |
| Less than $50,000 | 188 (17.6%) | 89 (13.1%) |
| $50,000 to $99,999 | 237 (22.2%) | 154 (22.7%) |
| $100,000 to $299,999 | 628 (58.7%) | 394 (58.1%) |
| $300,000 to $499,999 | 10 (0.9%) | 41 (6.0%) |
| $500,000 to $749,999 | 7 (0.6%) | 0 (0.0%) |
| $750,000 to $999,999 | 0 (0.0%) | 0 (0.0%) |
| $1,000,000 or more | 0 (0.0%) | 0 (0.0%) |
| Total | 1,070 (100.0%) | 678 (100.0%) |
Household Income by Mortgage Status in Cairo
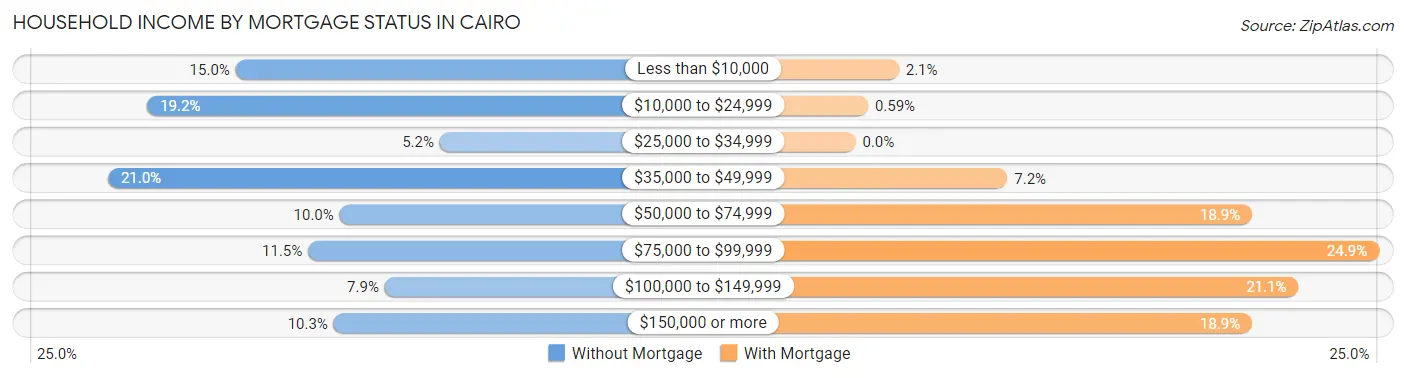
| Household Income | Without Mortgage | With Mortgage |
| Less than $10,000 | 160 (14.9%) | 14 (2.1%) |
| $10,000 to $24,999 | 205 (19.2%) | 4 (0.6%) |
| $25,000 to $34,999 | 56 (5.2%) | 0 (0.0%) |
| $35,000 to $49,999 | 225 (21.0%) | 49 (7.2%) |
| $50,000 to $74,999 | 107 (10.0%) | 128 (18.9%) |
| $75,000 to $99,999 | 123 (11.5%) | 169 (24.9%) |
| $100,000 to $149,999 | 84 (7.9%) | 143 (21.1%) |
| $150,000 or more | 110 (10.3%) | 128 (18.9%) |
| Total | 1,070 (100.0%) | 678 (100.0%) |
Property Value to Household Income Ratio in Cairo
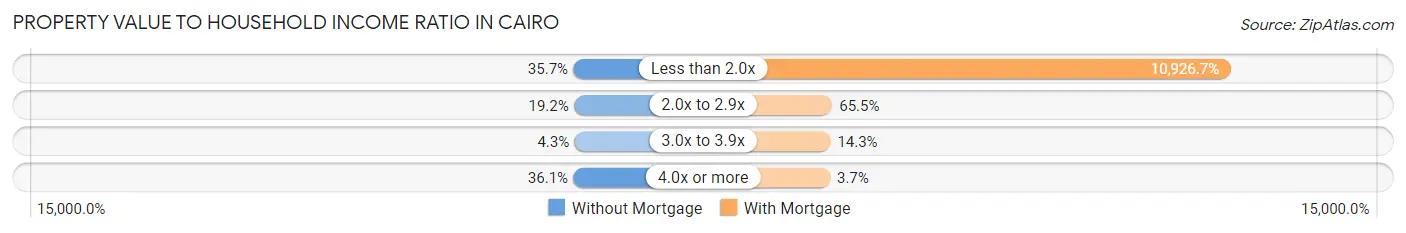
| Value-to-Income Ratio | Without Mortgage | With Mortgage |
| Less than 2.0x | 382 (35.7%) | 74,083 (10,926.7%) |
| 2.0x to 2.9x | 205 (19.2%) | 444 (65.5%) |
| 3.0x to 3.9x | 46 (4.3%) | 97 (14.3%) |
| 4.0x or more | 386 (36.1%) | 25 (3.7%) |
| Total | 1,070 (100.0%) | 678 (100.0%) |
Real Estate Taxes by Mortgage Status in Cairo
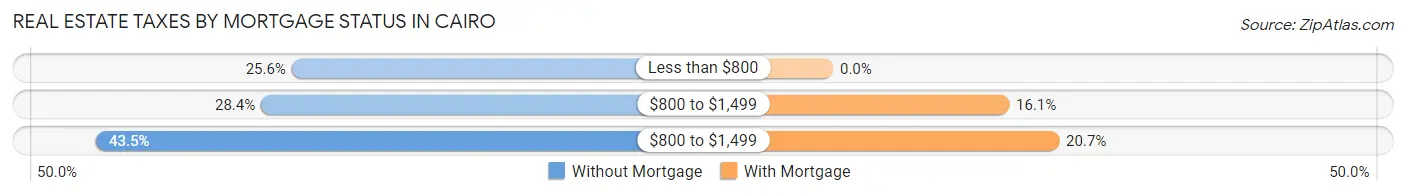
| Property Taxes | Without Mortgage | With Mortgage |
| Less than $800 | 274 (25.6%) | 0 (0.0%) |
| $800 to $1,499 | 304 (28.4%) | 109 (16.1%) |
| $800 to $1,499 | 465 (43.5%) | 140 (20.6%) |
| Total | 1,070 (100.0%) | 678 (100.0%) |
Health & Disability in Cairo
Health Insurance Coverage by Age in Cairo
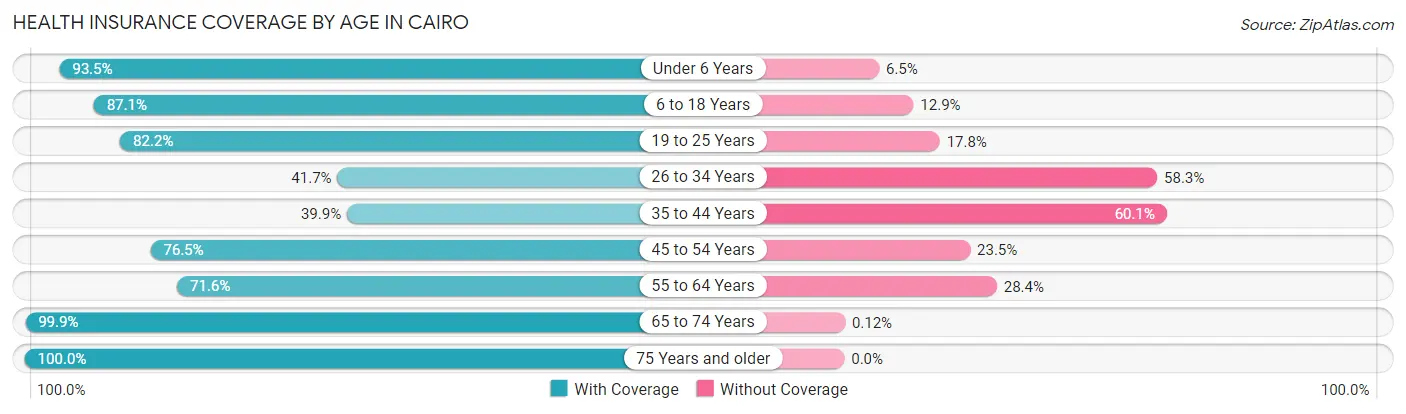
| Age Bracket | With Coverage | Without Coverage |
| Under 6 Years | 707 (93.5%) | 49 (6.5%) |
| 6 to 18 Years | 1,933 (87.1%) | 286 (12.9%) |
| 19 to 25 Years | 855 (82.2%) | 185 (17.8%) |
| 26 to 34 Years | 530 (41.7%) | 742 (58.3%) |
| 35 to 44 Years | 331 (39.9%) | 499 (60.1%) |
| 45 to 54 Years | 819 (76.5%) | 251 (23.5%) |
| 55 to 64 Years | 873 (71.6%) | 347 (28.4%) |
| 65 to 74 Years | 857 (99.9%) | 1 (0.1%) |
| 75 Years and older | 730 (100.0%) | 0 (0.0%) |
| Total | 7,635 (76.4%) | 2,360 (23.6%) |
Health Insurance Coverage by Citizenship Status in Cairo
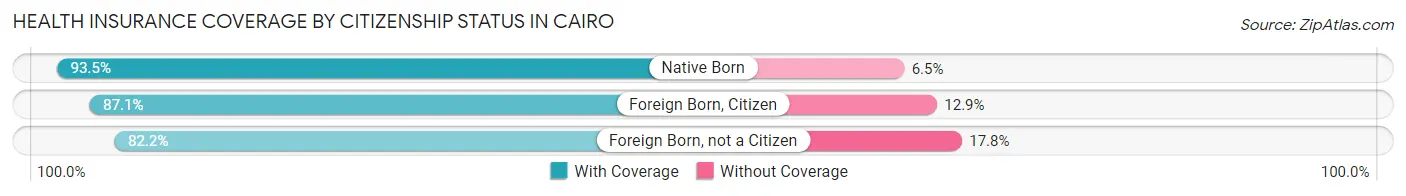
| Citizenship Status | With Coverage | Without Coverage |
| Native Born | 707 (93.5%) | 49 (6.5%) |
| Foreign Born, Citizen | 1,933 (87.1%) | 286 (12.9%) |
| Foreign Born, not a Citizen | 855 (82.2%) | 185 (17.8%) |
Health Insurance Coverage by Household Income in Cairo
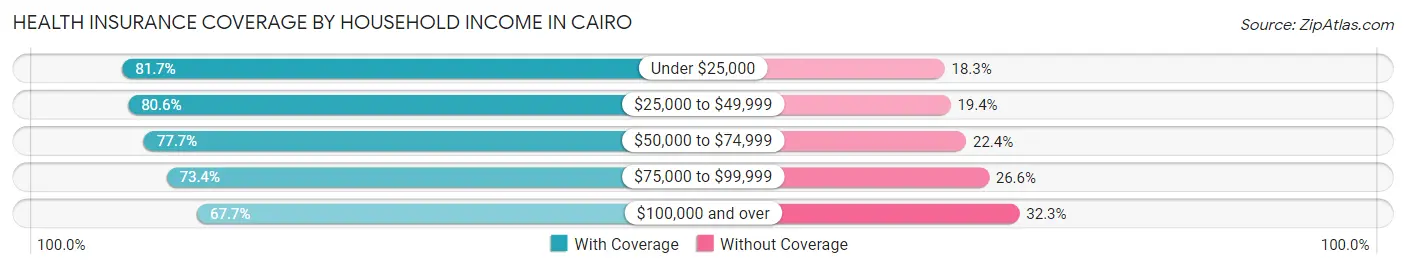
| Household Income | With Coverage | Without Coverage |
| Under $25,000 | 1,699 (81.7%) | 381 (18.3%) |
| $25,000 to $49,999 | 2,029 (80.6%) | 489 (19.4%) |
| $50,000 to $74,999 | 1,202 (77.6%) | 346 (22.4%) |
| $75,000 to $99,999 | 1,288 (73.4%) | 467 (26.6%) |
| $100,000 and over | 1,417 (67.7%) | 677 (32.3%) |
Public vs Private Health Insurance Coverage by Age in Cairo
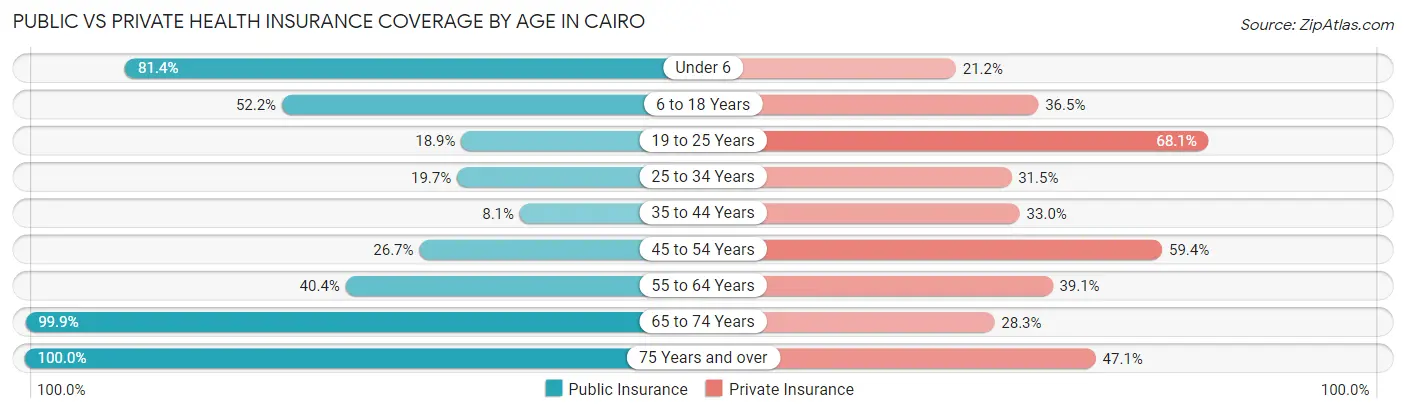
| Age Bracket | Public Insurance | Private Insurance |
| Under 6 | 615 (81.4%) | 160 (21.2%) |
| 6 to 18 Years | 1,159 (52.2%) | 809 (36.5%) |
| 19 to 25 Years | 197 (18.9%) | 708 (68.1%) |
| 25 to 34 Years | 251 (19.7%) | 400 (31.5%) |
| 35 to 44 Years | 67 (8.1%) | 274 (33.0%) |
| 45 to 54 Years | 286 (26.7%) | 636 (59.4%) |
| 55 to 64 Years | 493 (40.4%) | 477 (39.1%) |
| 65 to 74 Years | 857 (99.9%) | 243 (28.3%) |
| 75 Years and over | 730 (100.0%) | 344 (47.1%) |
| Total | 4,655 (46.6%) | 4,051 (40.5%) |
Disability Status by Sex by Age in Cairo
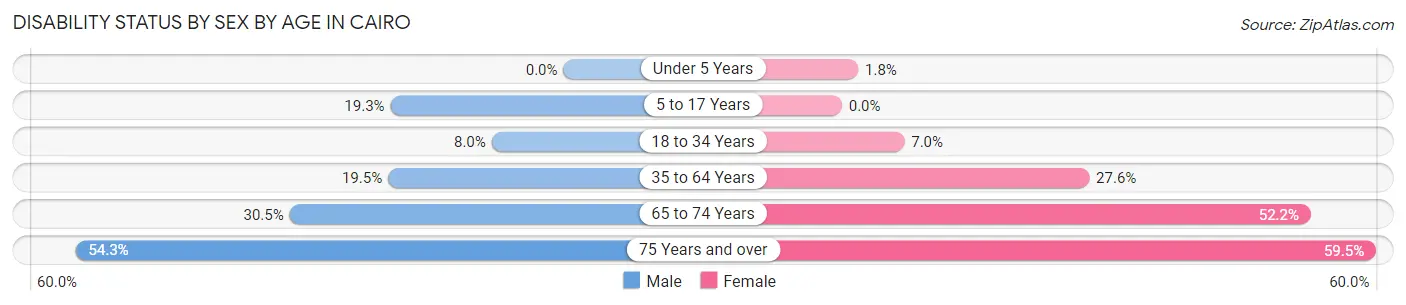
| Age Bracket | Male | Female |
| Under 5 Years | 0 (0.0%) | 4 (1.8%) |
| 5 to 17 Years | 241 (19.3%) | 0 (0.0%) |
| 18 to 34 Years | 88 (8.0%) | 92 (7.0%) |
| 35 to 64 Years | 250 (19.5%) | 507 (27.6%) |
| 65 to 74 Years | 118 (30.5%) | 246 (52.2%) |
| 75 Years and over | 119 (54.3%) | 304 (59.5%) |
Disability Class by Sex by Age in Cairo
Disability Class: Hearing Difficulty
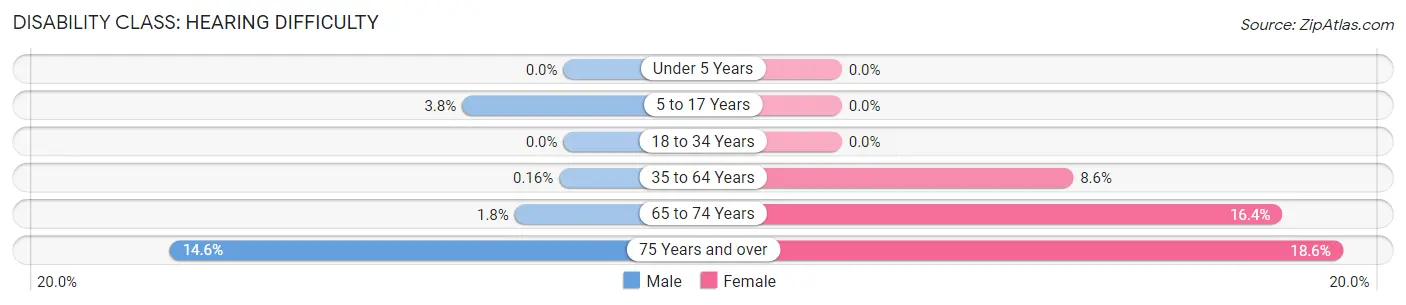
| Age Bracket | Male | Female |
| Under 5 Years | 0 (0.0%) | 0 (0.0%) |
| 5 to 17 Years | 47 (3.8%) | 0 (0.0%) |
| 18 to 34 Years | 0 (0.0%) | 0 (0.0%) |
| 35 to 64 Years | 2 (0.2%) | 158 (8.6%) |
| 65 to 74 Years | 7 (1.8%) | 77 (16.4%) |
| 75 Years and over | 32 (14.6%) | 95 (18.6%) |
Disability Class: Vision Difficulty
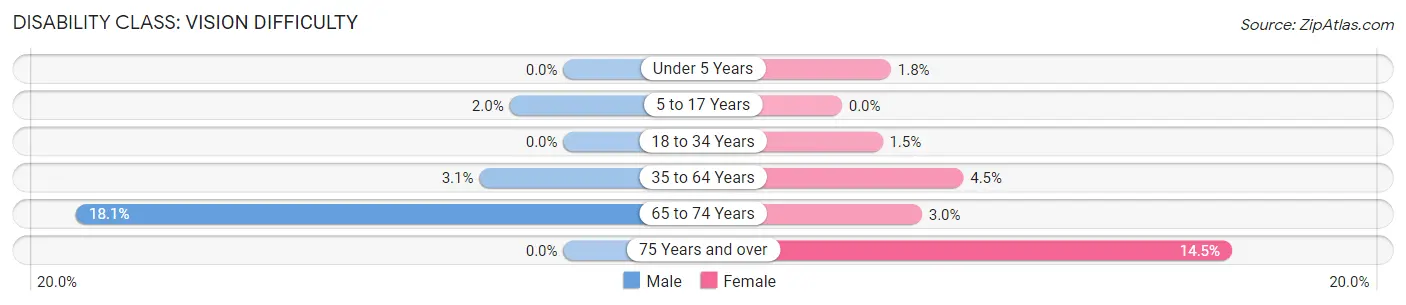
| Age Bracket | Male | Female |
| Under 5 Years | 0 (0.0%) | 4 (1.8%) |
| 5 to 17 Years | 25 (2.0%) | 0 (0.0%) |
| 18 to 34 Years | 0 (0.0%) | 20 (1.5%) |
| 35 to 64 Years | 40 (3.1%) | 83 (4.5%) |
| 65 to 74 Years | 70 (18.1%) | 14 (3.0%) |
| 75 Years and over | 0 (0.0%) | 74 (14.5%) |
Disability Class: Cognitive Difficulty
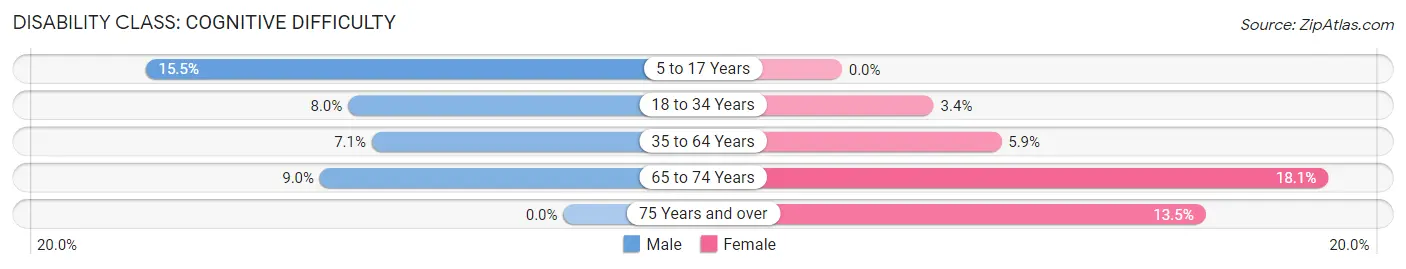
| Age Bracket | Male | Female |
| 5 to 17 Years | 194 (15.5%) | 0 (0.0%) |
| 18 to 34 Years | 88 (8.0%) | 45 (3.4%) |
| 35 to 64 Years | 91 (7.1%) | 109 (5.9%) |
| 65 to 74 Years | 35 (9.0%) | 85 (18.0%) |
| 75 Years and over | 0 (0.0%) | 69 (13.5%) |
Disability Class: Ambulatory Difficulty
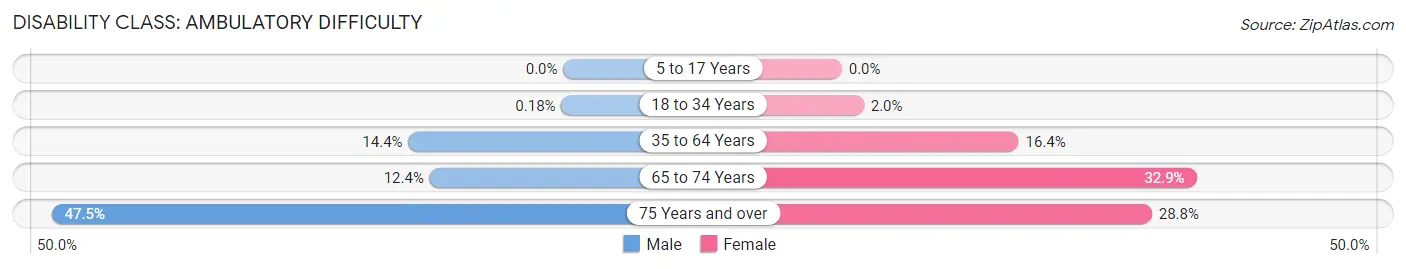
| Age Bracket | Male | Female |
| 5 to 17 Years | 0 (0.0%) | 0 (0.0%) |
| 18 to 34 Years | 2 (0.2%) | 27 (2.0%) |
| 35 to 64 Years | 184 (14.4%) | 302 (16.4%) |
| 65 to 74 Years | 48 (12.4%) | 155 (32.9%) |
| 75 Years and over | 104 (47.5%) | 147 (28.8%) |
Disability Class: Self-Care Difficulty
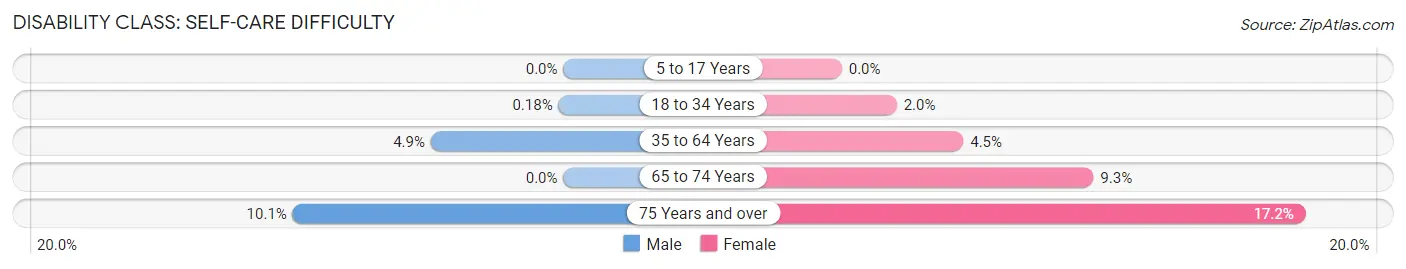
| Age Bracket | Male | Female |
| 5 to 17 Years | 0 (0.0%) | 0 (0.0%) |
| 18 to 34 Years | 2 (0.2%) | 27 (2.0%) |
| 35 to 64 Years | 63 (4.9%) | 83 (4.5%) |
| 65 to 74 Years | 0 (0.0%) | 44 (9.3%) |
| 75 Years and over | 22 (10.1%) | 88 (17.2%) |
Technology Access in Cairo
Computing Device Access in Cairo
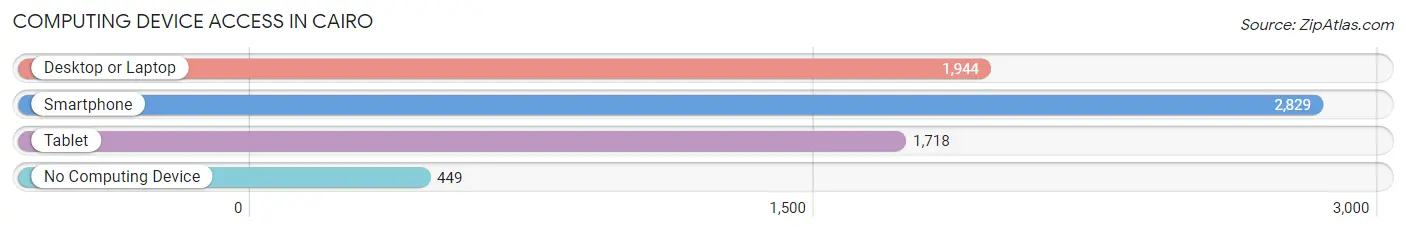
| Device Type | # Households | % Households |
| Desktop or Laptop | 1,944 | 54.1% |
| Smartphone | 2,829 | 78.7% |
| Tablet | 1,718 | 47.8% |
| No Computing Device | 449 | 12.5% |
| Total | 3,594 | 100.0% |
Internet Access in Cairo
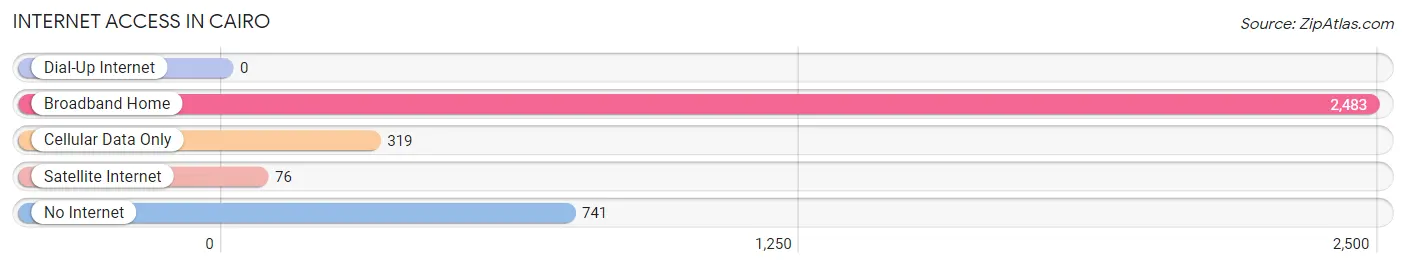
| Internet Type | # Households | % Households |
| Dial-Up Internet | 0 | 0.0% |
| Broadband Home | 2,483 | 69.1% |
| Cellular Data Only | 319 | 8.9% |
| Satellite Internet | 76 | 2.1% |
| No Internet | 741 | 20.6% |
| Total | 3,594 | 100.0% |
Cairo Summary
Cairo, Georgia is a small city located in Grady County in the southwestern part of the state. It is the county seat and the largest city in the county. The city is located on the banks of the Chattahoochee River, which forms the border between Georgia and Florida. The city is part of the Tallahassee, Florida metropolitan area.
History
Cairo was founded in 1835 by a group of settlers from Cairo, Illinois. The city was named after the Egyptian city of Cairo, which was the capital of Egypt at the time. The settlers were attracted to the area by the fertile soil and the abundance of timber. The city was incorporated in 1838 and quickly became a center of commerce and industry.
The city was a major stop on the Central of Georgia Railroad, which connected the city to other parts of the state. The railroad also connected Cairo to the port of Savannah, which allowed the city to become a major shipping center.
The city was also a major center of the cotton industry. The city was home to several cotton mills and warehouses. The city was also home to several large plantations, which were worked by enslaved African Americans.
The city was also a major center of the Civil War. The city was occupied by Union forces in 1862 and was the site of several battles. The city was also the site of the Battle of Griswoldville, which was the last major battle of the war in Georgia.
Geography
Cairo is located in southwestern Georgia, in Grady County. The city is located on the banks of the Chattahoochee River, which forms the border between Georgia and Florida. The city is located about 30 miles south of Albany and about 60 miles north of Tallahassee, Florida.
The city has a total area of 8.2 square miles, of which 8.1 square miles is land and 0.1 square miles is water. The city is located in a flat, low-lying area and is surrounded by farmland.
Economy
Cairo’s economy is largely based on agriculture and manufacturing. The city is home to several large farms, which produce cotton, corn, soybeans, and other crops. The city is also home to several manufacturing plants, which produce a variety of products, including furniture, textiles, and paper products.
The city is also home to several retail stores, restaurants, and other businesses. The city is also home to several government offices, including the Grady County Courthouse.
Demographics
As of the 2010 census, Cairo had a population of 9,607. The racial makeup of the city was 57.3% White, 37.2% African American, 0.3% Native American, 0.7% Asian, 0.1% Pacific Islander, and 4.4% from other races. Hispanic or Latino of any race were 3.2% of the population.
The median income for a household in the city was $30,938, and the median income for a family was $37,917. The per capita income for the city was $17,845. About 22.2% of the population was below the poverty line.
Common Questions
What is Per Capita Income in Cairo?
Per Capita income in Cairo is $21,542.
What is the Median Family Income in Cairo?
Median Family Income in Cairo is $60,279.
What is the Median Household income in Cairo?
Median Household Income in Cairo is $39,784.
What is Income or Wage Gap in Cairo?
Income or Wage Gap in Cairo is 31.7%.
Women in Cairo earn 68.3 cents for every dollar earned by a man.
What is Inequality or Gini Index in Cairo?
Inequality or Gini Index in Cairo is 0.49.
What is the Total Population of Cairo?
Total Population of Cairo is 10,091.
What is the Total Male Population of Cairo?
Total Male Population of Cairo is 4,772.
What is the Total Female Population of Cairo?
Total Female Population of Cairo is 5,319.
What is the Ratio of Males per 100 Females in Cairo?
There are 89.72 Males per 100 Females in Cairo.
What is the Ratio of Females per 100 Males in Cairo?
There are 111.46 Females per 100 Males in Cairo.
What is the Median Population Age in Cairo?
Median Population Age in Cairo is 31.9 Years.
What is the Average Family Size in Cairo
Average Family Size in Cairo is 3.7 People.
What is the Average Household Size in Cairo
Average Household Size in Cairo is 2.8 People.
How Large is the Labor Force in Cairo?
There are 4,180 People in the Labor Forcein in Cairo.
What is the Percentage of People in the Labor Force in Cairo?
56.2% of People are in the Labor Force in Cairo.
What is the Unemployment Rate in Cairo?
Unemployment Rate in Cairo is 7.6%.