Zip Codes with the Highest Percentage of Population Employed in Administrative & Support Services in Griffin, GA
RELATED REPORTS & OPTIONS
Administrative & Support Services
Griffin
Compare Zip Codes
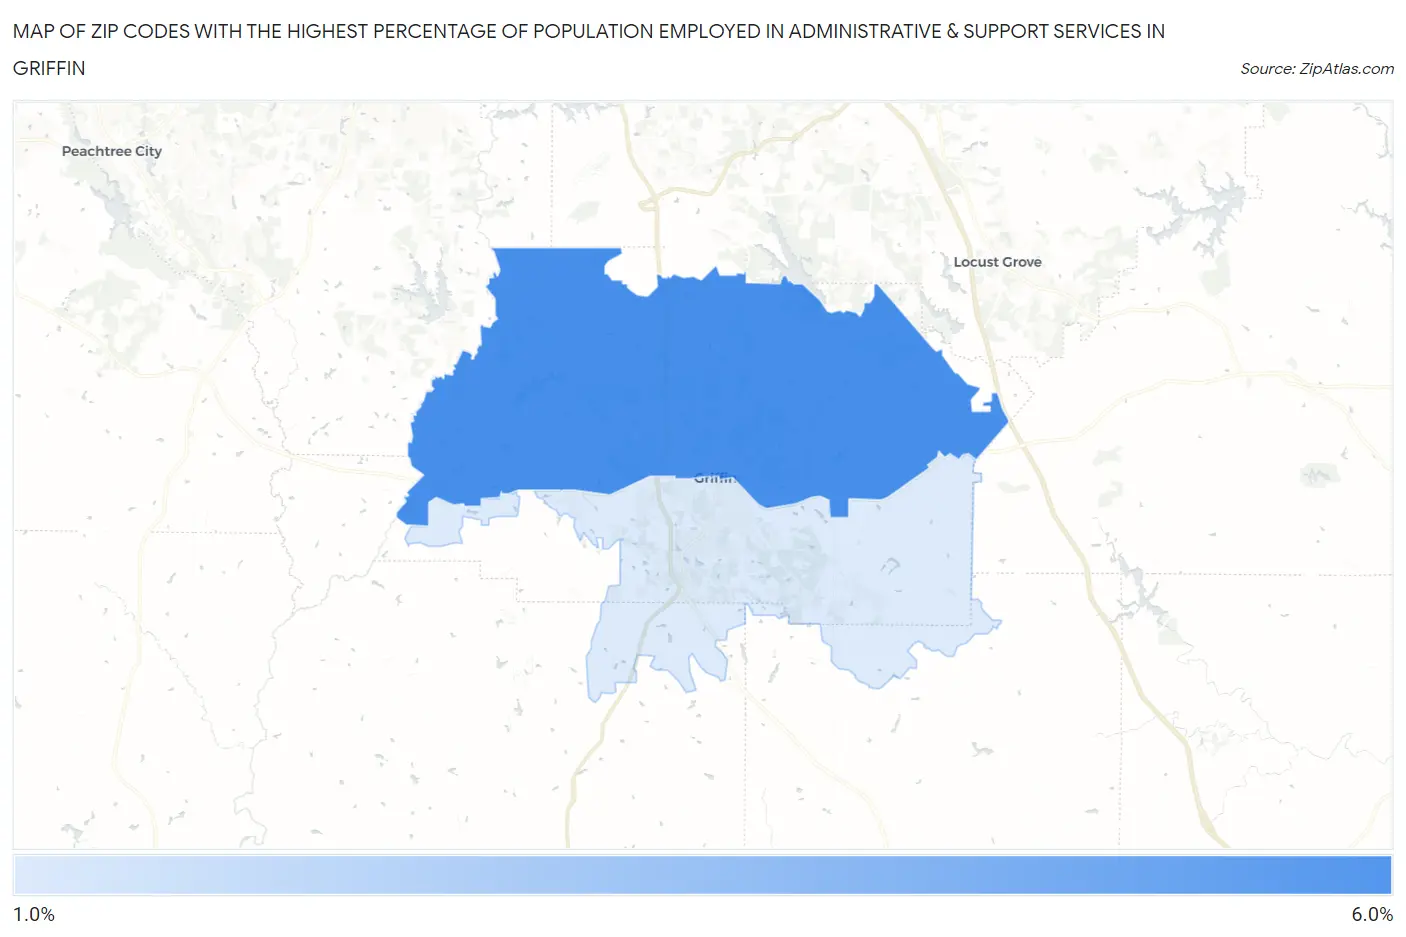
Map of Zip Codes with the Highest Percentage of Population Employed in Administrative & Support Services in Griffin
1.8%
5.8%
Zip Codes with the Highest Percentage of Population Employed in Administrative & Support Services in Griffin, GA
| Zip Code | % Employed | vs State | vs National | |
| 1. | 30223 | 5.8% | 4.8%(+0.976)#173 | 4.1%(+1.64)#5,164 |
| 2. | 30224 | 1.8% | 4.8%(-3.01)#556 | 4.1%(-2.34)#21,482 |
1
Common Questions
What are the Top Zip Codes with the Highest Percentage of Population Employed in Administrative & Support Services in Griffin, GA?
Top Zip Codes with the Highest Percentage of Population Employed in Administrative & Support Services in Griffin, GA are:
What zip code has the Highest Percentage of Population Employed in Administrative & Support Services in Griffin, GA?
30223 has the Highest Percentage of Population Employed in Administrative & Support Services in Griffin, GA with 5.8%.
What is the Percentage of Population Employed in Administrative & Support Services in Griffin, GA?
Percentage of Population Employed in Administrative & Support Services in Griffin is 3.8%.
What is the Percentage of Population Employed in Administrative & Support Services in Georgia?
Percentage of Population Employed in Administrative & Support Services in Georgia is 4.8%.
What is the Percentage of Population Employed in Administrative & Support Services in the United States?
Percentage of Population Employed in Administrative & Support Services in the United States is 4.1%.