Zip Codes with the Highest Percentage of Population Employed in Administrative & Support Services in Warner Robins, GA
RELATED REPORTS & OPTIONS
Administrative & Support Services
Warner Robins
Compare Zip Codes
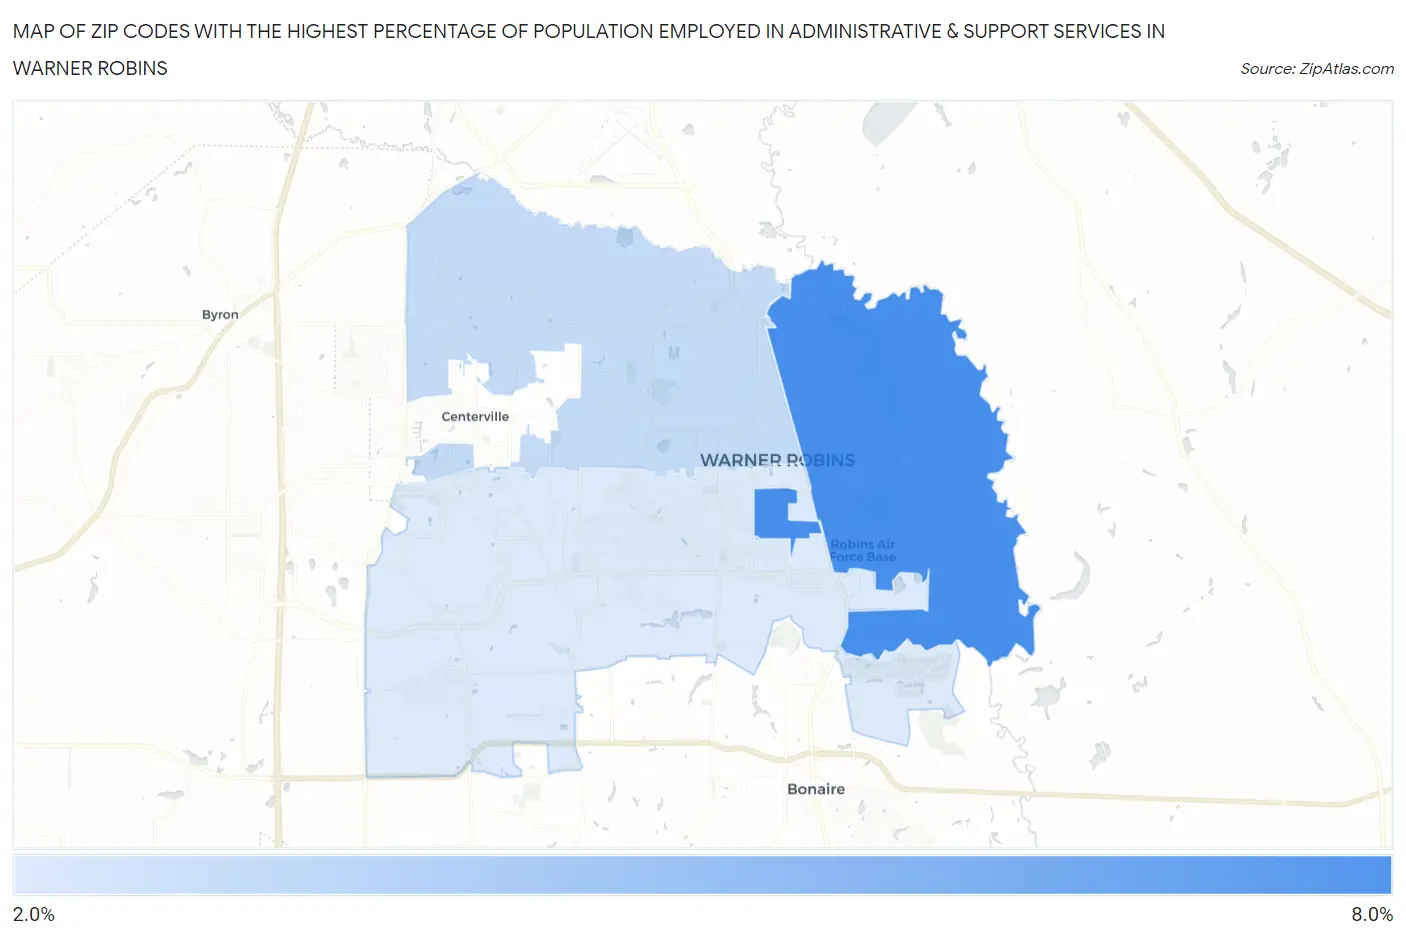
Map of Zip Codes with the Highest Percentage of Population Employed in Administrative & Support Services in Warner Robins
2.8%
7.5%
Zip Codes with the Highest Percentage of Population Employed in Administrative & Support Services in Warner Robins, GA
| Zip Code | % Employed | vs State | vs National | |
| 1. | 31098 | 7.5% | 4.8%(+2.72)#88 | 4.1%(+3.39)#2,653 |
| 2. | 31093 | 3.6% | 4.8%(-1.25)#386 | 4.1%(-0.580)#12,613 |
| 3. | 31088 | 2.8% | 4.8%(-2.00)#461 | 4.1%(-1.33)#16,411 |
1
Common Questions
What are the Top Zip Codes with the Highest Percentage of Population Employed in Administrative & Support Services in Warner Robins, GA?
Top Zip Codes with the Highest Percentage of Population Employed in Administrative & Support Services in Warner Robins, GA are:
What zip code has the Highest Percentage of Population Employed in Administrative & Support Services in Warner Robins, GA?
31098 has the Highest Percentage of Population Employed in Administrative & Support Services in Warner Robins, GA with 7.5%.
What is the Percentage of Population Employed in Administrative & Support Services in Warner Robins, GA?
Percentage of Population Employed in Administrative & Support Services in Warner Robins is 4.0%.
What is the Percentage of Population Employed in Administrative & Support Services in Georgia?
Percentage of Population Employed in Administrative & Support Services in Georgia is 4.8%.
What is the Percentage of Population Employed in Administrative & Support Services in the United States?
Percentage of Population Employed in Administrative & Support Services in the United States is 4.1%.