Zip Codes with the Highest Percentage of Population Employed in Administrative & Support Services in Rome, GA
RELATED REPORTS & OPTIONS
Administrative & Support Services
Rome
Compare Zip Codes
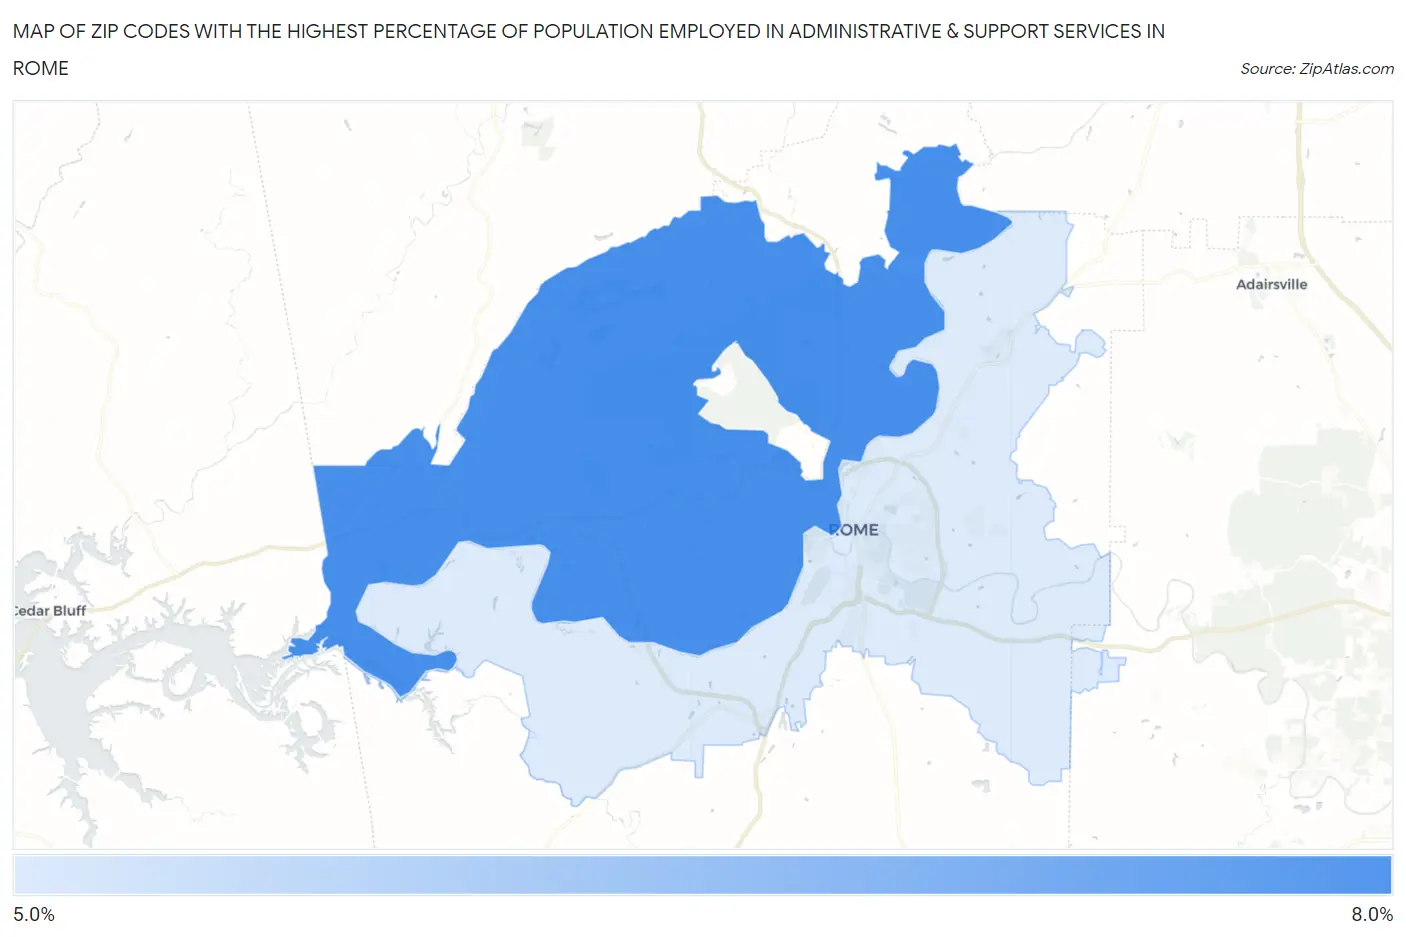
Map of Zip Codes with the Highest Percentage of Population Employed in Administrative & Support Services in Rome
5.0%
6.7%
Zip Codes with the Highest Percentage of Population Employed in Administrative & Support Services in Rome, GA
| Zip Code | % Employed | vs State | vs National | |
| 1. | 30165 | 6.7% | 4.8%(+1.92)#118 | 4.1%(+2.59)#3,565 |
| 2. | 30161 | 5.0% | 4.8%(+0.187)#230 | 4.1%(+0.854)#7,092 |
1
Common Questions
What are the Top Zip Codes with the Highest Percentage of Population Employed in Administrative & Support Services in Rome, GA?
Top Zip Codes with the Highest Percentage of Population Employed in Administrative & Support Services in Rome, GA are:
What zip code has the Highest Percentage of Population Employed in Administrative & Support Services in Rome, GA?
30165 has the Highest Percentage of Population Employed in Administrative & Support Services in Rome, GA with 6.7%.
What is the Percentage of Population Employed in Administrative & Support Services in Rome, GA?
Percentage of Population Employed in Administrative & Support Services in Rome is 7.1%.
What is the Percentage of Population Employed in Administrative & Support Services in Georgia?
Percentage of Population Employed in Administrative & Support Services in Georgia is 4.8%.
What is the Percentage of Population Employed in Administrative & Support Services in the United States?
Percentage of Population Employed in Administrative & Support Services in the United States is 4.1%.