Indian Springs, GA Map & Demographics
Indian Springs Map
Indian Springs Overview
$32,013
PER CAPITA INCOME
$82,727
AVG FAMILY INCOME
$82,784
AVG HOUSEHOLD INCOME
5.1%
WAGE / INCOME GAP [ % ]
94.9¢/ $1
WAGE / INCOME GAP [ $ ]
0.26
INEQUALITY / GINI INDEX
1,983
TOTAL POPULATION
1,012
MALE POPULATION
971
FEMALE POPULATION
104.22
MALES / 100 FEMALES
95.95
FEMALES / 100 MALES
40.5
MEDIAN AGE
3.0
AVG FAMILY SIZE
2.8
AVG HOUSEHOLD SIZE
1,241
LABOR FORCE [ PEOPLE ]
72.6%
PERCENT IN LABOR FORCE
2.6%
UNEMPLOYMENT RATE
Income in Indian Springs
Income Overview in Indian Springs
Per Capita Income in Indian Springs is $32,013, while median incomes of families and households are $82,727 and $82,784 respectively.
| Characteristic | Number | Measure |
| Per Capita Income | 1,983 | $32,013 |
| Median Family Income | 632 | $82,727 |
| Mean Family Income | 632 | $88,560 |
| Median Household Income | 698 | $82,784 |
| Mean Household Income | 698 | $87,258 |
| Income Deficit | 632 | $0 |
| Wage / Income Gap (%) | 1,983 | 5.05% |
| Wage / Income Gap ($) | 1,983 | 94.95¢ per $1 |
| Gini / Inequality Index | 1,983 | 0.26 |
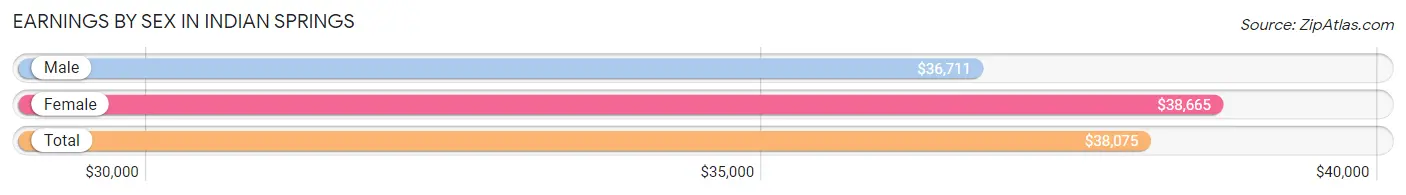
Earnings by Sex in Indian Springs
Average Earnings in Indian Springs are $38,075, $36,711 for men and $38,665 for women, a difference of 5.1%.
| Sex | Number | Average Earnings |
| Male | 698 (57.0%) | $36,711 |
| Female | 527 (43.0%) | $38,665 |
| Total | 1,225 (100.0%) | $38,075 |
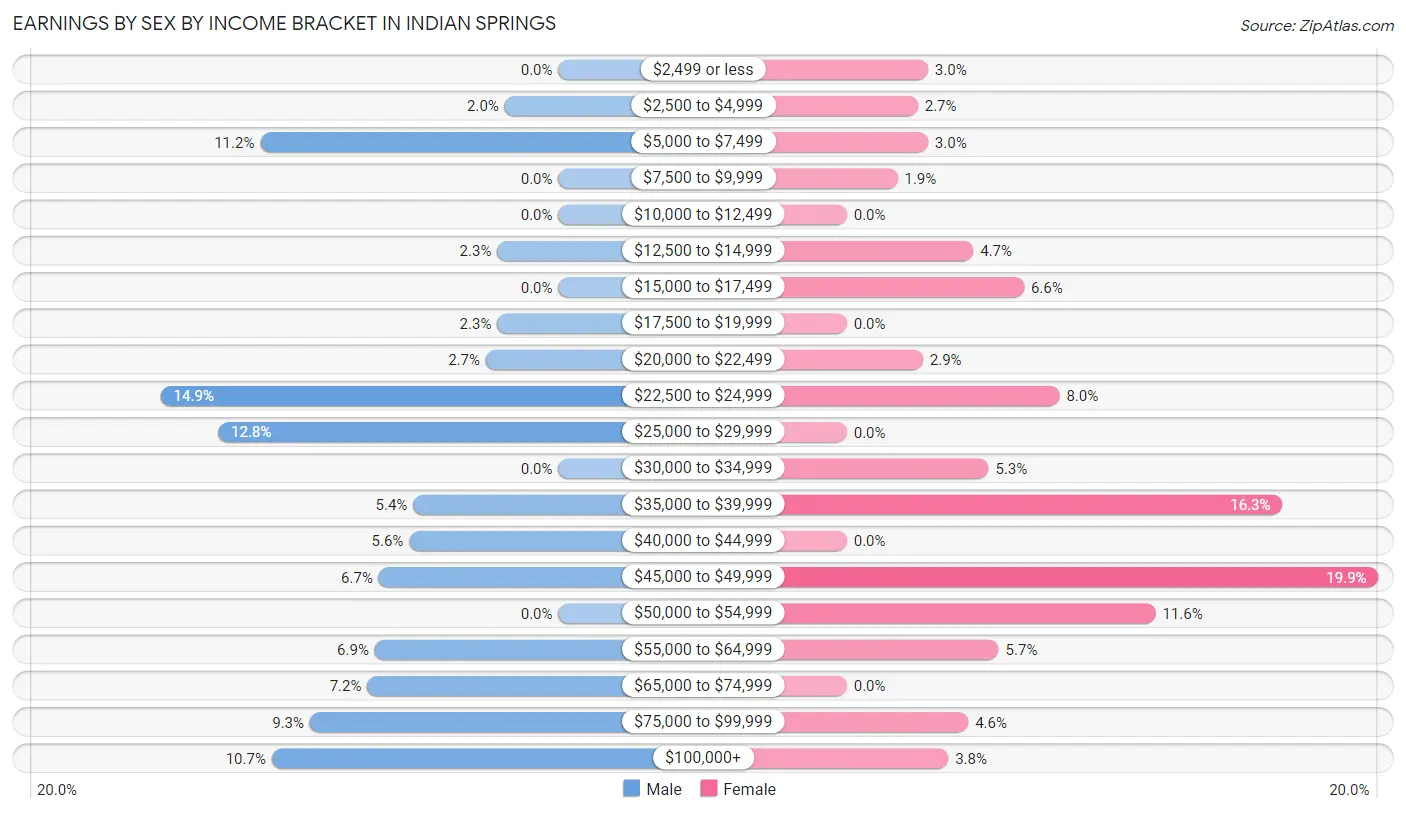
Earnings by Sex by Income Bracket in Indian Springs
The most common earnings brackets in Indian Springs are $22,500 to $24,999 for men (104 | 14.9%) and $45,000 to $49,999 for women (105 | 19.9%).
| Income | Male | Female |
| $2,499 or less | 0 (0.0%) | 16 (3.0%) |
| $2,500 to $4,999 | 14 (2.0%) | 14 (2.7%) |
| $5,000 to $7,499 | 78 (11.2%) | 16 (3.0%) |
| $7,500 to $9,999 | 0 (0.0%) | 10 (1.9%) |
| $10,000 to $12,499 | 0 (0.0%) | 0 (0.0%) |
| $12,500 to $14,999 | 16 (2.3%) | 25 (4.7%) |
| $15,000 to $17,499 | 0 (0.0%) | 35 (6.6%) |
| $17,500 to $19,999 | 16 (2.3%) | 0 (0.0%) |
| $20,000 to $22,499 | 19 (2.7%) | 15 (2.9%) |
| $22,500 to $24,999 | 104 (14.9%) | 42 (8.0%) |
| $25,000 to $29,999 | 89 (12.8%) | 0 (0.0%) |
| $30,000 to $34,999 | 0 (0.0%) | 28 (5.3%) |
| $35,000 to $39,999 | 38 (5.4%) | 86 (16.3%) |
| $40,000 to $44,999 | 39 (5.6%) | 0 (0.0%) |
| $45,000 to $49,999 | 47 (6.7%) | 105 (19.9%) |
| $50,000 to $54,999 | 0 (0.0%) | 61 (11.6%) |
| $55,000 to $64,999 | 48 (6.9%) | 30 (5.7%) |
| $65,000 to $74,999 | 50 (7.2%) | 0 (0.0%) |
| $75,000 to $99,999 | 65 (9.3%) | 24 (4.5%) |
| $100,000+ | 75 (10.7%) | 20 (3.8%) |
| Total | 698 (100.0%) | 527 (100.0%) |
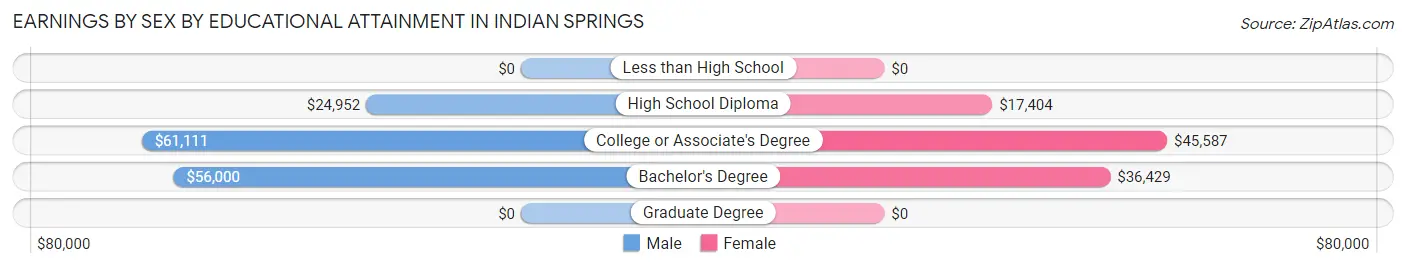
Earnings by Sex by Educational Attainment in Indian Springs
Average earnings in Indian Springs are $43,621 for men and $45,024 for women, a difference of 3.1%. Men with an educational attainment of college or associate's degree enjoy the highest average annual earnings of $61,111, while those with high school diploma education earn the least with $24,952. Women with an educational attainment of college or associate's degree earn the most with the average annual earnings of $45,587, while those with high school diploma education have the smallest earnings of $17,404.
| Educational Attainment | Male Income | Female Income |
| Less than High School | - | - |
| High School Diploma | $24,952 | $17,404 |
| College or Associate's Degree | $61,111 | $45,587 |
| Bachelor's Degree | $56,000 | $36,429 |
| Graduate Degree | - | - |
| Total | $43,621 | $45,024 |
Family Income in Indian Springs
Family Income Brackets in Indian Springs
According to the Indian Springs family income data, there are 225 families falling into the $75,000 to $99,999 income range, which is the most common income bracket and makes up 35.6% of all families.
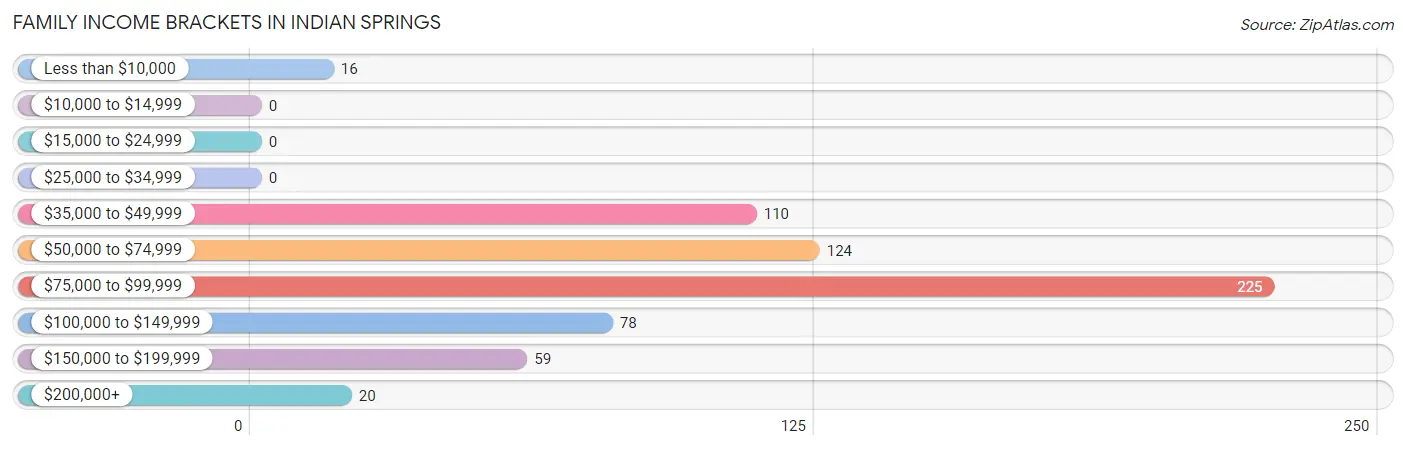
| Income Bracket | # Families | % Families |
| Less than $10,000 | 16 | 2.5% |
| $10,000 to $14,999 | 0 | 0.0% |
| $15,000 to $24,999 | 0 | 0.0% |
| $25,000 to $34,999 | 0 | 0.0% |
| $35,000 to $49,999 | 110 | 17.4% |
| $50,000 to $74,999 | 124 | 19.6% |
| $75,000 to $99,999 | 225 | 35.6% |
| $100,000 to $149,999 | 78 | 12.3% |
| $150,000 to $199,999 | 59 | 9.3% |
| $200,000+ | 20 | 3.2% |
Family Income by Famaliy Size in Indian Springs
3-person families (247 | 39.1%) account for the highest median family income in Indian Springs with $99,232 per family, while 2-person families (272 | 43.0%) have the highest median income of $34,241 per family member.
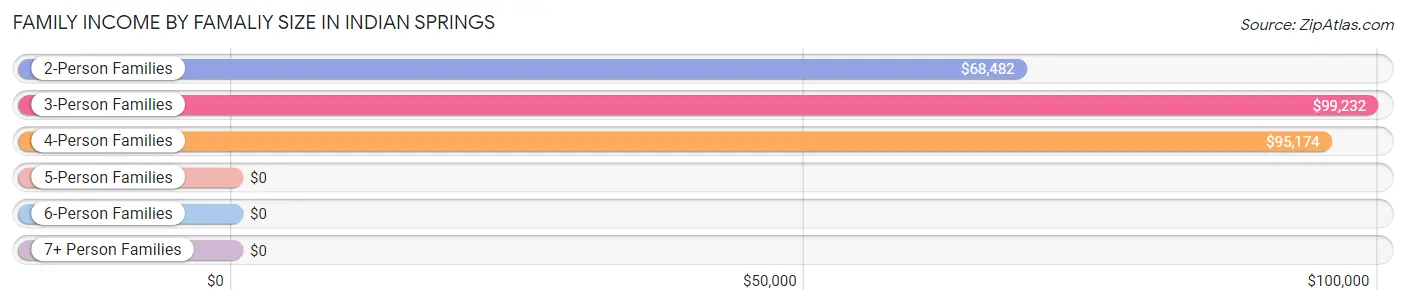
| Income Bracket | # Families | Median Income |
| 2-Person Families | 272 (43.0%) | $68,482 |
| 3-Person Families | 247 (39.1%) | $99,232 |
| 4-Person Families | 93 (14.7%) | $95,174 |
| 5-Person Families | 20 (3.2%) | $0 |
| 6-Person Families | 0 (0.0%) | $0 |
| 7+ Person Families | 0 (0.0%) | $0 |
| Total | 632 (100.0%) | $82,727 |
Family Income by Number of Earners in Indian Springs
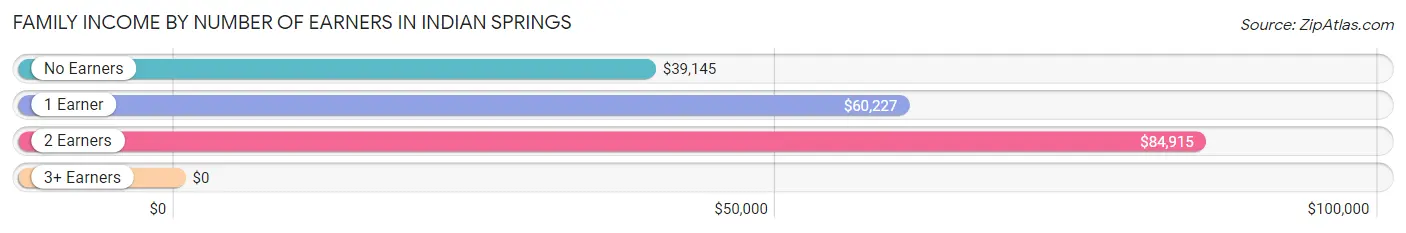
| Number of Earners | # Families | Median Income |
| No Earners | 82 (13.0%) | $39,145 |
| 1 Earner | 126 (19.9%) | $60,227 |
| 2 Earners | 293 (46.4%) | $84,915 |
| 3+ Earners | 131 (20.7%) | $0 |
| Total | 632 (100.0%) | $82,727 |
Household Income in Indian Springs
Household Income Brackets in Indian Springs
With 281 households falling in the category, the $75,000 to $99,999 income range is the most frequent in Indian Springs, accounting for 40.3% of all households.
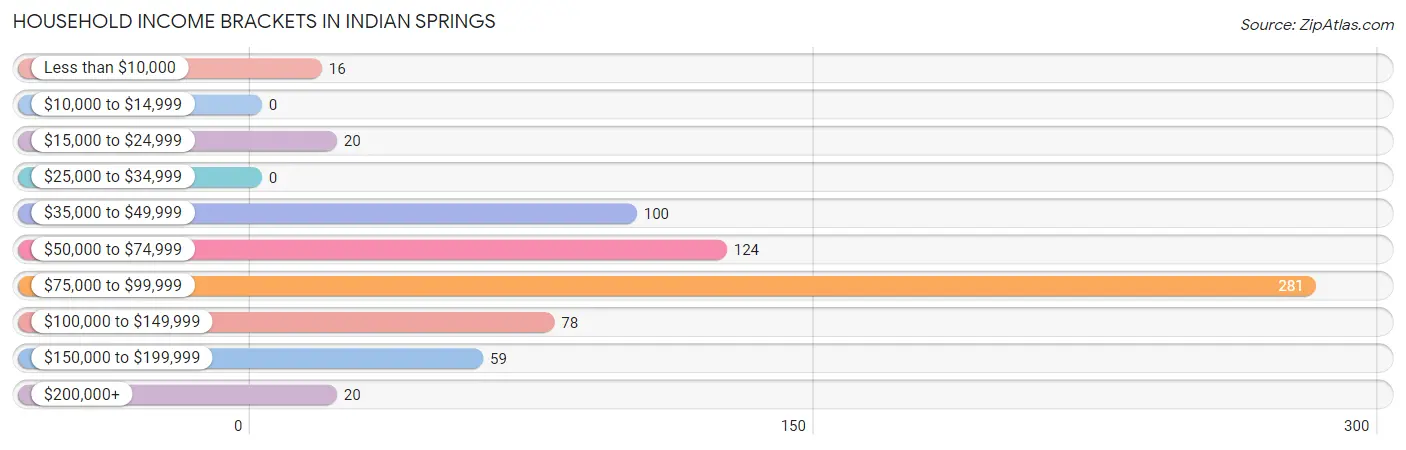
| Income Bracket | # Households | % Households |
| Less than $10,000 | 16 | 2.3% |
| $10,000 to $14,999 | 0 | 0.0% |
| $15,000 to $24,999 | 20 | 2.9% |
| $25,000 to $34,999 | 0 | 0.0% |
| $35,000 to $49,999 | 100 | 14.3% |
| $50,000 to $74,999 | 124 | 17.8% |
| $75,000 to $99,999 | 281 | 40.3% |
| $100,000 to $149,999 | 78 | 11.2% |
| $150,000 to $199,999 | 59 | 8.5% |
| $200,000+ | 20 | 2.9% |
Household Income by Householder Age in Indian Springs
The median household income in Indian Springs is $82,784, with the highest median household income of $98,358 found in the 45 to 64 years age bracket for the primary householder. A total of 327 households (46.9%) fall into this category. Meanwhile, the 15 to 24 years age bracket for the primary householder has the lowest median household income of $0, with 33 households (4.7%) in this group.
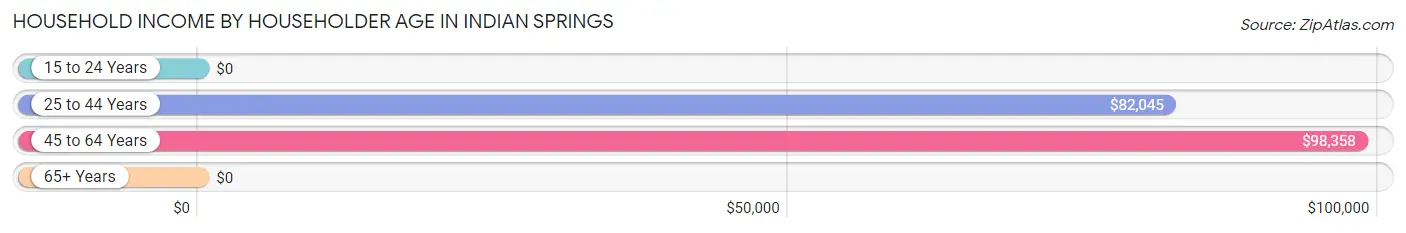
| Income Bracket | # Households | Median Income |
| 15 to 24 Years | 33 (4.7%) | $0 |
| 25 to 44 Years | 176 (25.2%) | $82,045 |
| 45 to 64 Years | 327 (46.9%) | $98,358 |
| 65+ Years | 162 (23.2%) | $0 |
| Total | 698 (100.0%) | $82,784 |
Poverty in Indian Springs
Income Below Poverty by Sex and Age in Indian Springs
With 1.6% poverty level for males and 1.7% for females among the residents of Indian Springs, 5 year old males and 55 to 64 year old females are the most vulnerable to poverty, with 16 males (55.2%) and 16 females (7.0%) in their respective age groups living below the poverty level.
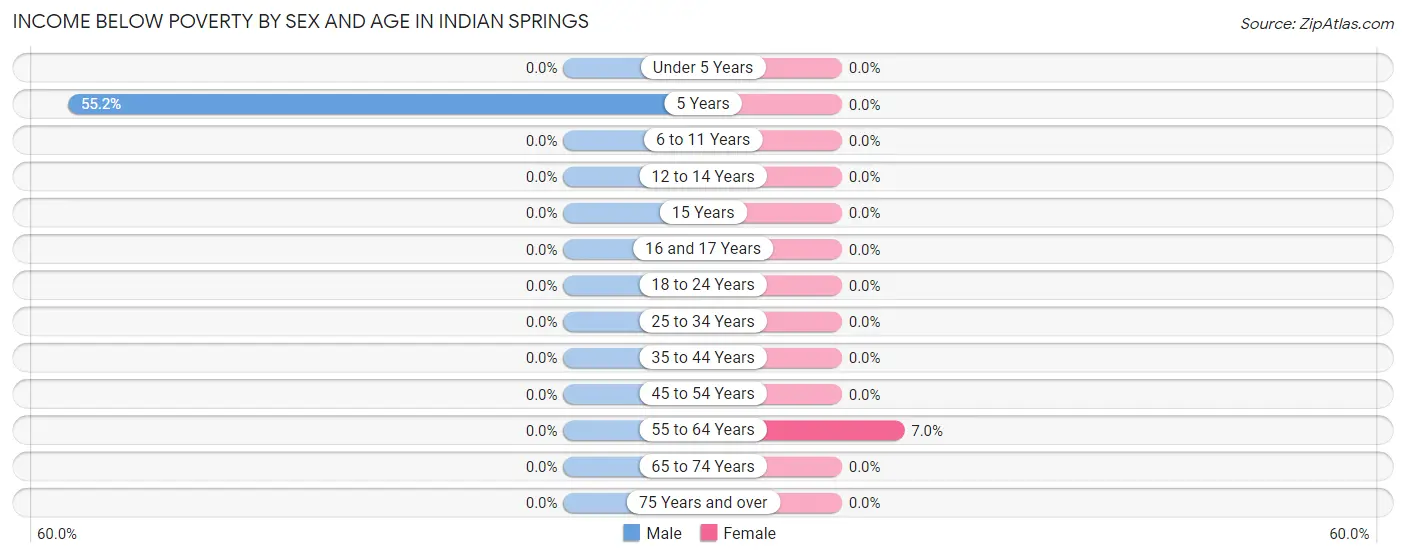
| Age Bracket | Male | Female |
| Under 5 Years | 0 (0.0%) | 0 (0.0%) |
| 5 Years | 16 (55.2%) | 0 (0.0%) |
| 6 to 11 Years | 0 (0.0%) | 0 (0.0%) |
| 12 to 14 Years | 0 (0.0%) | 0 (0.0%) |
| 15 Years | 0 (0.0%) | 0 (0.0%) |
| 16 and 17 Years | 0 (0.0%) | 0 (0.0%) |
| 18 to 24 Years | 0 (0.0%) | 0 (0.0%) |
| 25 to 34 Years | 0 (0.0%) | 0 (0.0%) |
| 35 to 44 Years | 0 (0.0%) | 0 (0.0%) |
| 45 to 54 Years | 0 (0.0%) | 0 (0.0%) |
| 55 to 64 Years | 0 (0.0%) | 16 (7.0%) |
| 65 to 74 Years | 0 (0.0%) | 0 (0.0%) |
| 75 Years and over | 0 (0.0%) | 0 (0.0%) |
| Total | 16 (1.6%) | 16 (1.7%) |
Income Above Poverty by Sex and Age in Indian Springs
According to the poverty statistics in Indian Springs, males aged under 5 years and females aged 6 to 11 years are the age groups that are most secure financially, with 100.0% of males and 100.0% of females in these age groups living above the poverty line.
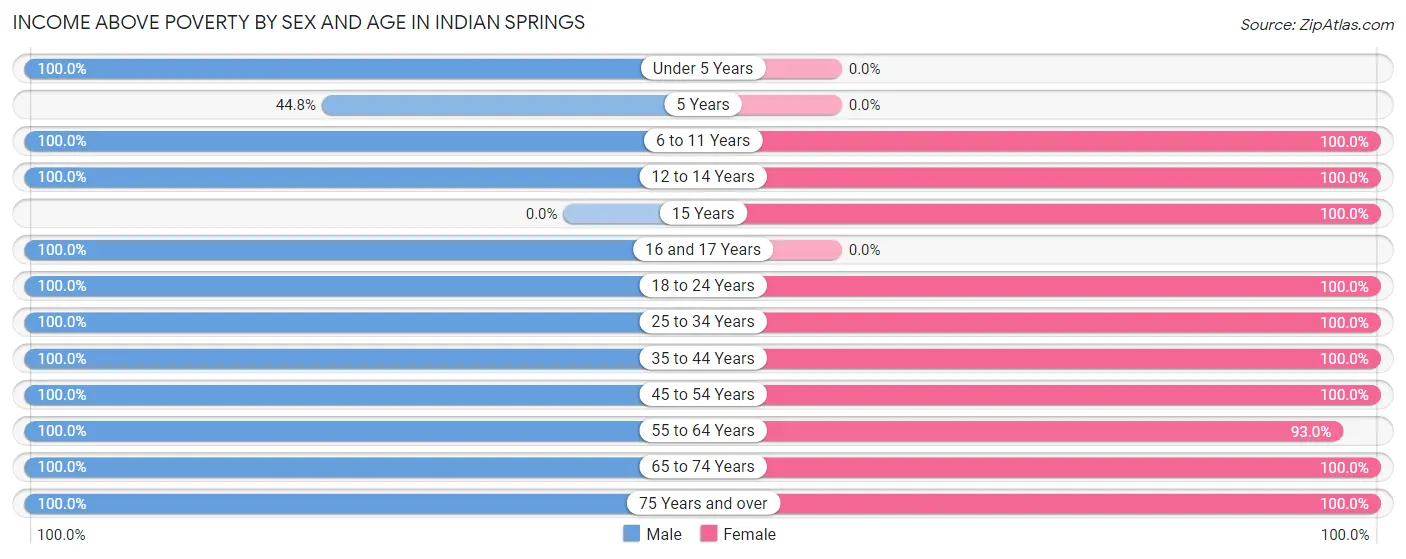
| Age Bracket | Male | Female |
| Under 5 Years | 25 (100.0%) | 0 (0.0%) |
| 5 Years | 13 (44.8%) | 0 (0.0%) |
| 6 to 11 Years | 11 (100.0%) | 83 (100.0%) |
| 12 to 14 Years | 43 (100.0%) | 65 (100.0%) |
| 15 Years | 0 (0.0%) | 18 (100.0%) |
| 16 and 17 Years | 18 (100.0%) | 0 (0.0%) |
| 18 to 24 Years | 189 (100.0%) | 90 (100.0%) |
| 25 to 34 Years | 212 (100.0%) | 36 (100.0%) |
| 35 to 44 Years | 137 (100.0%) | 161 (100.0%) |
| 45 to 54 Years | 146 (100.0%) | 92 (100.0%) |
| 55 to 64 Years | 105 (100.0%) | 214 (93.0%) |
| 65 to 74 Years | 55 (100.0%) | 66 (100.0%) |
| 75 Years and over | 42 (100.0%) | 130 (100.0%) |
| Total | 996 (98.4%) | 955 (98.4%) |
Income Below Poverty Among Married-Couple Families in Indian Springs
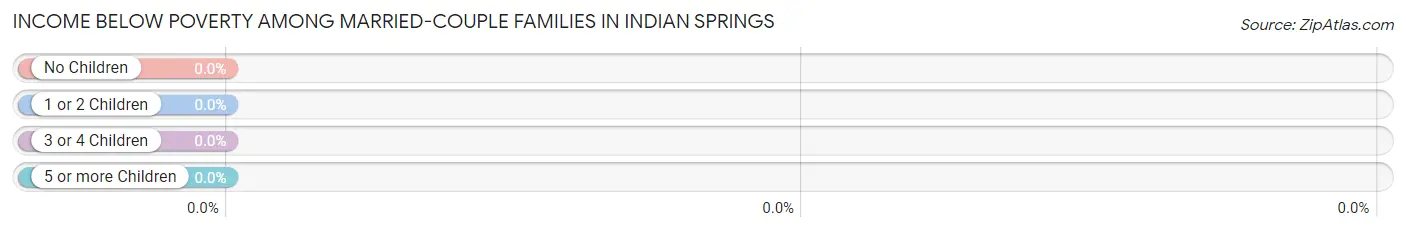
| Children | Above Poverty | Below Poverty |
| No Children | 322 (100.0%) | 0 (0.0%) |
| 1 or 2 Children | 127 (100.0%) | 0 (0.0%) |
| 3 or 4 Children | 0 (0.0%) | 0 (0.0%) |
| 5 or more Children | 0 (0.0%) | 0 (0.0%) |
| Total | 449 (100.0%) | 0 (0.0%) |
Income Below Poverty Among Single-Parent Households in Indian Springs
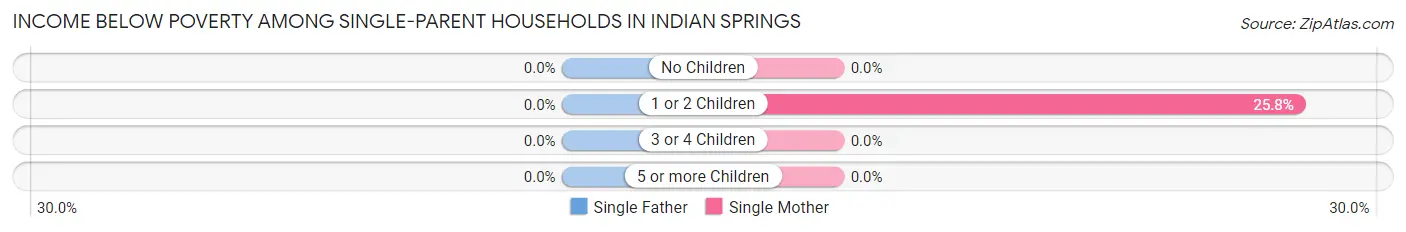
| Children | Single Father | Single Mother |
| No Children | 0 (0.0%) | 0 (0.0%) |
| 1 or 2 Children | 0 (0.0%) | 16 (25.8%) |
| 3 or 4 Children | 0 (0.0%) | 0 (0.0%) |
| 5 or more Children | 0 (0.0%) | 0 (0.0%) |
| Total | 0 (0.0%) | 16 (9.6%) |
Income Below Poverty Among Married-Couple vs Single-Parent Households in Indian Springs
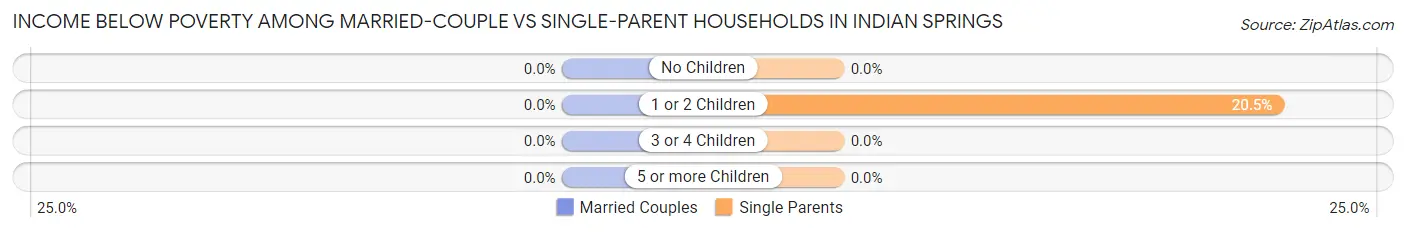
| Children | Married-Couple Families | Single-Parent Households |
| No Children | 0 (0.0%) | 0 (0.0%) |
| 1 or 2 Children | 0 (0.0%) | 16 (20.5%) |
| 3 or 4 Children | 0 (0.0%) | 0 (0.0%) |
| 5 or more Children | 0 (0.0%) | 0 (0.0%) |
| Total | 0 (0.0%) | 16 (8.7%) |
Race in Indian Springs
The most populous races in Indian Springs are White / Caucasian (1,925 | 97.1%), Two or more Races (58 | 2.9%), and Hispanic or Latino (12 | 0.6%).
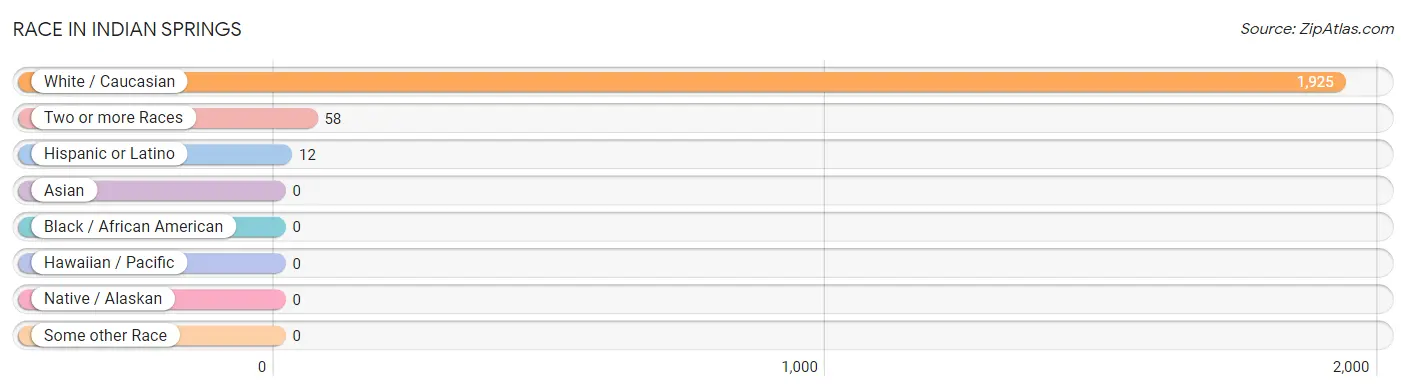
| Race | # Population | % Population |
| Asian | 0 | 0.0% |
| Black / African American | 0 | 0.0% |
| Hawaiian / Pacific | 0 | 0.0% |
| Hispanic or Latino | 12 | 0.6% |
| Native / Alaskan | 0 | 0.0% |
| White / Caucasian | 1,925 | 97.1% |
| Two or more Races | 58 | 2.9% |
| Some other Race | 0 | 0.0% |
| Total | 1,983 | 100.0% |
Ancestry in Indian Springs
The most populous ancestries reported in Indian Springs are American (433 | 21.8%), German (200 | 10.1%), Irish (167 | 8.4%), English (137 | 6.9%), and Scandinavian (49 | 2.5%), together accounting for 49.7% of all Indian Springs residents.
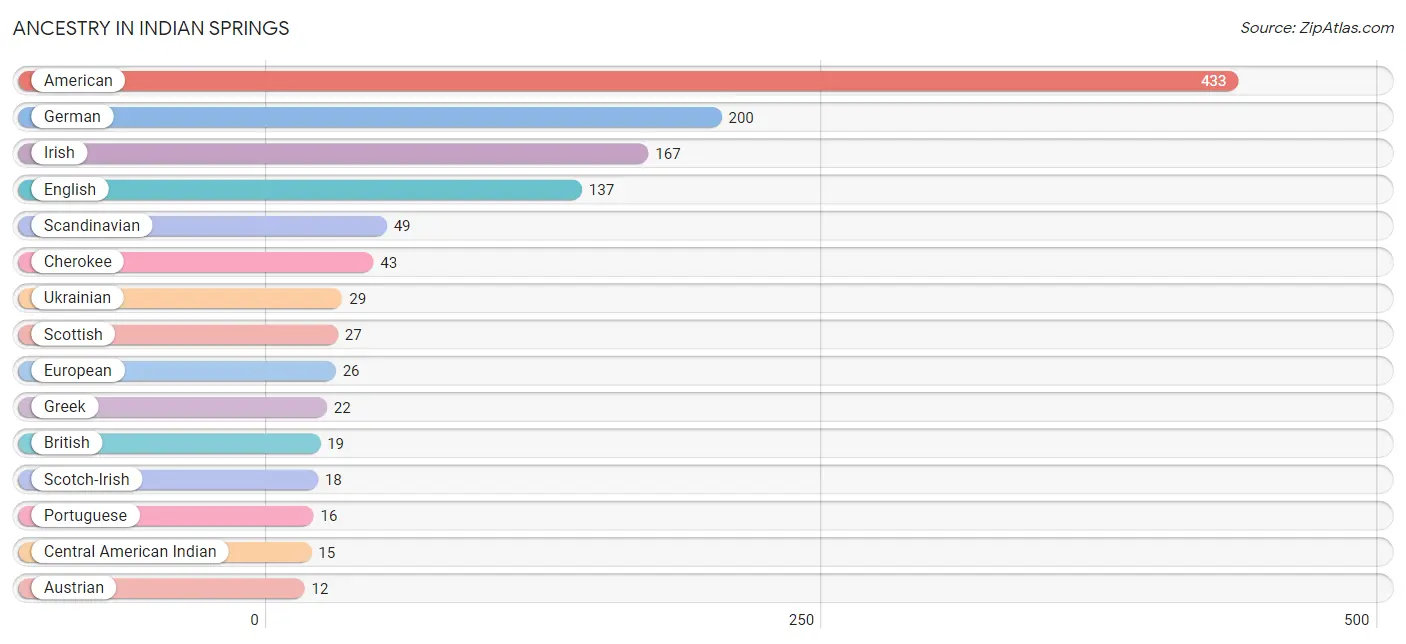
| Ancestry | # Population | % Population |
| American | 433 | 21.8% |
| Austrian | 12 | 0.6% |
| British | 19 | 1.0% |
| Central American Indian | 15 | 0.8% |
| Cherokee | 43 | 2.2% |
| English | 137 | 6.9% |
| European | 26 | 1.3% |
| German | 200 | 10.1% |
| Greek | 22 | 1.1% |
| Irish | 167 | 8.4% |
| Mexican | 12 | 0.6% |
| Portuguese | 16 | 0.8% |
| Scandinavian | 49 | 2.5% |
| Scotch-Irish | 18 | 0.9% |
| Scottish | 27 | 1.4% |
| Ukrainian | 29 | 1.5% | View All 16 Rows |
Immigrants in Indian Springs
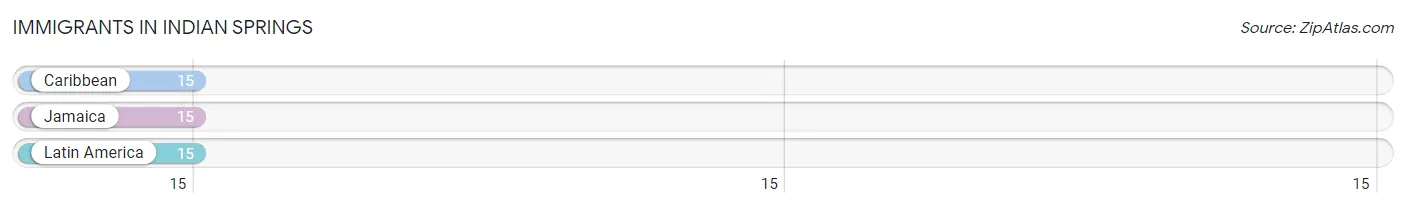
The most numerous immigrant groups reported in Indian Springs came from Caribbean (15 | 0.8%), Jamaica (15 | 0.8%), and Latin America (15 | 0.8%), together accounting for 2.3% of all Indian Springs residents.
| Immigration Origin | # Population | % Population |
| Caribbean | 15 | 0.8% |
| Jamaica | 15 | 0.8% |
| Latin America | 15 | 0.8% | View All 3 Rows |
Sex and Age in Indian Springs
Sex and Age in Indian Springs
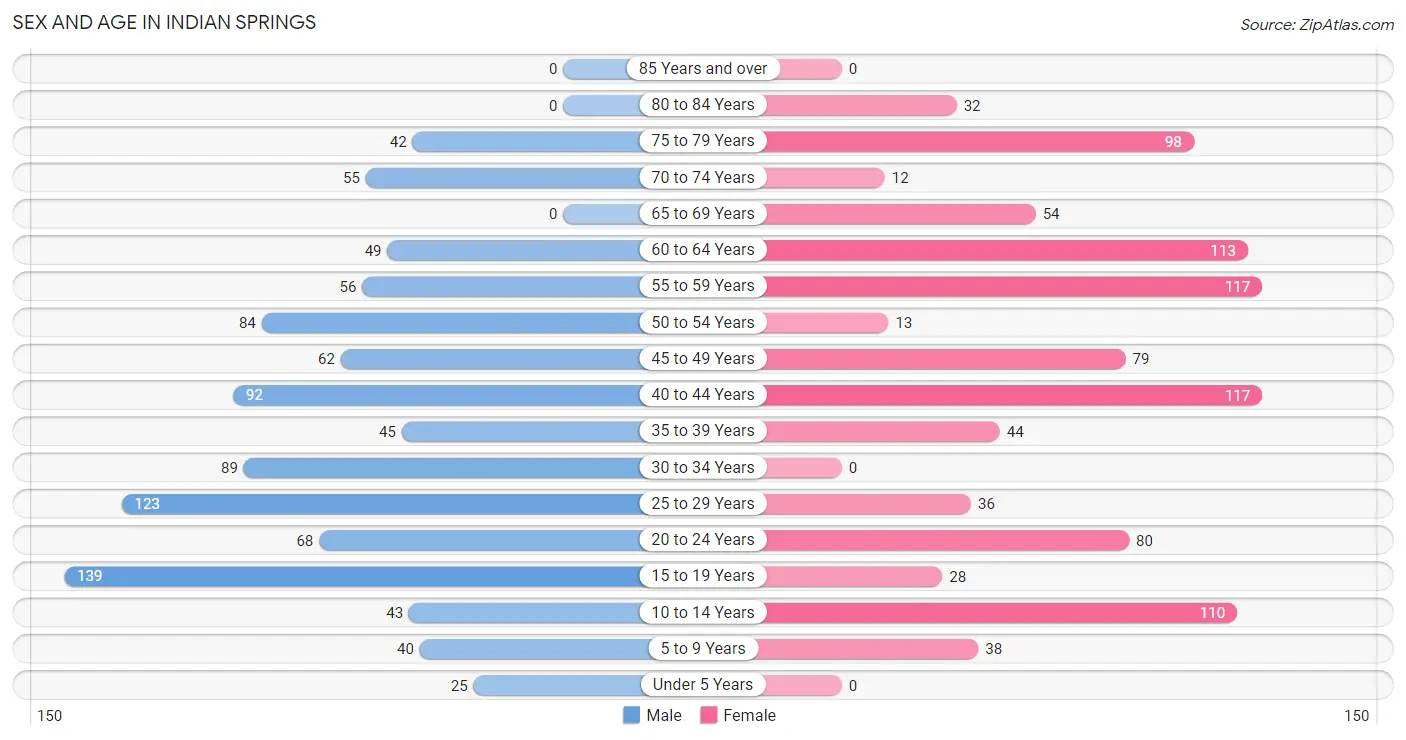
The most populous age groups in Indian Springs are 15 to 19 Years (139 | 13.7%) for men and 40 to 44 Years (117 | 12.0%) for women.
| Age Bracket | Male | Female |
| Under 5 Years | 25 (2.5%) | 0 (0.0%) |
| 5 to 9 Years | 40 (4.0%) | 38 (3.9%) |
| 10 to 14 Years | 43 (4.3%) | 110 (11.3%) |
| 15 to 19 Years | 139 (13.7%) | 28 (2.9%) |
| 20 to 24 Years | 68 (6.7%) | 80 (8.2%) |
| 25 to 29 Years | 123 (12.1%) | 36 (3.7%) |
| 30 to 34 Years | 89 (8.8%) | 0 (0.0%) |
| 35 to 39 Years | 45 (4.4%) | 44 (4.5%) |
| 40 to 44 Years | 92 (9.1%) | 117 (12.0%) |
| 45 to 49 Years | 62 (6.1%) | 79 (8.1%) |
| 50 to 54 Years | 84 (8.3%) | 13 (1.3%) |
| 55 to 59 Years | 56 (5.5%) | 117 (12.0%) |
| 60 to 64 Years | 49 (4.8%) | 113 (11.6%) |
| 65 to 69 Years | 0 (0.0%) | 54 (5.6%) |
| 70 to 74 Years | 55 (5.4%) | 12 (1.2%) |
| 75 to 79 Years | 42 (4.2%) | 98 (10.1%) |
| 80 to 84 Years | 0 (0.0%) | 32 (3.3%) |
| 85 Years and over | 0 (0.0%) | 0 (0.0%) |
| Total | 1,012 (100.0%) | 971 (100.0%) |
Families and Households in Indian Springs
Median Family Size in Indian Springs
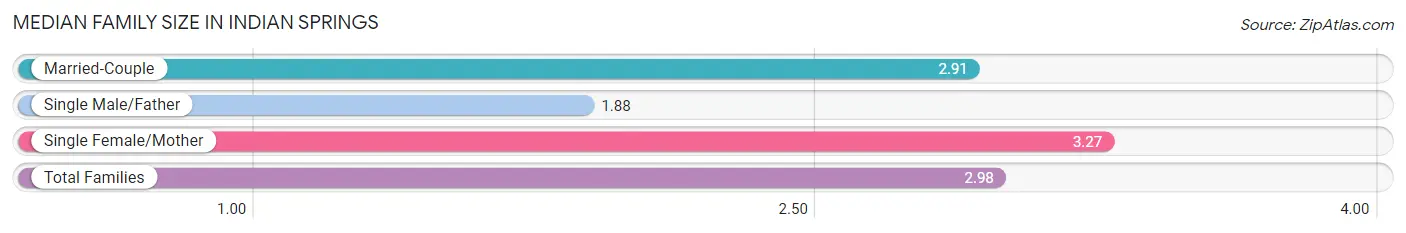
The median family size in Indian Springs is 2.98 persons per family, with single female/mother families (167 | 26.4%) accounting for the largest median family size of 3.27 persons per family. On the other hand, single male/father families (16 | 2.5%) represent the smallest median family size with 1.88 persons per family.
| Family Type | # Families | Family Size |
| Married-Couple | 449 (71.0%) | 2.91 |
| Single Male/Father | 16 (2.5%) | 1.88 |
| Single Female/Mother | 167 (26.4%) | 3.27 |
| Total Families | 632 (100.0%) | 2.98 |
Median Household Size in Indian Springs
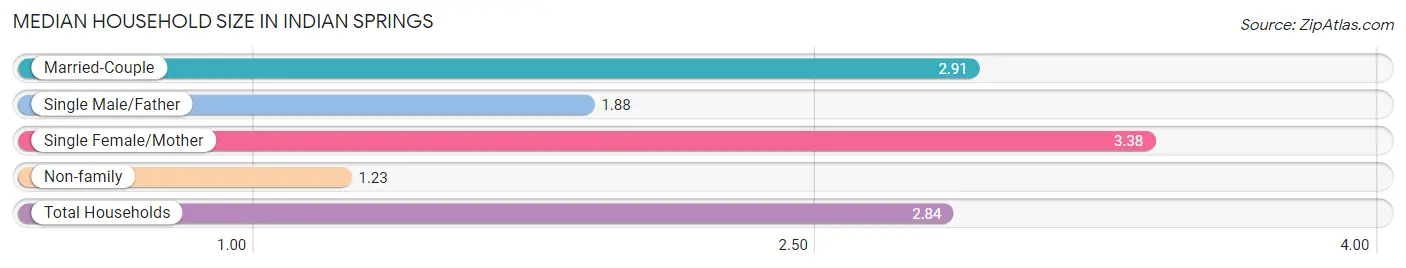
The median household size in Indian Springs is 2.84 persons per household, with single female/mother households (167 | 23.9%) accounting for the largest median household size of 3.38 persons per household. non-family households (66 | 9.5%) represent the smallest median household size with 1.23 persons per household.
| Household Type | # Households | Household Size |
| Married-Couple | 449 (64.3%) | 2.91 |
| Single Male/Father | 16 (2.3%) | 1.88 |
| Single Female/Mother | 167 (23.9%) | 3.38 |
| Non-family | 66 (9.5%) | 1.23 |
| Total Households | 698 (100.0%) | 2.84 |
Household Size by Marriage Status in Indian Springs
Out of a total of 698 households in Indian Springs, 632 (90.5%) are family households, while 66 (9.5%) are nonfamily households. The most numerous type of family households are 3-person households, comprising 269, and the most common type of nonfamily households are 1-person households, comprising 50.
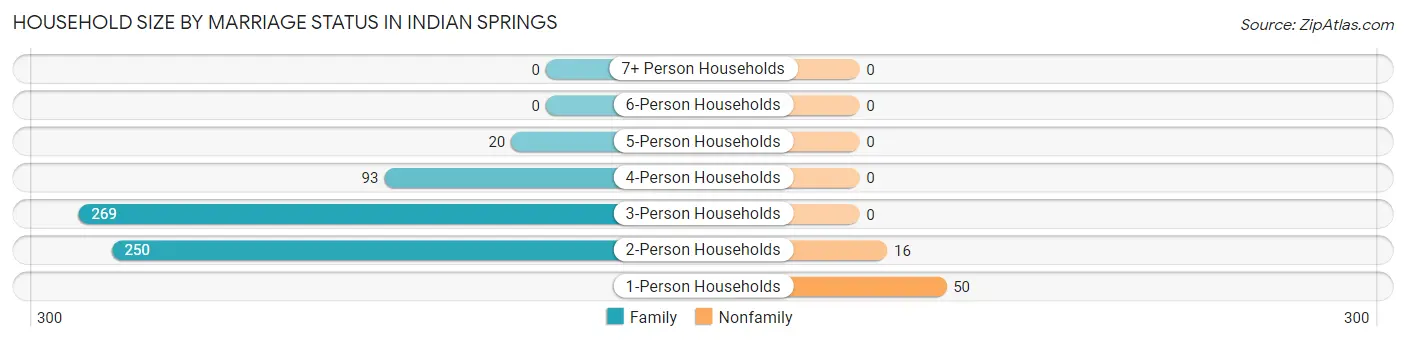
| Household Size | Family Households | Nonfamily Households |
| 1-Person Households | - | 50 (7.2%) |
| 2-Person Households | 250 (35.8%) | 16 (2.3%) |
| 3-Person Households | 269 (38.5%) | 0 (0.0%) |
| 4-Person Households | 93 (13.3%) | 0 (0.0%) |
| 5-Person Households | 20 (2.9%) | 0 (0.0%) |
| 6-Person Households | 0 (0.0%) | 0 (0.0%) |
| 7+ Person Households | 0 (0.0%) | 0 (0.0%) |
| Total | 632 (90.5%) | 66 (9.5%) |
Female Fertility in Indian Springs
Fertility by Age in Indian Springs
Average fertility rate in Indian Springs is 57.0 births per 1,000 women. Women in the age bracket of 20 to 34 years have the highest fertility rate with 190.0 births per 1,000 women. Women in the age bracket of 20 to 34 years acount for 100.0% of all women with births.
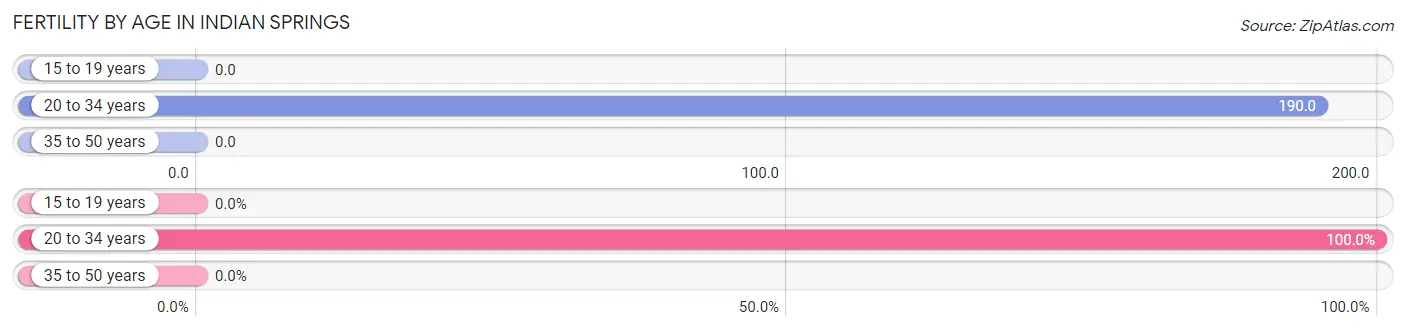
| Age Bracket | Women with Births | Births / 1,000 Women |
| 15 to 19 years | 0 (0.0%) | 0.0 |
| 20 to 34 years | 22 (100.0%) | 190.0 |
| 35 to 50 years | 0 (0.0%) | 0.0 |
| Total | 22 (100.0%) | 57.0 |
Fertility by Age by Marriage Status in Indian Springs
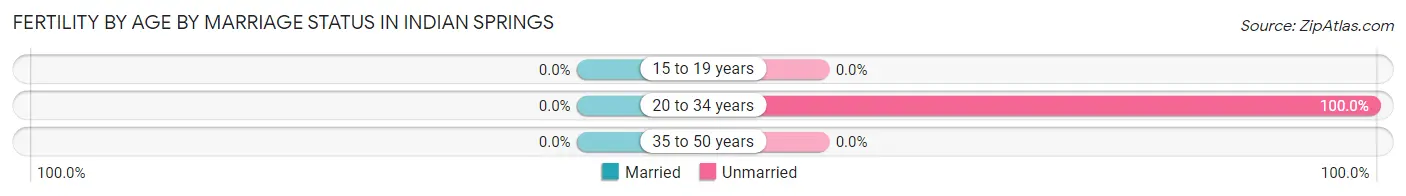
| Age Bracket | Married | Unmarried |
| 15 to 19 years | 0 (0.0%) | 0 (0.0%) |
| 20 to 34 years | 0 (0.0%) | 22 (100.0%) |
| 35 to 50 years | 0 (0.0%) | 0 (0.0%) |
| Total | 0 (0.0%) | 22 (100.0%) |
Fertility by Education in Indian Springs
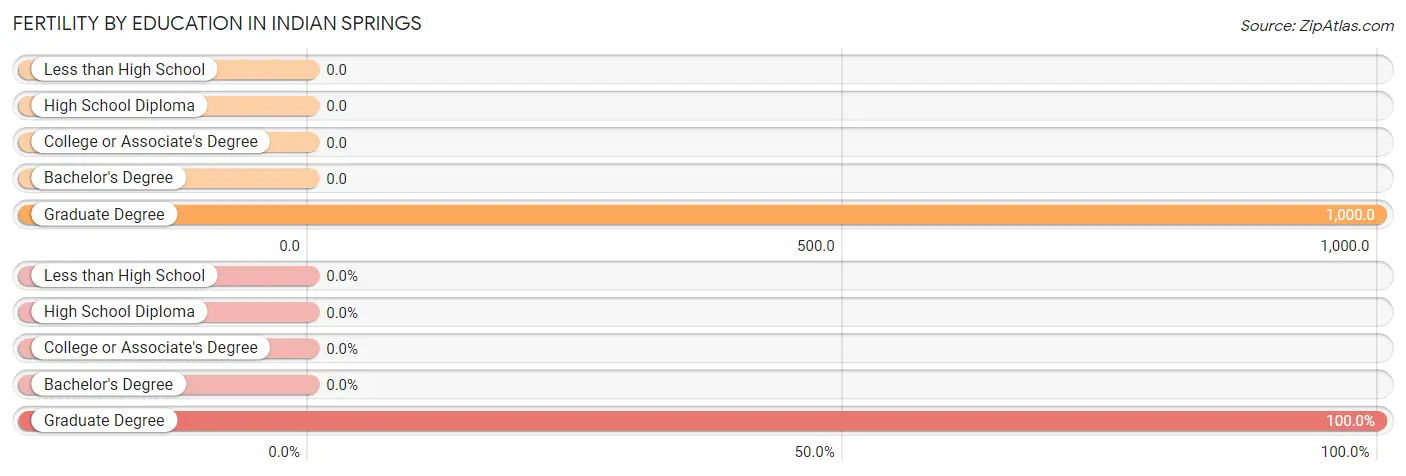
| Educational Attainment | Women with Births | Births / 1,000 Women |
| Less than High School | 0 (0.0%) | 0.0 |
| High School Diploma | 0 (0.0%) | 0.0 |
| College or Associate's Degree | 0 (0.0%) | 0.0 |
| Bachelor's Degree | 0 (0.0%) | 0.0 |
| Graduate Degree | 22 (100.0%) | 1,000.0 |
| Total | 22 (100.0%) | 57.0 |
Fertility by Education by Marriage Status in Indian Springs
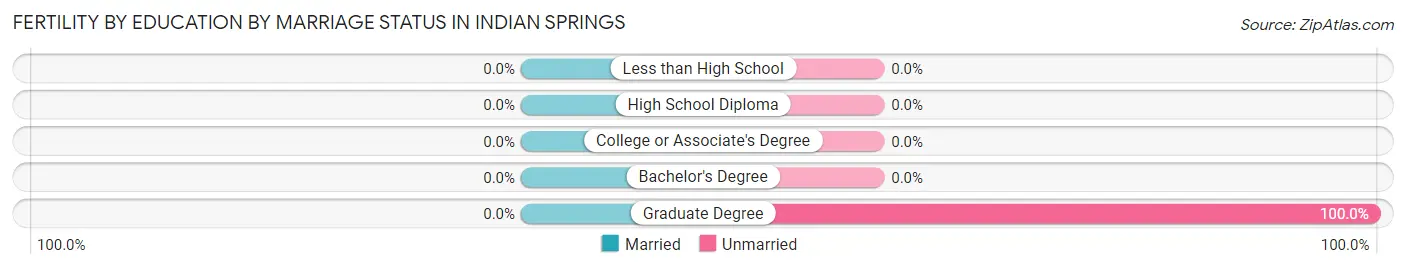
| Educational Attainment | Married | Unmarried |
| Less than High School | 0 (0.0%) | 0 (0.0%) |
| High School Diploma | 0 (0.0%) | 0 (0.0%) |
| College or Associate's Degree | 0 (0.0%) | 0 (0.0%) |
| Bachelor's Degree | 0 (0.0%) | 0 (0.0%) |
| Graduate Degree | 0 (0.0%) | 22 (100.0%) |
| Total | 0 (0.0%) | 22 (100.0%) |
Employment Characteristics in Indian Springs
Employment by Class of Employer in Indian Springs
Among the 1,209 employed individuals in Indian Springs, private company employees (1,005 | 83.1%), local government employees (68 | 5.6%), and federal government employees (49 | 4.1%) make up the most common classes of employment.

| Employer Class | # Employees | % Employees |
| Private Company Employees | 1,005 | 83.1% |
| Self-Employed (Incorporated) | 31 | 2.6% |
| Self-Employed (Not Incorporated) | 29 | 2.4% |
| Not-for-profit Organizations | 19 | 1.6% |
| Local Government Employees | 68 | 5.6% |
| State Government Employees | 8 | 0.7% |
| Federal Government Employees | 49 | 4.1% |
| Unpaid Family Workers | 0 | 0.0% |
| Total | 1,209 | 100.0% |
Employment Status by Age in Indian Springs
According to the labor force statistics for Indian Springs, out of the total population over 16 years of age (1,709), 72.6% or 1,241 individuals are in the labor force, with 2.6% or 32 of them unemployed. The age group with the highest labor force participation rate is 25 to 29 years, with 100.0% or 159 individuals in the labor force. Within the labor force, the 60 to 64 years age range has the highest percentage of unemployed individuals, with 11.3% or 16 of them being unemployed.
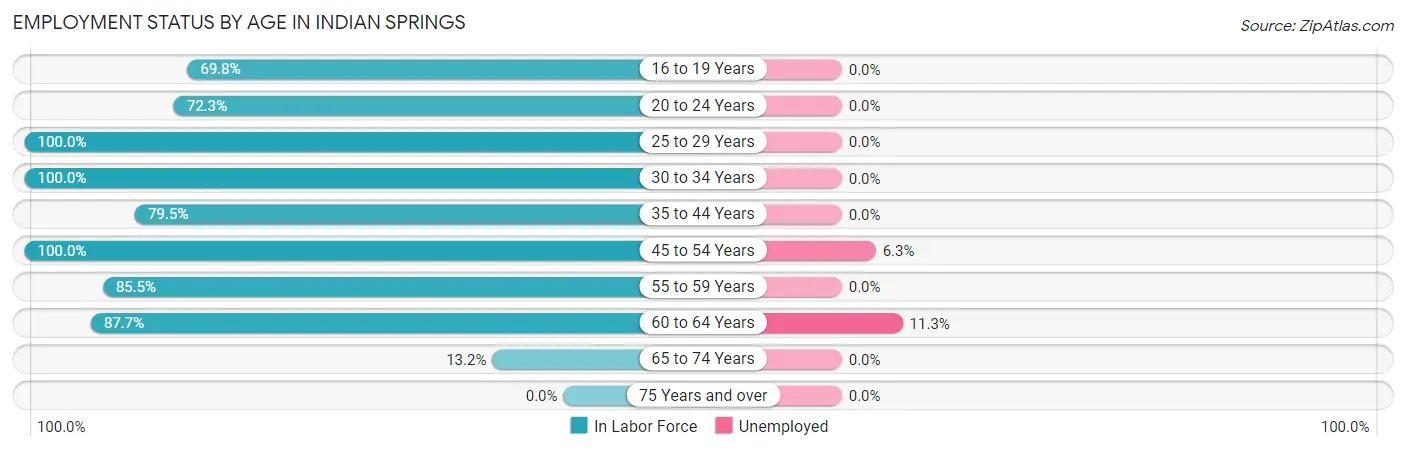
| Age Bracket | In Labor Force | Unemployed |
| 16 to 19 Years | 104 (69.8%) | 0 (0.0%) |
| 20 to 24 Years | 107 (72.3%) | 0 (0.0%) |
| 25 to 29 Years | 159 (100.0%) | 0 (0.0%) |
| 30 to 34 Years | 89 (100.0%) | 0 (0.0%) |
| 35 to 44 Years | 237 (79.5%) | 0 (0.0%) |
| 45 to 54 Years | 238 (100.0%) | 15 (6.3%) |
| 55 to 59 Years | 148 (85.5%) | 0 (0.0%) |
| 60 to 64 Years | 142 (87.7%) | 16 (11.3%) |
| 65 to 74 Years | 16 (13.2%) | 0 (0.0%) |
| 75 Years and over | 0 (0.0%) | 0 (0.0%) |
| Total | 1,241 (72.6%) | 32 (2.6%) |
Employment Status by Educational Attainment in Indian Springs
According to labor force statistics for Indian Springs, 90.5% of individuals (1,013) out of the total population between 25 and 64 years of age (1,119) are in the labor force, with 3.2% or 32 of them being unemployed. The group with the highest labor force participation rate are those with the educational attainment of high school diploma, with 100.0% or 289 individuals in the labor force. Within the labor force, individuals with high school diploma education have the highest percentage of unemployment, with 5.5% or 16 of them being unemployed.
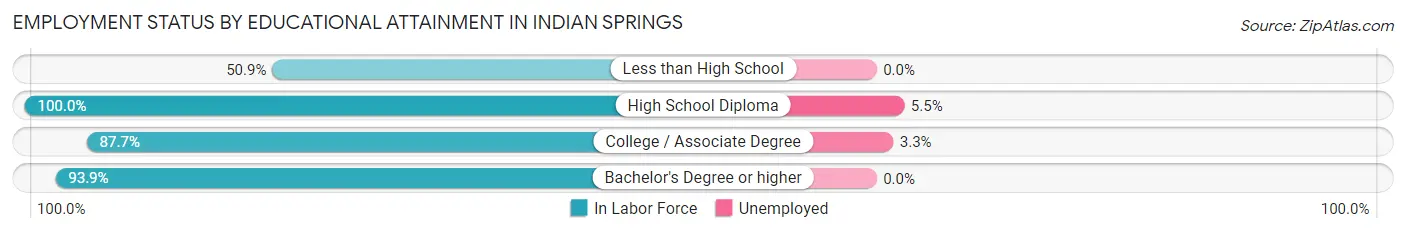
| Educational Attainment | In Labor Force | Unemployed |
| Less than High School | 28 (50.9%) | 0 (0.0%) |
| High School Diploma | 289 (100.0%) | 16 (5.5%) |
| College / Associate Degree | 448 (87.7%) | 17 (3.3%) |
| Bachelor's Degree or higher | 248 (93.9%) | 0 (0.0%) |
| Total | 1,013 (90.5%) | 36 (3.2%) |
Employment Occupations by Sex in Indian Springs
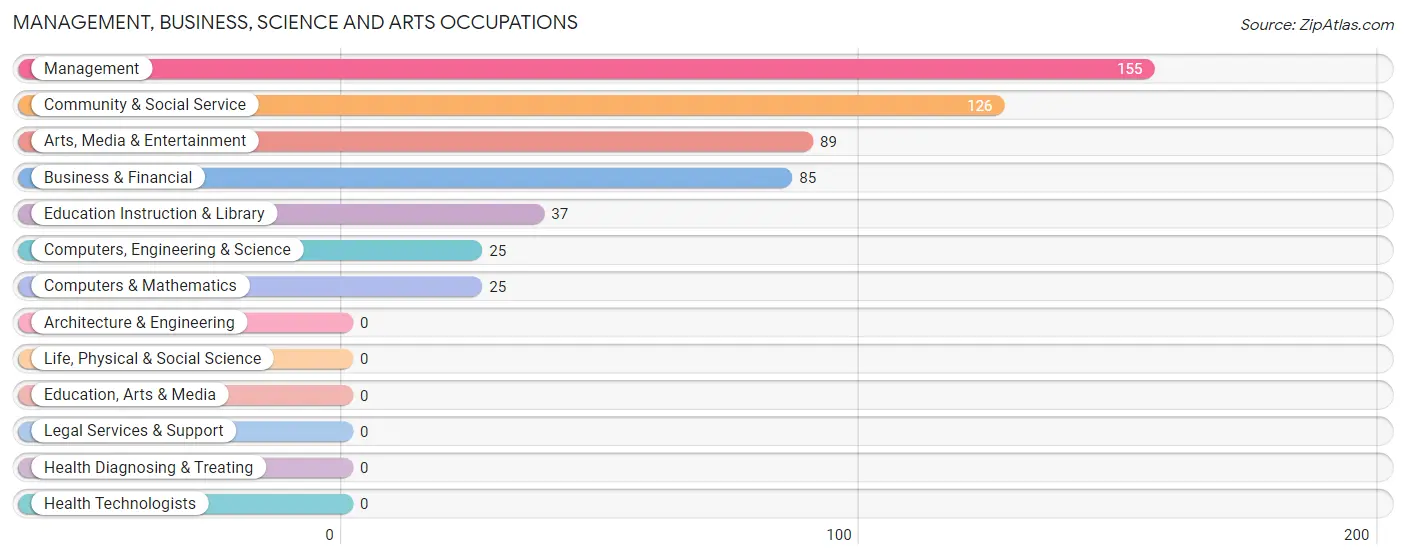
Management, Business, Science and Arts Occupations
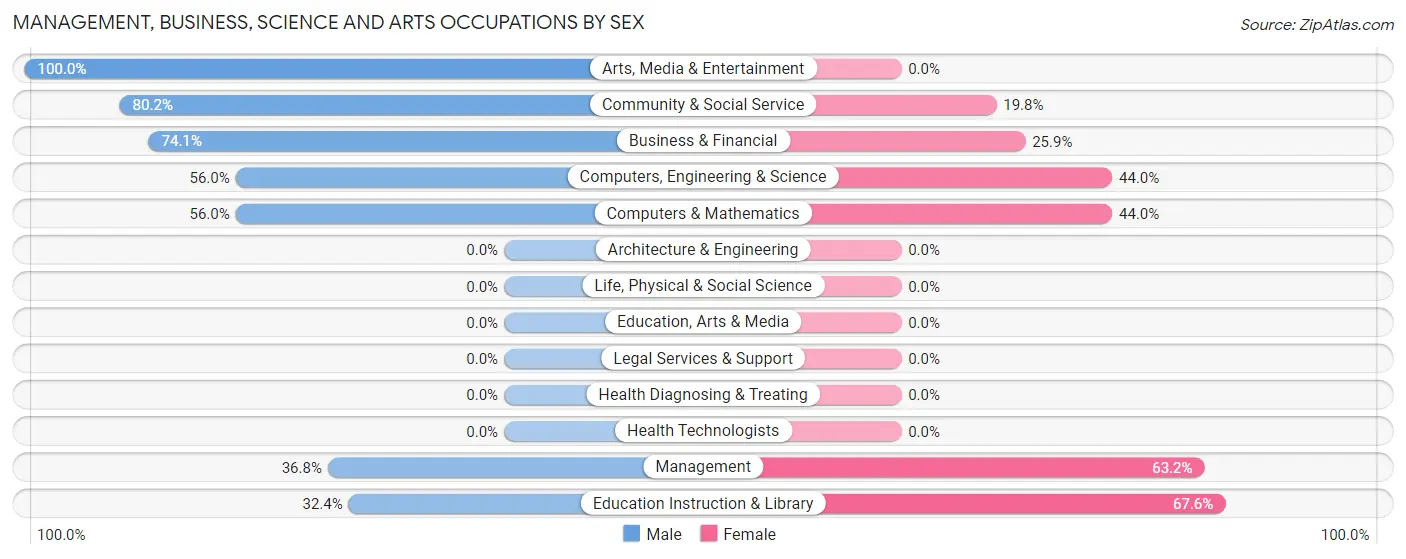
The most common Management, Business, Science and Arts occupations in Indian Springs are Management (155 | 13.2%), Community & Social Service (126 | 10.7%), Arts, Media & Entertainment (89 | 7.6%), Business & Financial (85 | 7.2%), and Education Instruction & Library (37 | 3.2%).
Management, Business, Science and Arts Occupations by Sex
Within the Management, Business, Science and Arts occupations in Indian Springs, the most male-oriented occupations are Arts, Media & Entertainment (100.0%), Community & Social Service (80.2%), and Business & Financial (74.1%), while the most female-oriented occupations are Education Instruction & Library (67.6%), Management (63.2%), and Computers, Engineering & Science (44.0%).
| Occupation | Male | Female |
| Management | 57 (36.8%) | 98 (63.2%) |
| Business & Financial | 63 (74.1%) | 22 (25.9%) |
| Computers, Engineering & Science | 14 (56.0%) | 11 (44.0%) |
| Computers & Mathematics | 14 (56.0%) | 11 (44.0%) |
| Architecture & Engineering | 0 (0.0%) | 0 (0.0%) |
| Life, Physical & Social Science | 0 (0.0%) | 0 (0.0%) |
| Community & Social Service | 101 (80.2%) | 25 (19.8%) |
| Education, Arts & Media | 0 (0.0%) | 0 (0.0%) |
| Legal Services & Support | 0 (0.0%) | 0 (0.0%) |
| Education Instruction & Library | 12 (32.4%) | 25 (67.6%) |
| Arts, Media & Entertainment | 89 (100.0%) | 0 (0.0%) |
| Health Diagnosing & Treating | 0 (0.0%) | 0 (0.0%) |
| Health Technologists | 0 (0.0%) | 0 (0.0%) |
| Total (Category) | 235 (60.1%) | 156 (39.9%) |
| Total (Overall) | 662 (56.4%) | 511 (43.6%) |
Services Occupations
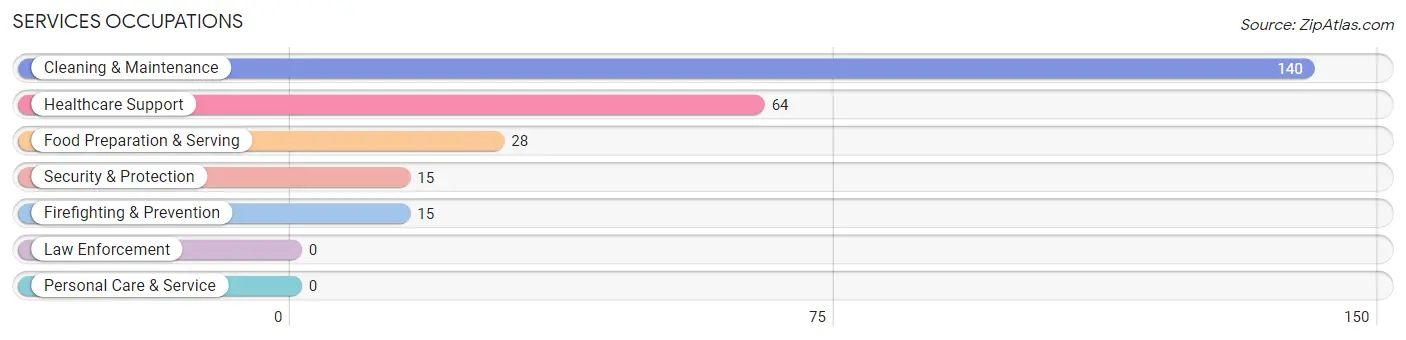
The most common Services occupations in Indian Springs are Cleaning & Maintenance (140 | 11.9%), Healthcare Support (64 | 5.5%), Food Preparation & Serving (28 | 2.4%), Security & Protection (15 | 1.3%), and Firefighting & Prevention (15 | 1.3%).
Services Occupations by Sex
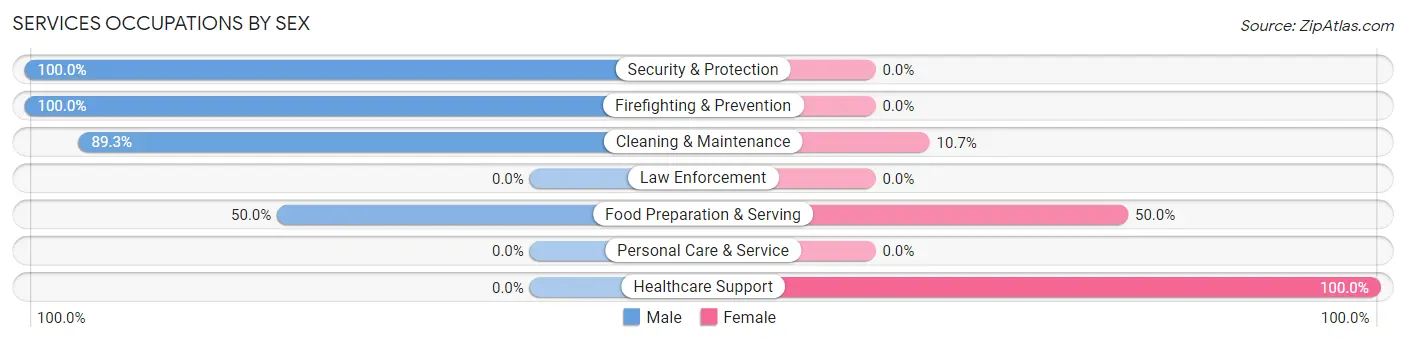
Within the Services occupations in Indian Springs, the most male-oriented occupations are Security & Protection (100.0%), Firefighting & Prevention (100.0%), and Cleaning & Maintenance (89.3%), while the most female-oriented occupations are Healthcare Support (100.0%), Food Preparation & Serving (50.0%), and Cleaning & Maintenance (10.7%).
| Occupation | Male | Female |
| Healthcare Support | 0 (0.0%) | 64 (100.0%) |
| Security & Protection | 15 (100.0%) | 0 (0.0%) |
| Firefighting & Prevention | 15 (100.0%) | 0 (0.0%) |
| Law Enforcement | 0 (0.0%) | 0 (0.0%) |
| Food Preparation & Serving | 14 (50.0%) | 14 (50.0%) |
| Cleaning & Maintenance | 125 (89.3%) | 15 (10.7%) |
| Personal Care & Service | 0 (0.0%) | 0 (0.0%) |
| Total (Category) | 154 (62.4%) | 93 (37.7%) |
| Total (Overall) | 662 (56.4%) | 511 (43.6%) |
Sales and Office Occupations
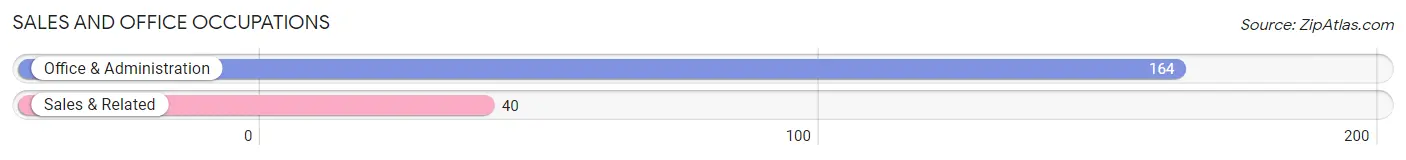
The most common Sales and Office occupations in Indian Springs are Office & Administration (164 | 14.0%), and Sales & Related (40 | 3.4%).
Sales and Office Occupations by Sex
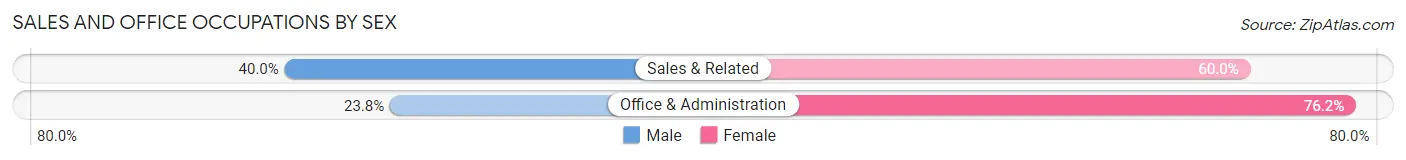
| Occupation | Male | Female |
| Sales & Related | 16 (40.0%) | 24 (60.0%) |
| Office & Administration | 39 (23.8%) | 125 (76.2%) |
| Total (Category) | 55 (27.0%) | 149 (73.0%) |
| Total (Overall) | 662 (56.4%) | 511 (43.6%) |
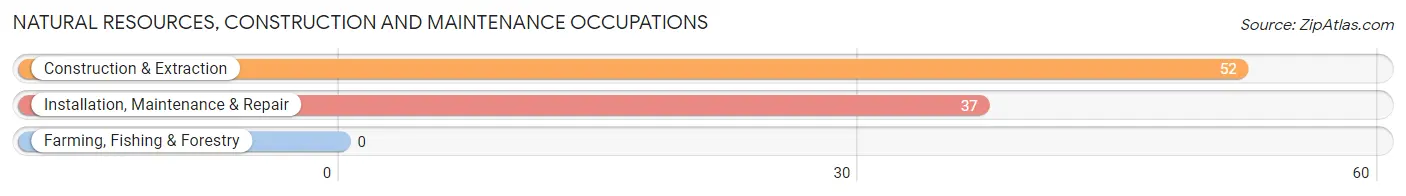
Natural Resources, Construction and Maintenance Occupations
The most common Natural Resources, Construction and Maintenance occupations in Indian Springs are Construction & Extraction (52 | 4.4%), and Installation, Maintenance & Repair (37 | 3.2%).
Natural Resources, Construction and Maintenance Occupations by Sex
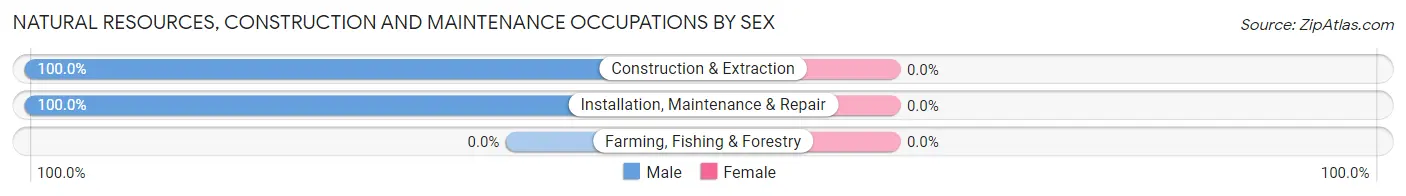
| Occupation | Male | Female |
| Farming, Fishing & Forestry | 0 (0.0%) | 0 (0.0%) |
| Construction & Extraction | 52 (100.0%) | 0 (0.0%) |
| Installation, Maintenance & Repair | 37 (100.0%) | 0 (0.0%) |
| Total (Category) | 89 (100.0%) | 0 (0.0%) |
| Total (Overall) | 662 (56.4%) | 511 (43.6%) |
Production, Transportation and Moving Occupations
The most common Production, Transportation and Moving occupations in Indian Springs are Production (150 | 12.8%), Transportation (52 | 4.4%), and Material Moving (40 | 3.4%).
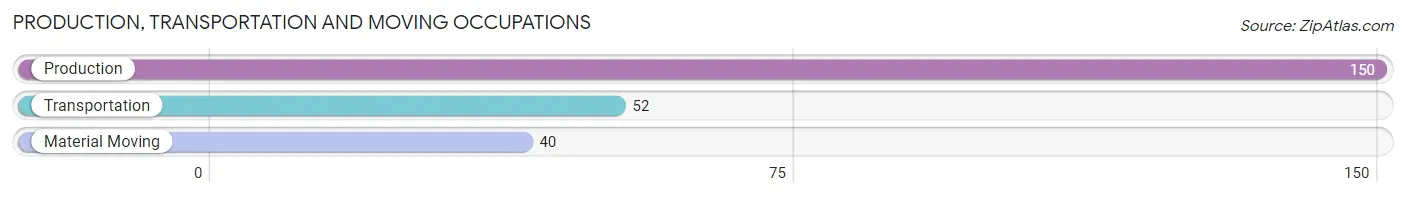
Production, Transportation and Moving Occupations by Sex
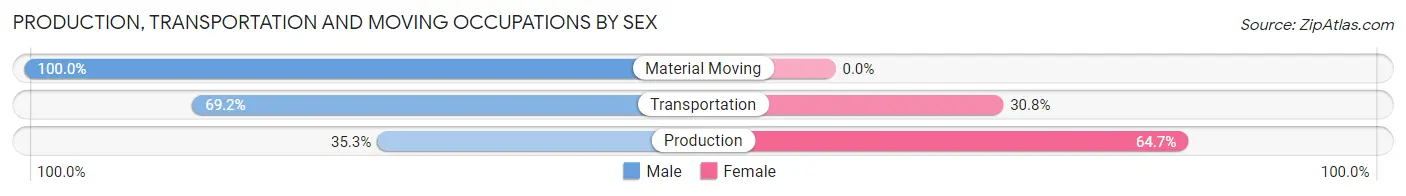
| Occupation | Male | Female |
| Production | 53 (35.3%) | 97 (64.7%) |
| Transportation | 36 (69.2%) | 16 (30.8%) |
| Material Moving | 40 (100.0%) | 0 (0.0%) |
| Total (Category) | 129 (53.3%) | 113 (46.7%) |
| Total (Overall) | 662 (56.4%) | 511 (43.6%) |
Employment Industries by Sex in Indian Springs
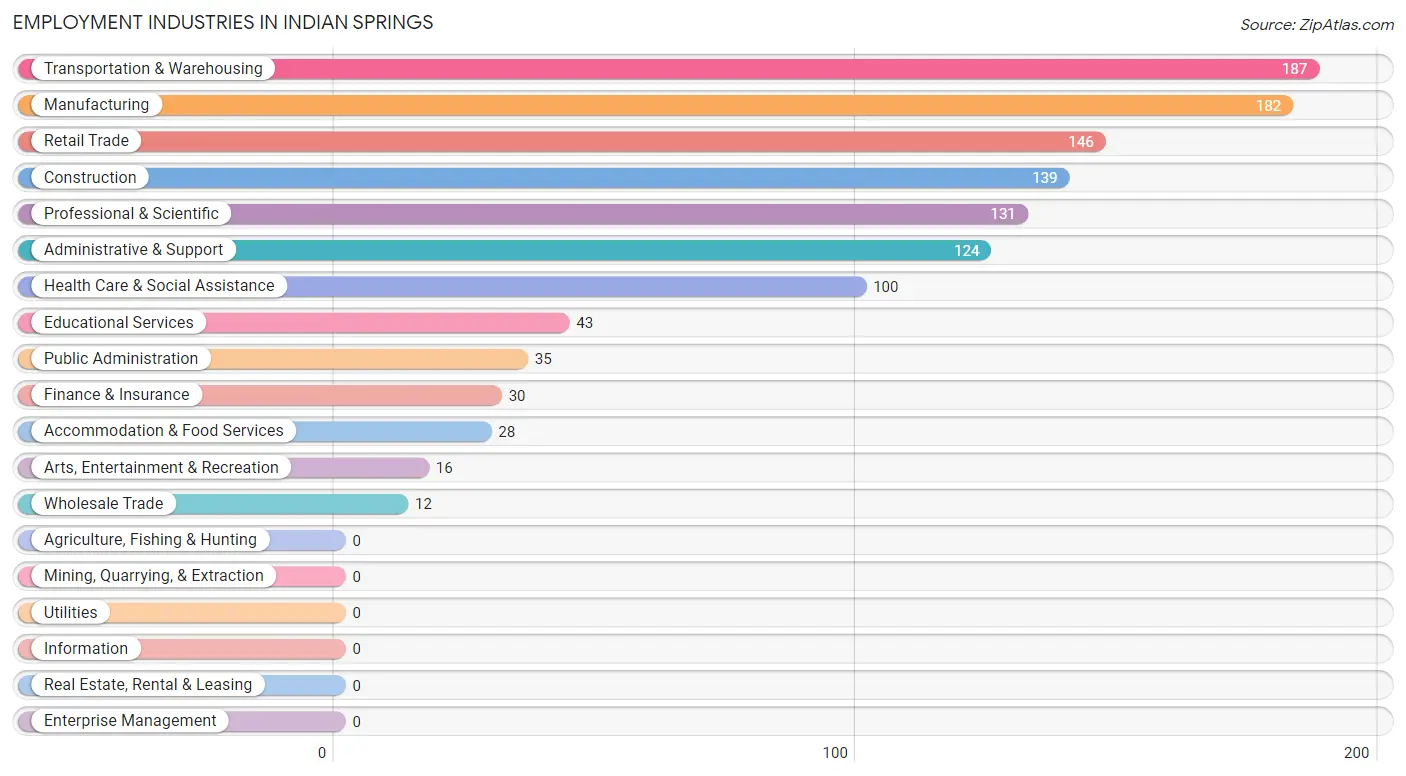
Employment Industries in Indian Springs
The major employment industries in Indian Springs include Transportation & Warehousing (187 | 15.9%), Manufacturing (182 | 15.5%), Retail Trade (146 | 12.4%), Construction (139 | 11.8%), and Professional & Scientific (131 | 11.2%).
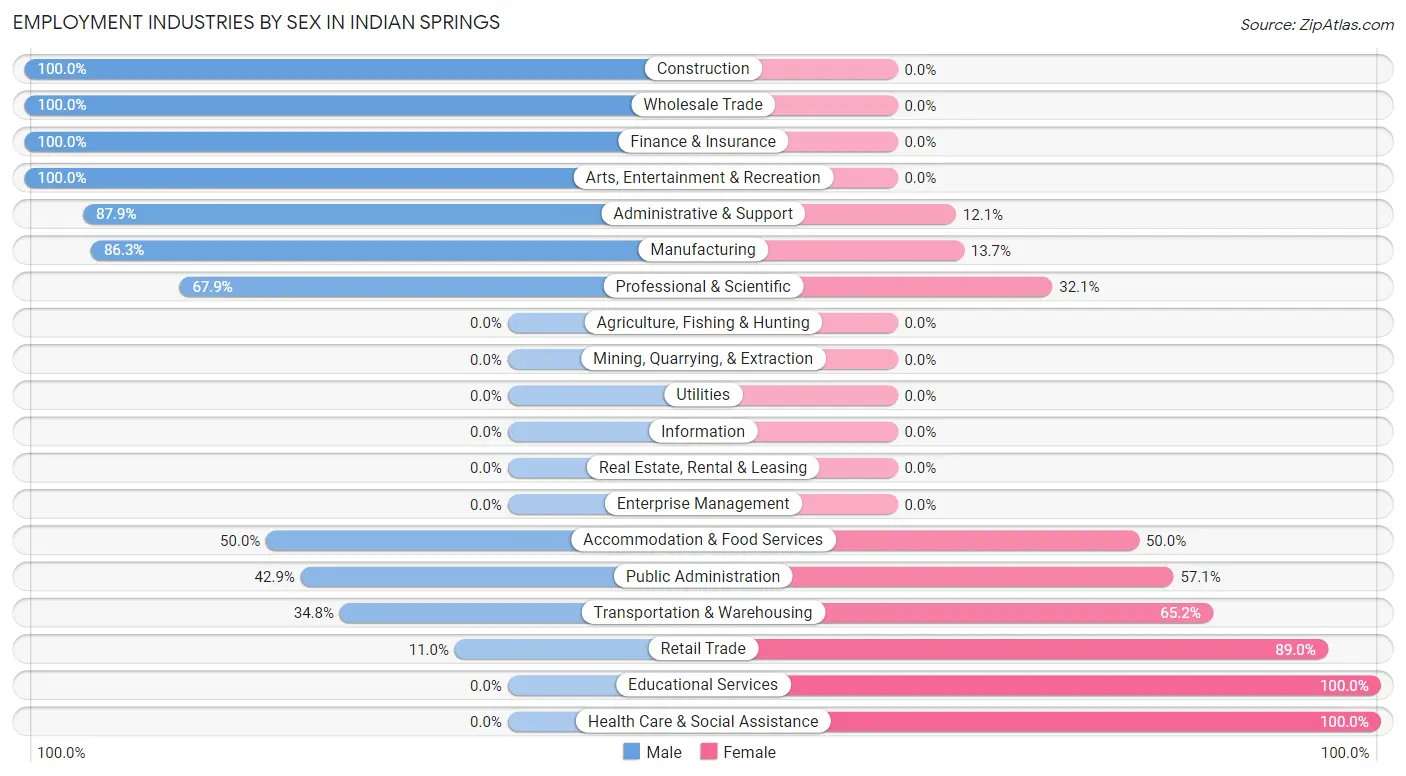
Employment Industries by Sex in Indian Springs
The Indian Springs industries that see more men than women are Construction (100.0%), Wholesale Trade (100.0%), and Finance & Insurance (100.0%), whereas the industries that tend to have a higher number of women are Educational Services (100.0%), Health Care & Social Assistance (100.0%), and Retail Trade (89.0%).
| Industry | Male | Female |
| Agriculture, Fishing & Hunting | 0 (0.0%) | 0 (0.0%) |
| Mining, Quarrying, & Extraction | 0 (0.0%) | 0 (0.0%) |
| Construction | 139 (100.0%) | 0 (0.0%) |
| Manufacturing | 157 (86.3%) | 25 (13.7%) |
| Wholesale Trade | 12 (100.0%) | 0 (0.0%) |
| Retail Trade | 16 (11.0%) | 130 (89.0%) |
| Transportation & Warehousing | 65 (34.8%) | 122 (65.2%) |
| Utilities | 0 (0.0%) | 0 (0.0%) |
| Information | 0 (0.0%) | 0 (0.0%) |
| Finance & Insurance | 30 (100.0%) | 0 (0.0%) |
| Real Estate, Rental & Leasing | 0 (0.0%) | 0 (0.0%) |
| Professional & Scientific | 89 (67.9%) | 42 (32.1%) |
| Enterprise Management | 0 (0.0%) | 0 (0.0%) |
| Administrative & Support | 109 (87.9%) | 15 (12.1%) |
| Educational Services | 0 (0.0%) | 43 (100.0%) |
| Health Care & Social Assistance | 0 (0.0%) | 100 (100.0%) |
| Arts, Entertainment & Recreation | 16 (100.0%) | 0 (0.0%) |
| Accommodation & Food Services | 14 (50.0%) | 14 (50.0%) |
| Public Administration | 15 (42.9%) | 20 (57.1%) |
| Total | 662 (56.4%) | 511 (43.6%) |
Education in Indian Springs
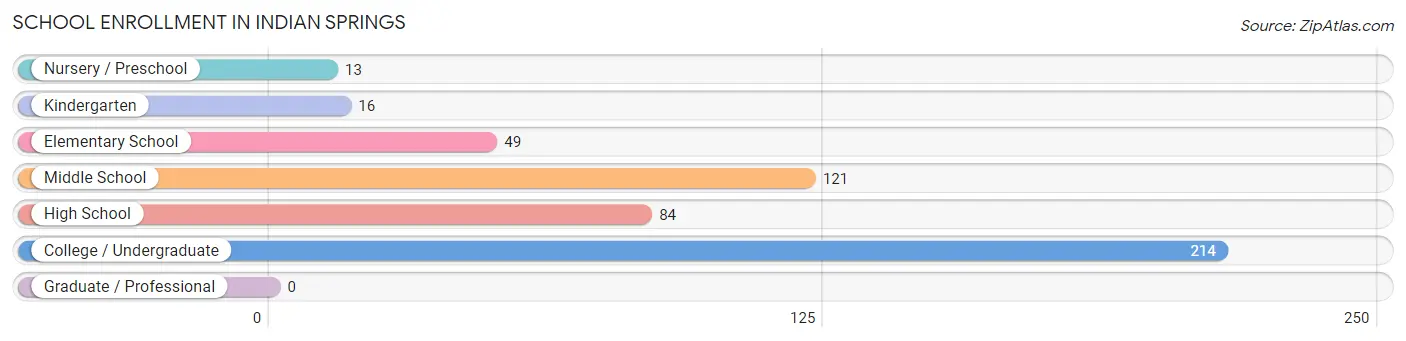
School Enrollment in Indian Springs
The most common levels of schooling among the 497 students in Indian Springs are college / undergraduate (214 | 43.1%), middle school (121 | 24.3%), and high school (84 | 16.9%).
| School Level | # Students | % Students |
| Nursery / Preschool | 13 | 2.6% |
| Kindergarten | 16 | 3.2% |
| Elementary School | 49 | 9.9% |
| Middle School | 121 | 24.3% |
| High School | 84 | 16.9% |
| College / Undergraduate | 214 | 43.1% |
| Graduate / Professional | 0 | 0.0% |
| Total | 497 | 100.0% |
School Enrollment by Age by Funding Source in Indian Springs
Out of a total of 497 students who are enrolled in schools in Indian Springs, 126 (25.4%) attend a private institution, while the remaining 371 (74.6%) are enrolled in public schools. The age group of 5 to 9 year old has the highest likelihood of being enrolled in private schools, with 41 (52.6% in the age bracket) enrolled. Conversely, the age group of 15 to 17 year olds has the lowest likelihood of being enrolled in a private school, with 36 (100.0% in the age bracket) attending a public institution.
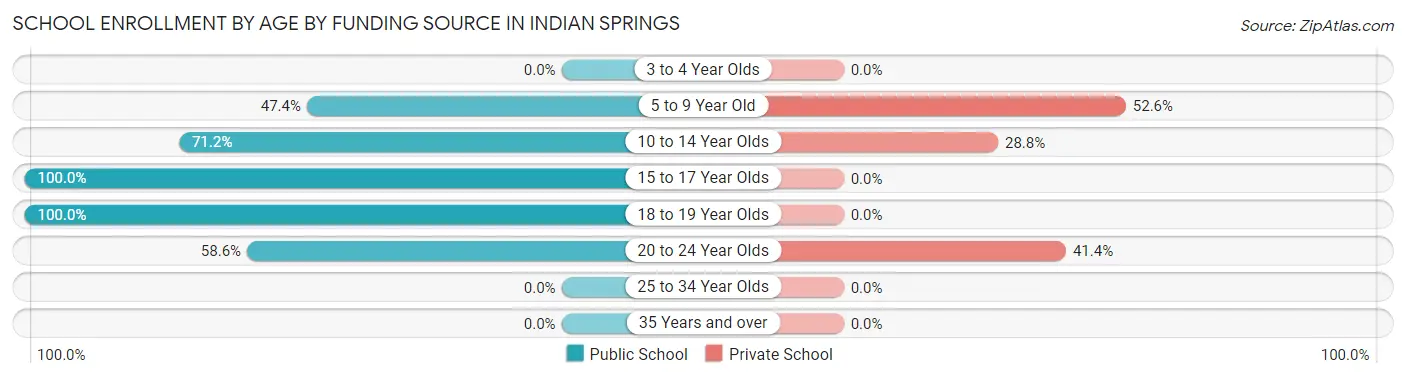
| Age Bracket | Public School | Private School |
| 3 to 4 Year Olds | 0 (0.0%) | 0 (0.0%) |
| 5 to 9 Year Old | 37 (47.4%) | 41 (52.6%) |
| 10 to 14 Year Olds | 109 (71.2%) | 44 (28.8%) |
| 15 to 17 Year Olds | 36 (100.0%) | 0 (0.0%) |
| 18 to 19 Year Olds | 131 (100.0%) | 0 (0.0%) |
| 20 to 24 Year Olds | 58 (58.6%) | 41 (41.4%) |
| 25 to 34 Year Olds | 0 (0.0%) | 0 (0.0%) |
| 35 Years and over | 0 (0.0%) | 0 (0.0%) |
| Total | 371 (74.6%) | 126 (25.4%) |
Educational Attainment by Field of Study in Indian Springs
Business (94 | 34.6%), computers & mathematics (50 | 18.4%), science & technology (42 | 15.4%), liberal arts & history (30 | 11.0%), and education (26 | 9.6%) are the most common fields of study among 272 individuals in Indian Springs who have obtained a bachelor's degree or higher.
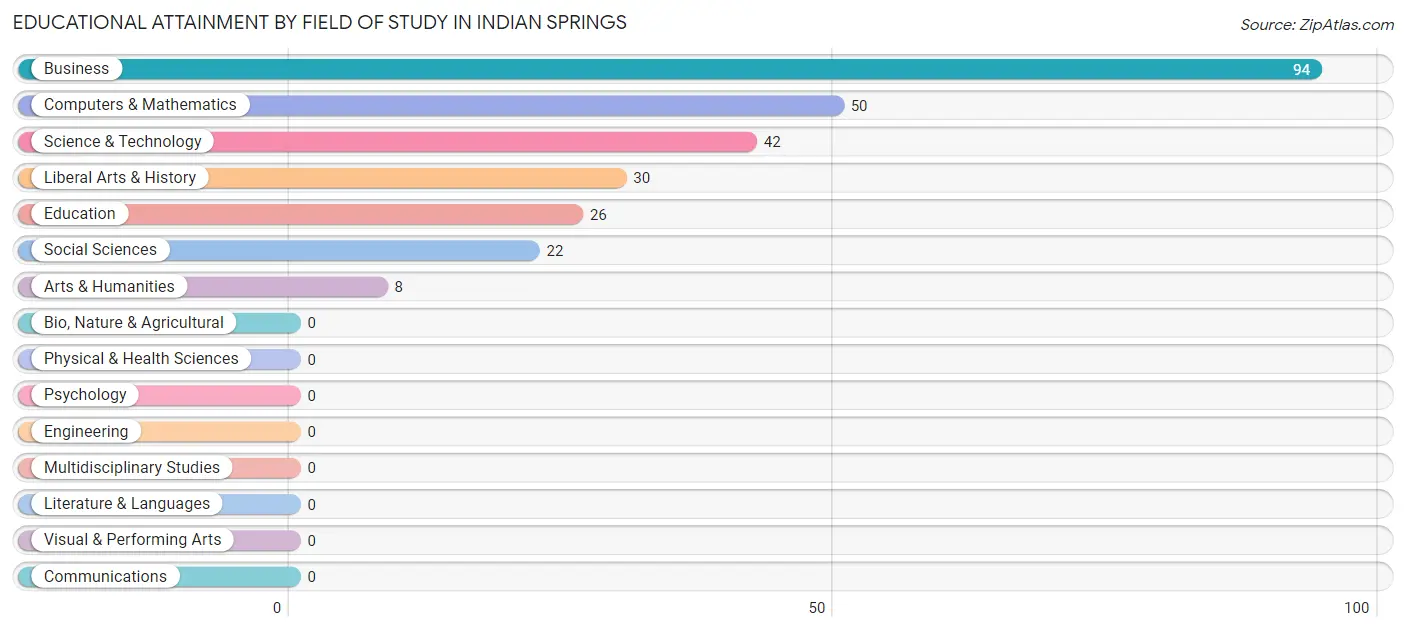
| Field of Study | # Graduates | % Graduates |
| Computers & Mathematics | 50 | 18.4% |
| Bio, Nature & Agricultural | 0 | 0.0% |
| Physical & Health Sciences | 0 | 0.0% |
| Psychology | 0 | 0.0% |
| Social Sciences | 22 | 8.1% |
| Engineering | 0 | 0.0% |
| Multidisciplinary Studies | 0 | 0.0% |
| Science & Technology | 42 | 15.4% |
| Business | 94 | 34.6% |
| Education | 26 | 9.6% |
| Literature & Languages | 0 | 0.0% |
| Liberal Arts & History | 30 | 11.0% |
| Visual & Performing Arts | 0 | 0.0% |
| Communications | 0 | 0.0% |
| Arts & Humanities | 8 | 2.9% |
| Total | 272 | 100.0% |
Transportation & Commute in Indian Springs
Vehicle Availability by Sex in Indian Springs
The most prevalent vehicle ownership categories in Indian Springs are males with 2 vehicles (358, accounting for 51.3%) and females with 2 vehicles (250, making up 70.1%).
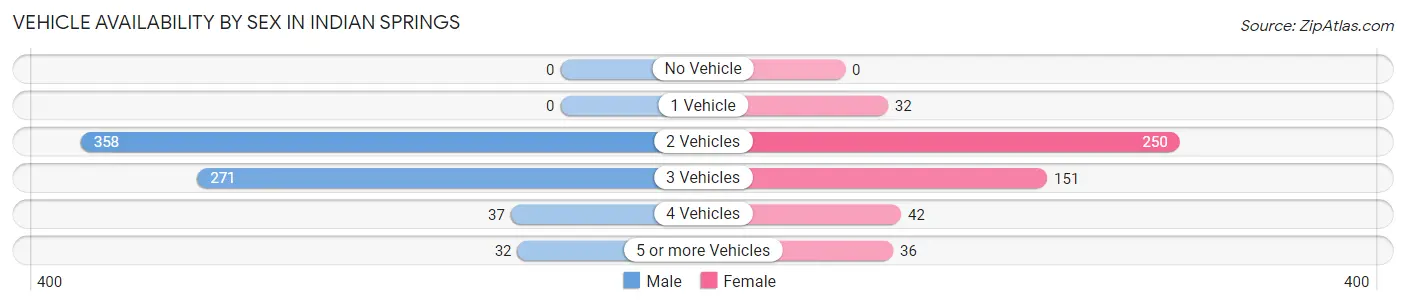
| Vehicles Available | Male | Female |
| No Vehicle | 0 (0.0%) | 0 (0.0%) |
| 1 Vehicle | 0 (0.0%) | 32 (6.3%) |
| 2 Vehicles | 358 (51.3%) | 250 (48.9%) |
| 3 Vehicles | 271 (38.8%) | 151 (29.5%) |
| 4 Vehicles | 37 (5.3%) | 42 (8.2%) |
| 5 or more Vehicles | 32 (4.6%) | 36 (7.0%) |
| Total | 698 (100.0%) | 511 (100.0%) |
Commute Time in Indian Springs
The most frequently occuring commute durations in Indian Springs are 5 to 9 minutes (291 commuters, 24.8%), 30 to 34 minutes (246 commuters, 21.0%), and 15 to 19 minutes (222 commuters, 18.9%).
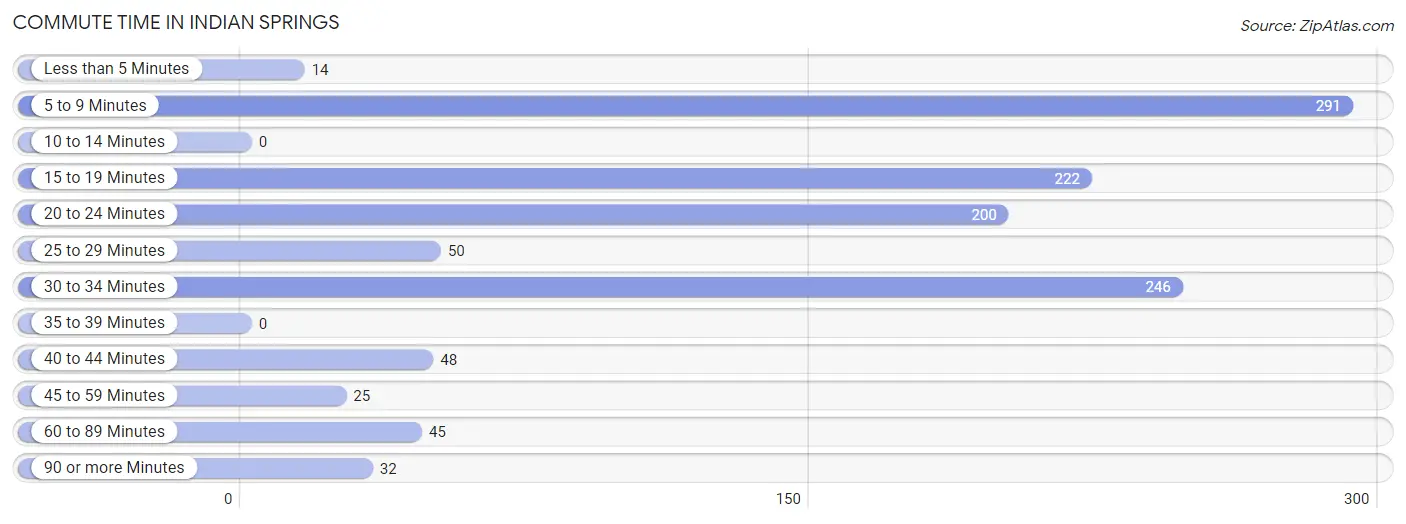
| Commute Time | # Commuters | % Commuters |
| Less than 5 Minutes | 14 | 1.2% |
| 5 to 9 Minutes | 291 | 24.8% |
| 10 to 14 Minutes | 0 | 0.0% |
| 15 to 19 Minutes | 222 | 18.9% |
| 20 to 24 Minutes | 200 | 17.1% |
| 25 to 29 Minutes | 50 | 4.3% |
| 30 to 34 Minutes | 246 | 21.0% |
| 35 to 39 Minutes | 0 | 0.0% |
| 40 to 44 Minutes | 48 | 4.1% |
| 45 to 59 Minutes | 25 | 2.1% |
| 60 to 89 Minutes | 45 | 3.8% |
| 90 or more Minutes | 32 | 2.7% |
Commute Time by Sex in Indian Springs
The most common commute times in Indian Springs are 5 to 9 minutes (192 commuters, 28.5%) for males and 15 to 19 minutes (112 commuters, 22.4%) for females.
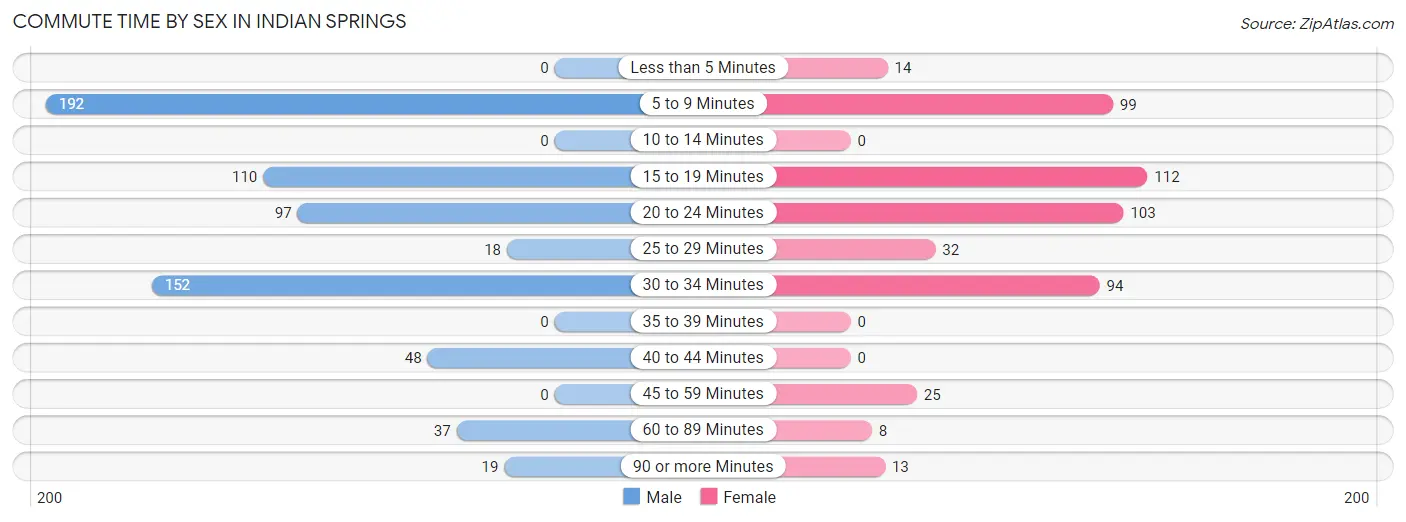
| Commute Time | Male | Female |
| Less than 5 Minutes | 0 (0.0%) | 14 (2.8%) |
| 5 to 9 Minutes | 192 (28.5%) | 99 (19.8%) |
| 10 to 14 Minutes | 0 (0.0%) | 0 (0.0%) |
| 15 to 19 Minutes | 110 (16.3%) | 112 (22.4%) |
| 20 to 24 Minutes | 97 (14.4%) | 103 (20.6%) |
| 25 to 29 Minutes | 18 (2.7%) | 32 (6.4%) |
| 30 to 34 Minutes | 152 (22.6%) | 94 (18.8%) |
| 35 to 39 Minutes | 0 (0.0%) | 0 (0.0%) |
| 40 to 44 Minutes | 48 (7.1%) | 0 (0.0%) |
| 45 to 59 Minutes | 0 (0.0%) | 25 (5.0%) |
| 60 to 89 Minutes | 37 (5.5%) | 8 (1.6%) |
| 90 or more Minutes | 19 (2.8%) | 13 (2.6%) |
Time of Departure to Work by Sex in Indian Springs
The most frequent times of departure to work in Indian Springs are 7:00 AM to 7:29 AM (166, 24.7%) for males and 7:00 AM to 7:29 AM (84, 16.8%) for females.
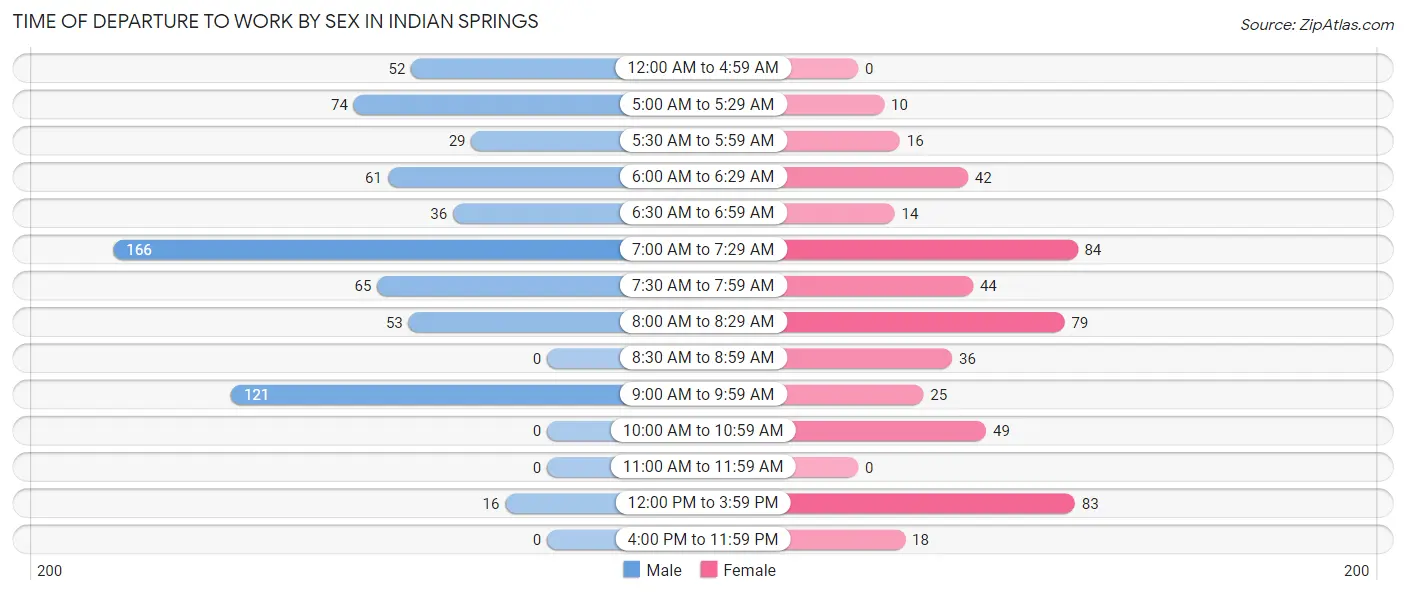
| Time of Departure | Male | Female |
| 12:00 AM to 4:59 AM | 52 (7.7%) | 0 (0.0%) |
| 5:00 AM to 5:29 AM | 74 (11.0%) | 10 (2.0%) |
| 5:30 AM to 5:59 AM | 29 (4.3%) | 16 (3.2%) |
| 6:00 AM to 6:29 AM | 61 (9.1%) | 42 (8.4%) |
| 6:30 AM to 6:59 AM | 36 (5.3%) | 14 (2.8%) |
| 7:00 AM to 7:29 AM | 166 (24.7%) | 84 (16.8%) |
| 7:30 AM to 7:59 AM | 65 (9.7%) | 44 (8.8%) |
| 8:00 AM to 8:29 AM | 53 (7.9%) | 79 (15.8%) |
| 8:30 AM to 8:59 AM | 0 (0.0%) | 36 (7.2%) |
| 9:00 AM to 9:59 AM | 121 (18.0%) | 25 (5.0%) |
| 10:00 AM to 10:59 AM | 0 (0.0%) | 49 (9.8%) |
| 11:00 AM to 11:59 AM | 0 (0.0%) | 0 (0.0%) |
| 12:00 PM to 3:59 PM | 16 (2.4%) | 83 (16.6%) |
| 4:00 PM to 11:59 PM | 0 (0.0%) | 18 (3.6%) |
| Total | 673 (100.0%) | 500 (100.0%) |
Housing Occupancy in Indian Springs
Occupancy by Ownership in Indian Springs
Of the total 698 dwellings in Indian Springs, owner-occupied units account for 660 (94.6%), while renter-occupied units make up 38 (5.4%).
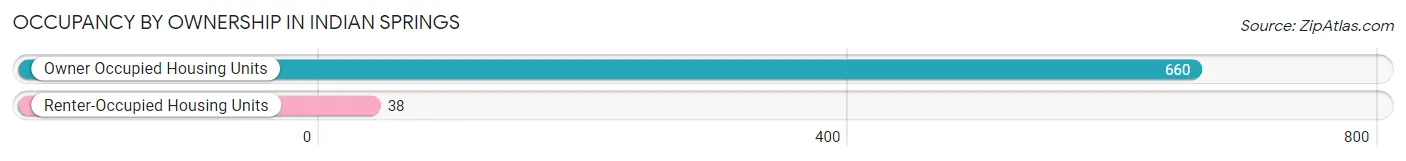
| Occupancy | # Housing Units | % Housing Units |
| Owner Occupied Housing Units | 660 | 94.6% |
| Renter-Occupied Housing Units | 38 | 5.4% |
| Total Occupied Housing Units | 698 | 100.0% |
Occupancy by Household Size in Indian Springs
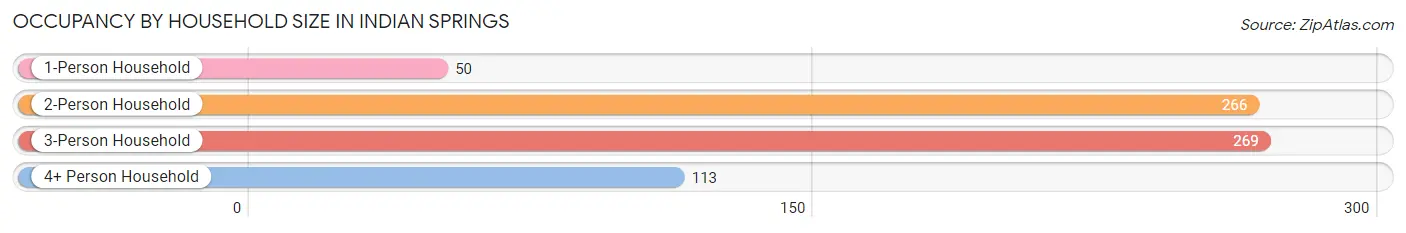
| Household Size | # Housing Units | % Housing Units |
| 1-Person Household | 50 | 7.2% |
| 2-Person Household | 266 | 38.1% |
| 3-Person Household | 269 | 38.5% |
| 4+ Person Household | 113 | 16.2% |
| Total Housing Units | 698 | 100.0% |
Occupancy by Ownership by Household Size in Indian Springs
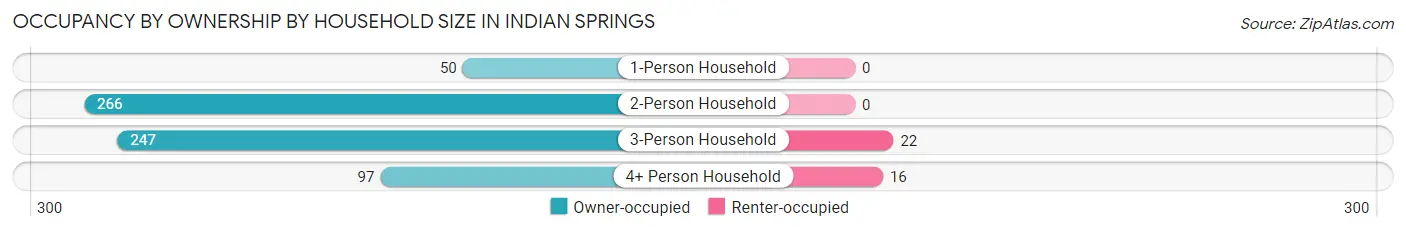
| Household Size | Owner-occupied | Renter-occupied |
| 1-Person Household | 50 (100.0%) | 0 (0.0%) |
| 2-Person Household | 266 (100.0%) | 0 (0.0%) |
| 3-Person Household | 247 (91.8%) | 22 (8.2%) |
| 4+ Person Household | 97 (85.8%) | 16 (14.2%) |
| Total Housing Units | 660 (94.6%) | 38 (5.4%) |
Occupancy by Educational Attainment in Indian Springs
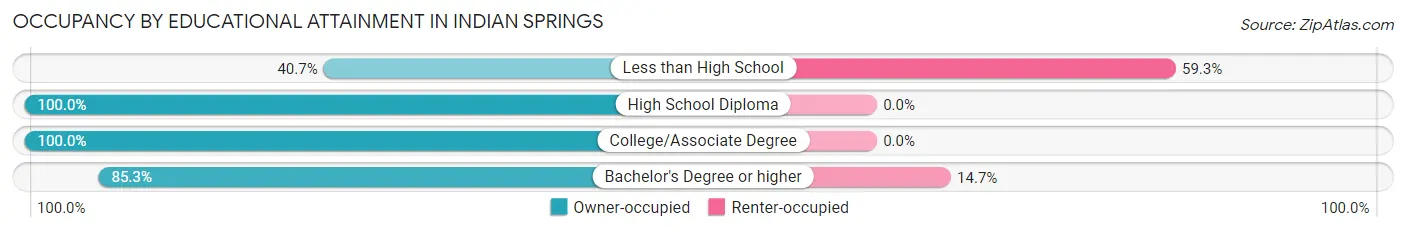
| Household Size | Owner-occupied | Renter-occupied |
| Less than High School | 11 (40.7%) | 16 (59.3%) |
| High School Diploma | 125 (100.0%) | 0 (0.0%) |
| College/Associate Degree | 396 (100.0%) | 0 (0.0%) |
| Bachelor's Degree or higher | 128 (85.3%) | 22 (14.7%) |
Occupancy by Age of Householder in Indian Springs
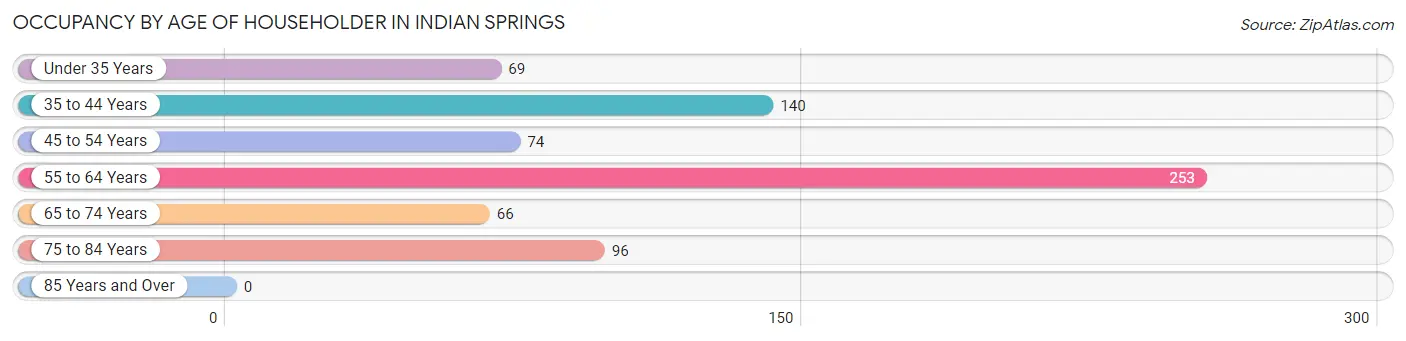
| Age Bracket | # Households | % Households |
| Under 35 Years | 69 | 9.9% |
| 35 to 44 Years | 140 | 20.1% |
| 45 to 54 Years | 74 | 10.6% |
| 55 to 64 Years | 253 | 36.2% |
| 65 to 74 Years | 66 | 9.5% |
| 75 to 84 Years | 96 | 13.8% |
| 85 Years and Over | 0 | 0.0% |
| Total | 698 | 100.0% |
Housing Finances in Indian Springs
Median Income by Occupancy in Indian Springs
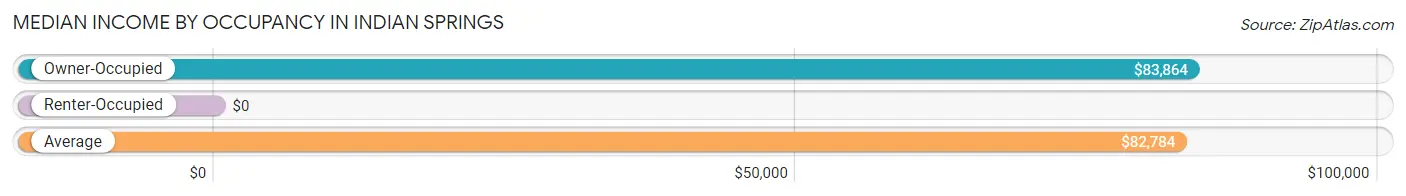
| Occupancy Type | # Households | Median Income |
| Owner-Occupied | 660 (94.6%) | $83,864 |
| Renter-Occupied | 38 (5.4%) | $0 |
| Average | 698 (100.0%) | $82,784 |
Occupancy by Householder Income Bracket in Indian Springs
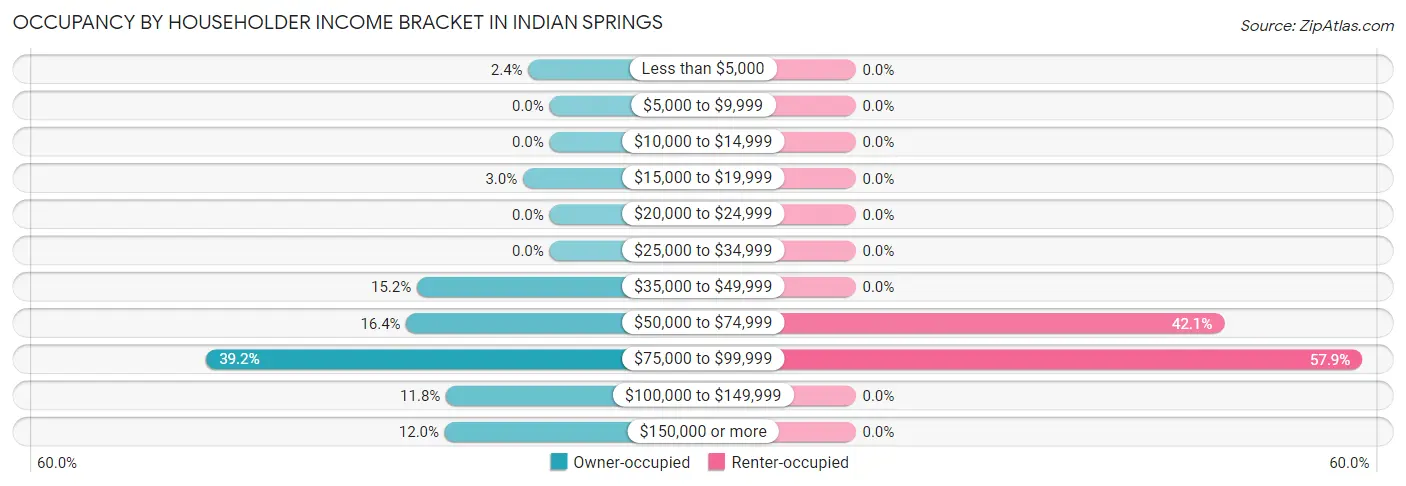
| Income Bracket | Owner-occupied | Renter-occupied |
| Less than $5,000 | 16 (2.4%) | 0 (0.0%) |
| $5,000 to $9,999 | 0 (0.0%) | 0 (0.0%) |
| $10,000 to $14,999 | 0 (0.0%) | 0 (0.0%) |
| $15,000 to $19,999 | 20 (3.0%) | 0 (0.0%) |
| $20,000 to $24,999 | 0 (0.0%) | 0 (0.0%) |
| $25,000 to $34,999 | 0 (0.0%) | 0 (0.0%) |
| $35,000 to $49,999 | 100 (15.1%) | 0 (0.0%) |
| $50,000 to $74,999 | 108 (16.4%) | 16 (42.1%) |
| $75,000 to $99,999 | 259 (39.2%) | 22 (57.9%) |
| $100,000 to $149,999 | 78 (11.8%) | 0 (0.0%) |
| $150,000 or more | 79 (12.0%) | 0 (0.0%) |
| Total | 660 (100.0%) | 38 (100.0%) |
Monthly Housing Cost Tiers in Indian Springs
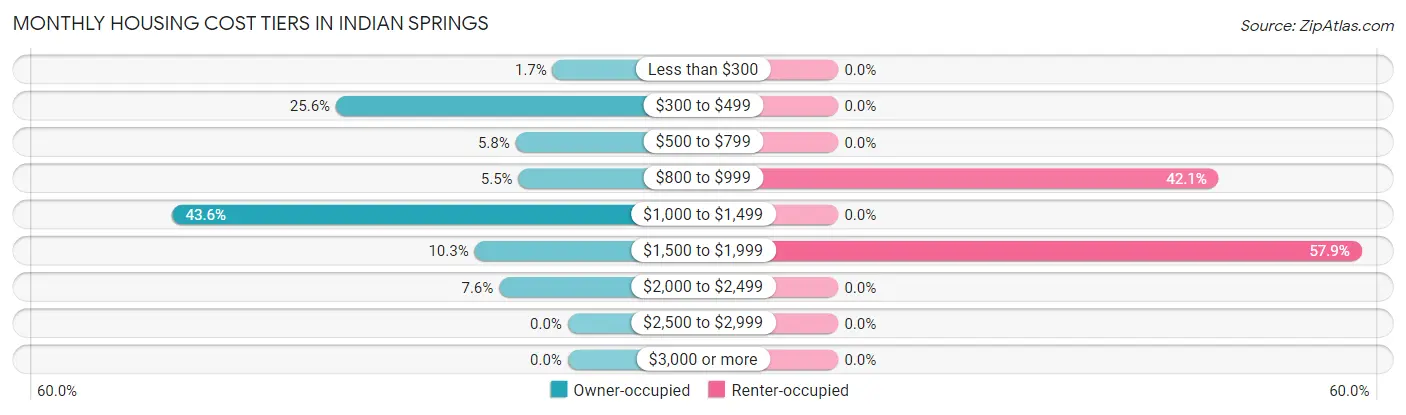
| Monthly Cost | Owner-occupied | Renter-occupied |
| Less than $300 | 11 (1.7%) | 0 (0.0%) |
| $300 to $499 | 169 (25.6%) | 0 (0.0%) |
| $500 to $799 | 38 (5.8%) | 0 (0.0%) |
| $800 to $999 | 36 (5.4%) | 16 (42.1%) |
| $1,000 to $1,499 | 288 (43.6%) | 0 (0.0%) |
| $1,500 to $1,999 | 68 (10.3%) | 22 (57.9%) |
| $2,000 to $2,499 | 50 (7.6%) | 0 (0.0%) |
| $2,500 to $2,999 | 0 (0.0%) | 0 (0.0%) |
| $3,000 or more | 0 (0.0%) | 0 (0.0%) |
| Total | 660 (100.0%) | 38 (100.0%) |
Physical Housing Characteristics in Indian Springs
Housing Structures in Indian Springs
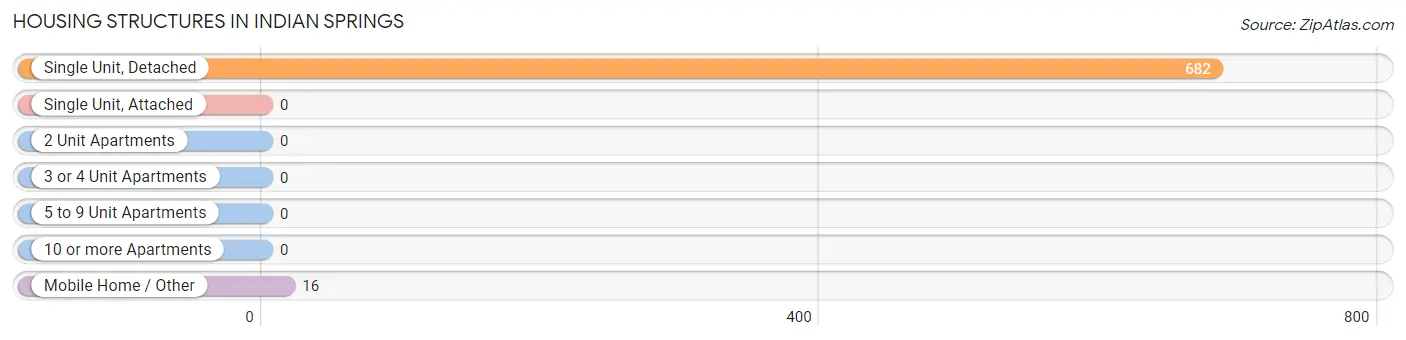
| Structure Type | # Housing Units | % Housing Units |
| Single Unit, Detached | 682 | 97.7% |
| Single Unit, Attached | 0 | 0.0% |
| 2 Unit Apartments | 0 | 0.0% |
| 3 or 4 Unit Apartments | 0 | 0.0% |
| 5 to 9 Unit Apartments | 0 | 0.0% |
| 10 or more Apartments | 0 | 0.0% |
| Mobile Home / Other | 16 | 2.3% |
| Total | 698 | 100.0% |
Housing Structures by Occupancy in Indian Springs
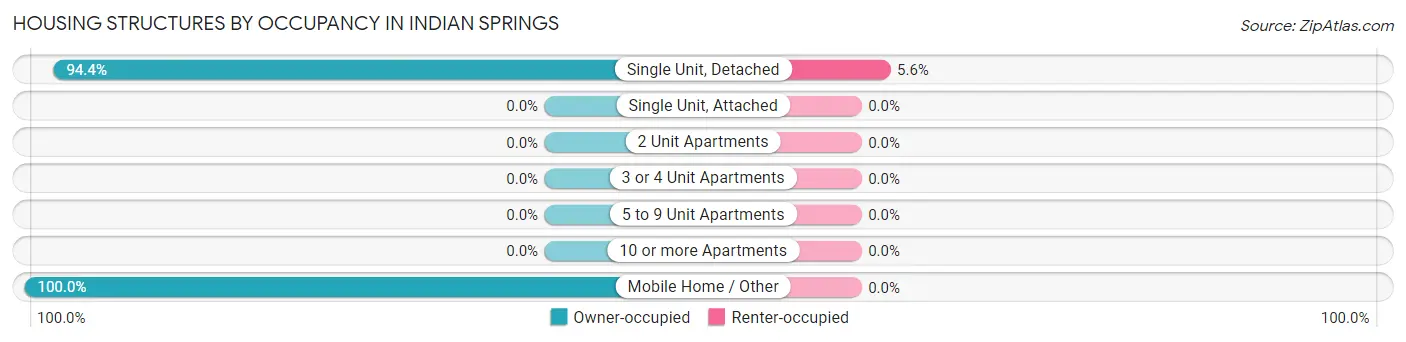
| Structure Type | Owner-occupied | Renter-occupied |
| Single Unit, Detached | 644 (94.4%) | 38 (5.6%) |
| Single Unit, Attached | 0 (0.0%) | 0 (0.0%) |
| 2 Unit Apartments | 0 (0.0%) | 0 (0.0%) |
| 3 or 4 Unit Apartments | 0 (0.0%) | 0 (0.0%) |
| 5 to 9 Unit Apartments | 0 (0.0%) | 0 (0.0%) |
| 10 or more Apartments | 0 (0.0%) | 0 (0.0%) |
| Mobile Home / Other | 16 (100.0%) | 0 (0.0%) |
| Total | 660 (94.6%) | 38 (5.4%) |
Housing Structures by Number of Rooms in Indian Springs
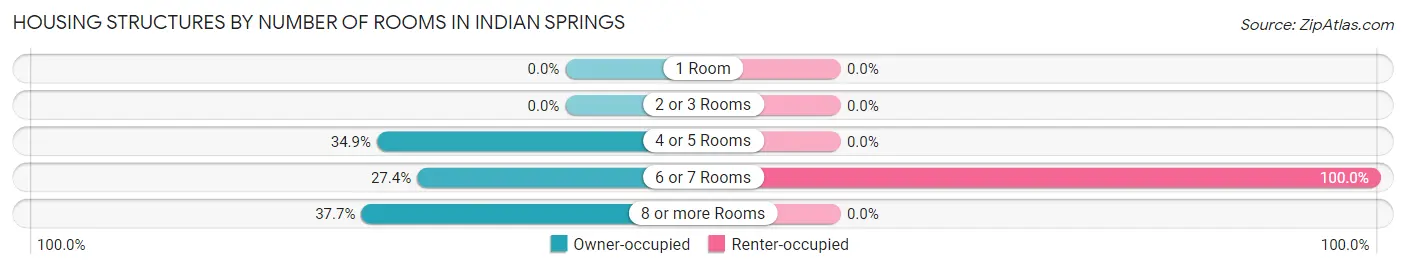
| Number of Rooms | Owner-occupied | Renter-occupied |
| 1 Room | 0 (0.0%) | 0 (0.0%) |
| 2 or 3 Rooms | 0 (0.0%) | 0 (0.0%) |
| 4 or 5 Rooms | 230 (34.8%) | 0 (0.0%) |
| 6 or 7 Rooms | 181 (27.4%) | 38 (100.0%) |
| 8 or more Rooms | 249 (37.7%) | 0 (0.0%) |
| Total | 660 (100.0%) | 38 (100.0%) |
Housing Structure by Heating Type in Indian Springs
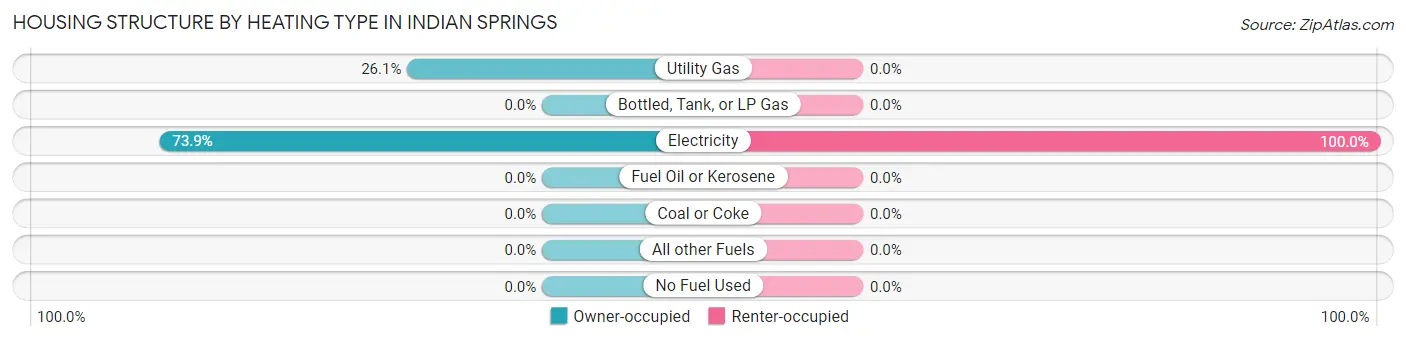
| Heating Type | Owner-occupied | Renter-occupied |
| Utility Gas | 172 (26.1%) | 0 (0.0%) |
| Bottled, Tank, or LP Gas | 0 (0.0%) | 0 (0.0%) |
| Electricity | 488 (73.9%) | 38 (100.0%) |
| Fuel Oil or Kerosene | 0 (0.0%) | 0 (0.0%) |
| Coal or Coke | 0 (0.0%) | 0 (0.0%) |
| All other Fuels | 0 (0.0%) | 0 (0.0%) |
| No Fuel Used | 0 (0.0%) | 0 (0.0%) |
| Total | 660 (100.0%) | 38 (100.0%) |
Household Vehicle Usage in Indian Springs
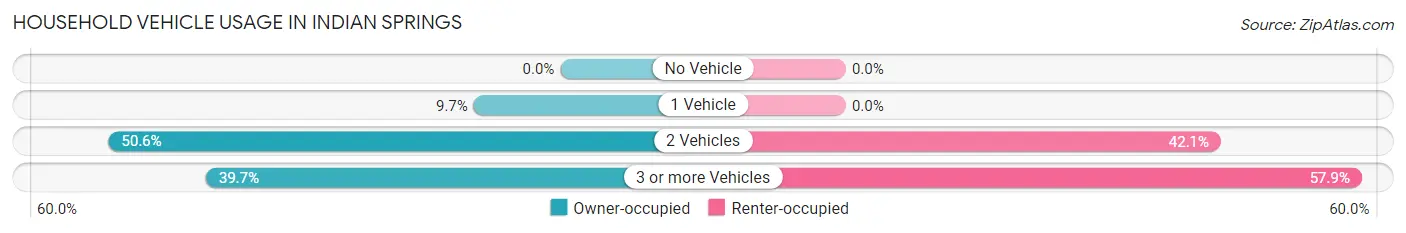
| Vehicles per Household | Owner-occupied | Renter-occupied |
| No Vehicle | 0 (0.0%) | 0 (0.0%) |
| 1 Vehicle | 64 (9.7%) | 0 (0.0%) |
| 2 Vehicles | 334 (50.6%) | 16 (42.1%) |
| 3 or more Vehicles | 262 (39.7%) | 22 (57.9%) |
| Total | 660 (100.0%) | 38 (100.0%) |
Real Estate & Mortgages in Indian Springs
Real Estate and Mortgage Overview in Indian Springs
| Characteristic | Without Mortgage | With Mortgage |
| Housing Units | 218 | 442 |
| Median Property Value | $207,700 | $163,100 |
| Median Household Income | $75,357 | $79 |
| Monthly Housing Costs | $414 | $0 |
| Real Estate Taxes | $1,243 | $10 |
Property Value by Mortgage Status in Indian Springs
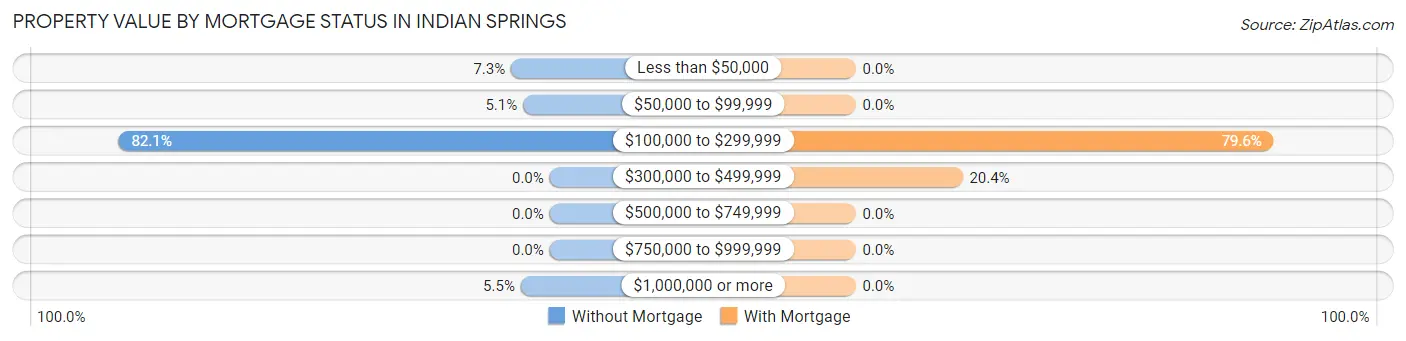
| Property Value | Without Mortgage | With Mortgage |
| Less than $50,000 | 16 (7.3%) | 0 (0.0%) |
| $50,000 to $99,999 | 11 (5.1%) | 0 (0.0%) |
| $100,000 to $299,999 | 179 (82.1%) | 352 (79.6%) |
| $300,000 to $499,999 | 0 (0.0%) | 90 (20.4%) |
| $500,000 to $749,999 | 0 (0.0%) | 0 (0.0%) |
| $750,000 to $999,999 | 0 (0.0%) | 0 (0.0%) |
| $1,000,000 or more | 12 (5.5%) | 0 (0.0%) |
| Total | 218 (100.0%) | 442 (100.0%) |
Household Income by Mortgage Status in Indian Springs
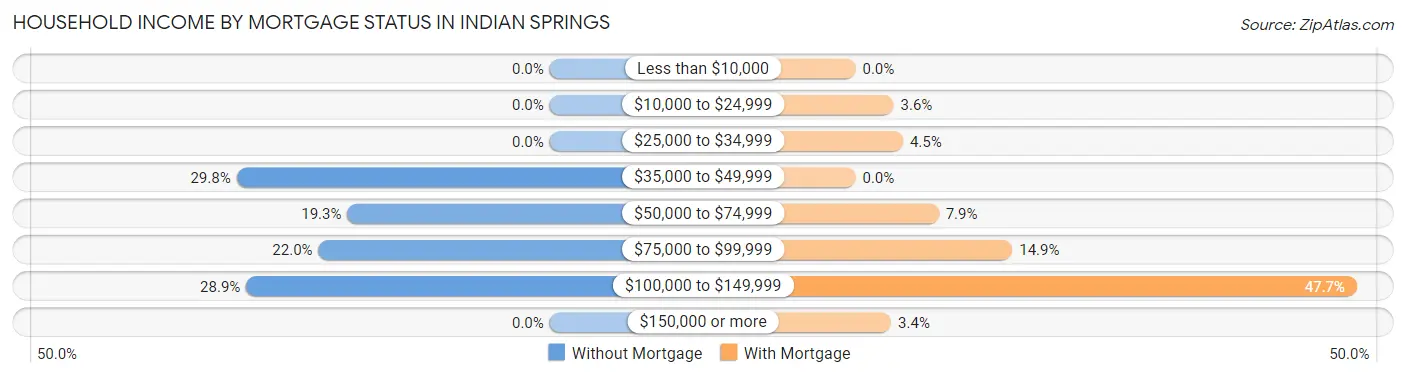
| Household Income | Without Mortgage | With Mortgage |
| Less than $10,000 | 0 (0.0%) | 0 (0.0%) |
| $10,000 to $24,999 | 0 (0.0%) | 16 (3.6%) |
| $25,000 to $34,999 | 0 (0.0%) | 20 (4.5%) |
| $35,000 to $49,999 | 65 (29.8%) | 0 (0.0%) |
| $50,000 to $74,999 | 42 (19.3%) | 35 (7.9%) |
| $75,000 to $99,999 | 48 (22.0%) | 66 (14.9%) |
| $100,000 to $149,999 | 63 (28.9%) | 211 (47.7%) |
| $150,000 or more | 0 (0.0%) | 15 (3.4%) |
| Total | 218 (100.0%) | 442 (100.0%) |
Property Value to Household Income Ratio in Indian Springs
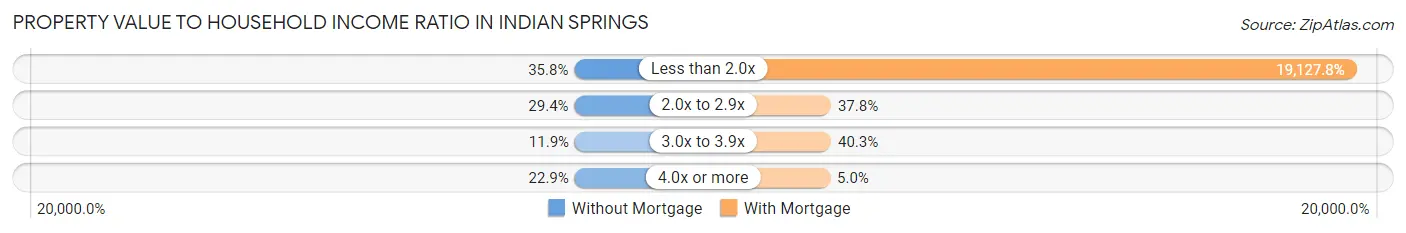
| Value-to-Income Ratio | Without Mortgage | With Mortgage |
| Less than 2.0x | 78 (35.8%) | 84,545 (19,127.8%) |
| 2.0x to 2.9x | 64 (29.4%) | 167 (37.8%) |
| 3.0x to 3.9x | 26 (11.9%) | 178 (40.3%) |
| 4.0x or more | 50 (22.9%) | 22 (5.0%) |
| Total | 218 (100.0%) | 442 (100.0%) |
Real Estate Taxes by Mortgage Status in Indian Springs
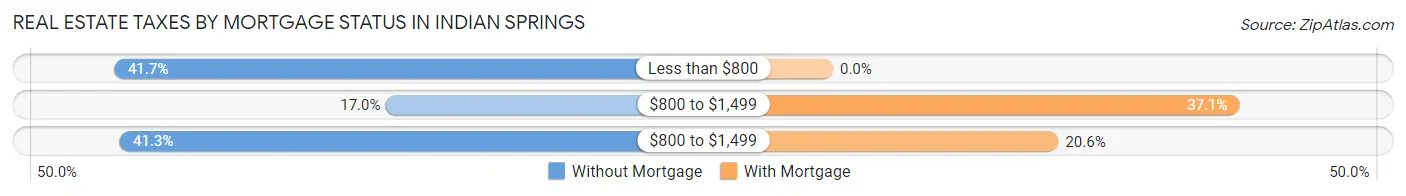
| Property Taxes | Without Mortgage | With Mortgage |
| Less than $800 | 91 (41.7%) | 0 (0.0%) |
| $800 to $1,499 | 37 (17.0%) | 164 (37.1%) |
| $800 to $1,499 | 90 (41.3%) | 91 (20.6%) |
| Total | 218 (100.0%) | 442 (100.0%) |
Health & Disability in Indian Springs
Health Insurance Coverage by Age in Indian Springs
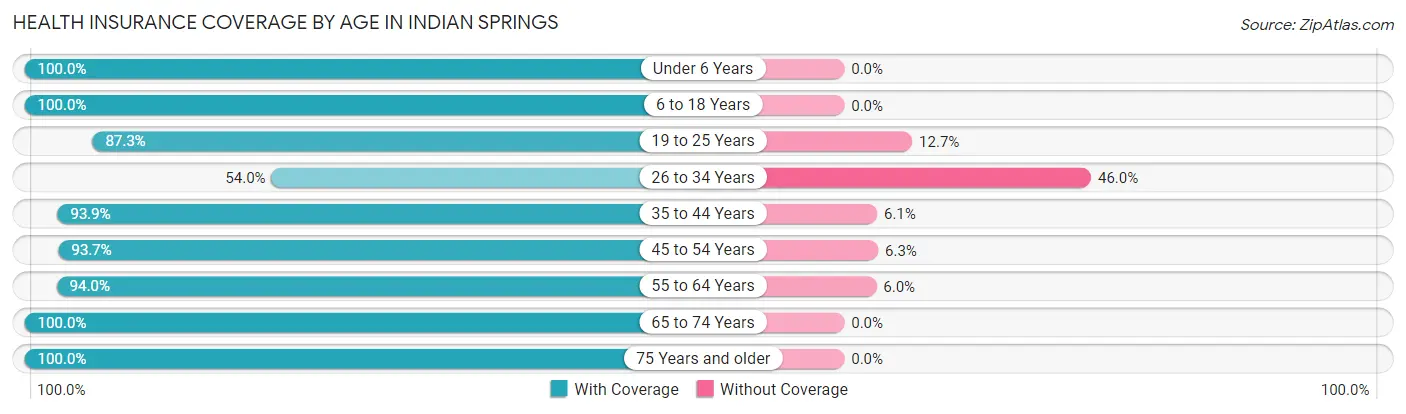
| Age Bracket | With Coverage | Without Coverage |
| Under 6 Years | 54 (100.0%) | 0 (0.0%) |
| 6 to 18 Years | 302 (100.0%) | 0 (0.0%) |
| 19 to 25 Years | 207 (87.3%) | 30 (12.7%) |
| 26 to 34 Years | 122 (54.0%) | 104 (46.0%) |
| 35 to 44 Years | 246 (93.9%) | 16 (6.1%) |
| 45 to 54 Years | 223 (93.7%) | 15 (6.3%) |
| 55 to 64 Years | 315 (94.0%) | 20 (6.0%) |
| 65 to 74 Years | 121 (100.0%) | 0 (0.0%) |
| 75 Years and older | 172 (100.0%) | 0 (0.0%) |
| Total | 1,762 (90.5%) | 185 (9.5%) |
Health Insurance Coverage by Citizenship Status in Indian Springs
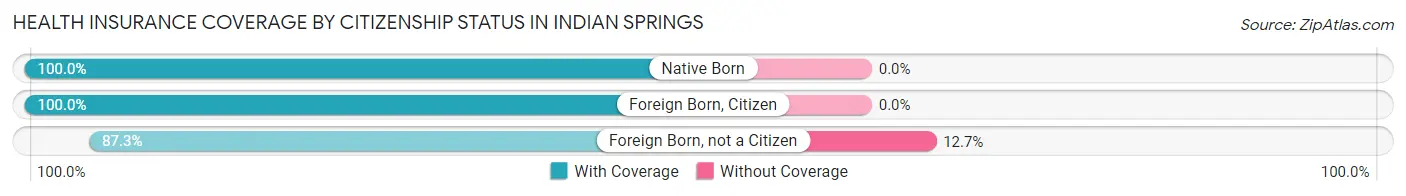
| Citizenship Status | With Coverage | Without Coverage |
| Native Born | 54 (100.0%) | 0 (0.0%) |
| Foreign Born, Citizen | 302 (100.0%) | 0 (0.0%) |
| Foreign Born, not a Citizen | 207 (87.3%) | 30 (12.7%) |
Health Insurance Coverage by Household Income in Indian Springs
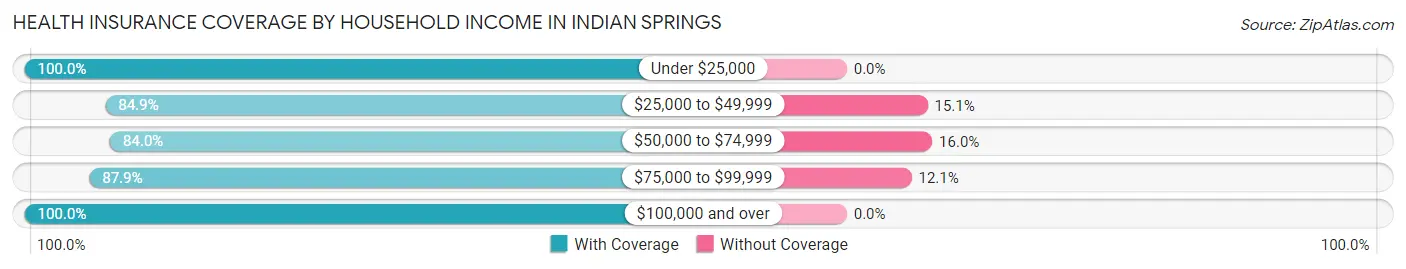
| Household Income | With Coverage | Without Coverage |
| Under $25,000 | 52 (100.0%) | 0 (0.0%) |
| $25,000 to $49,999 | 202 (84.9%) | 36 (15.1%) |
| $50,000 to $74,999 | 310 (84.0%) | 59 (16.0%) |
| $75,000 to $99,999 | 652 (87.9%) | 90 (12.1%) |
| $100,000 and over | 546 (100.0%) | 0 (0.0%) |
Public vs Private Health Insurance Coverage by Age in Indian Springs
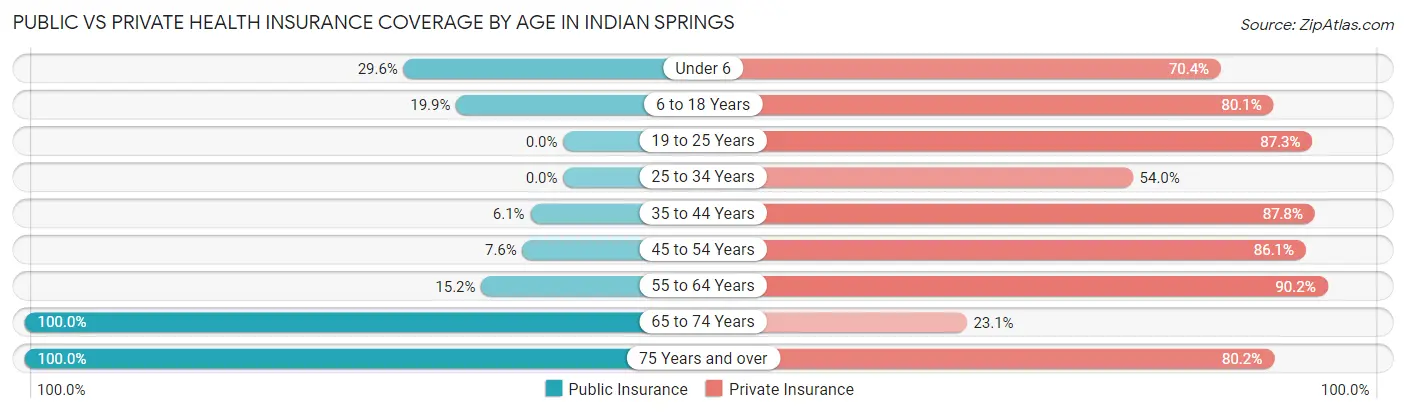
| Age Bracket | Public Insurance | Private Insurance |
| Under 6 | 16 (29.6%) | 38 (70.4%) |
| 6 to 18 Years | 60 (19.9%) | 242 (80.1%) |
| 19 to 25 Years | 0 (0.0%) | 207 (87.3%) |
| 25 to 34 Years | 0 (0.0%) | 122 (54.0%) |
| 35 to 44 Years | 16 (6.1%) | 230 (87.8%) |
| 45 to 54 Years | 18 (7.6%) | 205 (86.1%) |
| 55 to 64 Years | 51 (15.2%) | 302 (90.1%) |
| 65 to 74 Years | 121 (100.0%) | 28 (23.1%) |
| 75 Years and over | 172 (100.0%) | 138 (80.2%) |
| Total | 454 (23.3%) | 1,512 (77.7%) |
Disability Status by Sex by Age in Indian Springs
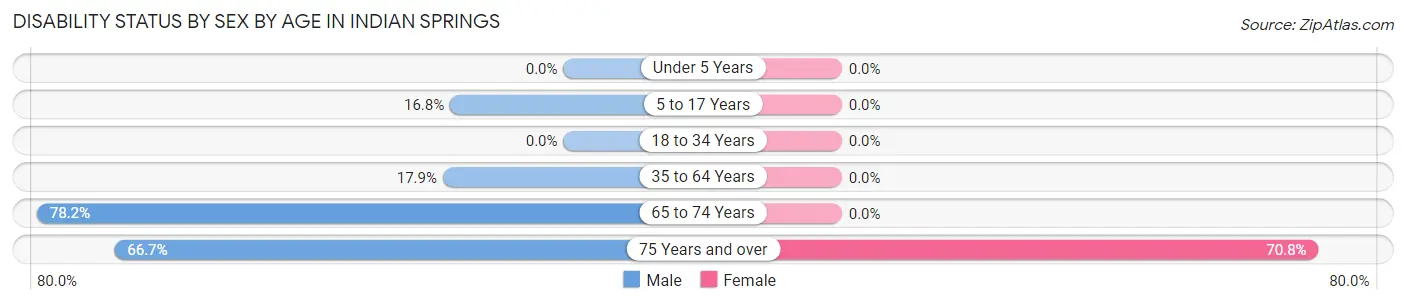
| Age Bracket | Male | Female |
| Under 5 Years | 0 (0.0%) | 0 (0.0%) |
| 5 to 17 Years | 17 (16.8%) | 0 (0.0%) |
| 18 to 34 Years | 0 (0.0%) | 0 (0.0%) |
| 35 to 64 Years | 63 (17.9%) | 0 (0.0%) |
| 65 to 74 Years | 43 (78.2%) | 0 (0.0%) |
| 75 Years and over | 28 (66.7%) | 92 (70.8%) |
Disability Class by Sex by Age in Indian Springs
Disability Class: Hearing Difficulty
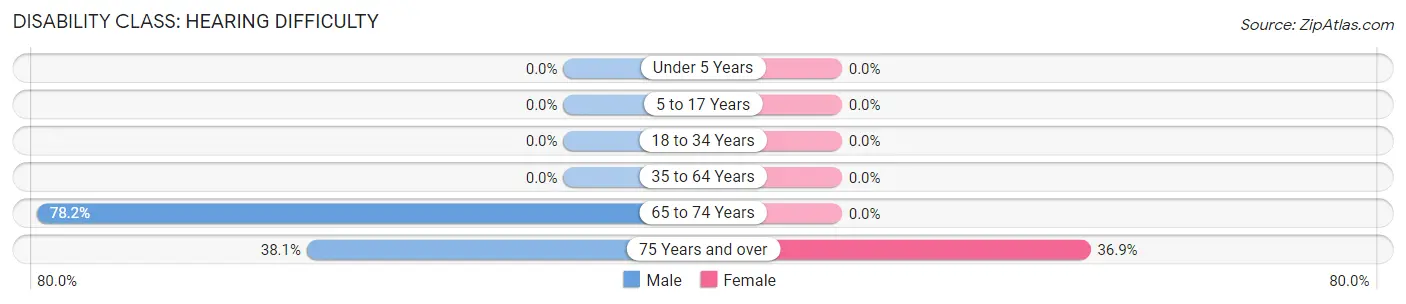
| Age Bracket | Male | Female |
| Under 5 Years | 0 (0.0%) | 0 (0.0%) |
| 5 to 17 Years | 0 (0.0%) | 0 (0.0%) |
| 18 to 34 Years | 0 (0.0%) | 0 (0.0%) |
| 35 to 64 Years | 0 (0.0%) | 0 (0.0%) |
| 65 to 74 Years | 43 (78.2%) | 0 (0.0%) |
| 75 Years and over | 16 (38.1%) | 48 (36.9%) |
Disability Class: Vision Difficulty
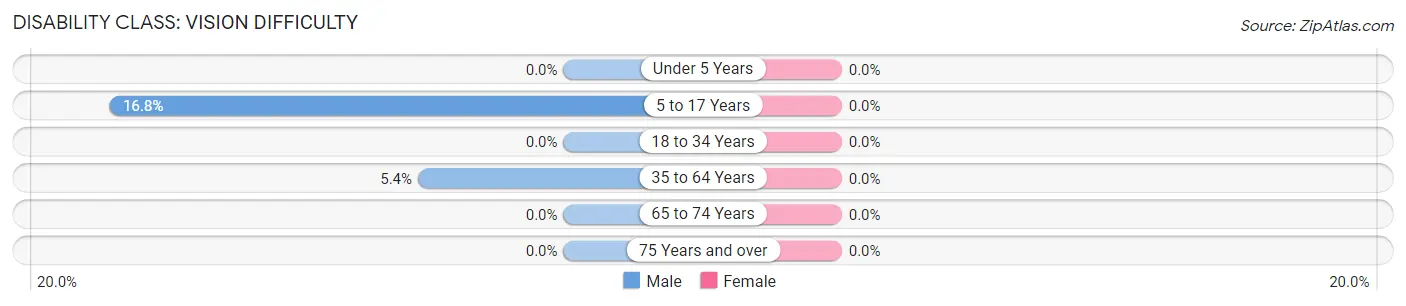
| Age Bracket | Male | Female |
| Under 5 Years | 0 (0.0%) | 0 (0.0%) |
| 5 to 17 Years | 17 (16.8%) | 0 (0.0%) |
| 18 to 34 Years | 0 (0.0%) | 0 (0.0%) |
| 35 to 64 Years | 19 (5.4%) | 0 (0.0%) |
| 65 to 74 Years | 0 (0.0%) | 0 (0.0%) |
| 75 Years and over | 0 (0.0%) | 0 (0.0%) |
Disability Class: Cognitive Difficulty
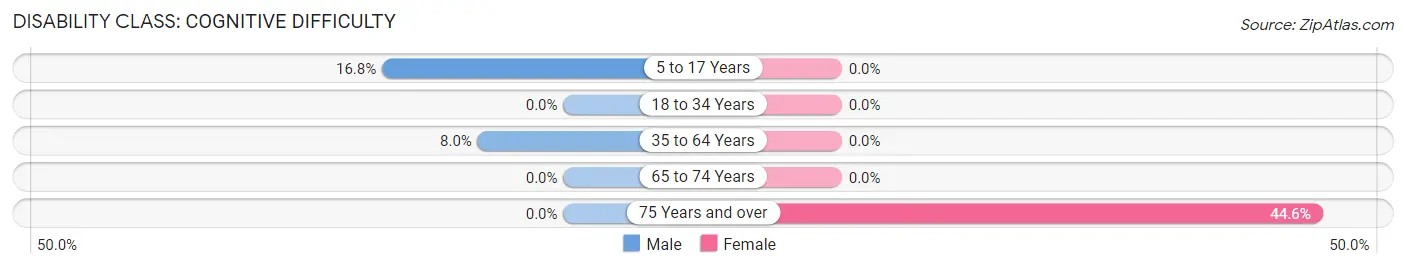
| Age Bracket | Male | Female |
| 5 to 17 Years | 17 (16.8%) | 0 (0.0%) |
| 18 to 34 Years | 0 (0.0%) | 0 (0.0%) |
| 35 to 64 Years | 28 (8.0%) | 0 (0.0%) |
| 65 to 74 Years | 0 (0.0%) | 0 (0.0%) |
| 75 Years and over | 0 (0.0%) | 58 (44.6%) |
Disability Class: Ambulatory Difficulty
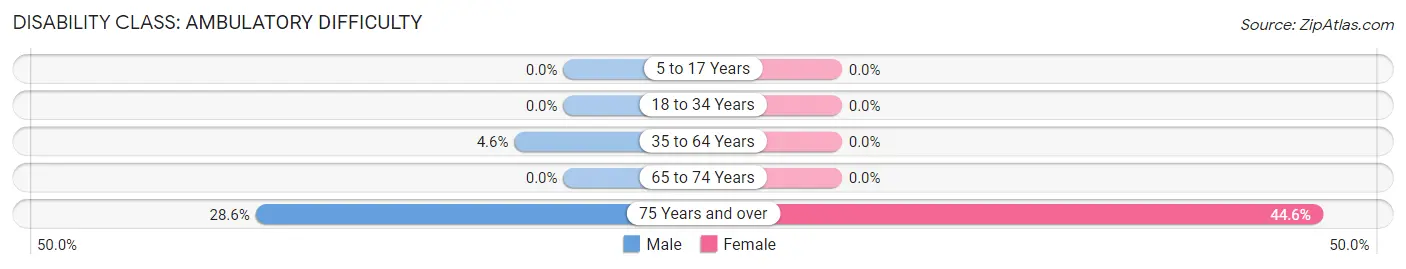
| Age Bracket | Male | Female |
| 5 to 17 Years | 0 (0.0%) | 0 (0.0%) |
| 18 to 34 Years | 0 (0.0%) | 0 (0.0%) |
| 35 to 64 Years | 16 (4.5%) | 0 (0.0%) |
| 65 to 74 Years | 0 (0.0%) | 0 (0.0%) |
| 75 Years and over | 12 (28.6%) | 58 (44.6%) |
Disability Class: Self-Care Difficulty
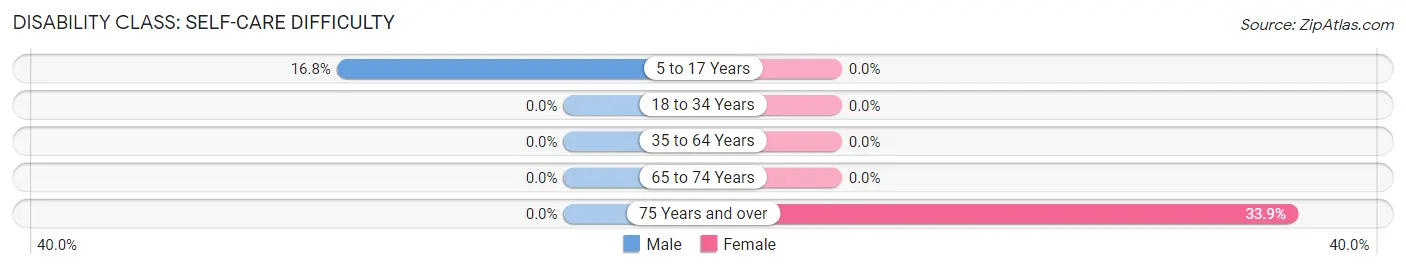
| Age Bracket | Male | Female |
| 5 to 17 Years | 17 (16.8%) | 0 (0.0%) |
| 18 to 34 Years | 0 (0.0%) | 0 (0.0%) |
| 35 to 64 Years | 0 (0.0%) | 0 (0.0%) |
| 65 to 74 Years | 0 (0.0%) | 0 (0.0%) |
| 75 Years and over | 0 (0.0%) | 44 (33.9%) |
Technology Access in Indian Springs
Computing Device Access in Indian Springs
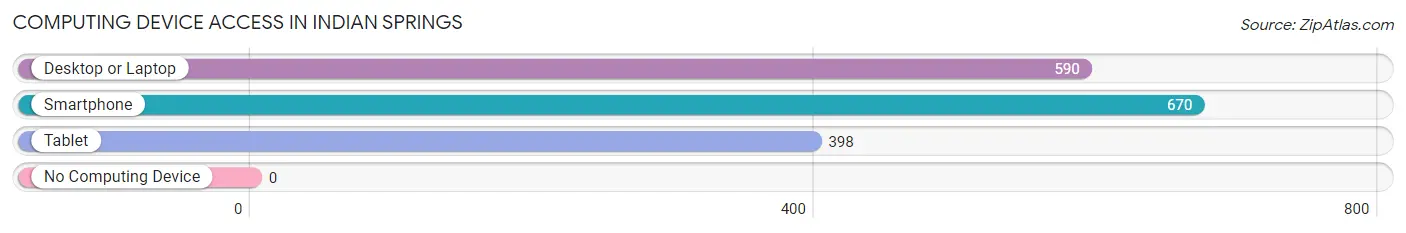
| Device Type | # Households | % Households |
| Desktop or Laptop | 590 | 84.5% |
| Smartphone | 670 | 96.0% |
| Tablet | 398 | 57.0% |
| No Computing Device | 0 | 0.0% |
| Total | 698 | 100.0% |
Internet Access in Indian Springs
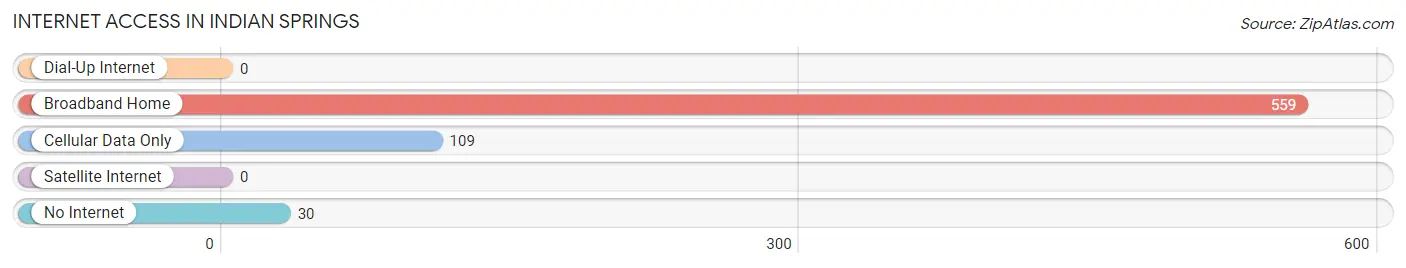
| Internet Type | # Households | % Households |
| Dial-Up Internet | 0 | 0.0% |
| Broadband Home | 559 | 80.1% |
| Cellular Data Only | 109 | 15.6% |
| Satellite Internet | 0 | 0.0% |
| No Internet | 30 | 4.3% |
| Total | 698 | 100.0% |
Indian Springs Summary
History
Indian Springs is a small unincorporated community located in Fulton County, Georgia, United States. It is located approximately 20 miles north of Atlanta and is part of the Atlanta metropolitan area. The community was founded in 1832 by a group of Cherokee Indians who had been relocated from their ancestral lands in the Southeast. The community was originally known as “Cherokee Springs” and was home to a number of Cherokee families.
The community was renamed “Indian Springs” in 1837 when the state of Georgia purchased the land from the Cherokee Nation. The state then sold the land to a group of settlers who established a small farming community. The community grew slowly over the years and by the early 1900s had a population of around 500 people.
The community was largely agricultural until the 1950s when the construction of Interstate 285 brought new development to the area. The population of Indian Springs began to grow rapidly as new businesses and housing developments were built. By the 2000 census, the population of Indian Springs had grown to over 4,000 people.
Geography
Indian Springs is located in the northern part of Fulton County, Georgia, approximately 20 miles north of Atlanta. The community is situated in a rural area and is surrounded by rolling hills and forests. The Chattahoochee River is located just to the east of the community and provides a natural border between Fulton County and neighboring Cobb County.
The climate in Indian Springs is typical of the southeastern United States, with hot, humid summers and mild winters. The average annual temperature is around 70 degrees Fahrenheit and the average annual precipitation is around 50 inches.
Economy
The economy of Indian Springs is largely based on the service industry. The community is home to a number of small businesses, including restaurants, retail stores, and professional services. The community is also home to a number of light industrial businesses, including a plastics manufacturing plant and a printing company.
The community is also home to a number of educational institutions, including a public elementary school, a middle school, and a high school. The community is also home to a branch of the Georgia Institute of Technology, which offers a variety of degree programs.
Demographics
As of the 2010 census, the population of Indian Springs was 4,717. The racial makeup of the community was 79.3% White, 14.2% African American, 0.7% Native American, 1.2% Asian, and 4.6% from other races. The median household income was $50,945 and the median family income was $60,945.
The population of Indian Springs is largely educated, with over 90% of the population having at least a high school diploma and over 40% having a bachelor’s degree or higher. The community is also home to a number of religious institutions, including Baptist, Methodist, and Catholic churches.
Common Questions
What is Per Capita Income in Indian Springs?
Per Capita income in Indian Springs is $32,013.
What is the Median Family Income in Indian Springs?
Median Family Income in Indian Springs is $82,727.
What is the Median Household income in Indian Springs?
Median Household Income in Indian Springs is $82,784.
What is Income or Wage Gap in Indian Springs?
Income or Wage Gap in Indian Springs is 5.1%.
Women in Indian Springs earn 94.9 cents for every dollar earned by a man.
What is Inequality or Gini Index in Indian Springs?
Inequality or Gini Index in Indian Springs is 0.26.
What is the Total Population of Indian Springs?
Total Population of Indian Springs is 1,983.
What is the Total Male Population of Indian Springs?
Total Male Population of Indian Springs is 1,012.
What is the Total Female Population of Indian Springs?
Total Female Population of Indian Springs is 971.
What is the Ratio of Males per 100 Females in Indian Springs?
There are 104.22 Males per 100 Females in Indian Springs.
What is the Ratio of Females per 100 Males in Indian Springs?
There are 95.95 Females per 100 Males in Indian Springs.
What is the Median Population Age in Indian Springs?
Median Population Age in Indian Springs is 40.5 Years.
What is the Average Family Size in Indian Springs
Average Family Size in Indian Springs is 3.0 People.
What is the Average Household Size in Indian Springs
Average Household Size in Indian Springs is 2.8 People.
How Large is the Labor Force in Indian Springs?
There are 1,241 People in the Labor Forcein in Indian Springs.
What is the Percentage of People in the Labor Force in Indian Springs?
72.6% of People are in the Labor Force in Indian Springs.
What is the Unemployment Rate in Indian Springs?
Unemployment Rate in Indian Springs is 2.6%.