Zip Codes with the Highest Percentage of Population Employed in Food Preparation & Serving in Lakeland, FL
RELATED REPORTS & OPTIONS
Food Preparation & Serving
Lakeland
Compare Zip Codes
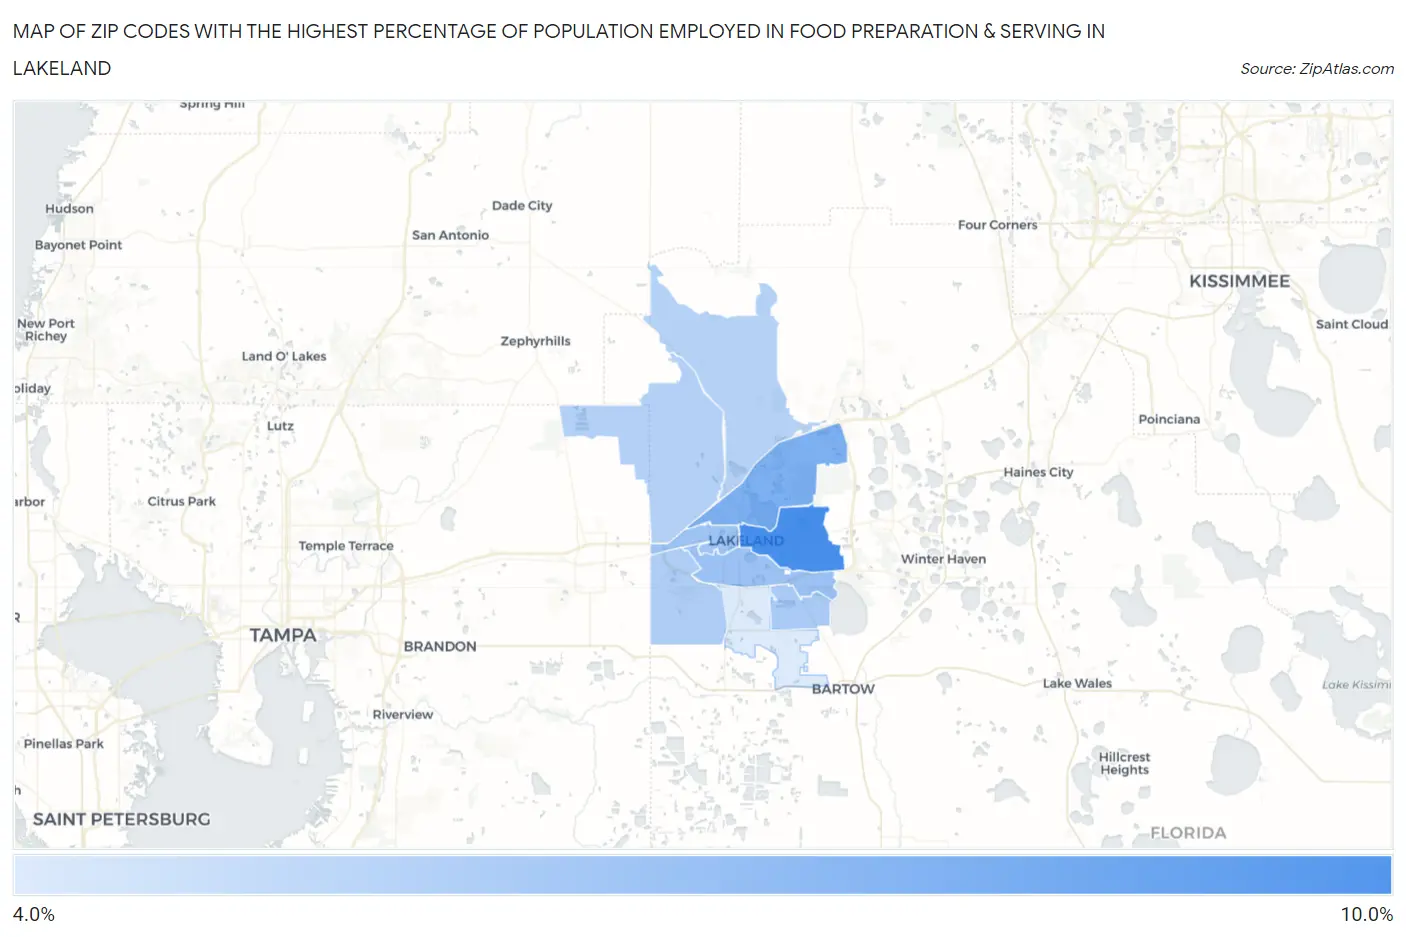
Map of Zip Codes with the Highest Percentage of Population Employed in Food Preparation & Serving in Lakeland
4.1%
9.8%
Zip Codes with the Highest Percentage of Population Employed in Food Preparation & Serving in Lakeland, FL
| Zip Code | % Employed | vs State | vs National | |
| 1. | 33801 | 9.8% | 6.1%(+3.72)#95 | 5.3%(+4.53)#2,787 |
| 2. | 33805 | 7.7% | 6.1%(+1.65)#228 | 5.3%(+2.45)#5,154 |
| 3. | 33803 | 6.5% | 6.1%(+0.453)#380 | 5.3%(+1.26)#7,752 |
| 4. | 33815 | 6.4% | 6.1%(+0.351)#392 | 5.3%(+1.16)#8,031 |
| 5. | 33812 | 6.0% | 6.1%(-0.111)#462 | 5.3%(+0.693)#9,414 |
| 6. | 33811 | 5.8% | 6.1%(-0.286)#488 | 5.3%(+0.518)#10,024 |
| 7. | 33810 | 5.6% | 6.1%(-0.446)#510 | 5.3%(+0.358)#10,547 |
| 8. | 33809 | 5.6% | 6.1%(-0.480)#516 | 5.3%(+0.325)#10,669 |
| 9. | 33813 | 4.1% | 6.1%(-1.98)#704 | 5.3%(-1.17)#16,646 |
1
Common Questions
What are the Top 5 Zip Codes with the Highest Percentage of Population Employed in Food Preparation & Serving in Lakeland, FL?
Top 5 Zip Codes with the Highest Percentage of Population Employed in Food Preparation & Serving in Lakeland, FL are:
What zip code has the Highest Percentage of Population Employed in Food Preparation & Serving in Lakeland, FL?
33801 has the Highest Percentage of Population Employed in Food Preparation & Serving in Lakeland, FL with 9.8%.
What is the Percentage of Population Employed in Food Preparation & Serving in Lakeland, FL?
Percentage of Population Employed in Food Preparation & Serving in Lakeland is 7.4%.
What is the Percentage of Population Employed in Food Preparation & Serving in Florida?
Percentage of Population Employed in Food Preparation & Serving in Florida is 6.1%.
What is the Percentage of Population Employed in Food Preparation & Serving in the United States?
Percentage of Population Employed in Food Preparation & Serving in the United States is 5.3%.