East Milton, FL Map & Demographics
East Milton Map
East Milton Overview
$23,216
PER CAPITA INCOME
$84,231
AVG FAMILY INCOME
$61,923
AVG HOUSEHOLD INCOME
2.3%
WAGE / INCOME GAP [ % ]
97.7¢/ $1
WAGE / INCOME GAP [ $ ]
0.46
INEQUALITY / GINI INDEX
13,974
TOTAL POPULATION
9,182
MALE POPULATION
4,792
FEMALE POPULATION
191.61
MALES / 100 FEMALES
52.19
FEMALES / 100 MALES
40.2
MEDIAN AGE
3.3
AVG FAMILY SIZE
2.8
AVG HOUSEHOLD SIZE
4,413
LABOR FORCE [ PEOPLE ]
35.5%
PERCENT IN LABOR FORCE
5.0%
UNEMPLOYMENT RATE
Income in East Milton
Income Overview in East Milton
Per Capita Income in East Milton is $23,216, while median incomes of families and households are $84,231 and $61,923 respectively.
| Characteristic | Number | Measure |
| Per Capita Income | 13,974 | $23,216 |
| Median Family Income | 2,360 | $84,231 |
| Mean Family Income | 2,360 | $106,409 |
| Median Household Income | 3,368 | $61,923 |
| Mean Household Income | 3,368 | $88,752 |
| Income Deficit | 2,360 | $0 |
| Wage / Income Gap (%) | 13,974 | 2.25% |
| Wage / Income Gap ($) | 13,974 | 97.75¢ per $1 |
| Gini / Inequality Index | 13,974 | 0.46 |
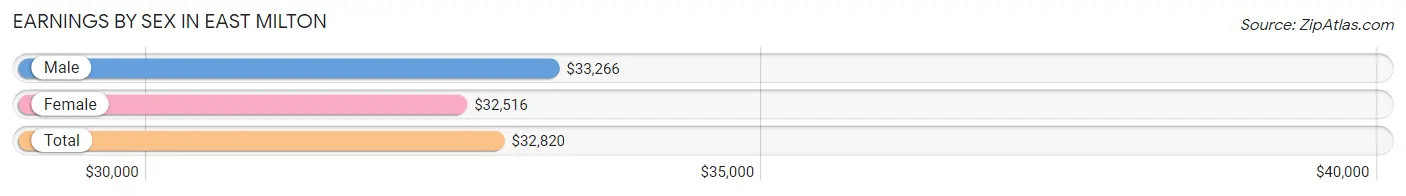
Earnings by Sex in East Milton
Average Earnings in East Milton are $32,820, $33,266 for men and $32,516 for women, a difference of 2.2%.
| Sex | Number | Average Earnings |
| Male | 3,179 (61.0%) | $33,266 |
| Female | 2,037 (39.1%) | $32,516 |
| Total | 5,216 (100.0%) | $32,820 |
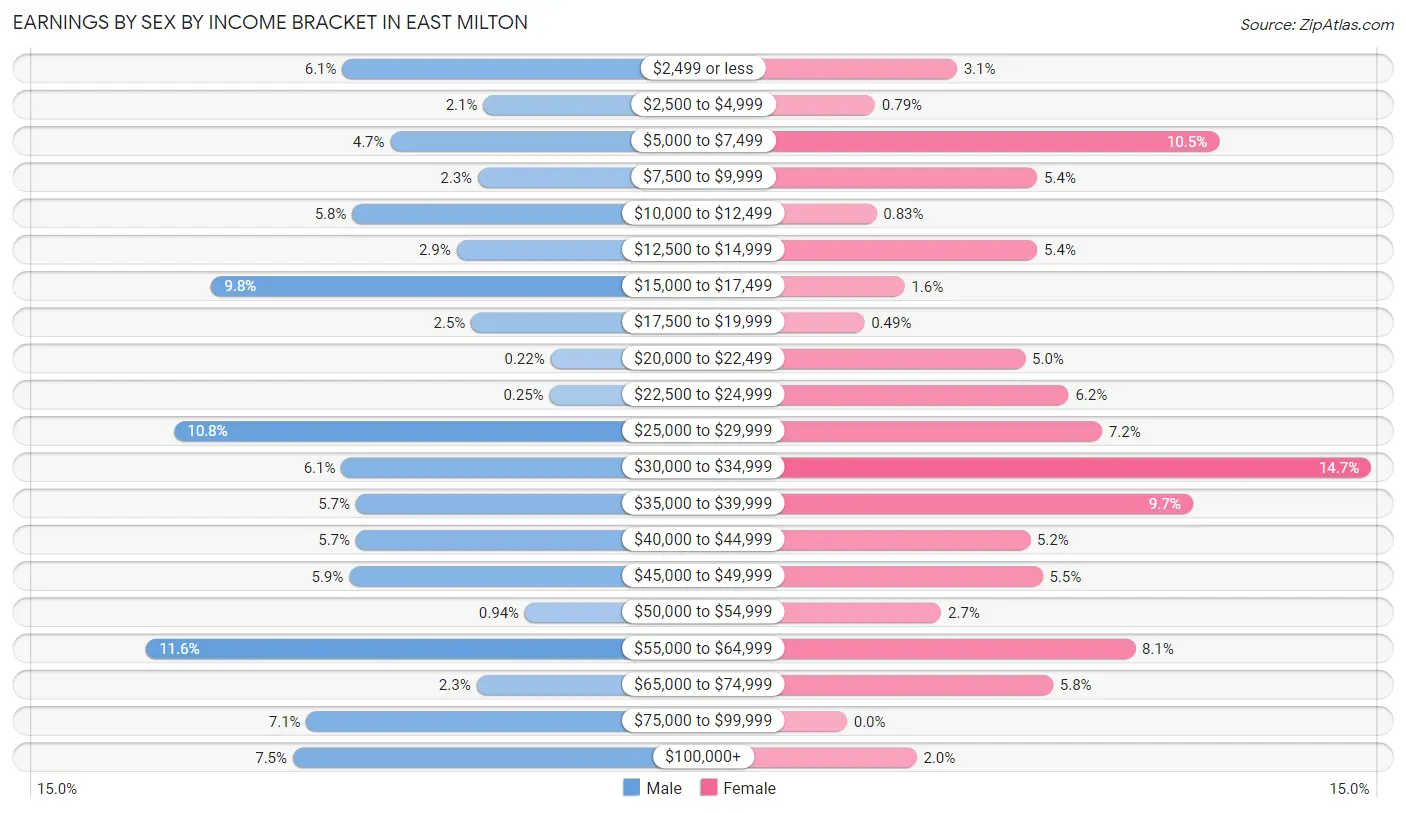
Earnings by Sex by Income Bracket in East Milton
The most common earnings brackets in East Milton are $55,000 to $64,999 for men (368 | 11.6%) and $30,000 to $34,999 for women (300 | 14.7%).
| Income | Male | Female |
| $2,499 or less | 193 (6.1%) | 63 (3.1%) |
| $2,500 to $4,999 | 67 (2.1%) | 16 (0.8%) |
| $5,000 to $7,499 | 150 (4.7%) | 213 (10.5%) |
| $7,500 to $9,999 | 72 (2.3%) | 109 (5.3%) |
| $10,000 to $12,499 | 184 (5.8%) | 17 (0.8%) |
| $12,500 to $14,999 | 91 (2.9%) | 109 (5.3%) |
| $15,000 to $17,499 | 310 (9.8%) | 33 (1.6%) |
| $17,500 to $19,999 | 78 (2.5%) | 10 (0.5%) |
| $20,000 to $22,499 | 7 (0.2%) | 102 (5.0%) |
| $22,500 to $24,999 | 8 (0.3%) | 127 (6.2%) |
| $25,000 to $29,999 | 343 (10.8%) | 146 (7.2%) |
| $30,000 to $34,999 | 194 (6.1%) | 300 (14.7%) |
| $35,000 to $39,999 | 181 (5.7%) | 198 (9.7%) |
| $40,000 to $44,999 | 181 (5.7%) | 105 (5.1%) |
| $45,000 to $49,999 | 187 (5.9%) | 112 (5.5%) |
| $50,000 to $54,999 | 30 (0.9%) | 54 (2.6%) |
| $55,000 to $64,999 | 368 (11.6%) | 165 (8.1%) |
| $65,000 to $74,999 | 73 (2.3%) | 118 (5.8%) |
| $75,000 to $99,999 | 225 (7.1%) | 0 (0.0%) |
| $100,000+ | 237 (7.5%) | 40 (2.0%) |
| Total | 3,179 (100.0%) | 2,037 (100.0%) |
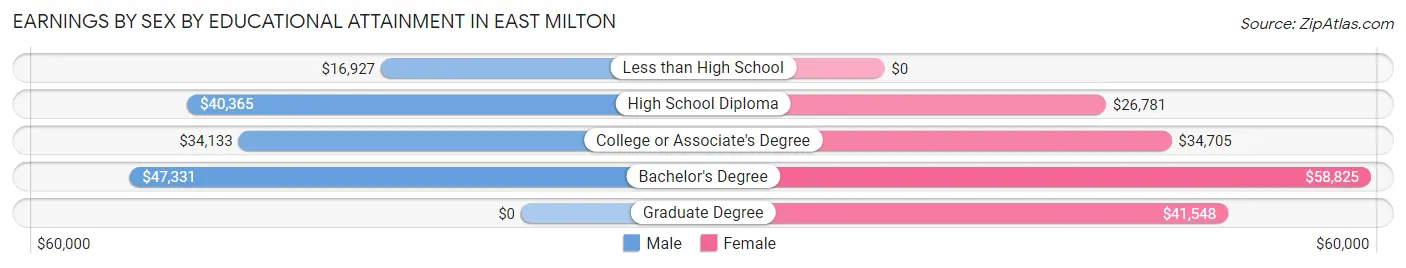
Earnings by Sex by Educational Attainment in East Milton
Average earnings in East Milton are $35,056 for men and $33,931 for women, a difference of 3.2%. Men with an educational attainment of bachelor's degree enjoy the highest average annual earnings of $47,331, while those with less than high school education earn the least with $16,927. Women with an educational attainment of bachelor's degree earn the most with the average annual earnings of $58,825, while those with high school diploma education have the smallest earnings of $26,781.
| Educational Attainment | Male Income | Female Income |
| Less than High School | $16,927 | $0 |
| High School Diploma | $40,365 | $26,781 |
| College or Associate's Degree | $34,133 | $34,705 |
| Bachelor's Degree | $47,331 | $58,825 |
| Graduate Degree | - | - |
| Total | $35,056 | $33,931 |
Family Income in East Milton
Family Income Brackets in East Milton
According to the East Milton family income data, there are 453 families falling into the $100,000 to $149,999 income range, which is the most common income bracket and makes up 19.2% of all families. Conversely, the less than $10,000 income bracket is the least frequent group with only 40 families (1.7%) belonging to this category.
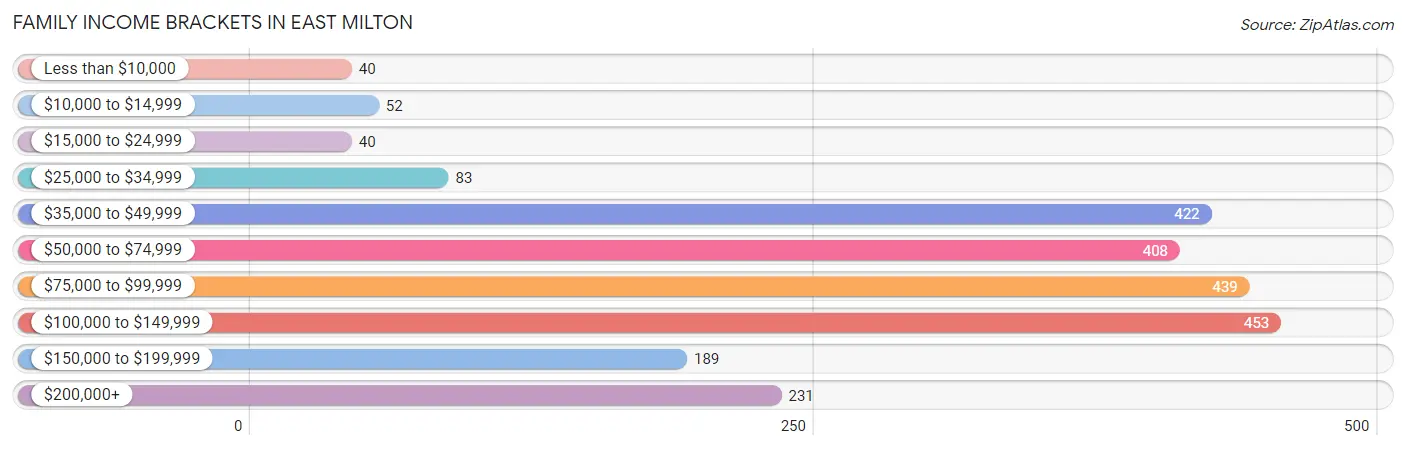
| Income Bracket | # Families | % Families |
| Less than $10,000 | 40 | 1.7% |
| $10,000 to $14,999 | 52 | 2.2% |
| $15,000 to $24,999 | 40 | 1.7% |
| $25,000 to $34,999 | 83 | 3.5% |
| $35,000 to $49,999 | 422 | 17.9% |
| $50,000 to $74,999 | 408 | 17.3% |
| $75,000 to $99,999 | 439 | 18.6% |
| $100,000 to $149,999 | 453 | 19.2% |
| $150,000 to $199,999 | 189 | 8.0% |
| $200,000+ | 231 | 9.8% |
Family Income by Famaliy Size in East Milton
6-person families (168 | 7.1%) account for the highest median family income in East Milton with $173,404 per family, while 3-person families (482 | 20.4%) have the highest median income of $32,639 per family member.
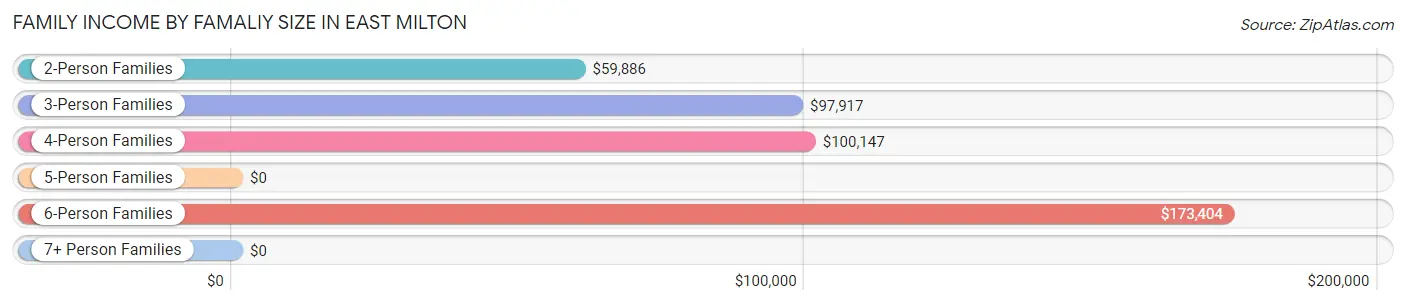
| Income Bracket | # Families | Median Income |
| 2-Person Families | 1,082 (45.9%) | $59,886 |
| 3-Person Families | 482 (20.4%) | $97,917 |
| 4-Person Families | 252 (10.7%) | $100,147 |
| 5-Person Families | 361 (15.3%) | $0 |
| 6-Person Families | 168 (7.1%) | $173,404 |
| 7+ Person Families | 15 (0.6%) | $0 |
| Total | 2,360 (100.0%) | $84,231 |
Family Income by Number of Earners in East Milton
The median family income in East Milton is $84,231, with families comprising 3+ earners (372) having the highest median family income of $108,958, while families with no earners (382) have the lowest median family income of $45,462, accounting for 15.8% and 16.2% of families, respectively.
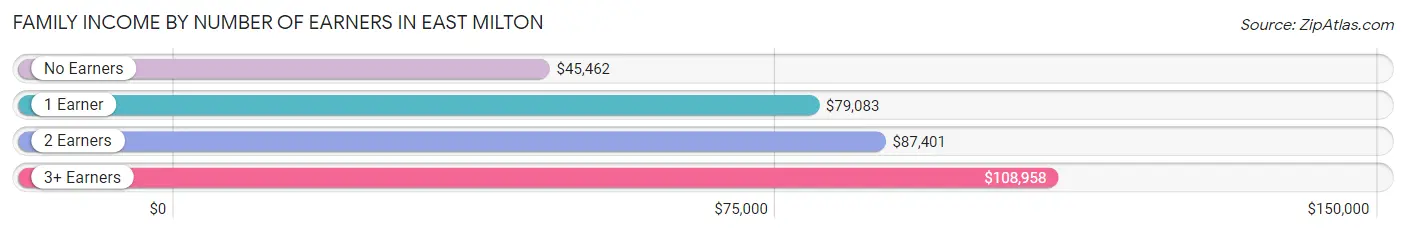
| Number of Earners | # Families | Median Income |
| No Earners | 382 (16.2%) | $45,462 |
| 1 Earner | 679 (28.8%) | $79,083 |
| 2 Earners | 927 (39.3%) | $87,401 |
| 3+ Earners | 372 (15.8%) | $108,958 |
| Total | 2,360 (100.0%) | $84,231 |
Household Income in East Milton
Household Income Brackets in East Milton
With 600 households falling in the category, the $50,000 to $74,999 income range is the most frequent in East Milton, accounting for 17.8% of all households. In contrast, only 104 households (3.1%) fall into the less than $10,000 income bracket, making it the least populous group.
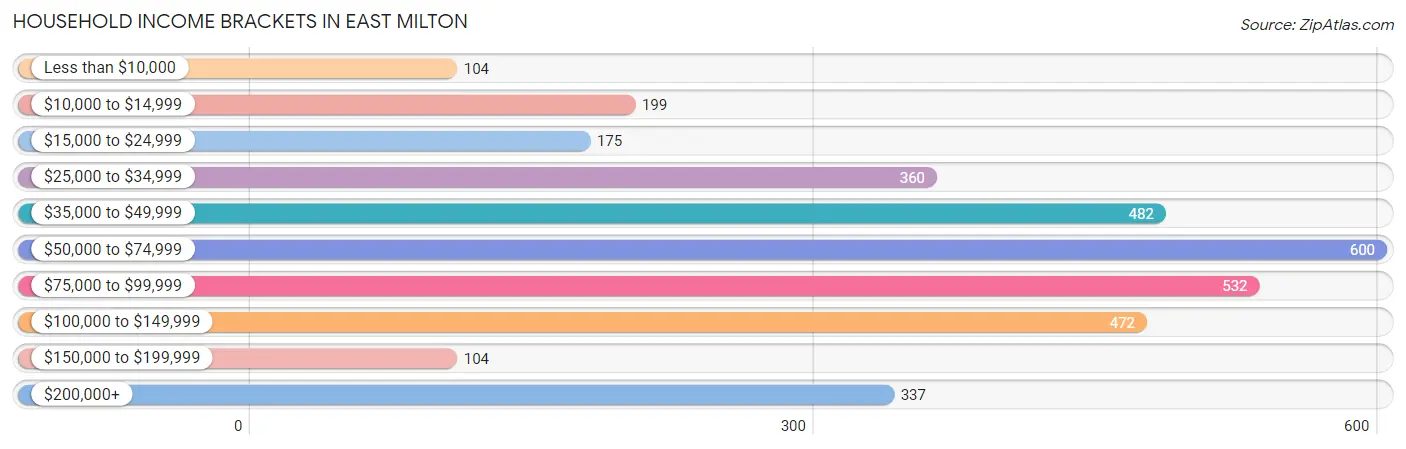
| Income Bracket | # Households | % Households |
| Less than $10,000 | 104 | 3.1% |
| $10,000 to $14,999 | 199 | 5.9% |
| $15,000 to $24,999 | 175 | 5.2% |
| $25,000 to $34,999 | 360 | 10.7% |
| $35,000 to $49,999 | 482 | 14.3% |
| $50,000 to $74,999 | 600 | 17.8% |
| $75,000 to $99,999 | 532 | 15.8% |
| $100,000 to $149,999 | 472 | 14.0% |
| $150,000 to $199,999 | 104 | 3.1% |
| $200,000+ | 337 | 10.0% |
Household Income by Householder Age in East Milton
The median household income in East Milton is $61,923, with the highest median household income of $80,202 found in the 25 to 44 years age bracket for the primary householder. A total of 991 households (29.4%) fall into this category.
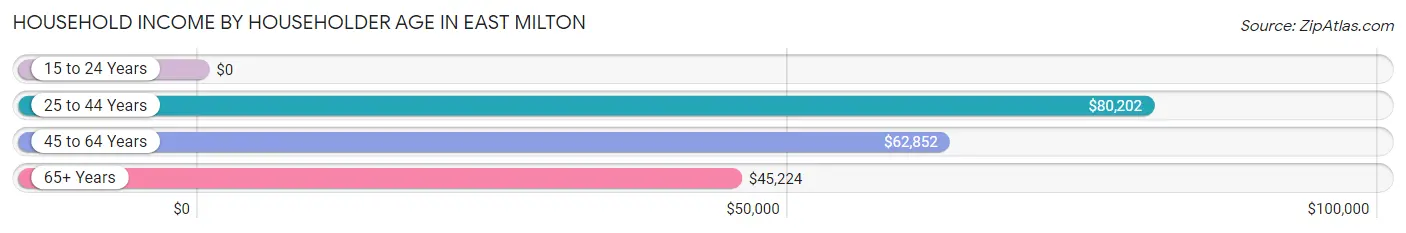
| Income Bracket | # Households | Median Income |
| 15 to 24 Years | 0 (0.0%) | $0 |
| 25 to 44 Years | 991 (29.4%) | $80,202 |
| 45 to 64 Years | 1,407 (41.8%) | $62,852 |
| 65+ Years | 970 (28.8%) | $45,224 |
| Total | 3,368 (100.0%) | $61,923 |
Poverty in East Milton
Income Below Poverty by Sex and Age in East Milton
With 6.9% poverty level for males and 13.6% for females among the residents of East Milton, 12 to 14 year old males and 15 year old females are the most vulnerable to poverty, with 16 males (23.2%) and 38 females (54.3%) in their respective age groups living below the poverty level.
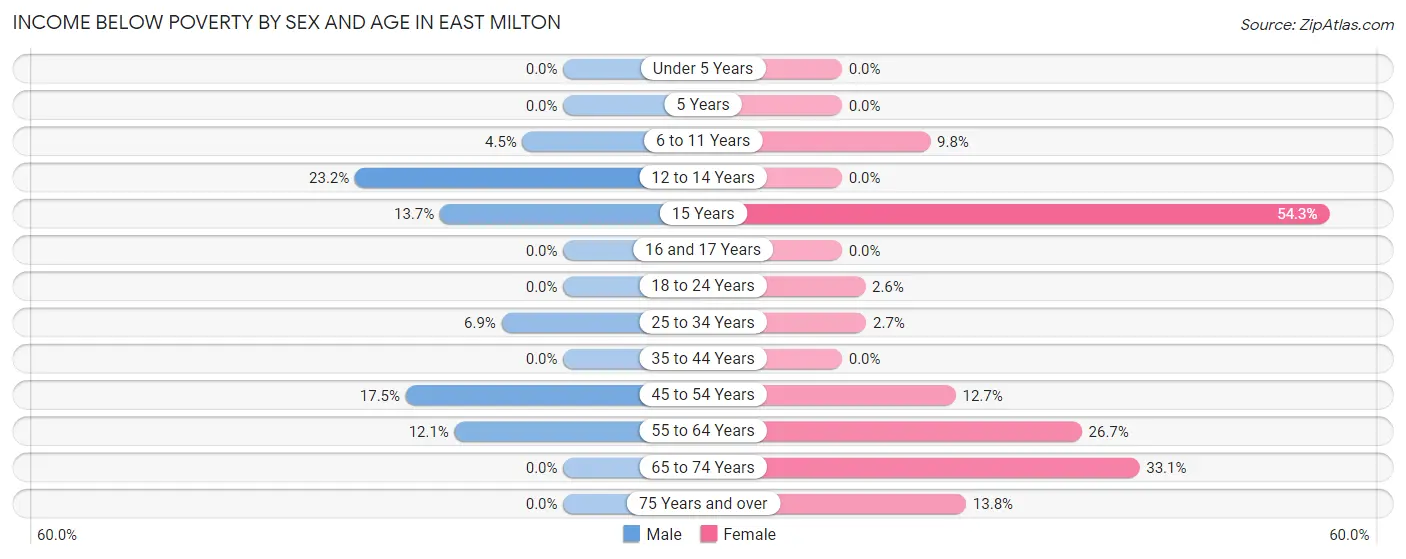
| Age Bracket | Male | Female |
| Under 5 Years | 0 (0.0%) | 0 (0.0%) |
| 5 Years | 0 (0.0%) | 0 (0.0%) |
| 6 to 11 Years | 18 (4.5%) | 29 (9.8%) |
| 12 to 14 Years | 16 (23.2%) | 0 (0.0%) |
| 15 Years | 14 (13.7%) | 38 (54.3%) |
| 16 and 17 Years | 0 (0.0%) | 0 (0.0%) |
| 18 to 24 Years | 0 (0.0%) | 6 (2.6%) |
| 25 to 34 Years | 36 (6.9%) | 21 (2.7%) |
| 35 to 44 Years | 0 (0.0%) | 0 (0.0%) |
| 45 to 54 Years | 127 (17.5%) | 105 (12.7%) |
| 55 to 64 Years | 117 (12.1%) | 148 (26.7%) |
| 65 to 74 Years | 0 (0.0%) | 273 (33.1%) |
| 75 Years and over | 0 (0.0%) | 21 (13.8%) |
| Total | 328 (6.9%) | 641 (13.6%) |
Income Above Poverty by Sex and Age in East Milton
According to the poverty statistics in East Milton, males aged under 5 years and females aged under 5 years are the age groups that are most secure financially, with 100.0% of males and 100.0% of females in these age groups living above the poverty line.
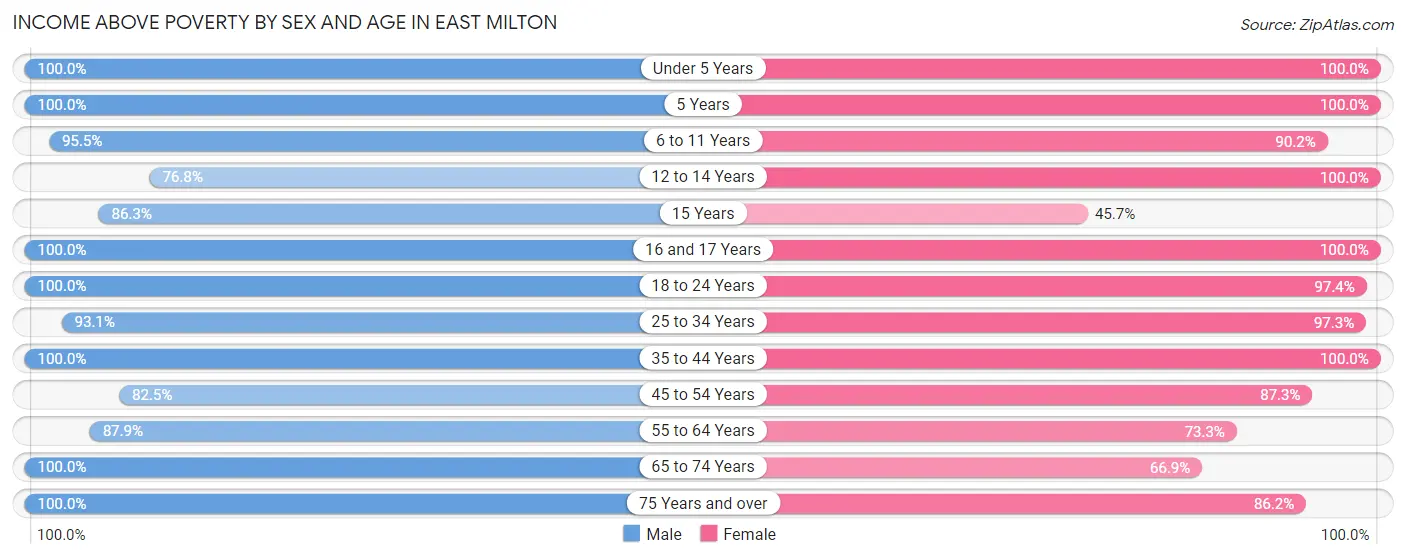
| Age Bracket | Male | Female |
| Under 5 Years | 322 (100.0%) | 163 (100.0%) |
| 5 Years | 23 (100.0%) | 25 (100.0%) |
| 6 to 11 Years | 379 (95.5%) | 266 (90.2%) |
| 12 to 14 Years | 53 (76.8%) | 55 (100.0%) |
| 15 Years | 88 (86.3%) | 32 (45.7%) |
| 16 and 17 Years | 75 (100.0%) | 44 (100.0%) |
| 18 to 24 Years | 305 (100.0%) | 226 (97.4%) |
| 25 to 34 Years | 488 (93.1%) | 754 (97.3%) |
| 35 to 44 Years | 594 (100.0%) | 688 (100.0%) |
| 45 to 54 Years | 597 (82.5%) | 724 (87.3%) |
| 55 to 64 Years | 850 (87.9%) | 406 (73.3%) |
| 65 to 74 Years | 476 (100.0%) | 551 (66.9%) |
| 75 Years and over | 175 (100.0%) | 131 (86.2%) |
| Total | 4,425 (93.1%) | 4,065 (86.4%) |
Income Below Poverty Among Married-Couple Families in East Milton
The poverty statistics for married-couple families in East Milton show that 3.0% or 52 of the total 1,759 families live below the poverty line. Families with 3 or 4 children have the highest poverty rate of 11.6%, comprising of 15 families. On the other hand, families with 1 or 2 children have the lowest poverty rate of 0.0%, which includes 0 families.
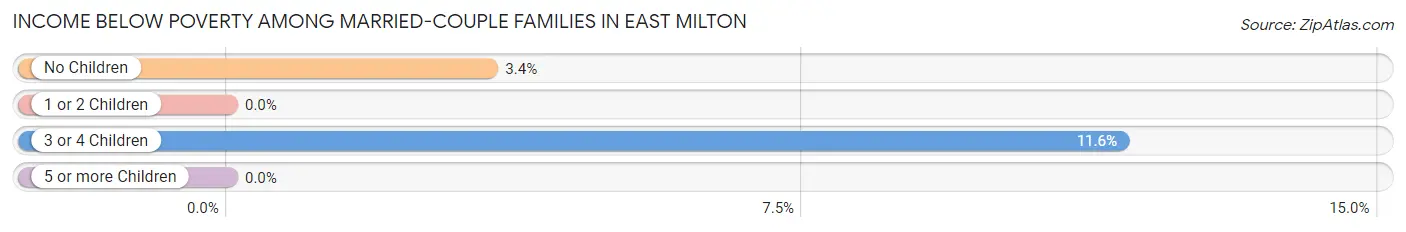
| Children | Above Poverty | Below Poverty |
| No Children | 1,052 (96.6%) | 37 (3.4%) |
| 1 or 2 Children | 541 (100.0%) | 0 (0.0%) |
| 3 or 4 Children | 114 (88.4%) | 15 (11.6%) |
| 5 or more Children | 0 (0.0%) | 0 (0.0%) |
| Total | 1,707 (97.0%) | 52 (3.0%) |
Income Below Poverty Among Single-Parent Households in East Milton

| Children | Single Father | Single Mother |
| No Children | 56 (31.8%) | 0 (0.0%) |
| 1 or 2 Children | 0 (0.0%) | 0 (0.0%) |
| 3 or 4 Children | 0 (0.0%) | 0 (0.0%) |
| 5 or more Children | 0 (0.0%) | 0 (0.0%) |
| Total | 56 (16.8%) | 0 (0.0%) |
Income Below Poverty Among Married-Couple vs Single-Parent Households in East Milton
The poverty data for East Milton shows that 52 of the married-couple family households (3.0%) and 56 of the single-parent households (9.3%) are living below the poverty level. Within the married-couple family households, those with 3 or 4 children have the highest poverty rate, with 15 households (11.6%) falling below the poverty line. Among the single-parent households, those with no children have the highest poverty rate, with 56 household (20.4%) living below poverty.
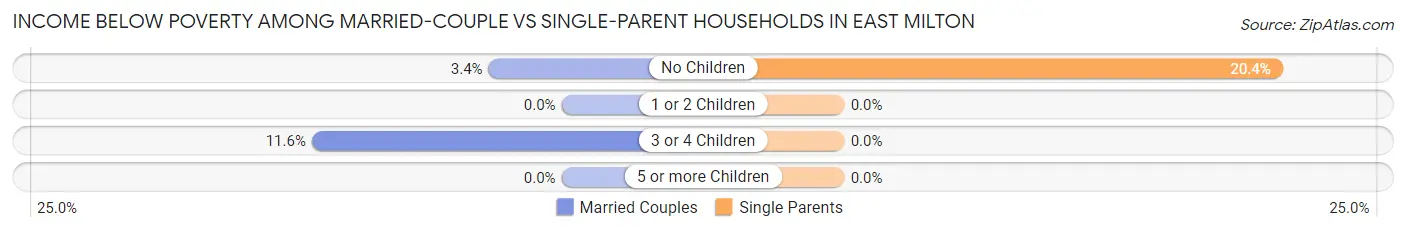
| Children | Married-Couple Families | Single-Parent Households |
| No Children | 37 (3.4%) | 56 (20.4%) |
| 1 or 2 Children | 0 (0.0%) | 0 (0.0%) |
| 3 or 4 Children | 15 (11.6%) | 0 (0.0%) |
| 5 or more Children | 0 (0.0%) | 0 (0.0%) |
| Total | 52 (3.0%) | 56 (9.3%) |
Race in East Milton
The most populous races in East Milton are White / Caucasian (9,669 | 69.2%), Black / African American (2,931 | 21.0%), and Two or more Races (905 | 6.5%).
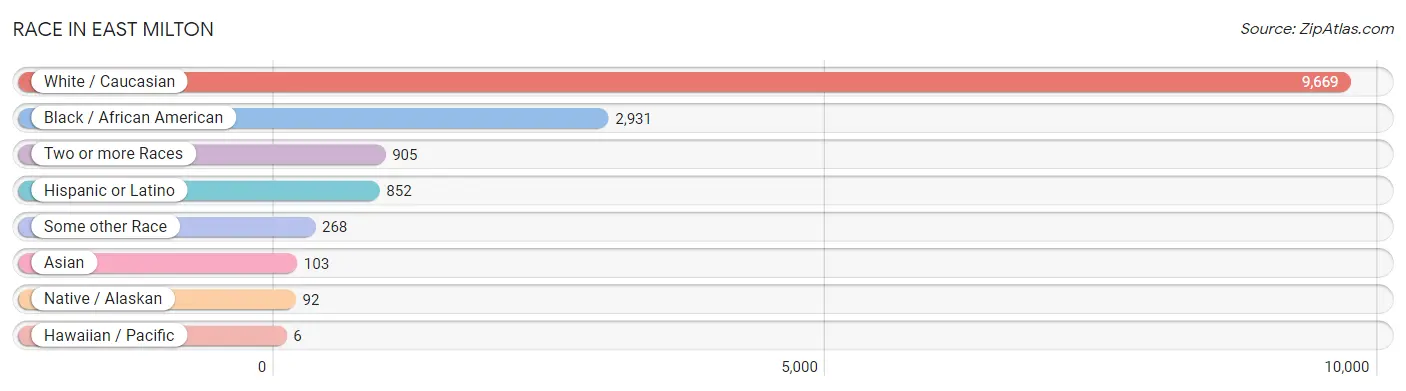
| Race | # Population | % Population |
| Asian | 103 | 0.7% |
| Black / African American | 2,931 | 21.0% |
| Hawaiian / Pacific | 6 | 0.0% |
| Hispanic or Latino | 852 | 6.1% |
| Native / Alaskan | 92 | 0.7% |
| White / Caucasian | 9,669 | 69.2% |
| Two or more Races | 905 | 6.5% |
| Some other Race | 268 | 1.9% |
| Total | 13,974 | 100.0% |
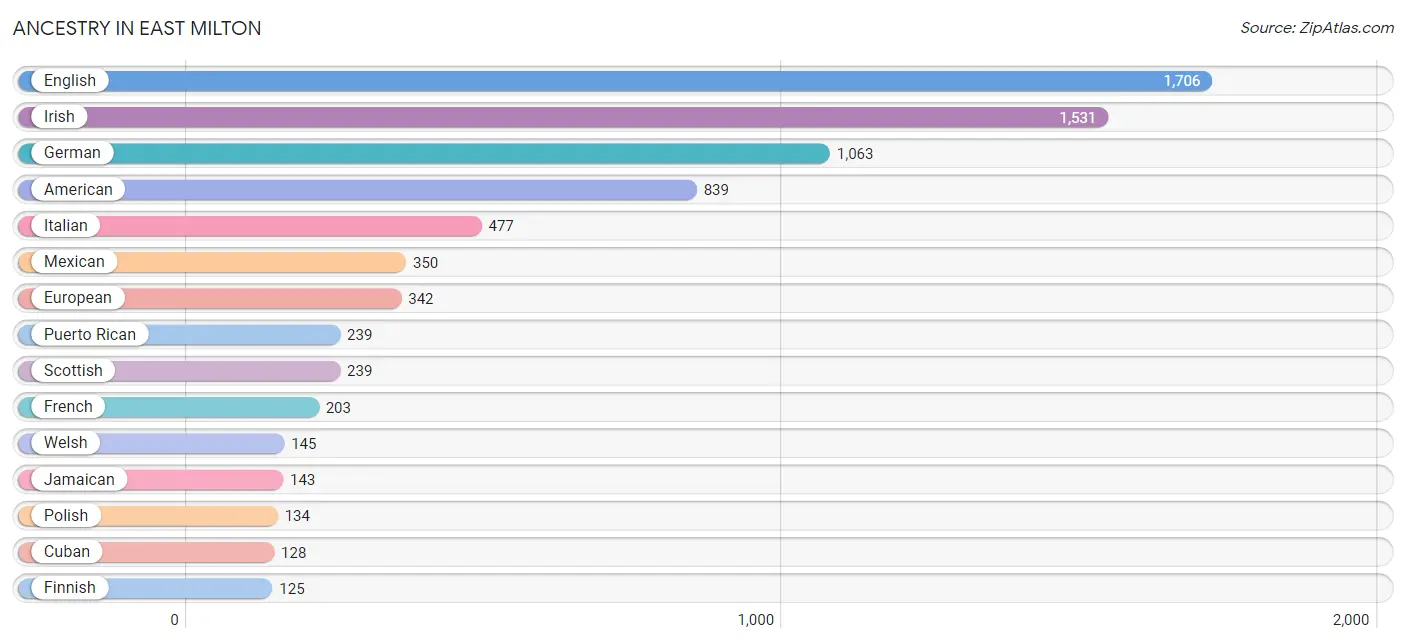
Ancestry in East Milton
The most populous ancestries reported in East Milton are English (1,706 | 12.2%), Irish (1,531 | 11.0%), German (1,063 | 7.6%), American (839 | 6.0%), and Italian (477 | 3.4%), together accounting for 40.2% of all East Milton residents.
| Ancestry | # Population | % Population |
| African | 28 | 0.2% |
| American | 839 | 6.0% |
| Arab | 45 | 0.3% |
| Armenian | 20 | 0.1% |
| Austrian | 15 | 0.1% |
| Bahamian | 2 | 0.0% |
| Barbadian | 6 | 0.0% |
| Bhutanese | 68 | 0.5% |
| Blackfeet | 24 | 0.2% |
| British | 48 | 0.3% |
| Canadian | 11 | 0.1% |
| Central American | 38 | 0.3% |
| Central American Indian | 6 | 0.0% |
| Cherokee | 97 | 0.7% |
| Chippewa | 7 | 0.1% |
| Choctaw | 10 | 0.1% |
| Colombian | 6 | 0.0% |
| Creek | 45 | 0.3% |
| Cuban | 128 | 0.9% |
| Czech | 9 | 0.1% |
| Czechoslovakian | 16 | 0.1% |
| Danish | 26 | 0.2% |
| Dominican | 2 | 0.0% |
| Dutch | 45 | 0.3% |
| Eastern European | 12 | 0.1% |
| English | 1,706 | 12.2% |
| European | 342 | 2.5% |
| Finnish | 125 | 0.9% |
| French | 203 | 1.5% |
| French Canadian | 72 | 0.5% |
| German | 1,063 | 7.6% |
| Greek | 23 | 0.2% |
| Guamanian / Chamorro | 6 | 0.0% |
| Guatemalan | 4 | 0.0% |
| Haitian | 122 | 0.9% |
| Hungarian | 4 | 0.0% |
| Indian (Asian) | 21 | 0.2% |
| Irish | 1,531 | 11.0% |
| Italian | 477 | 3.4% |
| Jamaican | 143 | 1.0% |
| Korean | 98 | 0.7% |
| Lithuanian | 66 | 0.5% |
| Mexican | 350 | 2.5% |
| Mexican American Indian | 6 | 0.0% |
| Moroccan | 38 | 0.3% |
| Native Hawaiian | 12 | 0.1% |
| Northern European | 87 | 0.6% |
| Norwegian | 76 | 0.5% |
| Pakistani | 17 | 0.1% |
| Panamanian | 3 | 0.0% |
| Polish | 134 | 1.0% |
| Portuguese | 28 | 0.2% |
| Puerto Rican | 239 | 1.7% |
| Romanian | 9 | 0.1% |
| Russian | 12 | 0.1% |
| Salvadoran | 31 | 0.2% |
| Scandinavian | 14 | 0.1% |
| Scotch-Irish | 115 | 0.8% |
| Scottish | 239 | 1.7% |
| Seminole | 7 | 0.1% |
| Slovak | 26 | 0.2% |
| South American | 12 | 0.1% |
| Spaniard | 16 | 0.1% |
| Spanish | 51 | 0.4% |
| Sri Lankan | 6 | 0.0% |
| Subsaharan African | 28 | 0.2% |
| Swedish | 57 | 0.4% |
| Trinidadian and Tobagonian | 5 | 0.0% |
| Ukrainian | 19 | 0.1% |
| Venezuelan | 6 | 0.0% |
| Welsh | 145 | 1.0% |
| Yup'ik | 4 | 0.0% | View All 72 Rows |
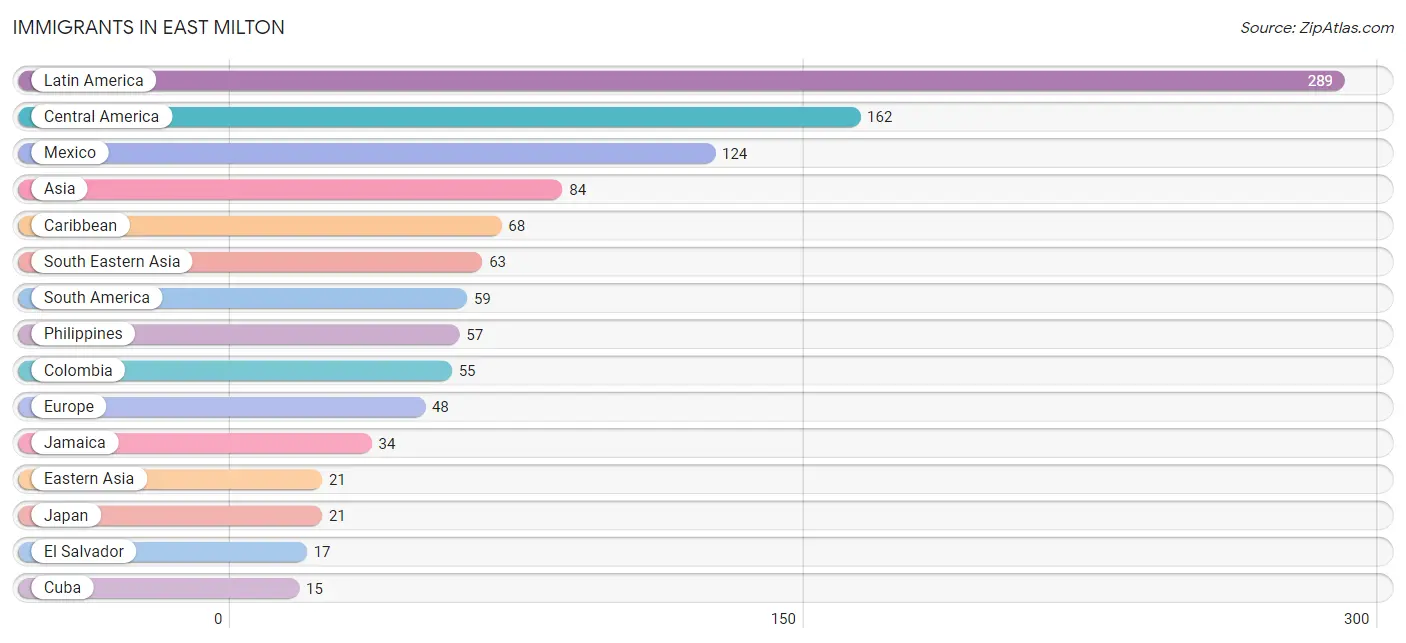
Immigrants in East Milton
The most numerous immigrant groups reported in East Milton came from Latin America (289 | 2.1%), Central America (162 | 1.2%), Mexico (124 | 0.9%), Asia (84 | 0.6%), and Caribbean (68 | 0.5%), together accounting for 5.2% of all East Milton residents.
| Immigration Origin | # Population | % Population |
| Asia | 84 | 0.6% |
| Bahamas | 6 | 0.0% |
| Canada | 12 | 0.1% |
| Caribbean | 68 | 0.5% |
| Central America | 162 | 1.2% |
| Colombia | 55 | 0.4% |
| Cuba | 15 | 0.1% |
| Eastern Asia | 21 | 0.2% |
| Eastern Europe | 12 | 0.1% |
| El Salvador | 17 | 0.1% |
| Europe | 48 | 0.3% |
| Germany | 9 | 0.1% |
| Guatemala | 4 | 0.0% |
| Haiti | 13 | 0.1% |
| Honduras | 3 | 0.0% |
| Italy | 14 | 0.1% |
| Jamaica | 34 | 0.2% |
| Japan | 21 | 0.2% |
| Latin America | 289 | 2.1% |
| Mexico | 124 | 0.9% |
| Nicaragua | 14 | 0.1% |
| Northern Europe | 13 | 0.1% |
| Philippines | 57 | 0.4% |
| Russia | 12 | 0.1% |
| Scotland | 13 | 0.1% |
| South America | 59 | 0.4% |
| South Eastern Asia | 63 | 0.4% |
| Southern Europe | 14 | 0.1% |
| Venezuela | 4 | 0.0% |
| Vietnam | 6 | 0.0% |
| Western Europe | 9 | 0.1% | View All 31 Rows |
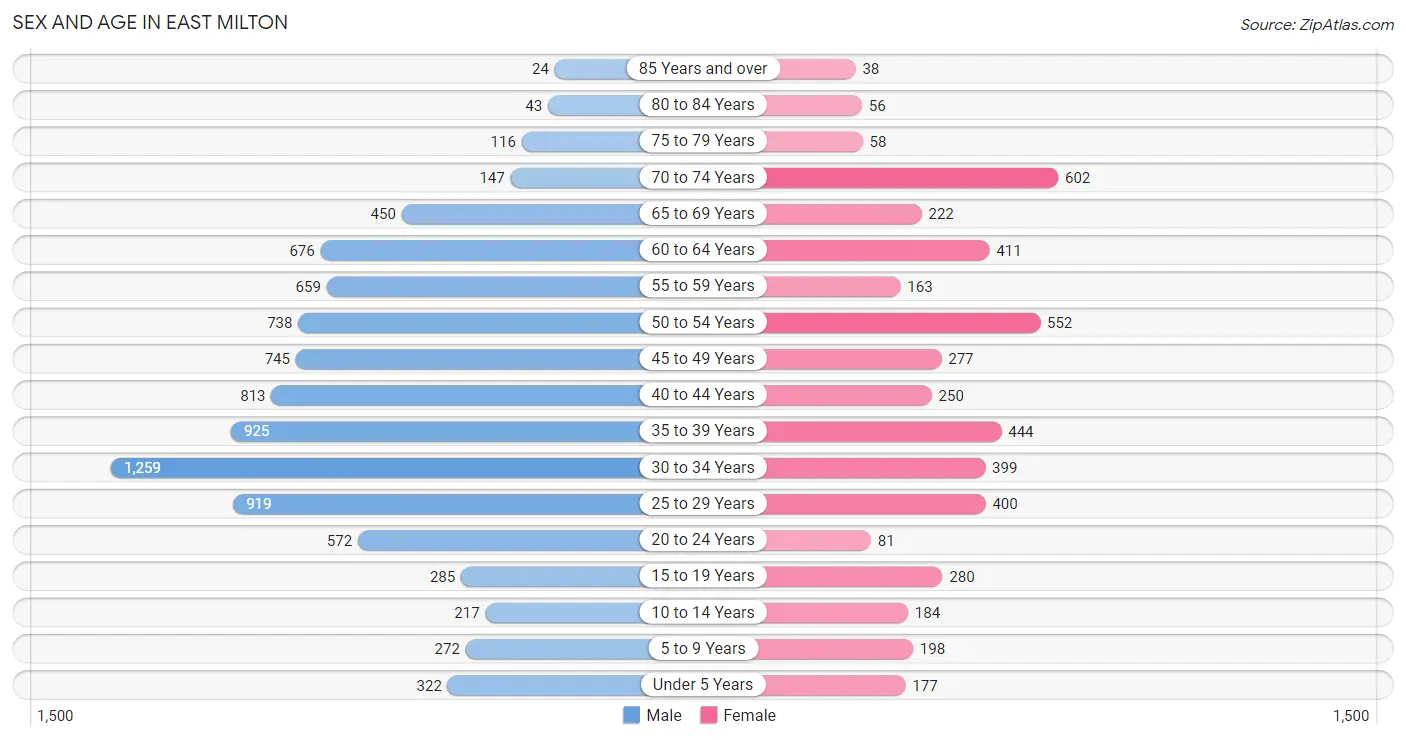
Sex and Age in East Milton
Sex and Age in East Milton
The most populous age groups in East Milton are 30 to 34 Years (1,259 | 13.7%) for men and 70 to 74 Years (602 | 12.6%) for women.
| Age Bracket | Male | Female |
| Under 5 Years | 322 (3.5%) | 177 (3.7%) |
| 5 to 9 Years | 272 (3.0%) | 198 (4.1%) |
| 10 to 14 Years | 217 (2.4%) | 184 (3.8%) |
| 15 to 19 Years | 285 (3.1%) | 280 (5.8%) |
| 20 to 24 Years | 572 (6.2%) | 81 (1.7%) |
| 25 to 29 Years | 919 (10.0%) | 400 (8.4%) |
| 30 to 34 Years | 1,259 (13.7%) | 399 (8.3%) |
| 35 to 39 Years | 925 (10.1%) | 444 (9.3%) |
| 40 to 44 Years | 813 (8.8%) | 250 (5.2%) |
| 45 to 49 Years | 745 (8.1%) | 277 (5.8%) |
| 50 to 54 Years | 738 (8.0%) | 552 (11.5%) |
| 55 to 59 Years | 659 (7.2%) | 163 (3.4%) |
| 60 to 64 Years | 676 (7.4%) | 411 (8.6%) |
| 65 to 69 Years | 450 (4.9%) | 222 (4.6%) |
| 70 to 74 Years | 147 (1.6%) | 602 (12.6%) |
| 75 to 79 Years | 116 (1.3%) | 58 (1.2%) |
| 80 to 84 Years | 43 (0.5%) | 56 (1.2%) |
| 85 Years and over | 24 (0.3%) | 38 (0.8%) |
| Total | 9,182 (100.0%) | 4,792 (100.0%) |
Families and Households in East Milton
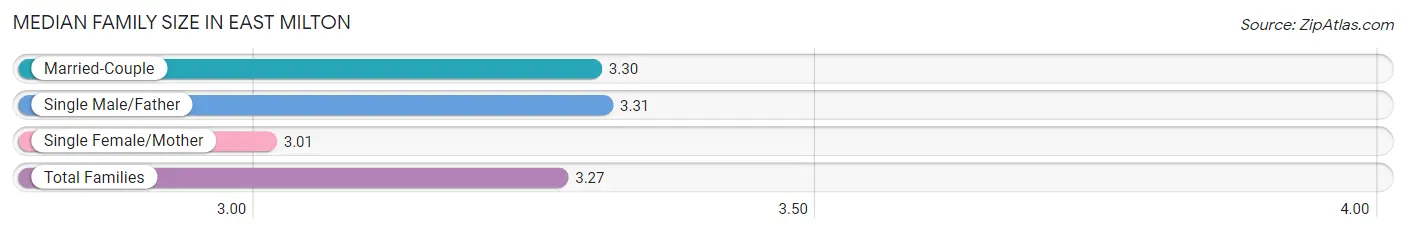
Median Family Size in East Milton
The median family size in East Milton is 3.27 persons per family, with single male/father families (334 | 14.1%) accounting for the largest median family size of 3.31 persons per family. On the other hand, single female/mother families (267 | 11.3%) represent the smallest median family size with 3.01 persons per family.
| Family Type | # Families | Family Size |
| Married-Couple | 1,759 (74.5%) | 3.30 |
| Single Male/Father | 334 (14.1%) | 3.31 |
| Single Female/Mother | 267 (11.3%) | 3.01 |
| Total Families | 2,360 (100.0%) | 3.27 |
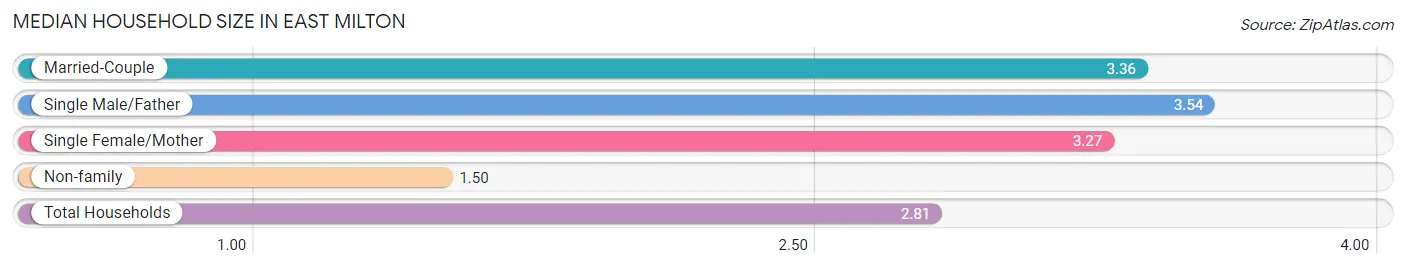
Median Household Size in East Milton
The median household size in East Milton is 2.81 persons per household, with single male/father households (334 | 9.9%) accounting for the largest median household size of 3.54 persons per household. non-family households (1,008 | 29.9%) represent the smallest median household size with 1.50 persons per household.
| Household Type | # Households | Household Size |
| Married-Couple | 1,759 (52.2%) | 3.36 |
| Single Male/Father | 334 (9.9%) | 3.54 |
| Single Female/Mother | 267 (7.9%) | 3.27 |
| Non-family | 1,008 (29.9%) | 1.50 |
| Total Households | 3,368 (100.0%) | 2.81 |
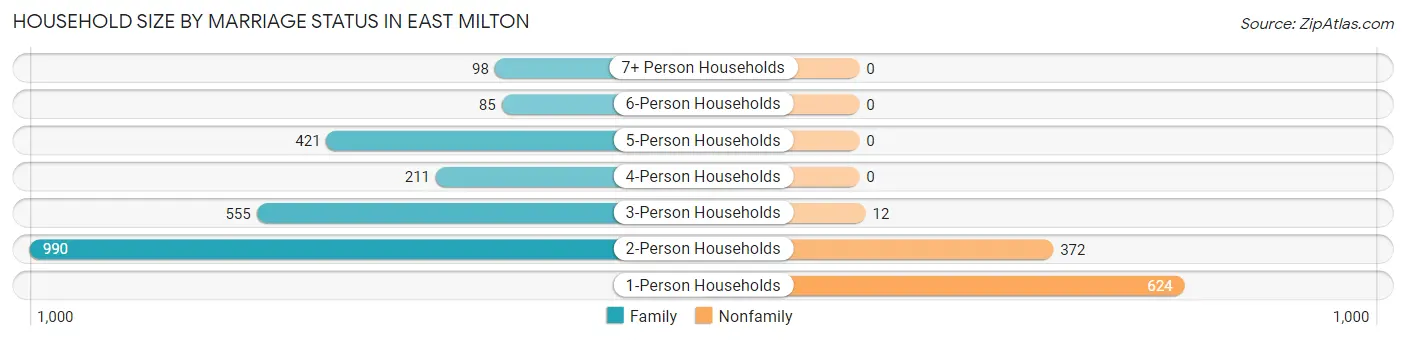
Household Size by Marriage Status in East Milton
Out of a total of 3,368 households in East Milton, 2,360 (70.1%) are family households, while 1,008 (29.9%) are nonfamily households. The most numerous type of family households are 2-person households, comprising 990, and the most common type of nonfamily households are 1-person households, comprising 624.
| Household Size | Family Households | Nonfamily Households |
| 1-Person Households | - | 624 (18.5%) |
| 2-Person Households | 990 (29.4%) | 372 (11.1%) |
| 3-Person Households | 555 (16.5%) | 12 (0.4%) |
| 4-Person Households | 211 (6.3%) | 0 (0.0%) |
| 5-Person Households | 421 (12.5%) | 0 (0.0%) |
| 6-Person Households | 85 (2.5%) | 0 (0.0%) |
| 7+ Person Households | 98 (2.9%) | 0 (0.0%) |
| Total | 2,360 (70.1%) | 1,008 (29.9%) |
Female Fertility in East Milton
Fertility by Age in East Milton
| Age Bracket | Women with Births | Births / 1,000 Women |
| 15 to 19 years | 0 (0.0%) | 0.0 |
| 20 to 34 years | 0 (0.0%) | 0.0 |
| 35 to 50 years | 0 (0.0%) | 0.0 |
| Total | 0 (0.0%) | 0.0 |
Fertility by Age by Marriage Status in East Milton
| Age Bracket | Married | Unmarried |
| 15 to 19 years | 0 (0.0%) | 0 (0.0%) |
| 20 to 34 years | 0 (0.0%) | 0 (0.0%) |
| 35 to 50 years | 0 (0.0%) | 0 (0.0%) |
| Total | 0 (0.0%) | 0 (0.0%) |
Fertility by Education in East Milton
| Educational Attainment | Women with Births | Births / 1,000 Women |
| Less than High School | 0 (0.0%) | 0.0 |
| High School Diploma | 0 (0.0%) | 0.0 |
| College or Associate's Degree | 0 (0.0%) | 0.0 |
| Bachelor's Degree | 0 (0.0%) | 0.0 |
| Graduate Degree | 0 (0.0%) | 0.0 |
| Total | 0 (0.0%) | 0.0 |
Fertility by Education by Marriage Status in East Milton
| Educational Attainment | Married | Unmarried |
| Less than High School | 0 (0.0%) | 0 (0.0%) |
| High School Diploma | 0 (0.0%) | 0 (0.0%) |
| College or Associate's Degree | 0 (0.0%) | 0 (0.0%) |
| Bachelor's Degree | 0 (0.0%) | 0 (0.0%) |
| Graduate Degree | 0 (0.0%) | 0 (0.0%) |
| Total | 0 (0.0%) | 0 (0.0%) |
Employment Characteristics in East Milton
Employment by Class of Employer in East Milton
Among the 4,064 employed individuals in East Milton, private company employees (2,581 | 63.5%), self-employed (not incorporated) (325 | 8.0%), and self-employed (incorporated) (294 | 7.2%) make up the most common classes of employment.
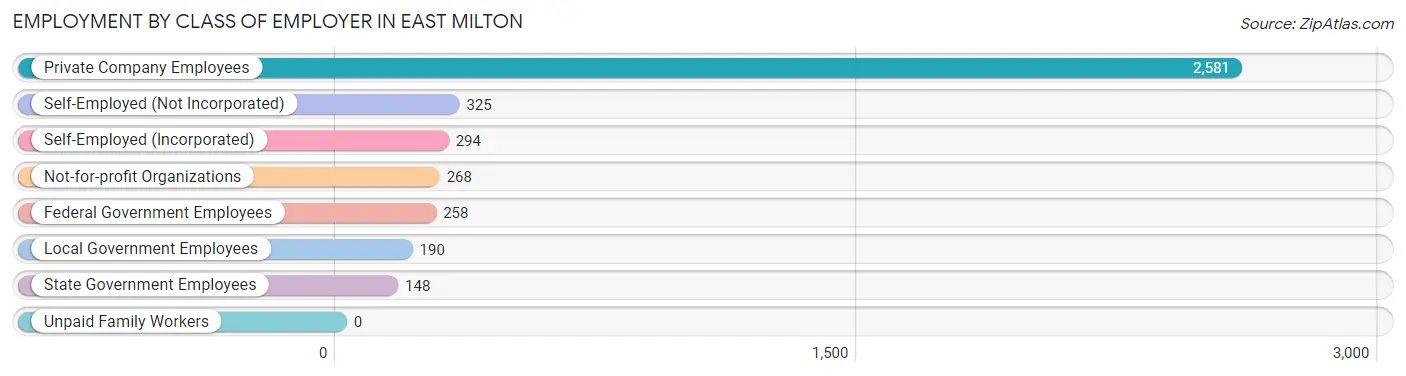
| Employer Class | # Employees | % Employees |
| Private Company Employees | 2,581 | 63.5% |
| Self-Employed (Incorporated) | 294 | 7.2% |
| Self-Employed (Not Incorporated) | 325 | 8.0% |
| Not-for-profit Organizations | 268 | 6.6% |
| Local Government Employees | 190 | 4.7% |
| State Government Employees | 148 | 3.6% |
| Federal Government Employees | 258 | 6.4% |
| Unpaid Family Workers | 0 | 0.0% |
| Total | 4,064 | 100.0% |
Employment Status by Age in East Milton
According to the labor force statistics for East Milton, out of the total population over 16 years of age (12,432), 35.5% or 4,413 individuals are in the labor force, with 5.0% or 221 of them unemployed. The age group with the highest labor force participation rate is 16 to 19 years, with 68.7% or 270 individuals in the labor force. Within the labor force, the 35 to 44 years age range has the highest percentage of unemployed individuals, with 16.0% or 171 of them being unemployed.
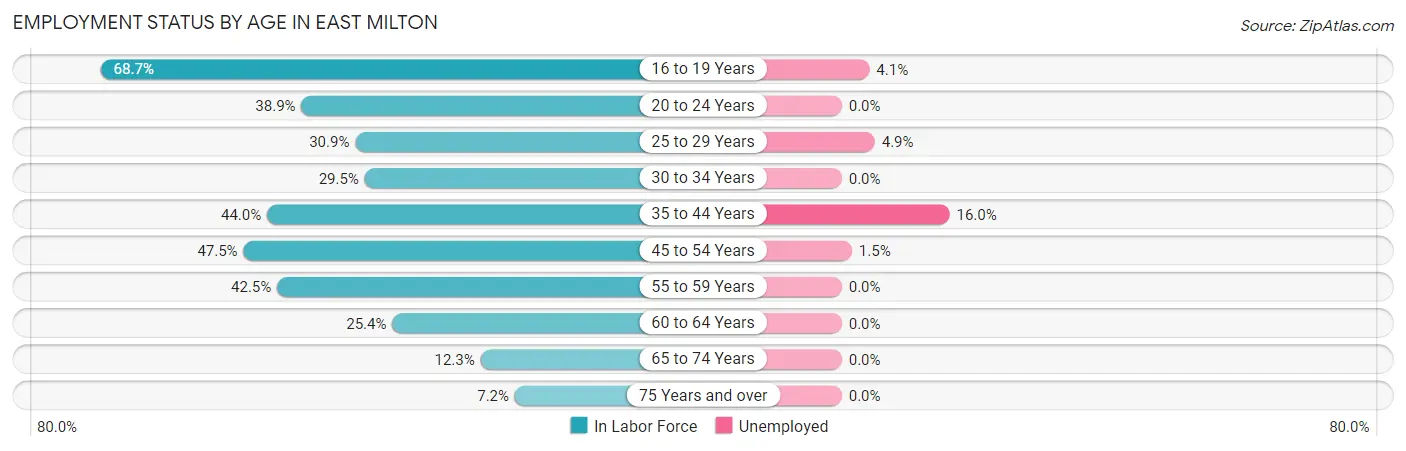
| Age Bracket | In Labor Force | Unemployed |
| 16 to 19 Years | 270 (68.7%) | 11 (4.1%) |
| 20 to 24 Years | 254 (38.9%) | 0 (0.0%) |
| 25 to 29 Years | 408 (30.9%) | 20 (4.9%) |
| 30 to 34 Years | 489 (29.5%) | 0 (0.0%) |
| 35 to 44 Years | 1,070 (44.0%) | 171 (16.0%) |
| 45 to 54 Years | 1,098 (47.5%) | 16 (1.5%) |
| 55 to 59 Years | 349 (42.5%) | 0 (0.0%) |
| 60 to 64 Years | 276 (25.4%) | 0 (0.0%) |
| 65 to 74 Years | 175 (12.3%) | 0 (0.0%) |
| 75 Years and over | 24 (7.2%) | 0 (0.0%) |
| Total | 4,413 (35.5%) | 221 (5.0%) |
Employment Status by Educational Attainment in East Milton
According to labor force statistics for East Milton, 38.3% of individuals (3,688) out of the total population between 25 and 64 years of age (9,630) are in the labor force, with 5.6% or 207 of them being unemployed. The group with the highest labor force participation rate are those with the educational attainment of bachelor's degree or higher, with 70.6% or 758 individuals in the labor force. Within the labor force, individuals with college / associate degree education have the highest percentage of unemployment, with 12.2% or 143 of them being unemployed.
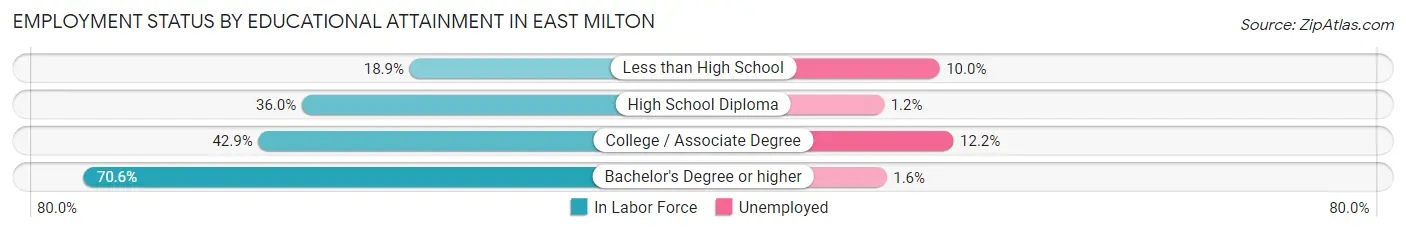
| Educational Attainment | In Labor Force | Unemployed |
| Less than High School | 372 (18.9%) | 197 (10.0%) |
| High School Diploma | 1,389 (36.0%) | 46 (1.2%) |
| College / Associate Degree | 1,172 (42.9%) | 333 (12.2%) |
| Bachelor's Degree or higher | 758 (70.6%) | 17 (1.6%) |
| Total | 3,688 (38.3%) | 539 (5.6%) |
Employment Occupations by Sex in East Milton
Management, Business, Science and Arts Occupations
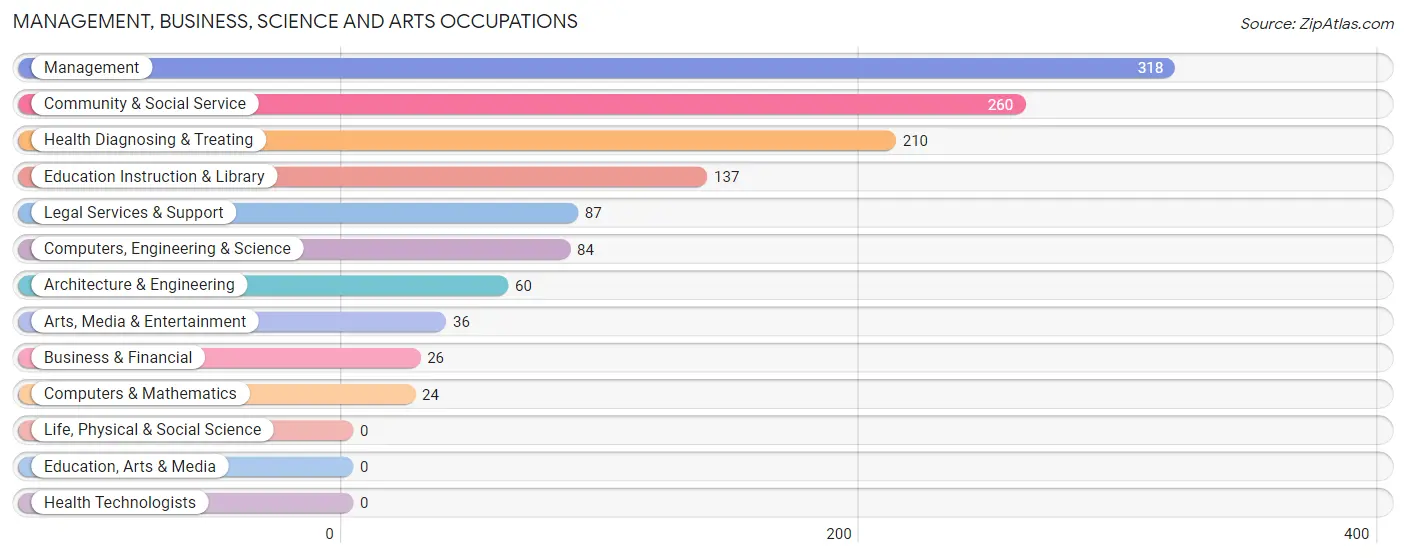
The most common Management, Business, Science and Arts occupations in East Milton are Management (318 | 7.7%), Community & Social Service (260 | 6.3%), Health Diagnosing & Treating (210 | 5.1%), Education Instruction & Library (137 | 3.3%), and Legal Services & Support (87 | 2.1%).
Management, Business, Science and Arts Occupations by Sex
Within the Management, Business, Science and Arts occupations in East Milton, the most male-oriented occupations are Computers & Mathematics (100.0%), Arts, Media & Entertainment (100.0%), and Management (84.9%), while the most female-oriented occupations are Business & Financial (100.0%), Health Diagnosing & Treating (85.2%), and Legal Services & Support (73.6%).
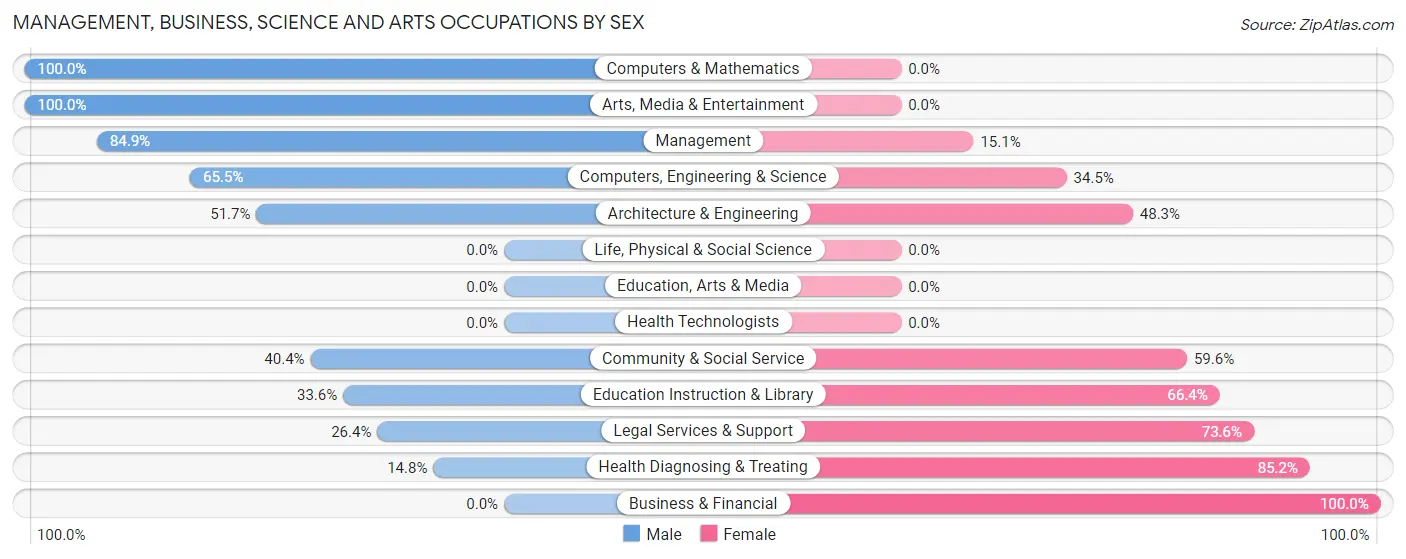
| Occupation | Male | Female |
| Management | 270 (84.9%) | 48 (15.1%) |
| Business & Financial | 0 (0.0%) | 26 (100.0%) |
| Computers, Engineering & Science | 55 (65.5%) | 29 (34.5%) |
| Computers & Mathematics | 24 (100.0%) | 0 (0.0%) |
| Architecture & Engineering | 31 (51.7%) | 29 (48.3%) |
| Life, Physical & Social Science | 0 (0.0%) | 0 (0.0%) |
| Community & Social Service | 105 (40.4%) | 155 (59.6%) |
| Education, Arts & Media | 0 (0.0%) | 0 (0.0%) |
| Legal Services & Support | 23 (26.4%) | 64 (73.6%) |
| Education Instruction & Library | 46 (33.6%) | 91 (66.4%) |
| Arts, Media & Entertainment | 36 (100.0%) | 0 (0.0%) |
| Health Diagnosing & Treating | 31 (14.8%) | 179 (85.2%) |
| Health Technologists | 0 (0.0%) | 0 (0.0%) |
| Total (Category) | 461 (51.3%) | 437 (48.7%) |
| Total (Overall) | 2,329 (56.1%) | 1,822 (43.9%) |
Services Occupations
The most common Services occupations in East Milton are Food Preparation & Serving (483 | 11.6%), Healthcare Support (244 | 5.9%), Cleaning & Maintenance (99 | 2.4%), Security & Protection (84 | 2.0%), and Law Enforcement (78 | 1.9%).
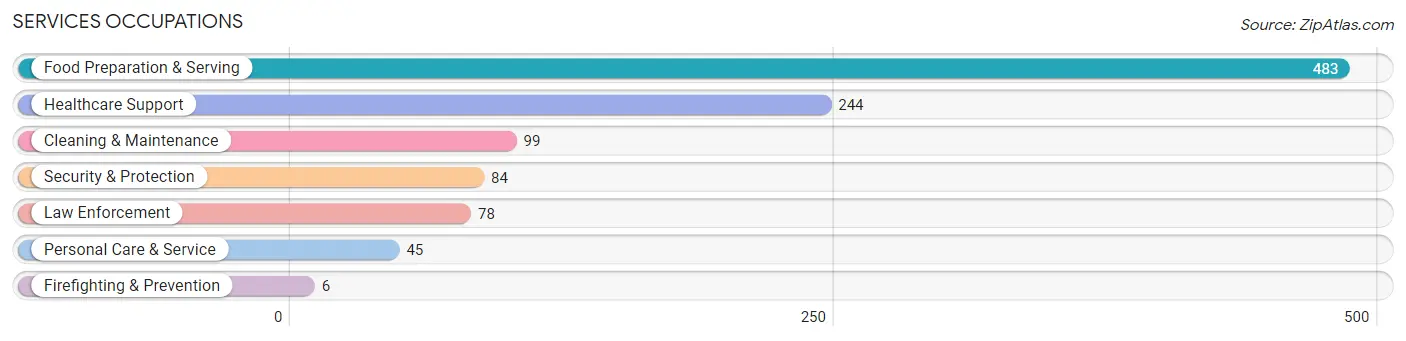
Services Occupations by Sex
Within the Services occupations in East Milton, the most male-oriented occupations are Security & Protection (100.0%), Firefighting & Prevention (100.0%), and Law Enforcement (100.0%), while the most female-oriented occupations are Healthcare Support (100.0%), Food Preparation & Serving (57.4%), and Personal Care & Service (37.8%).
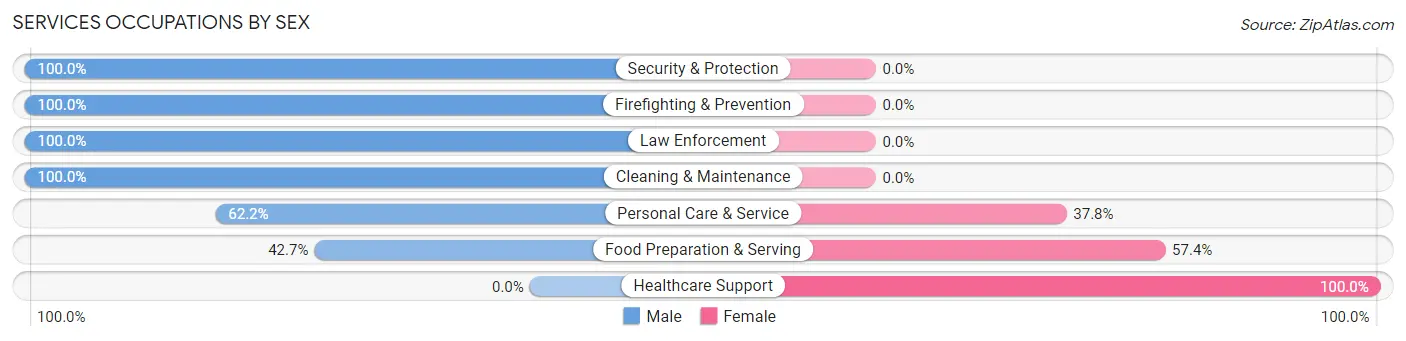
| Occupation | Male | Female |
| Healthcare Support | 0 (0.0%) | 244 (100.0%) |
| Security & Protection | 84 (100.0%) | 0 (0.0%) |
| Firefighting & Prevention | 6 (100.0%) | 0 (0.0%) |
| Law Enforcement | 78 (100.0%) | 0 (0.0%) |
| Food Preparation & Serving | 206 (42.6%) | 277 (57.4%) |
| Cleaning & Maintenance | 99 (100.0%) | 0 (0.0%) |
| Personal Care & Service | 28 (62.2%) | 17 (37.8%) |
| Total (Category) | 417 (43.7%) | 538 (56.3%) |
| Total (Overall) | 2,329 (56.1%) | 1,822 (43.9%) |
Sales and Office Occupations
The most common Sales and Office occupations in East Milton are Office & Administration (566 | 13.6%), and Sales & Related (383 | 9.2%).
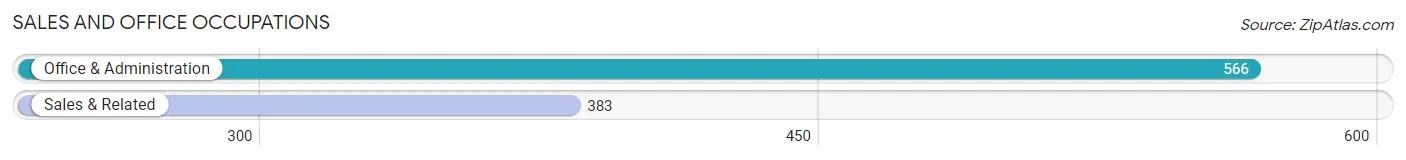
Sales and Office Occupations by Sex
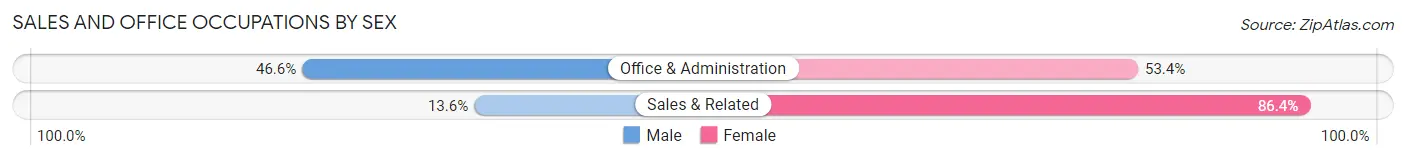
| Occupation | Male | Female |
| Sales & Related | 52 (13.6%) | 331 (86.4%) |
| Office & Administration | 264 (46.6%) | 302 (53.4%) |
| Total (Category) | 316 (33.3%) | 633 (66.7%) |
| Total (Overall) | 2,329 (56.1%) | 1,822 (43.9%) |
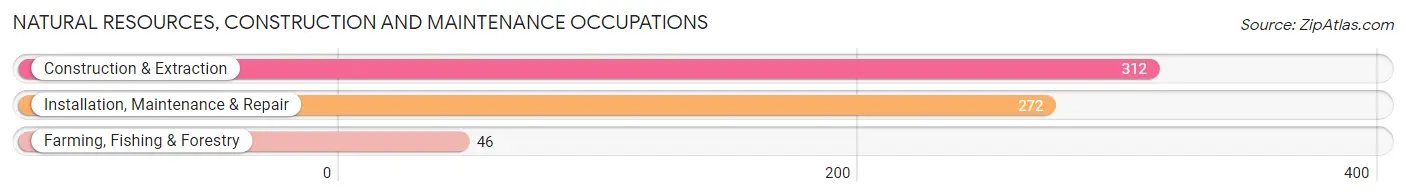
Natural Resources, Construction and Maintenance Occupations
The most common Natural Resources, Construction and Maintenance occupations in East Milton are Construction & Extraction (312 | 7.5%), Installation, Maintenance & Repair (272 | 6.6%), and Farming, Fishing & Forestry (46 | 1.1%).
Natural Resources, Construction and Maintenance Occupations by Sex
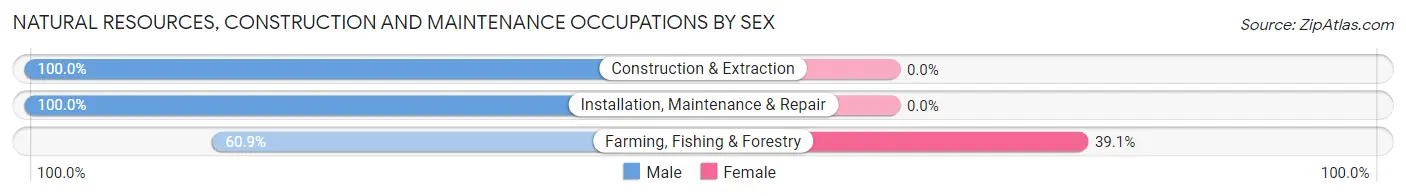
| Occupation | Male | Female |
| Farming, Fishing & Forestry | 28 (60.9%) | 18 (39.1%) |
| Construction & Extraction | 312 (100.0%) | 0 (0.0%) |
| Installation, Maintenance & Repair | 272 (100.0%) | 0 (0.0%) |
| Total (Category) | 612 (97.1%) | 18 (2.9%) |
| Total (Overall) | 2,329 (56.1%) | 1,822 (43.9%) |
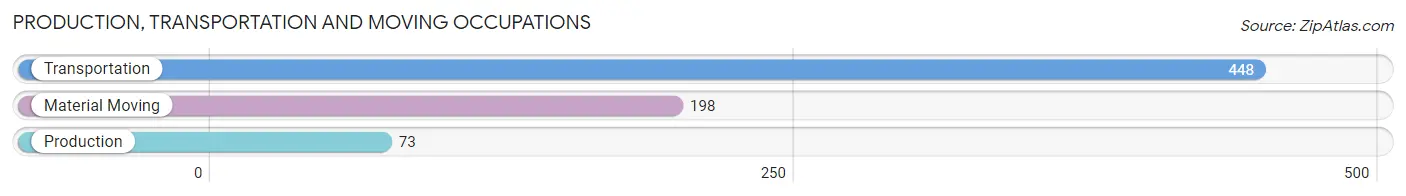
Production, Transportation and Moving Occupations
The most common Production, Transportation and Moving occupations in East Milton are Transportation (448 | 10.8%), Material Moving (198 | 4.8%), and Production (73 | 1.8%).
Production, Transportation and Moving Occupations by Sex
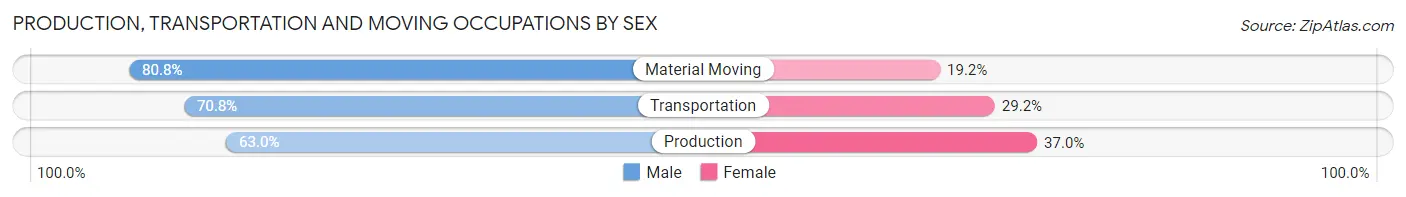
| Occupation | Male | Female |
| Production | 46 (63.0%) | 27 (37.0%) |
| Transportation | 317 (70.8%) | 131 (29.2%) |
| Material Moving | 160 (80.8%) | 38 (19.2%) |
| Total (Category) | 523 (72.7%) | 196 (27.3%) |
| Total (Overall) | 2,329 (56.1%) | 1,822 (43.9%) |
Employment Industries by Sex in East Milton
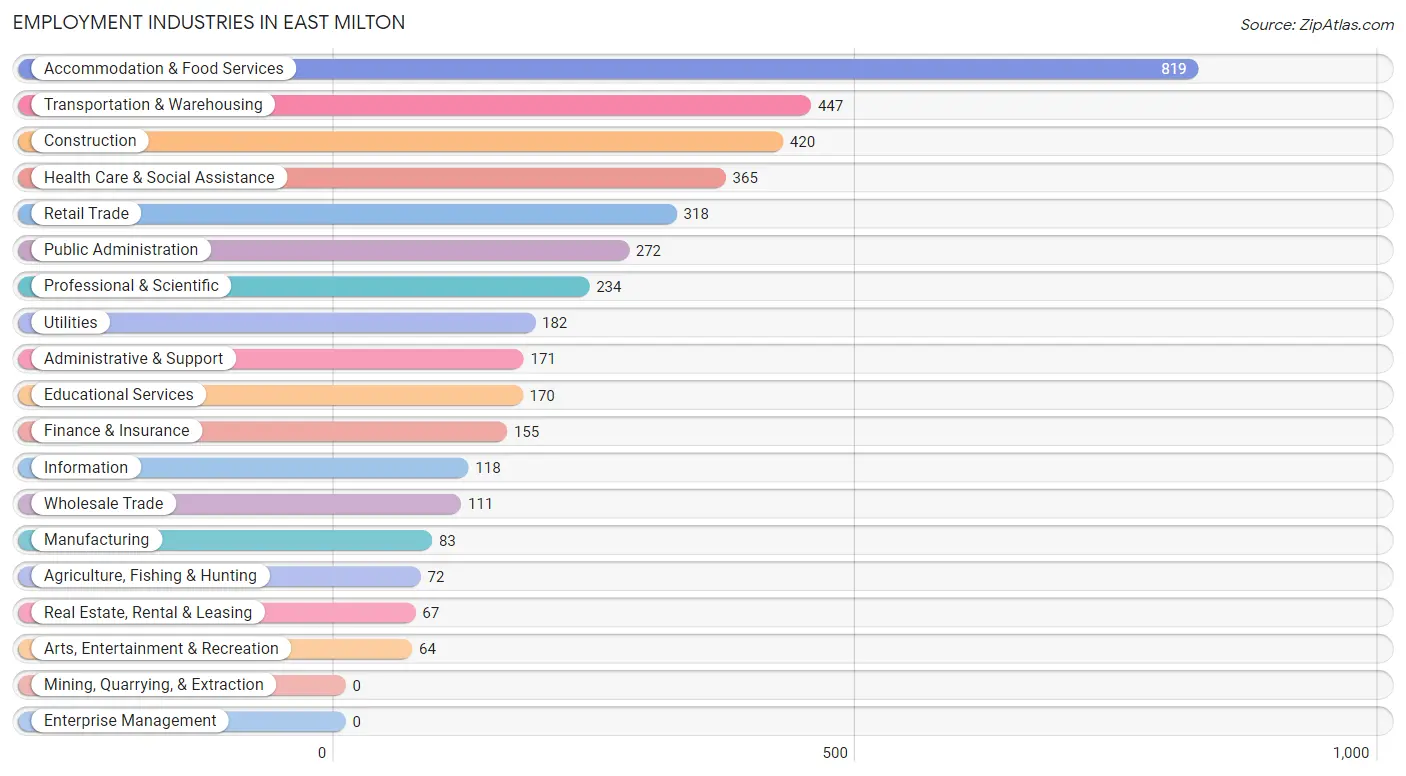
Employment Industries in East Milton
The major employment industries in East Milton include Accommodation & Food Services (819 | 19.7%), Transportation & Warehousing (447 | 10.8%), Construction (420 | 10.1%), Health Care & Social Assistance (365 | 8.8%), and Retail Trade (318 | 7.7%).
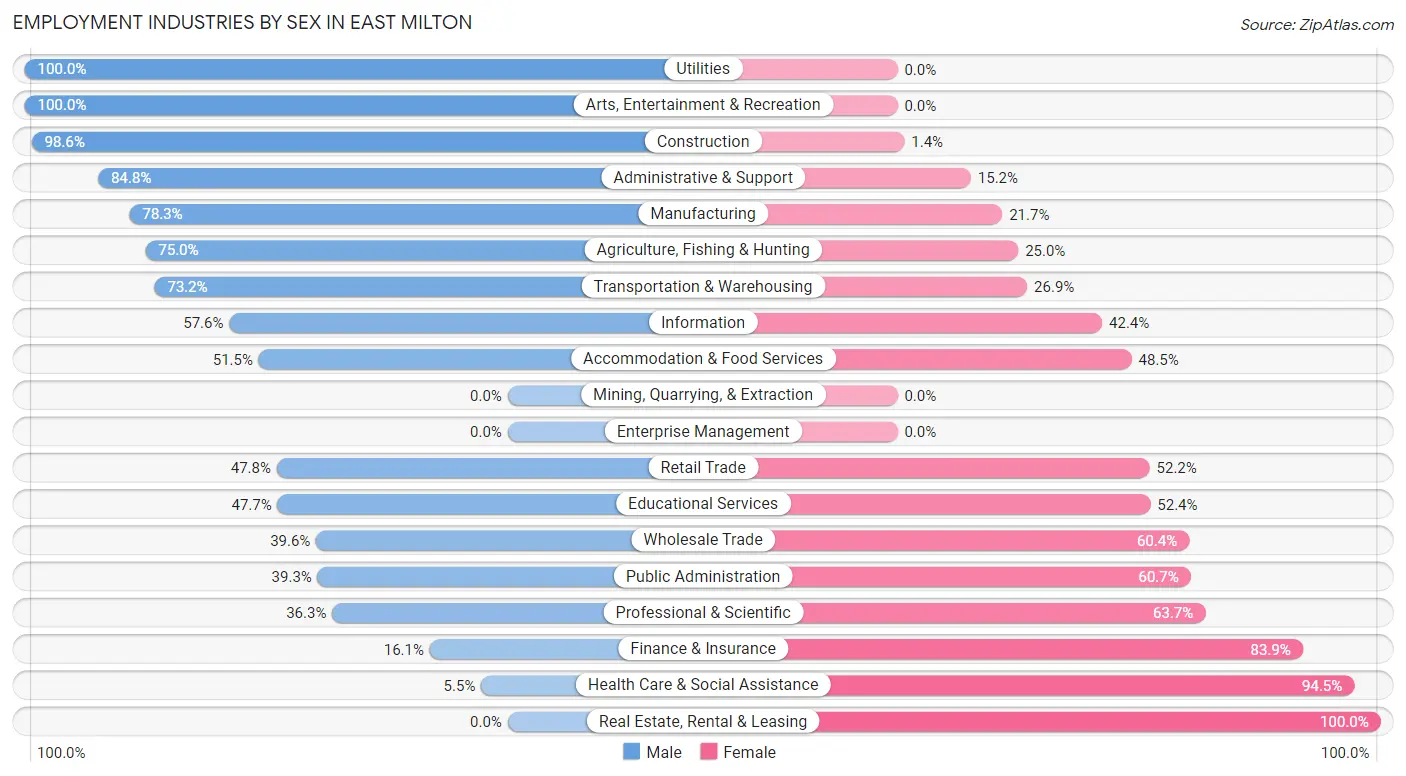
Employment Industries by Sex in East Milton
The East Milton industries that see more men than women are Utilities (100.0%), Arts, Entertainment & Recreation (100.0%), and Construction (98.6%), whereas the industries that tend to have a higher number of women are Real Estate, Rental & Leasing (100.0%), Health Care & Social Assistance (94.5%), and Finance & Insurance (83.9%).
| Industry | Male | Female |
| Agriculture, Fishing & Hunting | 54 (75.0%) | 18 (25.0%) |
| Mining, Quarrying, & Extraction | 0 (0.0%) | 0 (0.0%) |
| Construction | 414 (98.6%) | 6 (1.4%) |
| Manufacturing | 65 (78.3%) | 18 (21.7%) |
| Wholesale Trade | 44 (39.6%) | 67 (60.4%) |
| Retail Trade | 152 (47.8%) | 166 (52.2%) |
| Transportation & Warehousing | 327 (73.2%) | 120 (26.9%) |
| Utilities | 182 (100.0%) | 0 (0.0%) |
| Information | 68 (57.6%) | 50 (42.4%) |
| Finance & Insurance | 25 (16.1%) | 130 (83.9%) |
| Real Estate, Rental & Leasing | 0 (0.0%) | 67 (100.0%) |
| Professional & Scientific | 85 (36.3%) | 149 (63.7%) |
| Enterprise Management | 0 (0.0%) | 0 (0.0%) |
| Administrative & Support | 145 (84.8%) | 26 (15.2%) |
| Educational Services | 81 (47.6%) | 89 (52.3%) |
| Health Care & Social Assistance | 20 (5.5%) | 345 (94.5%) |
| Arts, Entertainment & Recreation | 64 (100.0%) | 0 (0.0%) |
| Accommodation & Food Services | 422 (51.5%) | 397 (48.5%) |
| Public Administration | 107 (39.3%) | 165 (60.7%) |
| Total | 2,329 (56.1%) | 1,822 (43.9%) |
Education in East Milton
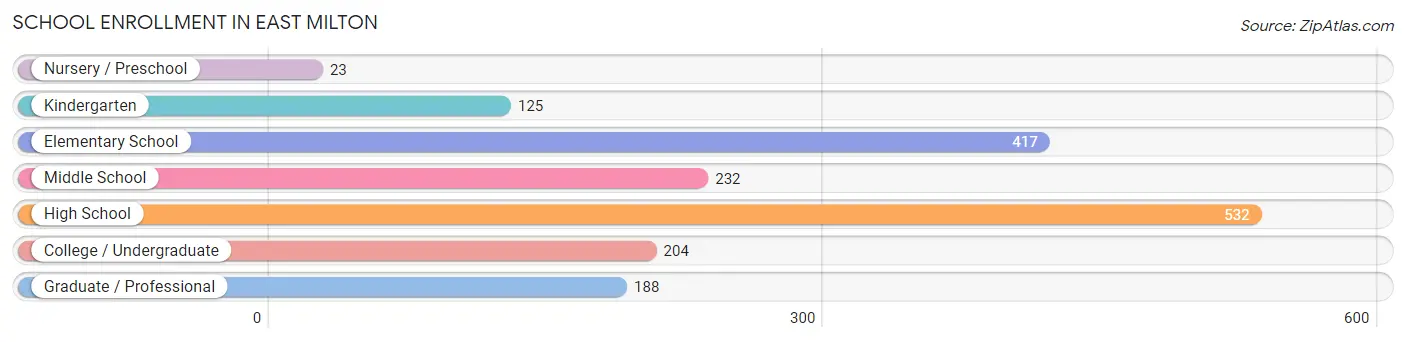
School Enrollment in East Milton
The most common levels of schooling among the 1,721 students in East Milton are high school (532 | 30.9%), elementary school (417 | 24.2%), and middle school (232 | 13.5%).
| School Level | # Students | % Students |
| Nursery / Preschool | 23 | 1.3% |
| Kindergarten | 125 | 7.3% |
| Elementary School | 417 | 24.2% |
| Middle School | 232 | 13.5% |
| High School | 532 | 30.9% |
| College / Undergraduate | 204 | 11.8% |
| Graduate / Professional | 188 | 10.9% |
| Total | 1,721 | 100.0% |
School Enrollment by Age by Funding Source in East Milton
Out of a total of 1,721 students who are enrolled in schools in East Milton, 324 (18.8%) attend a private institution, while the remaining 1,397 (81.2%) are enrolled in public schools. The age group of 3 to 4 year olds has the highest likelihood of being enrolled in private schools, with 10 (100.0% in the age bracket) enrolled. Conversely, the age group of 18 to 19 year olds has the lowest likelihood of being enrolled in a private school, with 40 (100.0% in the age bracket) attending a public institution.
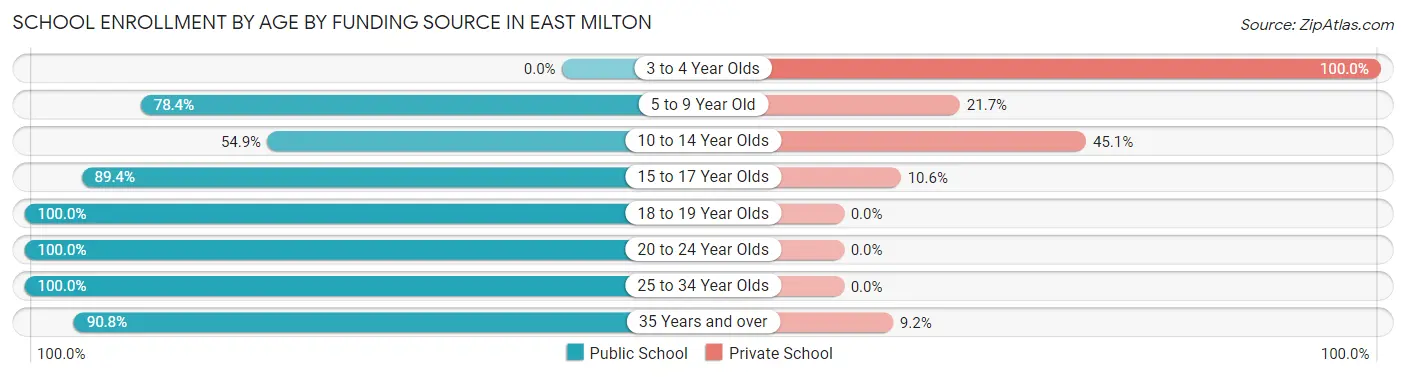
| Age Bracket | Public School | Private School |
| 3 to 4 Year Olds | 0 (0.0%) | 10 (100.0%) |
| 5 to 9 Year Old | 322 (78.3%) | 89 (21.6%) |
| 10 to 14 Year Olds | 220 (54.9%) | 181 (45.1%) |
| 15 to 17 Year Olds | 269 (89.4%) | 32 (10.6%) |
| 18 to 19 Year Olds | 40 (100.0%) | 0 (0.0%) |
| 20 to 24 Year Olds | 86 (100.0%) | 0 (0.0%) |
| 25 to 34 Year Olds | 352 (100.0%) | 0 (0.0%) |
| 35 Years and over | 109 (90.8%) | 11 (9.2%) |
| Total | 1,397 (81.2%) | 324 (18.8%) |
Educational Attainment by Field of Study in East Milton
Business (545 | 36.1%), education (179 | 11.9%), communications (171 | 11.3%), social sciences (163 | 10.8%), and science & technology (103 | 6.8%) are the most common fields of study among 1,508 individuals in East Milton who have obtained a bachelor's degree or higher.
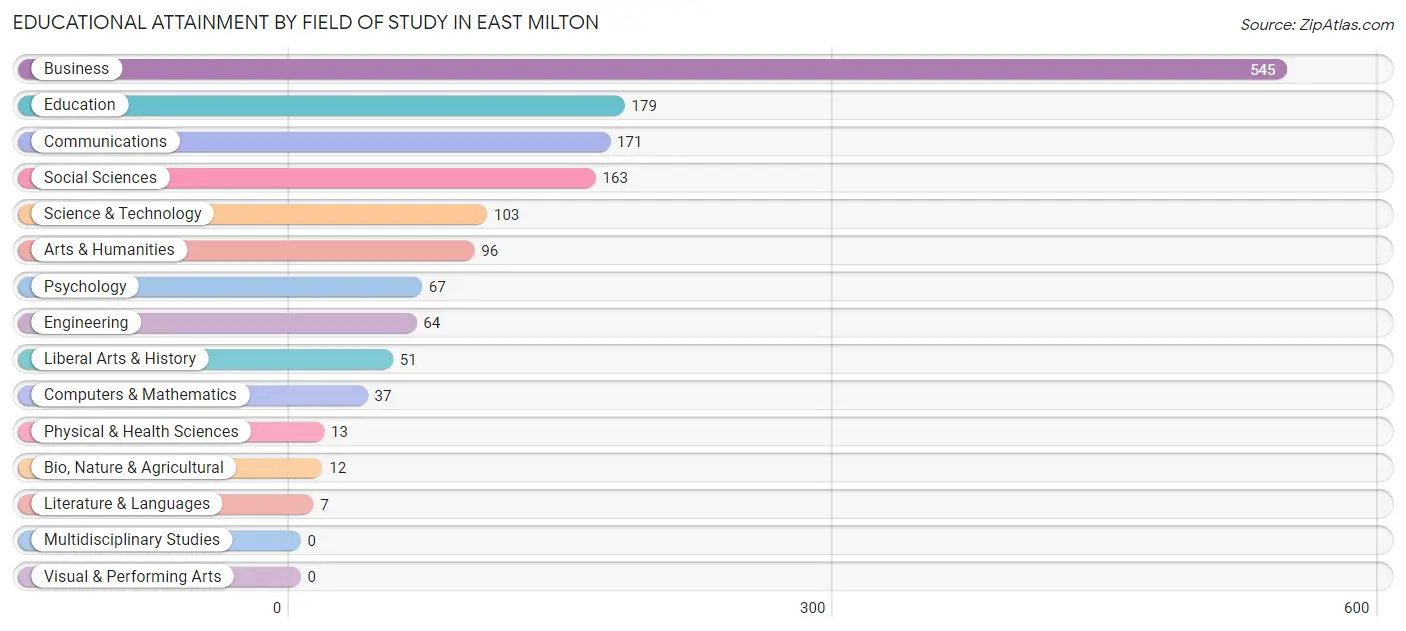
| Field of Study | # Graduates | % Graduates |
| Computers & Mathematics | 37 | 2.5% |
| Bio, Nature & Agricultural | 12 | 0.8% |
| Physical & Health Sciences | 13 | 0.9% |
| Psychology | 67 | 4.4% |
| Social Sciences | 163 | 10.8% |
| Engineering | 64 | 4.2% |
| Multidisciplinary Studies | 0 | 0.0% |
| Science & Technology | 103 | 6.8% |
| Business | 545 | 36.1% |
| Education | 179 | 11.9% |
| Literature & Languages | 7 | 0.5% |
| Liberal Arts & History | 51 | 3.4% |
| Visual & Performing Arts | 0 | 0.0% |
| Communications | 171 | 11.3% |
| Arts & Humanities | 96 | 6.4% |
| Total | 1,508 | 100.0% |
Transportation & Commute in East Milton
Vehicle Availability by Sex in East Milton
The most prevalent vehicle ownership categories in East Milton are males with 3 vehicles (1,018, accounting for 44.7%) and females with 3 vehicles (489, making up 57.0%).
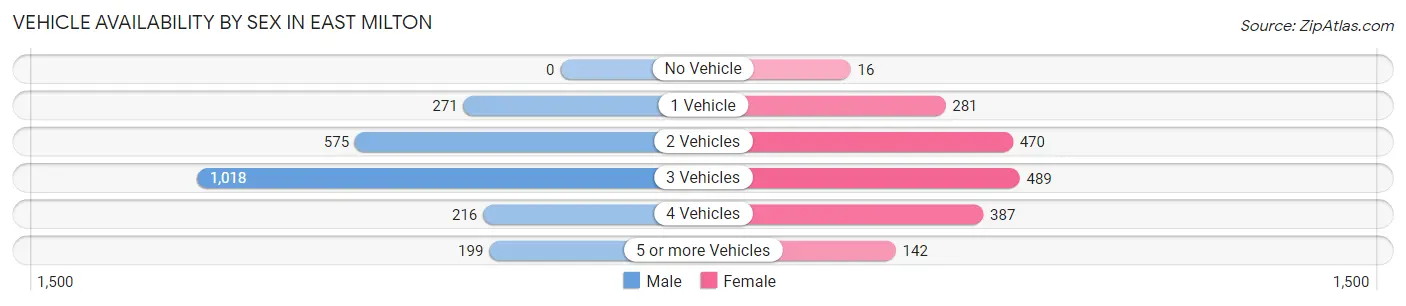
| Vehicles Available | Male | Female |
| No Vehicle | 0 (0.0%) | 16 (0.9%) |
| 1 Vehicle | 271 (11.9%) | 281 (15.7%) |
| 2 Vehicles | 575 (25.2%) | 470 (26.3%) |
| 3 Vehicles | 1,018 (44.7%) | 489 (27.4%) |
| 4 Vehicles | 216 (9.5%) | 387 (21.7%) |
| 5 or more Vehicles | 199 (8.7%) | 142 (8.0%) |
| Total | 2,279 (100.0%) | 1,785 (100.0%) |
Commute Time in East Milton
The most frequently occuring commute durations in East Milton are 30 to 34 minutes (700 commuters, 18.2%), 20 to 24 minutes (554 commuters, 14.4%), and 45 to 59 minutes (497 commuters, 12.9%).
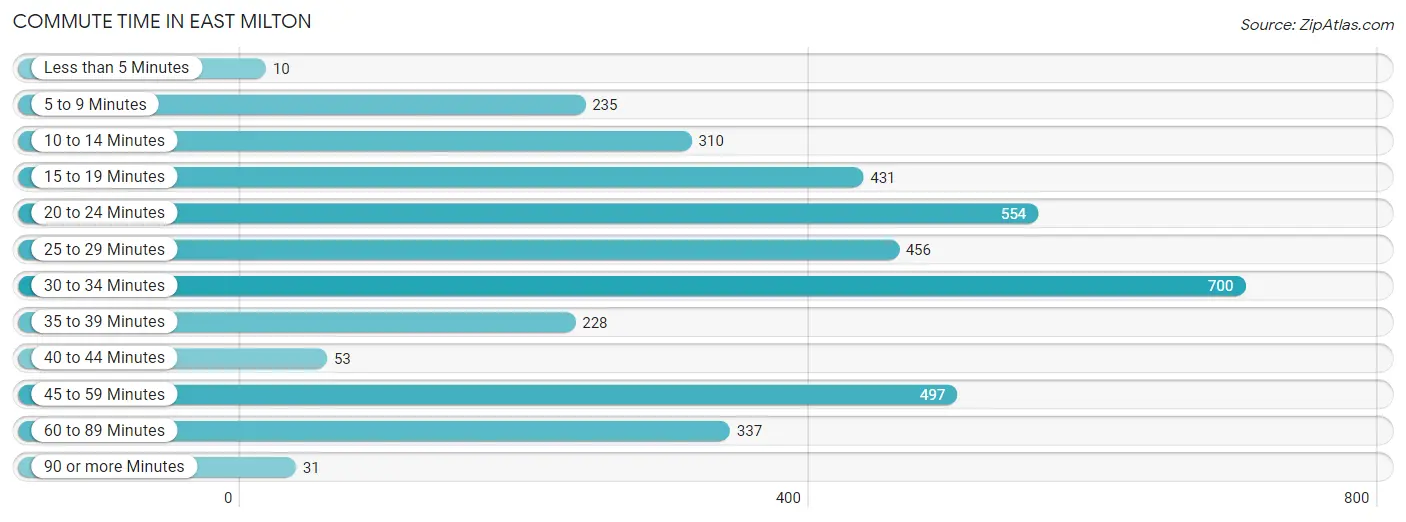
| Commute Time | # Commuters | % Commuters |
| Less than 5 Minutes | 10 | 0.3% |
| 5 to 9 Minutes | 235 | 6.1% |
| 10 to 14 Minutes | 310 | 8.1% |
| 15 to 19 Minutes | 431 | 11.2% |
| 20 to 24 Minutes | 554 | 14.4% |
| 25 to 29 Minutes | 456 | 11.9% |
| 30 to 34 Minutes | 700 | 18.2% |
| 35 to 39 Minutes | 228 | 5.9% |
| 40 to 44 Minutes | 53 | 1.4% |
| 45 to 59 Minutes | 497 | 12.9% |
| 60 to 89 Minutes | 337 | 8.8% |
| 90 or more Minutes | 31 | 0.8% |
Commute Time by Sex in East Milton
The most common commute times in East Milton are 20 to 24 minutes (392 commuters, 18.2%) for males and 30 to 34 minutes (414 commuters, 24.4%) for females.
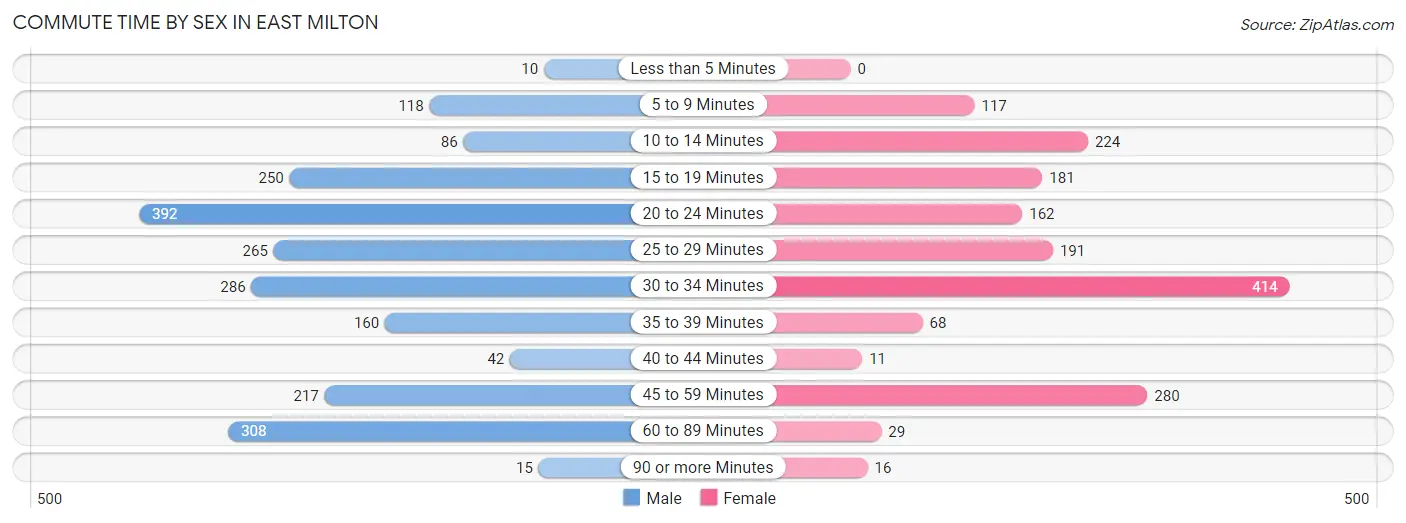
| Commute Time | Male | Female |
| Less than 5 Minutes | 10 (0.5%) | 0 (0.0%) |
| 5 to 9 Minutes | 118 (5.5%) | 117 (6.9%) |
| 10 to 14 Minutes | 86 (4.0%) | 224 (13.2%) |
| 15 to 19 Minutes | 250 (11.6%) | 181 (10.7%) |
| 20 to 24 Minutes | 392 (18.2%) | 162 (9.6%) |
| 25 to 29 Minutes | 265 (12.3%) | 191 (11.3%) |
| 30 to 34 Minutes | 286 (13.3%) | 414 (24.4%) |
| 35 to 39 Minutes | 160 (7.4%) | 68 (4.0%) |
| 40 to 44 Minutes | 42 (1.9%) | 11 (0.6%) |
| 45 to 59 Minutes | 217 (10.1%) | 280 (16.5%) |
| 60 to 89 Minutes | 308 (14.3%) | 29 (1.7%) |
| 90 or more Minutes | 15 (0.7%) | 16 (0.9%) |
Time of Departure to Work by Sex in East Milton
The most frequent times of departure to work in East Milton are 6:00 AM to 6:29 AM (437, 20.3%) for males and 7:30 AM to 7:59 AM (238, 14.1%) for females.
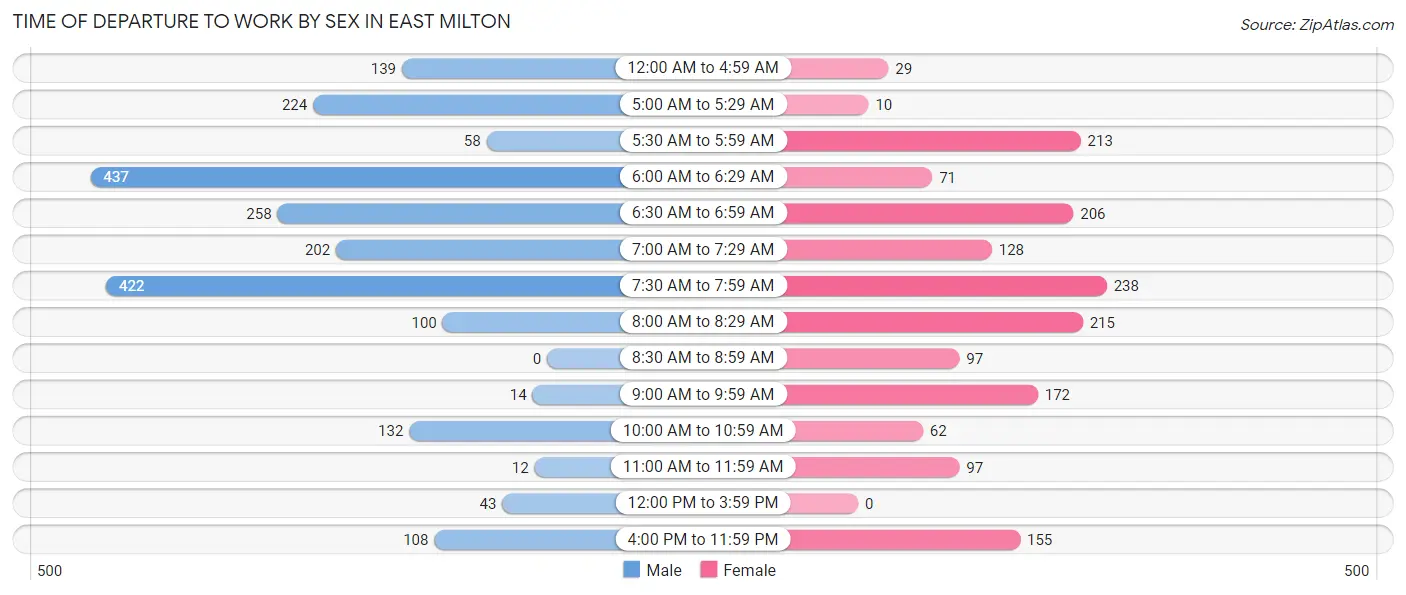
| Time of Departure | Male | Female |
| 12:00 AM to 4:59 AM | 139 (6.5%) | 29 (1.7%) |
| 5:00 AM to 5:29 AM | 224 (10.4%) | 10 (0.6%) |
| 5:30 AM to 5:59 AM | 58 (2.7%) | 213 (12.6%) |
| 6:00 AM to 6:29 AM | 437 (20.3%) | 71 (4.2%) |
| 6:30 AM to 6:59 AM | 258 (12.0%) | 206 (12.2%) |
| 7:00 AM to 7:29 AM | 202 (9.4%) | 128 (7.6%) |
| 7:30 AM to 7:59 AM | 422 (19.6%) | 238 (14.1%) |
| 8:00 AM to 8:29 AM | 100 (4.6%) | 215 (12.7%) |
| 8:30 AM to 8:59 AM | 0 (0.0%) | 97 (5.7%) |
| 9:00 AM to 9:59 AM | 14 (0.6%) | 172 (10.2%) |
| 10:00 AM to 10:59 AM | 132 (6.1%) | 62 (3.7%) |
| 11:00 AM to 11:59 AM | 12 (0.6%) | 97 (5.7%) |
| 12:00 PM to 3:59 PM | 43 (2.0%) | 0 (0.0%) |
| 4:00 PM to 11:59 PM | 108 (5.0%) | 155 (9.2%) |
| Total | 2,149 (100.0%) | 1,693 (100.0%) |
Housing Occupancy in East Milton
Occupancy by Ownership in East Milton
Of the total 3,368 dwellings in East Milton, owner-occupied units account for 2,580 (76.6%), while renter-occupied units make up 788 (23.4%).
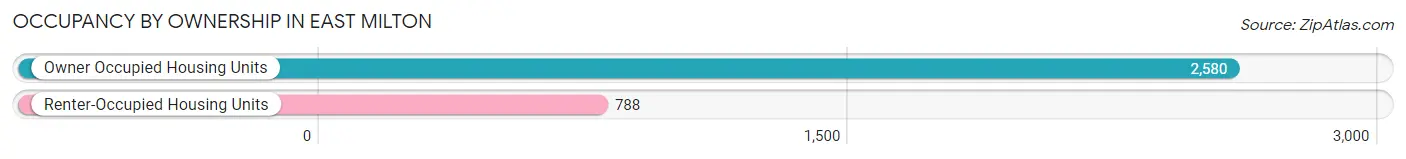
| Occupancy | # Housing Units | % Housing Units |
| Owner Occupied Housing Units | 2,580 | 76.6% |
| Renter-Occupied Housing Units | 788 | 23.4% |
| Total Occupied Housing Units | 3,368 | 100.0% |
Occupancy by Household Size in East Milton
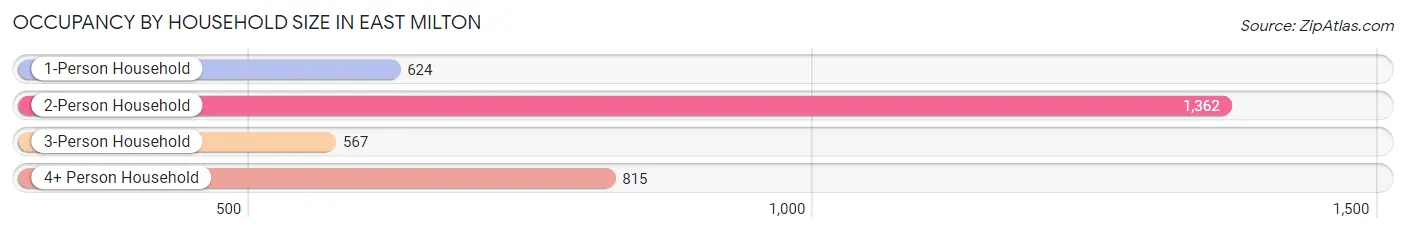
| Household Size | # Housing Units | % Housing Units |
| 1-Person Household | 624 | 18.5% |
| 2-Person Household | 1,362 | 40.4% |
| 3-Person Household | 567 | 16.8% |
| 4+ Person Household | 815 | 24.2% |
| Total Housing Units | 3,368 | 100.0% |
Occupancy by Ownership by Household Size in East Milton
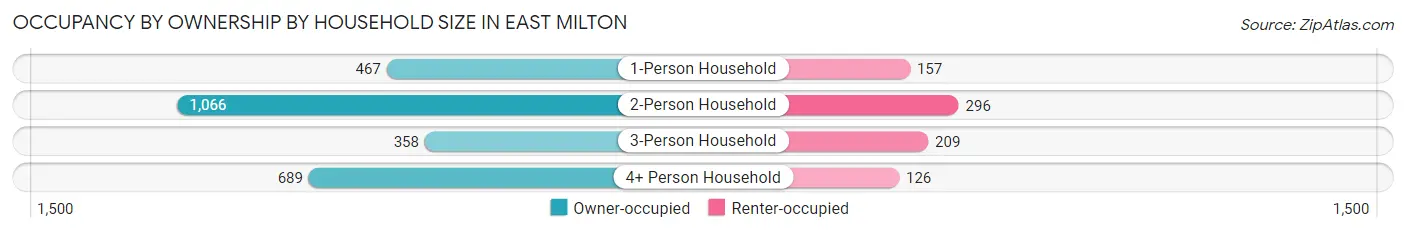
| Household Size | Owner-occupied | Renter-occupied |
| 1-Person Household | 467 (74.8%) | 157 (25.2%) |
| 2-Person Household | 1,066 (78.3%) | 296 (21.7%) |
| 3-Person Household | 358 (63.1%) | 209 (36.9%) |
| 4+ Person Household | 689 (84.5%) | 126 (15.5%) |
| Total Housing Units | 2,580 (76.6%) | 788 (23.4%) |
Occupancy by Educational Attainment in East Milton
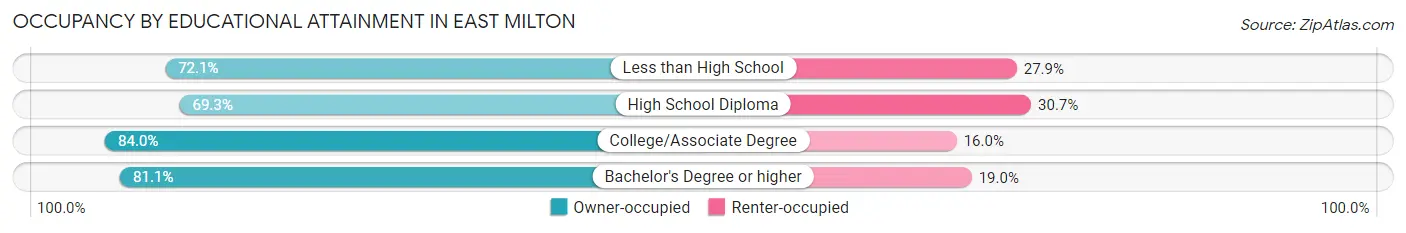
| Household Size | Owner-occupied | Renter-occupied |
| Less than High School | 238 (72.1%) | 92 (27.9%) |
| High School Diploma | 929 (69.3%) | 412 (30.7%) |
| College/Associate Degree | 1,058 (84.0%) | 201 (16.0%) |
| Bachelor's Degree or higher | 355 (81.0%) | 83 (19.0%) |
Occupancy by Age of Householder in East Milton
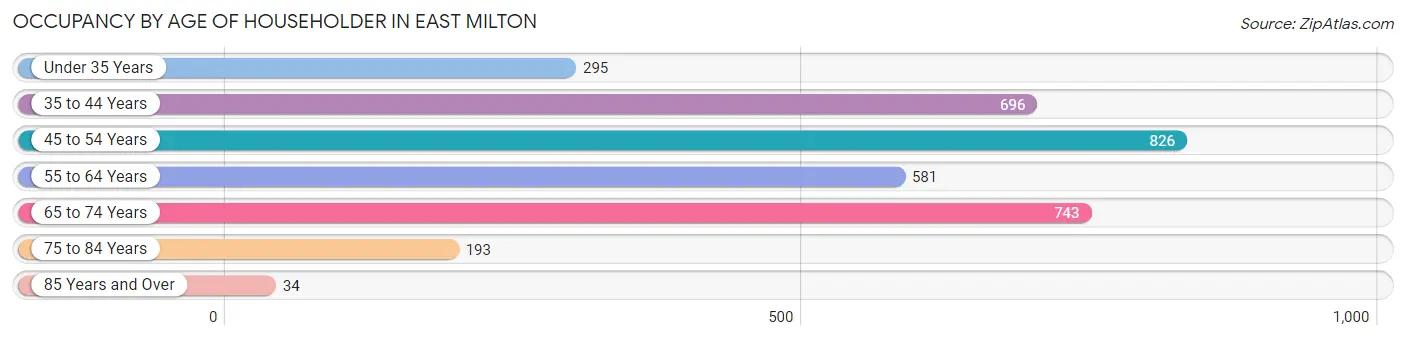
| Age Bracket | # Households | % Households |
| Under 35 Years | 295 | 8.8% |
| 35 to 44 Years | 696 | 20.7% |
| 45 to 54 Years | 826 | 24.5% |
| 55 to 64 Years | 581 | 17.2% |
| 65 to 74 Years | 743 | 22.1% |
| 75 to 84 Years | 193 | 5.7% |
| 85 Years and Over | 34 | 1.0% |
| Total | 3,368 | 100.0% |
Housing Finances in East Milton
Median Income by Occupancy in East Milton
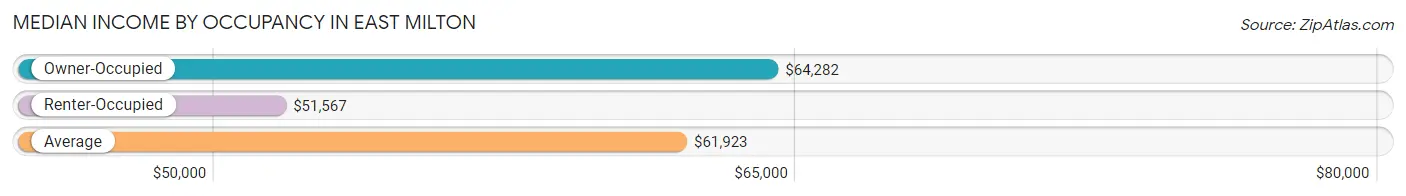
| Occupancy Type | # Households | Median Income |
| Owner-Occupied | 2,580 (76.6%) | $64,282 |
| Renter-Occupied | 788 (23.4%) | $51,567 |
| Average | 3,368 (100.0%) | $61,923 |
Occupancy by Householder Income Bracket in East Milton
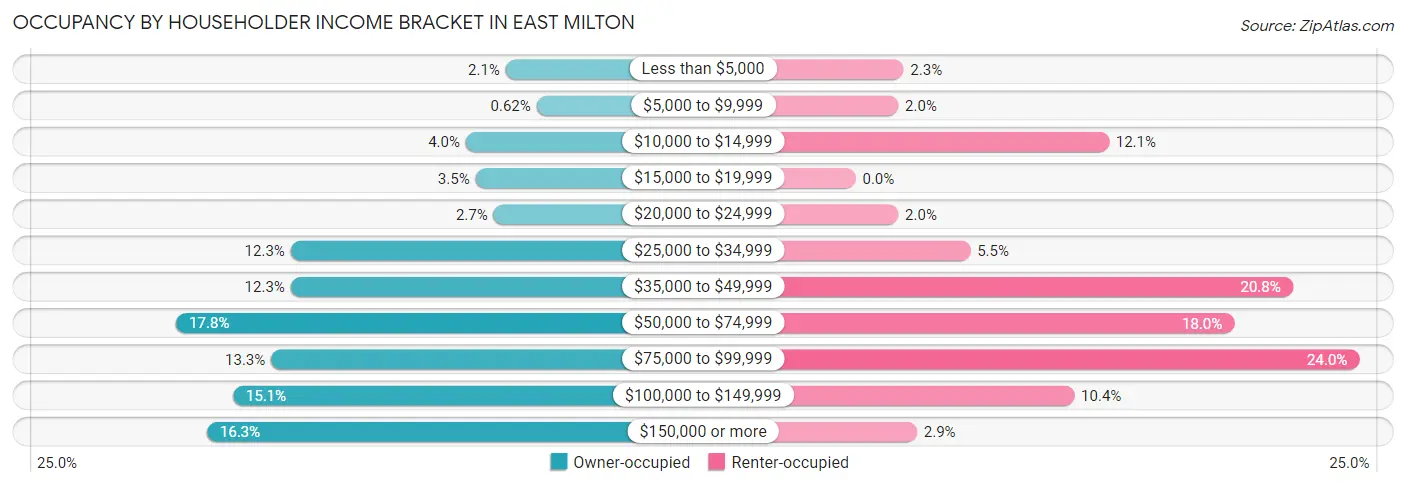
| Income Bracket | Owner-occupied | Renter-occupied |
| Less than $5,000 | 54 (2.1%) | 18 (2.3%) |
| $5,000 to $9,999 | 16 (0.6%) | 16 (2.0%) |
| $10,000 to $14,999 | 103 (4.0%) | 95 (12.1%) |
| $15,000 to $19,999 | 91 (3.5%) | 0 (0.0%) |
| $20,000 to $24,999 | 69 (2.7%) | 16 (2.0%) |
| $25,000 to $34,999 | 318 (12.3%) | 43 (5.5%) |
| $35,000 to $49,999 | 318 (12.3%) | 164 (20.8%) |
| $50,000 to $74,999 | 459 (17.8%) | 142 (18.0%) |
| $75,000 to $99,999 | 342 (13.3%) | 189 (24.0%) |
| $100,000 to $149,999 | 389 (15.1%) | 82 (10.4%) |
| $150,000 or more | 421 (16.3%) | 23 (2.9%) |
| Total | 2,580 (100.0%) | 788 (100.0%) |
Monthly Housing Cost Tiers in East Milton
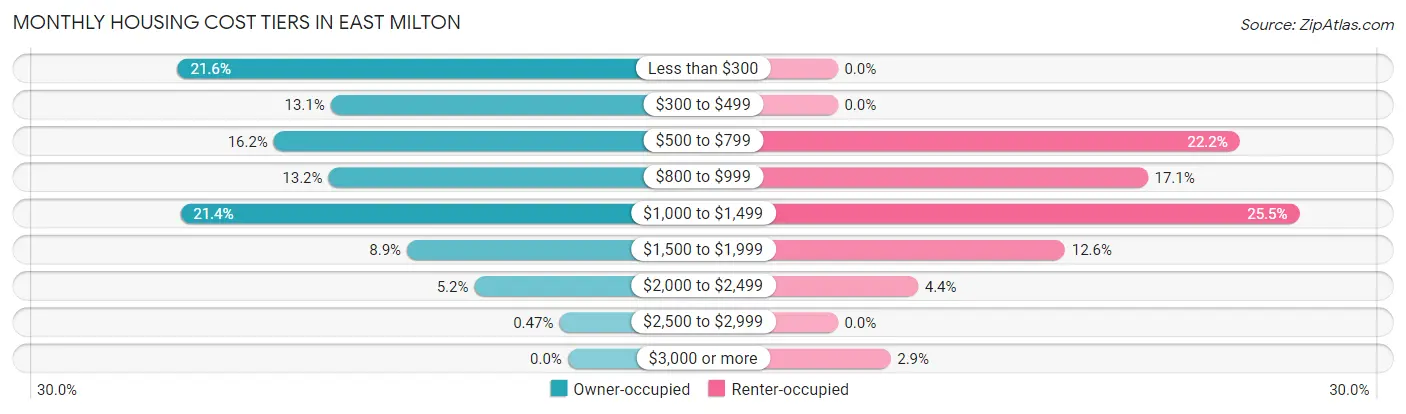
| Monthly Cost | Owner-occupied | Renter-occupied |
| Less than $300 | 556 (21.5%) | 0 (0.0%) |
| $300 to $499 | 338 (13.1%) | 0 (0.0%) |
| $500 to $799 | 419 (16.2%) | 175 (22.2%) |
| $800 to $999 | 341 (13.2%) | 135 (17.1%) |
| $1,000 to $1,499 | 552 (21.4%) | 201 (25.5%) |
| $1,500 to $1,999 | 229 (8.9%) | 99 (12.6%) |
| $2,000 to $2,499 | 133 (5.2%) | 35 (4.4%) |
| $2,500 to $2,999 | 12 (0.5%) | 0 (0.0%) |
| $3,000 or more | 0 (0.0%) | 23 (2.9%) |
| Total | 2,580 (100.0%) | 788 (100.0%) |
Physical Housing Characteristics in East Milton
Housing Structures in East Milton
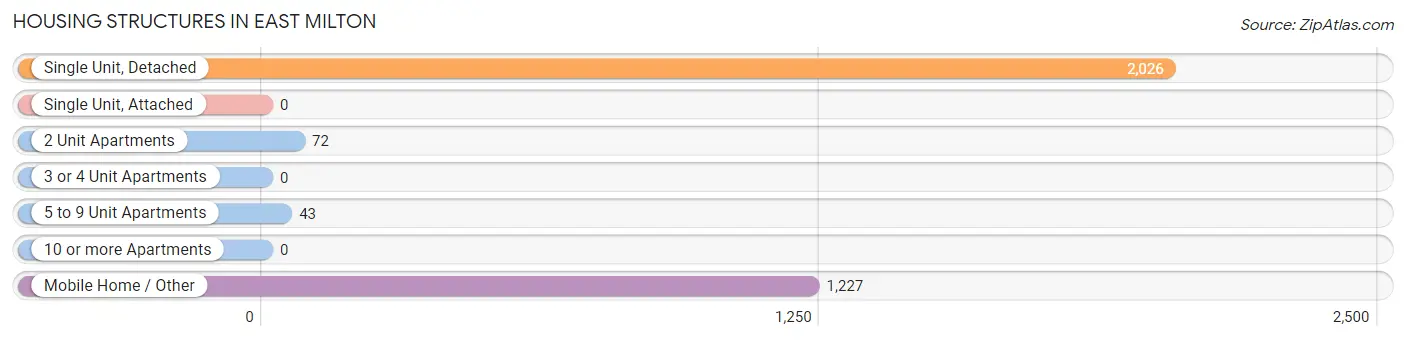
| Structure Type | # Housing Units | % Housing Units |
| Single Unit, Detached | 2,026 | 60.2% |
| Single Unit, Attached | 0 | 0.0% |
| 2 Unit Apartments | 72 | 2.1% |
| 3 or 4 Unit Apartments | 0 | 0.0% |
| 5 to 9 Unit Apartments | 43 | 1.3% |
| 10 or more Apartments | 0 | 0.0% |
| Mobile Home / Other | 1,227 | 36.4% |
| Total | 3,368 | 100.0% |
Housing Structures by Occupancy in East Milton
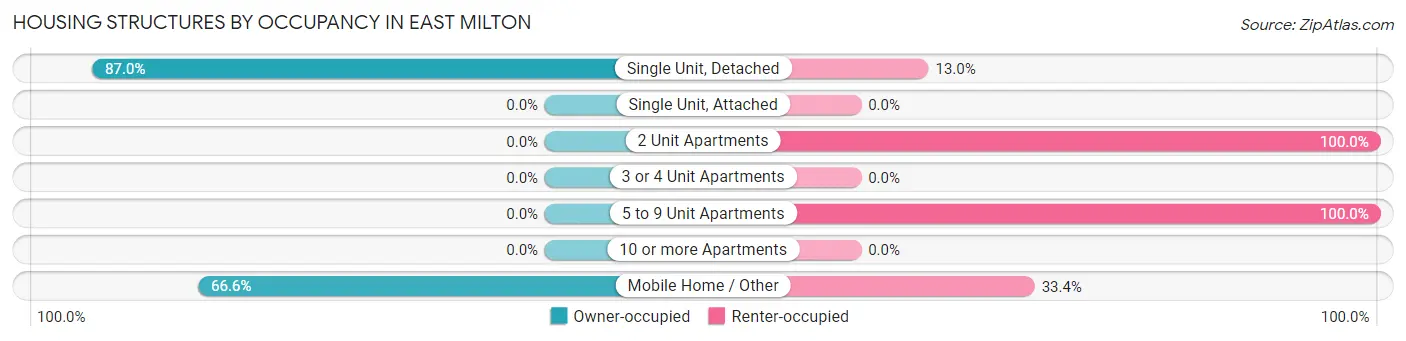
| Structure Type | Owner-occupied | Renter-occupied |
| Single Unit, Detached | 1,763 (87.0%) | 263 (13.0%) |
| Single Unit, Attached | 0 (0.0%) | 0 (0.0%) |
| 2 Unit Apartments | 0 (0.0%) | 72 (100.0%) |
| 3 or 4 Unit Apartments | 0 (0.0%) | 0 (0.0%) |
| 5 to 9 Unit Apartments | 0 (0.0%) | 43 (100.0%) |
| 10 or more Apartments | 0 (0.0%) | 0 (0.0%) |
| Mobile Home / Other | 817 (66.6%) | 410 (33.4%) |
| Total | 2,580 (76.6%) | 788 (23.4%) |
Housing Structures by Number of Rooms in East Milton
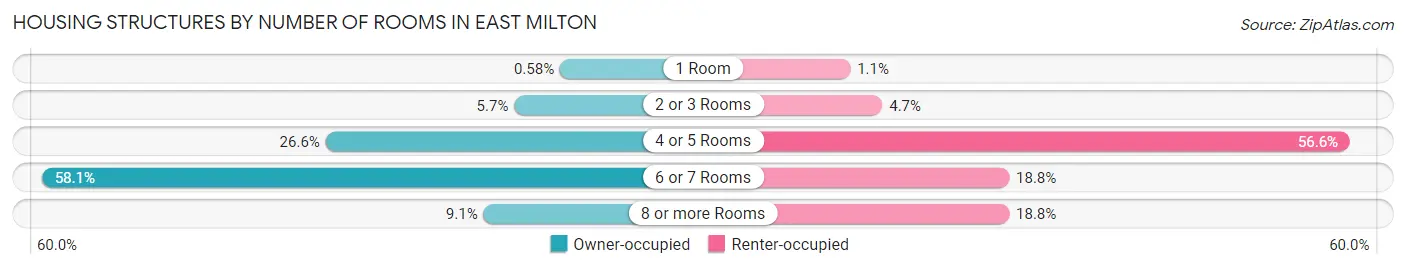
| Number of Rooms | Owner-occupied | Renter-occupied |
| 1 Room | 15 (0.6%) | 9 (1.1%) |
| 2 or 3 Rooms | 146 (5.7%) | 37 (4.7%) |
| 4 or 5 Rooms | 686 (26.6%) | 446 (56.6%) |
| 6 or 7 Rooms | 1,499 (58.1%) | 148 (18.8%) |
| 8 or more Rooms | 234 (9.1%) | 148 (18.8%) |
| Total | 2,580 (100.0%) | 788 (100.0%) |
Housing Structure by Heating Type in East Milton
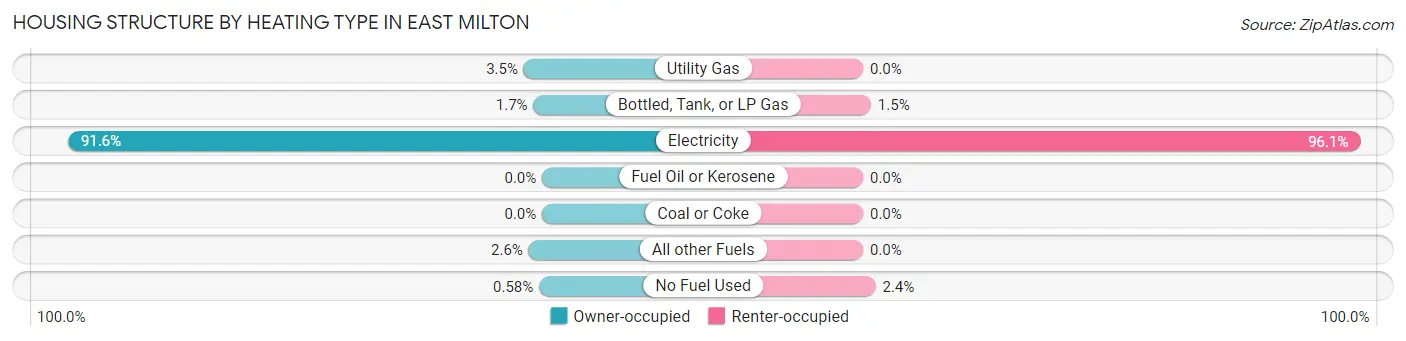
| Heating Type | Owner-occupied | Renter-occupied |
| Utility Gas | 91 (3.5%) | 0 (0.0%) |
| Bottled, Tank, or LP Gas | 43 (1.7%) | 12 (1.5%) |
| Electricity | 2,364 (91.6%) | 757 (96.1%) |
| Fuel Oil or Kerosene | 0 (0.0%) | 0 (0.0%) |
| Coal or Coke | 0 (0.0%) | 0 (0.0%) |
| All other Fuels | 67 (2.6%) | 0 (0.0%) |
| No Fuel Used | 15 (0.6%) | 19 (2.4%) |
| Total | 2,580 (100.0%) | 788 (100.0%) |
Household Vehicle Usage in East Milton
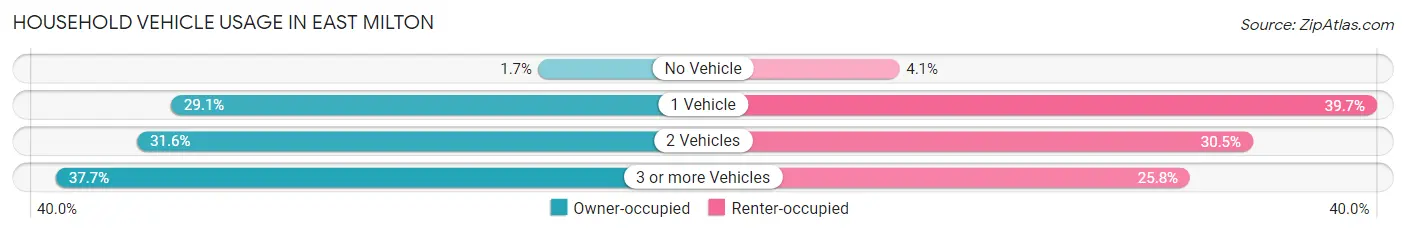
| Vehicles per Household | Owner-occupied | Renter-occupied |
| No Vehicle | 43 (1.7%) | 32 (4.1%) |
| 1 Vehicle | 750 (29.1%) | 313 (39.7%) |
| 2 Vehicles | 815 (31.6%) | 240 (30.5%) |
| 3 or more Vehicles | 972 (37.7%) | 203 (25.8%) |
| Total | 2,580 (100.0%) | 788 (100.0%) |
Real Estate & Mortgages in East Milton
Real Estate and Mortgage Overview in East Milton
| Characteristic | Without Mortgage | With Mortgage |
| Housing Units | 1,198 | 1,382 |
| Median Property Value | $152,000 | $243,000 |
| Median Household Income | $37,375 | $381 |
| Monthly Housing Costs | $328 | $0 |
| Real Estate Taxes | $486 | $46 |
Property Value by Mortgage Status in East Milton
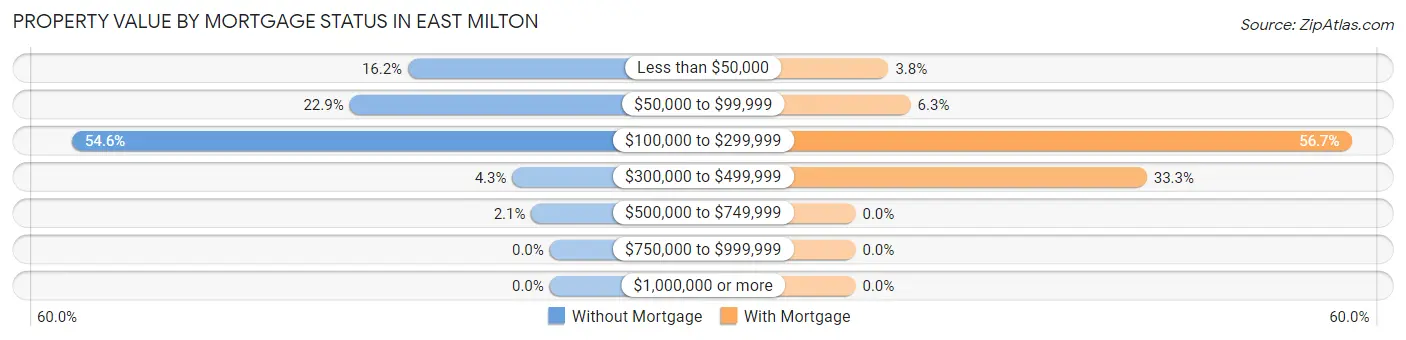
| Property Value | Without Mortgage | With Mortgage |
| Less than $50,000 | 194 (16.2%) | 52 (3.8%) |
| $50,000 to $99,999 | 274 (22.9%) | 87 (6.3%) |
| $100,000 to $299,999 | 654 (54.6%) | 783 (56.7%) |
| $300,000 to $499,999 | 51 (4.3%) | 460 (33.3%) |
| $500,000 to $749,999 | 25 (2.1%) | 0 (0.0%) |
| $750,000 to $999,999 | 0 (0.0%) | 0 (0.0%) |
| $1,000,000 or more | 0 (0.0%) | 0 (0.0%) |
| Total | 1,198 (100.0%) | 1,382 (100.0%) |
Household Income by Mortgage Status in East Milton
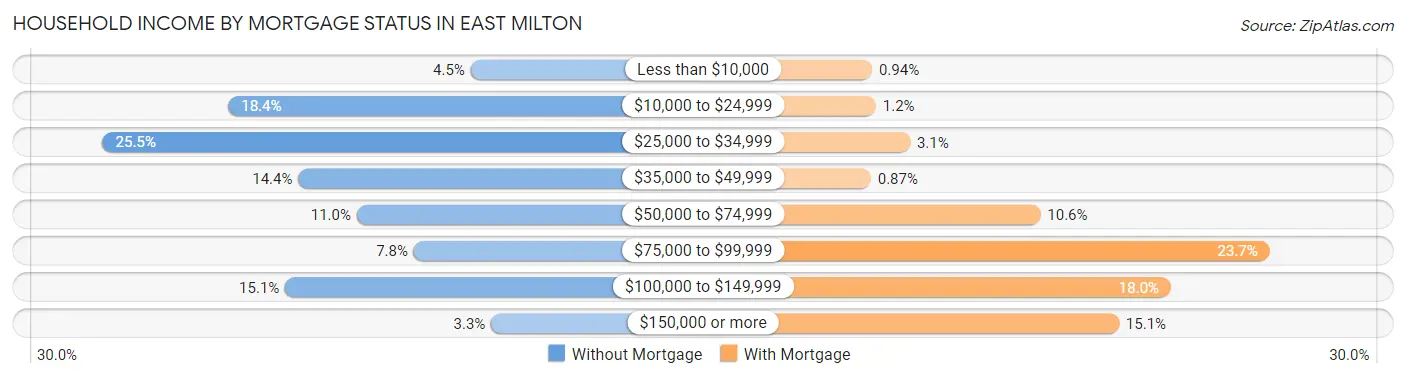
| Household Income | Without Mortgage | With Mortgage |
| Less than $10,000 | 54 (4.5%) | 13 (0.9%) |
| $10,000 to $24,999 | 220 (18.4%) | 16 (1.2%) |
| $25,000 to $34,999 | 306 (25.5%) | 43 (3.1%) |
| $35,000 to $49,999 | 172 (14.4%) | 12 (0.9%) |
| $50,000 to $74,999 | 132 (11.0%) | 146 (10.6%) |
| $75,000 to $99,999 | 93 (7.8%) | 327 (23.7%) |
| $100,000 to $149,999 | 181 (15.1%) | 249 (18.0%) |
| $150,000 or more | 40 (3.3%) | 208 (15.0%) |
| Total | 1,198 (100.0%) | 1,382 (100.0%) |
Property Value to Household Income Ratio in East Milton
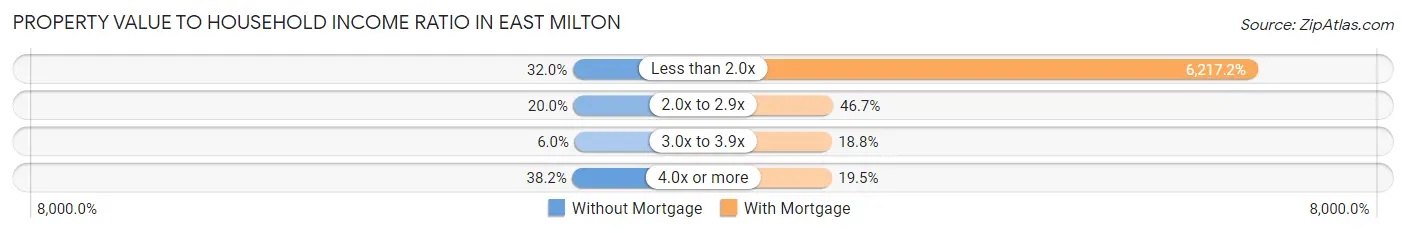
| Value-to-Income Ratio | Without Mortgage | With Mortgage |
| Less than 2.0x | 383 (32.0%) | 85,921 (6,217.2%) |
| 2.0x to 2.9x | 240 (20.0%) | 645 (46.7%) |
| 3.0x to 3.9x | 72 (6.0%) | 260 (18.8%) |
| 4.0x or more | 457 (38.2%) | 270 (19.5%) |
| Total | 1,198 (100.0%) | 1,382 (100.0%) |
Real Estate Taxes by Mortgage Status in East Milton
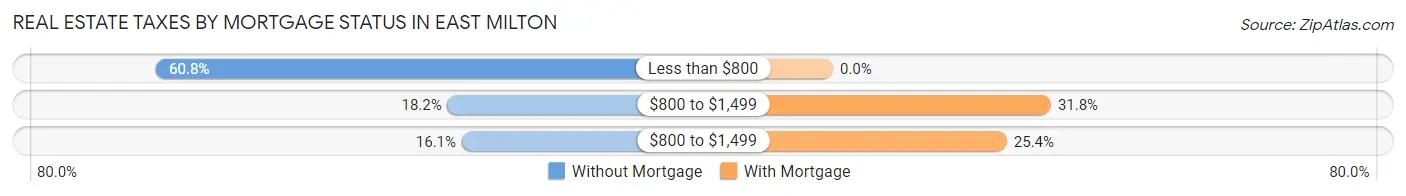
| Property Taxes | Without Mortgage | With Mortgage |
| Less than $800 | 728 (60.8%) | 0 (0.0%) |
| $800 to $1,499 | 218 (18.2%) | 440 (31.8%) |
| $800 to $1,499 | 193 (16.1%) | 351 (25.4%) |
| Total | 1,198 (100.0%) | 1,382 (100.0%) |
Health & Disability in East Milton
Health Insurance Coverage by Age in East Milton
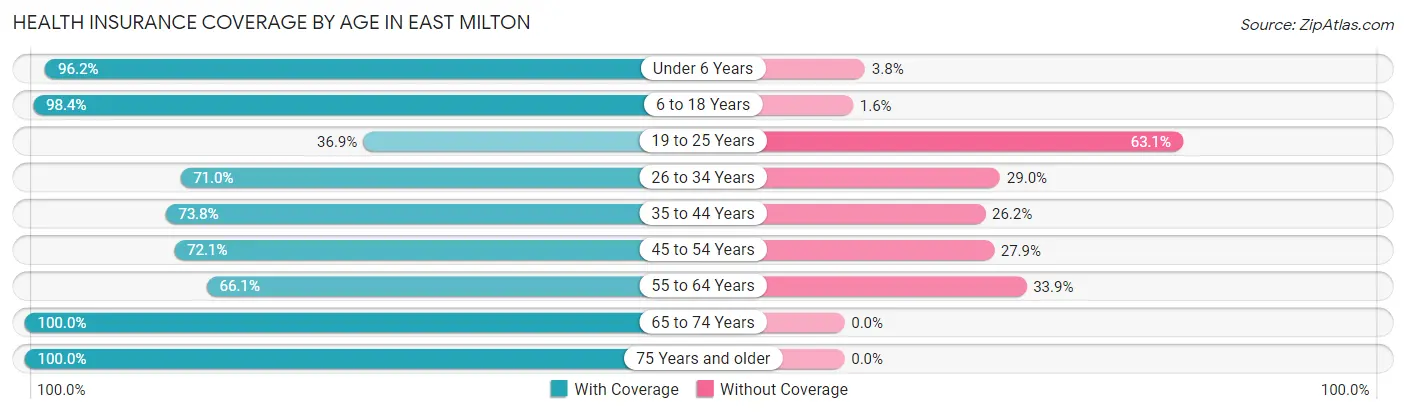
| Age Bracket | With Coverage | Without Coverage |
| Under 6 Years | 526 (96.2%) | 21 (3.8%) |
| 6 to 18 Years | 1,237 (98.4%) | 20 (1.6%) |
| 19 to 25 Years | 170 (36.9%) | 291 (63.1%) |
| 26 to 34 Years | 844 (71.0%) | 345 (29.0%) |
| 35 to 44 Years | 939 (73.8%) | 334 (26.2%) |
| 45 to 54 Years | 1,120 (72.1%) | 433 (27.9%) |
| 55 to 64 Years | 1,005 (66.1%) | 516 (33.9%) |
| 65 to 74 Years | 1,300 (100.0%) | 0 (0.0%) |
| 75 Years and older | 327 (100.0%) | 0 (0.0%) |
| Total | 7,468 (79.2%) | 1,960 (20.8%) |
Health Insurance Coverage by Citizenship Status in East Milton
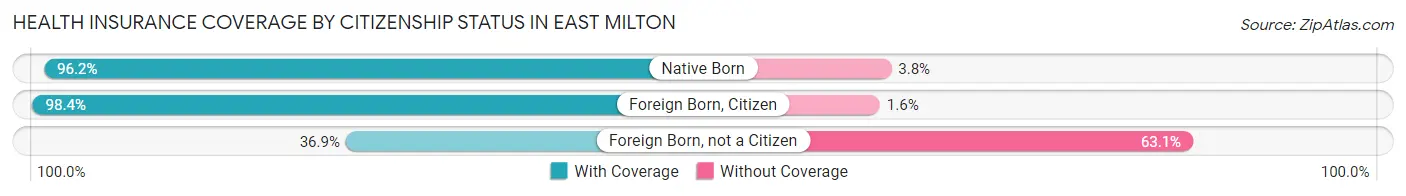
| Citizenship Status | With Coverage | Without Coverage |
| Native Born | 526 (96.2%) | 21 (3.8%) |
| Foreign Born, Citizen | 1,237 (98.4%) | 20 (1.6%) |
| Foreign Born, not a Citizen | 170 (36.9%) | 291 (63.1%) |
Health Insurance Coverage by Household Income in East Milton
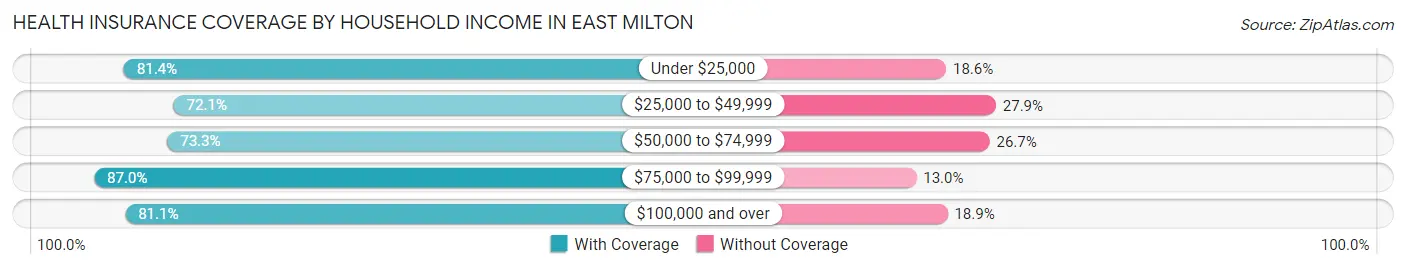
| Household Income | With Coverage | Without Coverage |
| Under $25,000 | 604 (81.4%) | 138 (18.6%) |
| $25,000 to $49,999 | 1,316 (72.1%) | 510 (27.9%) |
| $50,000 to $74,999 | 1,022 (73.3%) | 373 (26.7%) |
| $75,000 to $99,999 | 1,363 (87.0%) | 204 (13.0%) |
| $100,000 and over | 3,163 (81.1%) | 735 (18.9%) |
Public vs Private Health Insurance Coverage by Age in East Milton
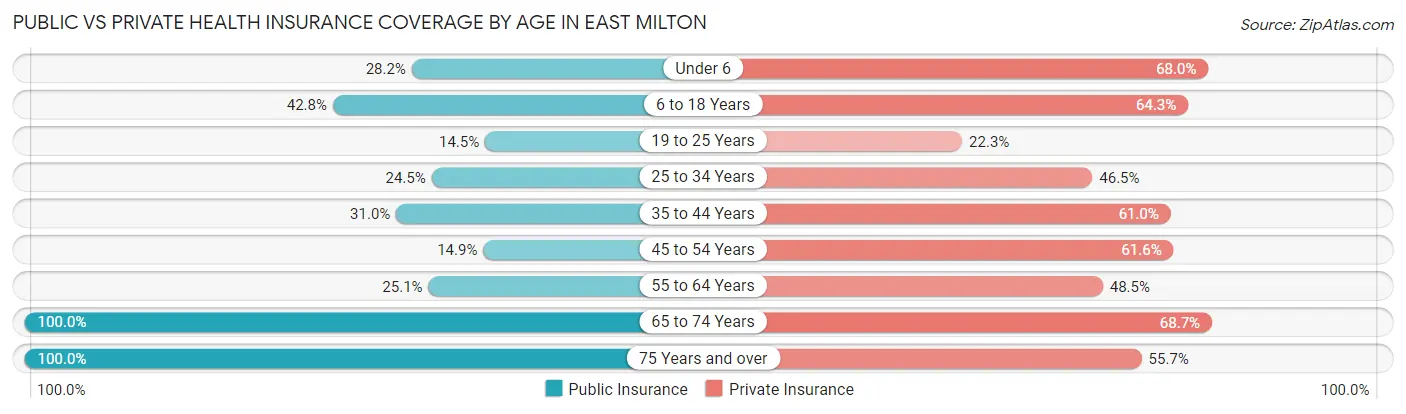
| Age Bracket | Public Insurance | Private Insurance |
| Under 6 | 154 (28.1%) | 372 (68.0%) |
| 6 to 18 Years | 538 (42.8%) | 808 (64.3%) |
| 19 to 25 Years | 67 (14.5%) | 103 (22.3%) |
| 25 to 34 Years | 291 (24.5%) | 553 (46.5%) |
| 35 to 44 Years | 395 (31.0%) | 777 (61.0%) |
| 45 to 54 Years | 231 (14.9%) | 956 (61.6%) |
| 55 to 64 Years | 381 (25.1%) | 737 (48.4%) |
| 65 to 74 Years | 1,300 (100.0%) | 893 (68.7%) |
| 75 Years and over | 327 (100.0%) | 182 (55.7%) |
| Total | 3,684 (39.1%) | 5,381 (57.1%) |
Disability Status by Sex by Age in East Milton
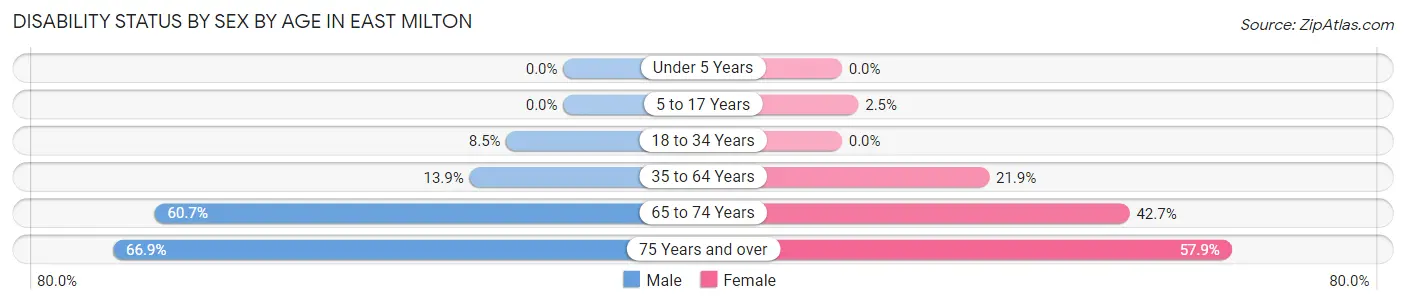
| Age Bracket | Male | Female |
| Under 5 Years | 0 (0.0%) | 0 (0.0%) |
| 5 to 17 Years | 0 (0.0%) | 12 (2.5%) |
| 18 to 34 Years | 67 (8.5%) | 0 (0.0%) |
| 35 to 64 Years | 317 (13.9%) | 453 (21.9%) |
| 65 to 74 Years | 289 (60.7%) | 352 (42.7%) |
| 75 Years and over | 117 (66.9%) | 88 (57.9%) |
Disability Class by Sex by Age in East Milton
Disability Class: Hearing Difficulty
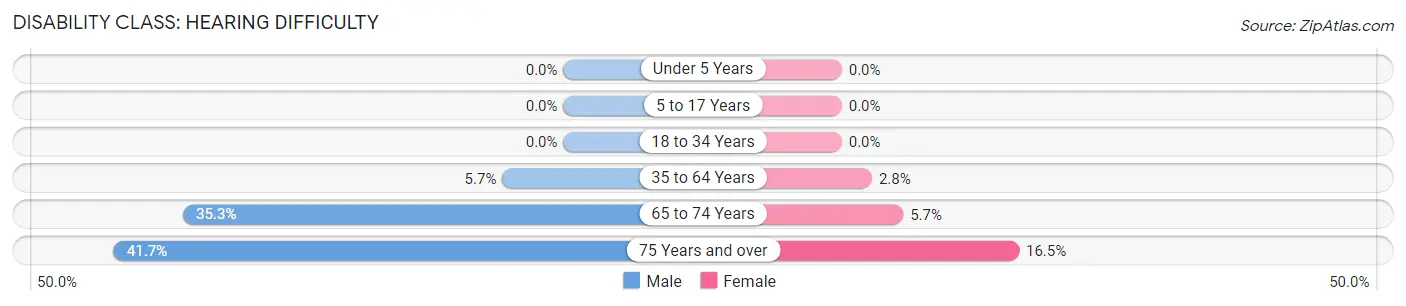
| Age Bracket | Male | Female |
| Under 5 Years | 0 (0.0%) | 0 (0.0%) |
| 5 to 17 Years | 0 (0.0%) | 0 (0.0%) |
| 18 to 34 Years | 0 (0.0%) | 0 (0.0%) |
| 35 to 64 Years | 129 (5.7%) | 58 (2.8%) |
| 65 to 74 Years | 168 (35.3%) | 47 (5.7%) |
| 75 Years and over | 73 (41.7%) | 25 (16.5%) |
Disability Class: Vision Difficulty
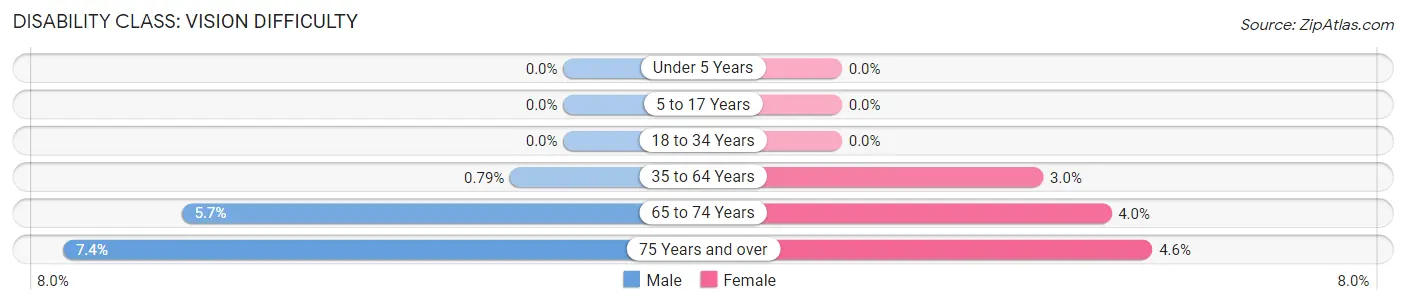
| Age Bracket | Male | Female |
| Under 5 Years | 0 (0.0%) | 0 (0.0%) |
| 5 to 17 Years | 0 (0.0%) | 0 (0.0%) |
| 18 to 34 Years | 0 (0.0%) | 0 (0.0%) |
| 35 to 64 Years | 18 (0.8%) | 62 (3.0%) |
| 65 to 74 Years | 27 (5.7%) | 33 (4.0%) |
| 75 Years and over | 13 (7.4%) | 7 (4.6%) |
Disability Class: Cognitive Difficulty
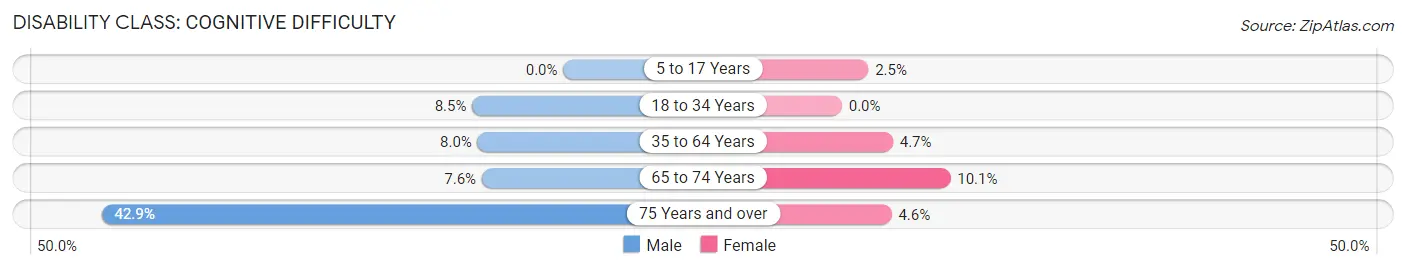
| Age Bracket | Male | Female |
| 5 to 17 Years | 0 (0.0%) | 12 (2.5%) |
| 18 to 34 Years | 67 (8.5%) | 0 (0.0%) |
| 35 to 64 Years | 181 (8.0%) | 98 (4.7%) |
| 65 to 74 Years | 36 (7.6%) | 83 (10.1%) |
| 75 Years and over | 75 (42.9%) | 7 (4.6%) |
Disability Class: Ambulatory Difficulty
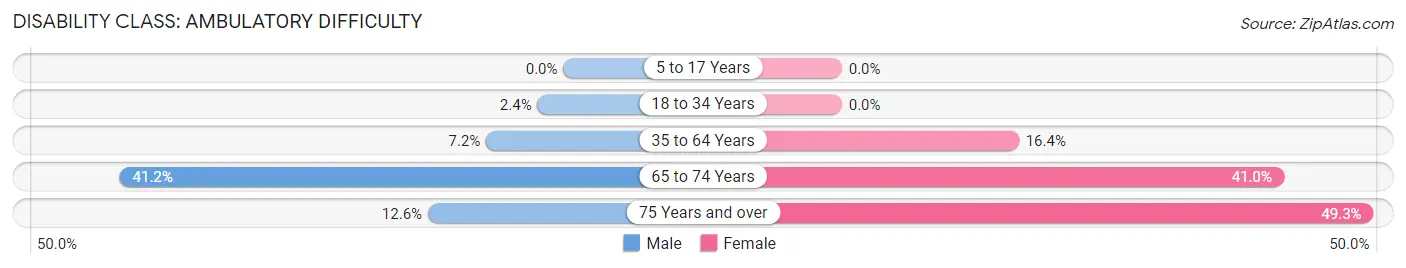
| Age Bracket | Male | Female |
| 5 to 17 Years | 0 (0.0%) | 0 (0.0%) |
| 18 to 34 Years | 19 (2.4%) | 0 (0.0%) |
| 35 to 64 Years | 163 (7.2%) | 340 (16.4%) |
| 65 to 74 Years | 196 (41.2%) | 338 (41.0%) |
| 75 Years and over | 22 (12.6%) | 75 (49.3%) |
Disability Class: Self-Care Difficulty
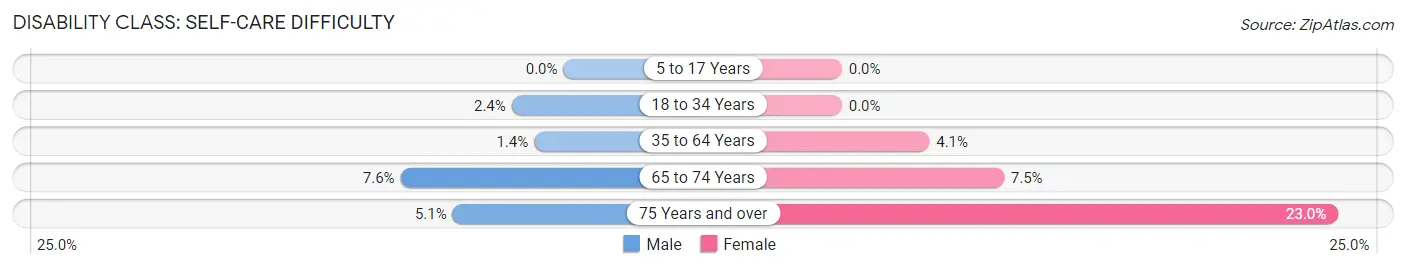
| Age Bracket | Male | Female |
| 5 to 17 Years | 0 (0.0%) | 0 (0.0%) |
| 18 to 34 Years | 19 (2.4%) | 0 (0.0%) |
| 35 to 64 Years | 31 (1.4%) | 84 (4.1%) |
| 65 to 74 Years | 36 (7.6%) | 62 (7.5%) |
| 75 Years and over | 9 (5.1%) | 35 (23.0%) |
Technology Access in East Milton
Computing Device Access in East Milton
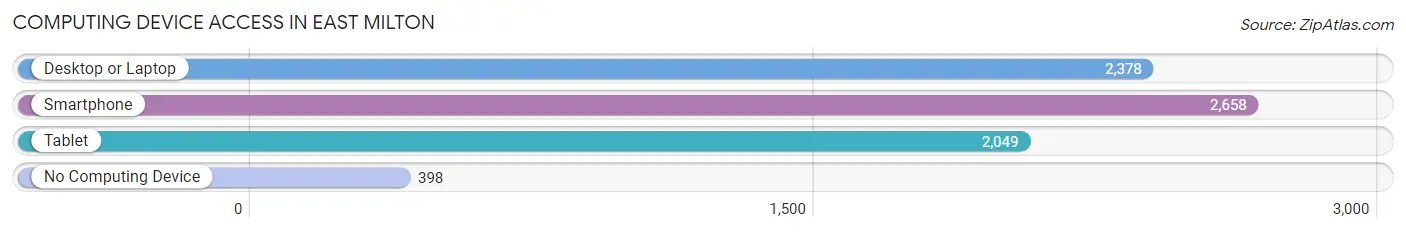
| Device Type | # Households | % Households |
| Desktop or Laptop | 2,378 | 70.6% |
| Smartphone | 2,658 | 78.9% |
| Tablet | 2,049 | 60.8% |
| No Computing Device | 398 | 11.8% |
| Total | 3,368 | 100.0% |
Internet Access in East Milton
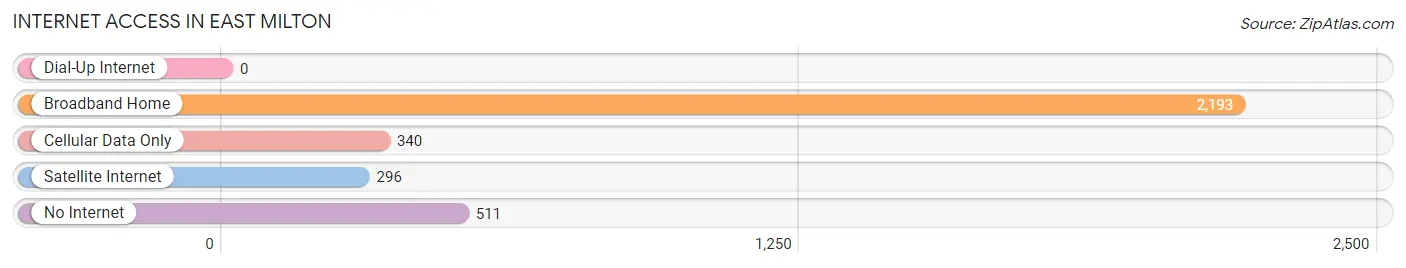
| Internet Type | # Households | % Households |
| Dial-Up Internet | 0 | 0.0% |
| Broadband Home | 2,193 | 65.1% |
| Cellular Data Only | 340 | 10.1% |
| Satellite Internet | 296 | 8.8% |
| No Internet | 511 | 15.2% |
| Total | 3,368 | 100.0% |
East Milton Summary
History
East Milton is a small unincorporated community located in Santa Rosa County, Florida. It is situated on the eastern side of the Blackwater River, just north of the city of Milton. The area was first settled in the early 1800s by a group of settlers from Georgia. The settlers were attracted to the area due to its abundance of timber and its proximity to the Blackwater River. The area was originally known as “Milton”, but the name was changed to “East Milton” in 1887 to distinguish it from the nearby city of Milton.
East Milton was an important center of commerce in the early 1900s. The area was home to several sawmills, a grist mill, and a cotton gin. The area also had a post office, a general store, and a hotel. The town was also home to a number of churches, including the East Milton Methodist Church, which was established in 1887.
The town of East Milton experienced a period of growth in the early 20th century. The population increased from just over 200 in 1900 to nearly 1,000 by 1930. The town was also home to a number of businesses, including a bank, a movie theater, and a number of stores.
Geography
East Milton is located in Santa Rosa County, Florida. It is situated on the eastern side of the Blackwater River, just north of the city of Milton. The area is mostly flat, with some rolling hills in the northern part of the town. The area is mostly wooded, with some open fields and pastures. The climate is humid subtropical, with hot summers and mild winters.
Economy
East Milton’s economy is largely based on agriculture and timber. The area is home to several farms, which produce a variety of crops, including corn, soybeans, and cotton. The area is also home to several timber companies, which harvest timber from the surrounding forests.
The town is also home to a number of small businesses, including restaurants, convenience stores, and auto repair shops. The town is also home to a number of churches, which provide a variety of services to the community.
Demographics
As of the 2010 census, the population of East Milton was 1,845. The population is mostly white (90.2%), with a small percentage of African Americans (4.2%) and Hispanics (3.2%). The median household income is $41,944, and the median age is 38.7 years. The town is served by the Santa Rosa County School District.
Common Questions
What is Per Capita Income in East Milton?
Per Capita income in East Milton is $23,216.
What is the Median Family Income in East Milton?
Median Family Income in East Milton is $84,231.
What is the Median Household income in East Milton?
Median Household Income in East Milton is $61,923.
What is Income or Wage Gap in East Milton?
Income or Wage Gap in East Milton is 2.3%.
Women in East Milton earn 97.7 cents for every dollar earned by a man.
What is Inequality or Gini Index in East Milton?
Inequality or Gini Index in East Milton is 0.46.
What is the Total Population of East Milton?
Total Population of East Milton is 13,974.
What is the Total Male Population of East Milton?
Total Male Population of East Milton is 9,182.
What is the Total Female Population of East Milton?
Total Female Population of East Milton is 4,792.
What is the Ratio of Males per 100 Females in East Milton?
There are 191.61 Males per 100 Females in East Milton.
What is the Ratio of Females per 100 Males in East Milton?
There are 52.19 Females per 100 Males in East Milton.
What is the Median Population Age in East Milton?
Median Population Age in East Milton is 40.2 Years.
What is the Average Family Size in East Milton
Average Family Size in East Milton is 3.3 People.
What is the Average Household Size in East Milton
Average Household Size in East Milton is 2.8 People.
How Large is the Labor Force in East Milton?
There are 4,413 People in the Labor Forcein in East Milton.
What is the Percentage of People in the Labor Force in East Milton?
35.5% of People are in the Labor Force in East Milton.
What is the Unemployment Rate in East Milton?
Unemployment Rate in East Milton is 5.0%.