Zip Codes with the Highest Percentage of Population Employed in Food Preparation & Serving in Plant City, FL
RELATED REPORTS & OPTIONS
Food Preparation & Serving
Plant City
Compare Zip Codes
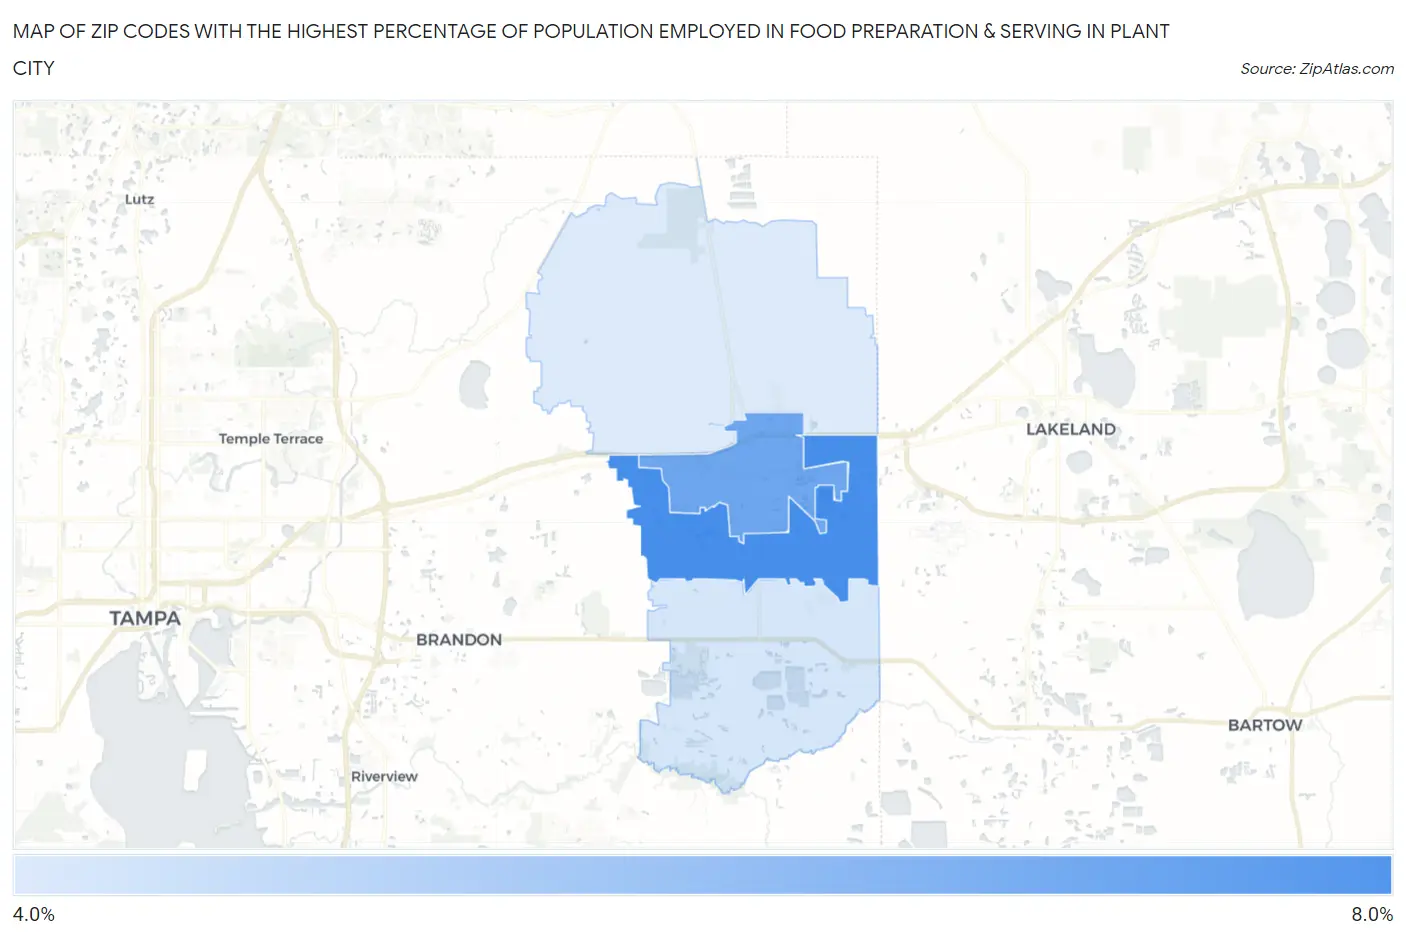
Map of Zip Codes with the Highest Percentage of Population Employed in Food Preparation & Serving in Plant City
4.1%
7.5%
Zip Codes with the Highest Percentage of Population Employed in Food Preparation & Serving in Plant City, FL
| Zip Code | % Employed | vs State | vs National | |
| 1. | 33566 | 7.5% | 6.1%(+1.46)#252 | 5.3%(+2.26)#5,471 |
| 2. | 33563 | 6.6% | 6.1%(+0.537)#372 | 5.3%(+1.34)#7,544 |
| 3. | 33567 | 4.3% | 6.1%(-1.80)#686 | 5.3%(-1.00)#15,938 |
| 4. | 33565 | 4.1% | 6.1%(-1.99)#708 | 5.3%(-1.18)#16,678 |
1
Common Questions
What are the Top 3 Zip Codes with the Highest Percentage of Population Employed in Food Preparation & Serving in Plant City, FL?
Top 3 Zip Codes with the Highest Percentage of Population Employed in Food Preparation & Serving in Plant City, FL are:
What zip code has the Highest Percentage of Population Employed in Food Preparation & Serving in Plant City, FL?
33566 has the Highest Percentage of Population Employed in Food Preparation & Serving in Plant City, FL with 7.5%.
What is the Percentage of Population Employed in Food Preparation & Serving in Plant City, FL?
Percentage of Population Employed in Food Preparation & Serving in Plant City is 7.1%.
What is the Percentage of Population Employed in Food Preparation & Serving in Florida?
Percentage of Population Employed in Food Preparation & Serving in Florida is 6.1%.
What is the Percentage of Population Employed in Food Preparation & Serving in the United States?
Percentage of Population Employed in Food Preparation & Serving in the United States is 5.3%.