Panacea, FL Map & Demographics
Panacea Map
Panacea Overview
$22,148
PER CAPITA INCOME
$35,824
AVG FAMILY INCOME
$36,250
AVG HOUSEHOLD INCOME
0.35
INEQUALITY / GINI INDEX
1,152
TOTAL POPULATION
613
MALE POPULATION
539
FEMALE POPULATION
113.73
MALES / 100 FEMALES
87.93
FEMALES / 100 MALES
46.7
MEDIAN AGE
3.2
AVG FAMILY SIZE
2.9
AVG HOUSEHOLD SIZE
436
LABOR FORCE [ PEOPLE ]
46.1%
PERCENT IN LABOR FORCE
Panacea Zip Codes
Panacea Area Codes
Income in Panacea
Income Overview in Panacea
Per Capita Income in Panacea is $22,148, while median incomes of families and households are $35,824 and $36,250 respectively.
| Characteristic | Number | Measure |
| Per Capita Income | 1,152 | $22,148 |
| Median Family Income | 351 | $35,824 |
| Mean Family Income | 351 | $51,036 |
| Median Household Income | 395 | $36,250 |
| Mean Household Income | 395 | $50,242 |
| Income Deficit | 351 | $0 |
| Wage / Income Gap (%) | 1,152 | 0.00% |
| Wage / Income Gap ($) | 1,152 | 100.00¢ per $1 |
| Gini / Inequality Index | 1,152 | 0.35 |
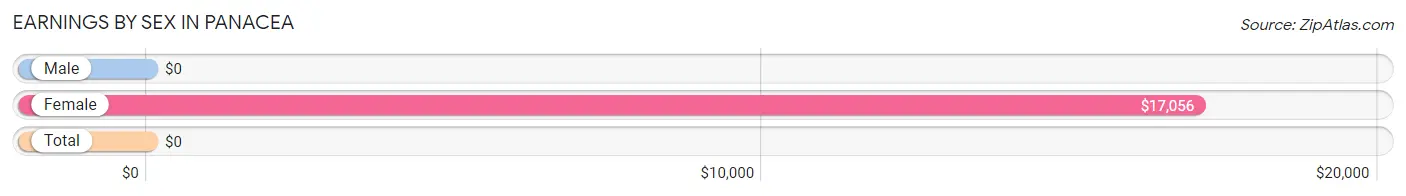
Earnings by Sex in Panacea
| Sex | Number | Average Earnings |
| Male | 299 (66.9%) | $0 |
| Female | 148 (33.1%) | $17,056 |
| Total | 447 (100.0%) | $0 |
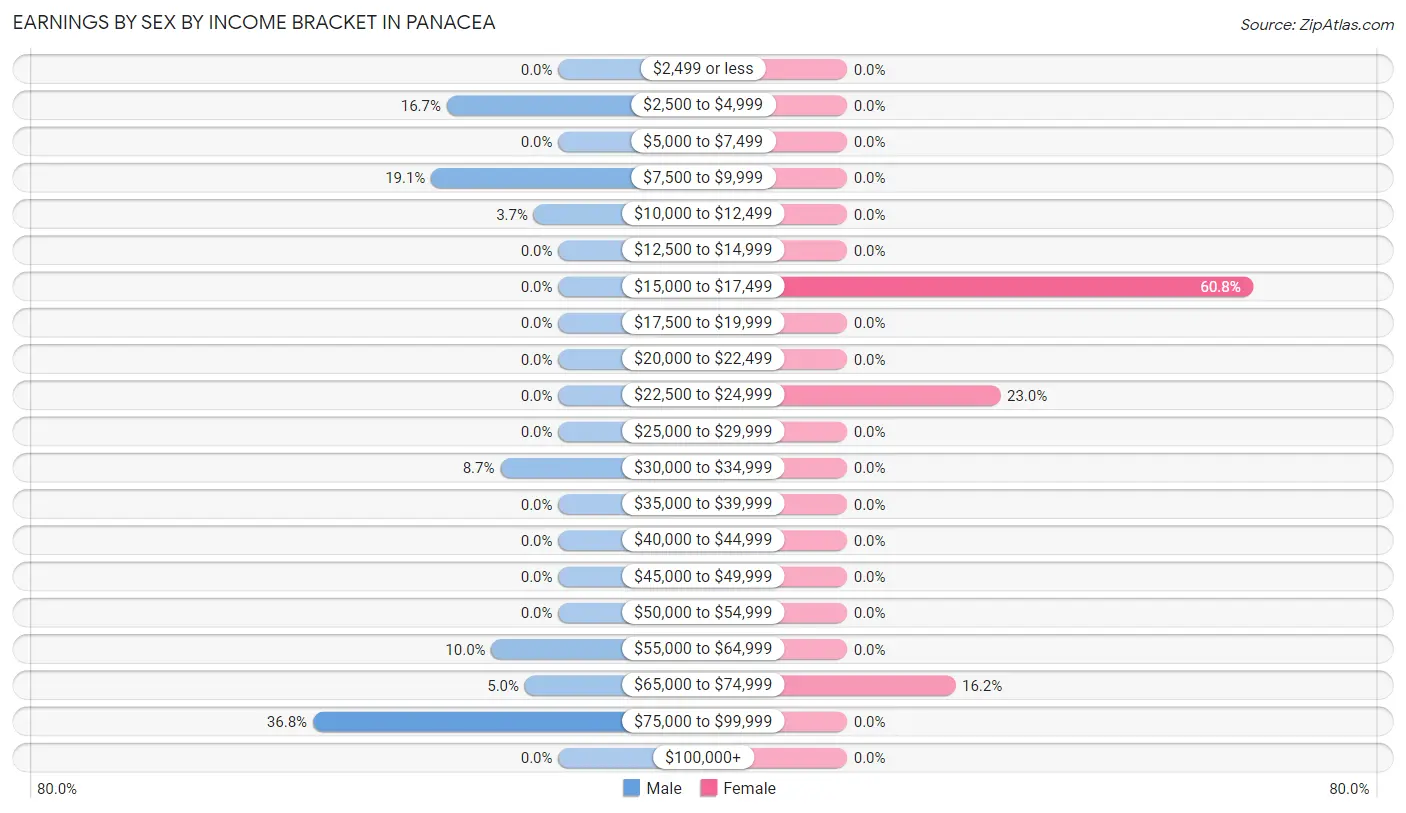
Earnings by Sex by Income Bracket in Panacea
The most common earnings brackets in Panacea are $75,000 to $99,999 for men (110 | 36.8%) and $15,000 to $17,499 for women (90 | 60.8%).
| Income | Male | Female |
| $2,499 or less | 0 (0.0%) | 0 (0.0%) |
| $2,500 to $4,999 | 50 (16.7%) | 0 (0.0%) |
| $5,000 to $7,499 | 0 (0.0%) | 0 (0.0%) |
| $7,500 to $9,999 | 57 (19.1%) | 0 (0.0%) |
| $10,000 to $12,499 | 11 (3.7%) | 0 (0.0%) |
| $12,500 to $14,999 | 0 (0.0%) | 0 (0.0%) |
| $15,000 to $17,499 | 0 (0.0%) | 90 (60.8%) |
| $17,500 to $19,999 | 0 (0.0%) | 0 (0.0%) |
| $20,000 to $22,499 | 0 (0.0%) | 0 (0.0%) |
| $22,500 to $24,999 | 0 (0.0%) | 34 (23.0%) |
| $25,000 to $29,999 | 0 (0.0%) | 0 (0.0%) |
| $30,000 to $34,999 | 26 (8.7%) | 0 (0.0%) |
| $35,000 to $39,999 | 0 (0.0%) | 0 (0.0%) |
| $40,000 to $44,999 | 0 (0.0%) | 0 (0.0%) |
| $45,000 to $49,999 | 0 (0.0%) | 0 (0.0%) |
| $50,000 to $54,999 | 0 (0.0%) | 0 (0.0%) |
| $55,000 to $64,999 | 30 (10.0%) | 0 (0.0%) |
| $65,000 to $74,999 | 15 (5.0%) | 24 (16.2%) |
| $75,000 to $99,999 | 110 (36.8%) | 0 (0.0%) |
| $100,000+ | 0 (0.0%) | 0 (0.0%) |
| Total | 299 (100.0%) | 148 (100.0%) |
Earnings by Sex by Educational Attainment in Panacea
| Educational Attainment | Male Income | Female Income |
| Less than High School | - | - |
| High School Diploma | - | - |
| College or Associate's Degree | - | - |
| Bachelor's Degree | - | - |
| Graduate Degree | - | - |
| Total | - | - |
Family Income in Panacea
Family Income Brackets in Panacea
According to the Panacea family income data, there are 101 families falling into the $15,000 to $24,999 income range, which is the most common income bracket and makes up 28.8% of all families.
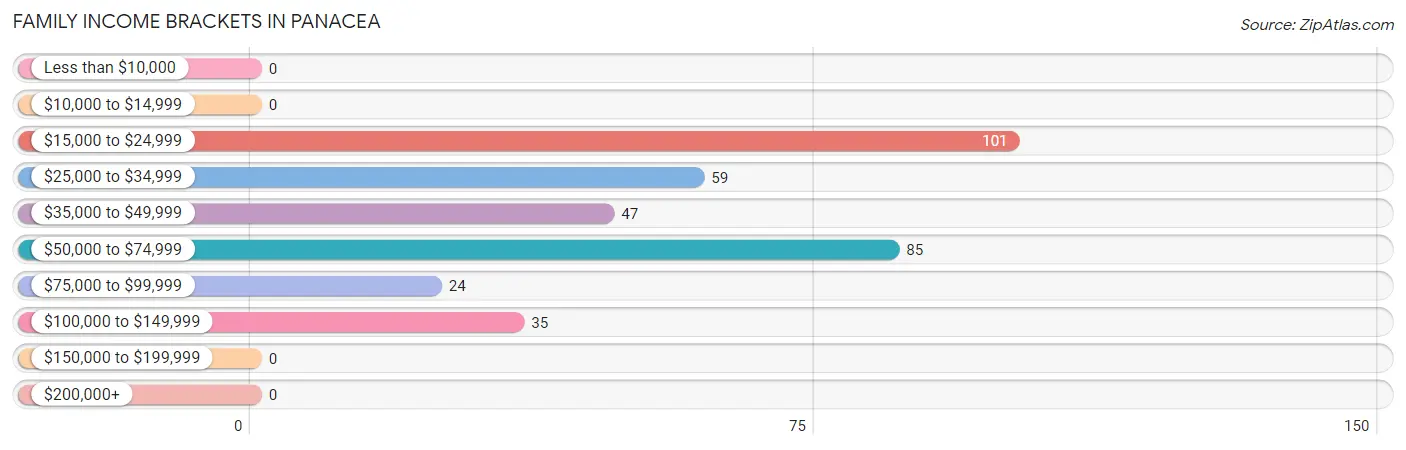
| Income Bracket | # Families | % Families |
| Less than $10,000 | 0 | 0.0% |
| $10,000 to $14,999 | 0 | 0.0% |
| $15,000 to $24,999 | 101 | 28.8% |
| $25,000 to $34,999 | 59 | 16.8% |
| $35,000 to $49,999 | 47 | 13.4% |
| $50,000 to $74,999 | 85 | 24.2% |
| $75,000 to $99,999 | 24 | 6.8% |
| $100,000 to $149,999 | 35 | 10.0% |
| $150,000 to $199,999 | 0 | 0.0% |
| $200,000+ | 0 | 0.0% |
Family Income by Famaliy Size in Panacea
2-person families (120 | 34.2%) account for the highest median family income in Panacea with $56,618 per family, while 2-person families (120 | 34.2%) have the highest median income of $28,309 per family member.
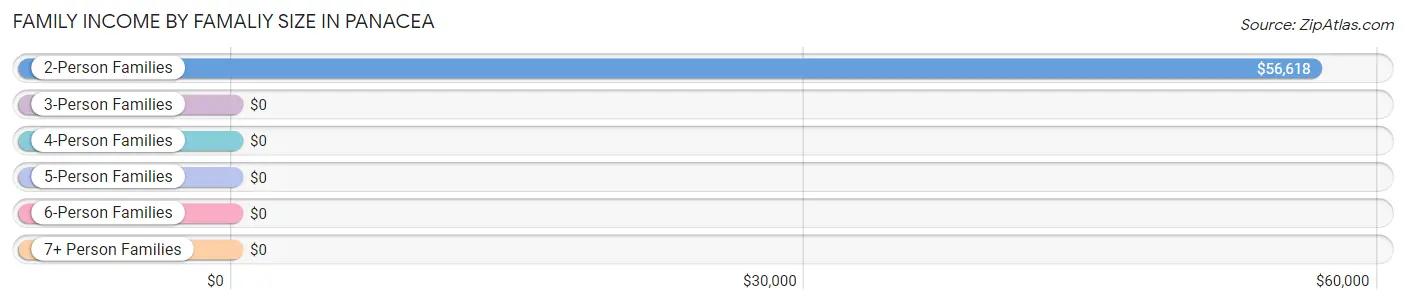
| Income Bracket | # Families | Median Income |
| 2-Person Families | 120 (34.2%) | $56,618 |
| 3-Person Families | 113 (32.2%) | $0 |
| 4-Person Families | 118 (33.6%) | $0 |
| 5-Person Families | 0 (0.0%) | $0 |
| 6-Person Families | 0 (0.0%) | $0 |
| 7+ Person Families | 0 (0.0%) | $0 |
| Total | 351 (100.0%) | $35,824 |
Family Income by Number of Earners in Panacea
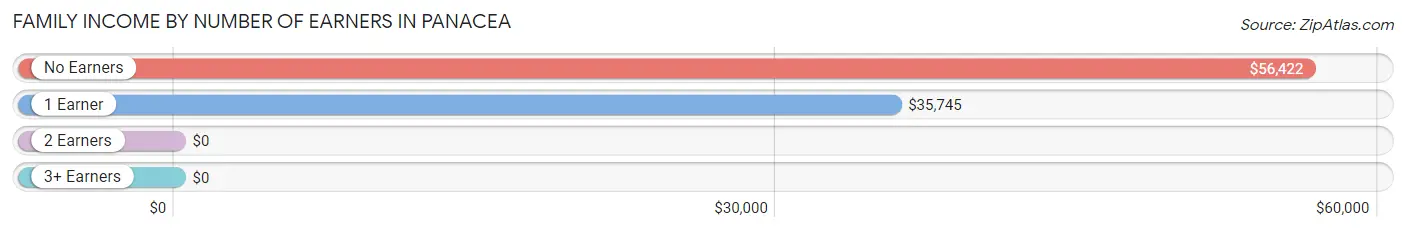
| Number of Earners | # Families | Median Income |
| No Earners | 80 (22.8%) | $56,422 |
| 1 Earner | 146 (41.6%) | $35,745 |
| 2 Earners | 125 (35.6%) | $0 |
| 3+ Earners | 0 (0.0%) | $0 |
| Total | 351 (100.0%) | $35,824 |
Household Income in Panacea
Household Income Brackets in Panacea
With 101 households falling in the category, the $15,000 to $24,999 income range is the most frequent in Panacea, accounting for 25.6% of all households.
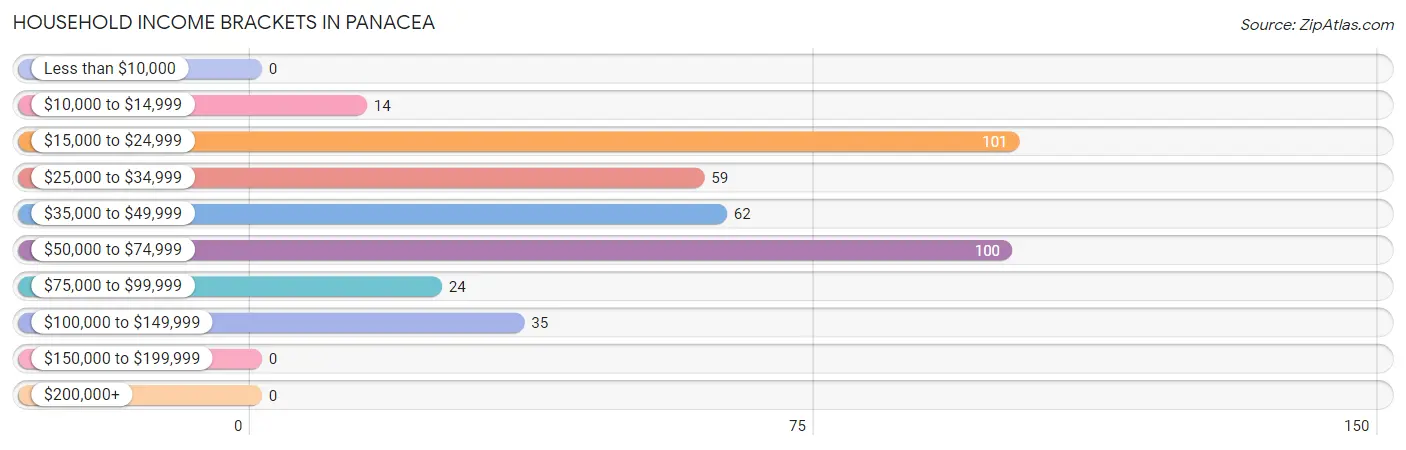
| Income Bracket | # Households | % Households |
| Less than $10,000 | 0 | 0.0% |
| $10,000 to $14,999 | 14 | 3.5% |
| $15,000 to $24,999 | 101 | 25.6% |
| $25,000 to $34,999 | 59 | 14.9% |
| $35,000 to $49,999 | 62 | 15.7% |
| $50,000 to $74,999 | 100 | 25.3% |
| $75,000 to $99,999 | 24 | 6.1% |
| $100,000 to $149,999 | 35 | 8.9% |
| $150,000 to $199,999 | 0 | 0.0% |
| $200,000+ | 0 | 0.0% |
Household Income by Householder Age in Panacea
The median household income in Panacea is $36,250, with the highest median household income of $54,219 found in the 65+ years age bracket for the primary householder. A total of 196 households (49.6%) fall into this category.
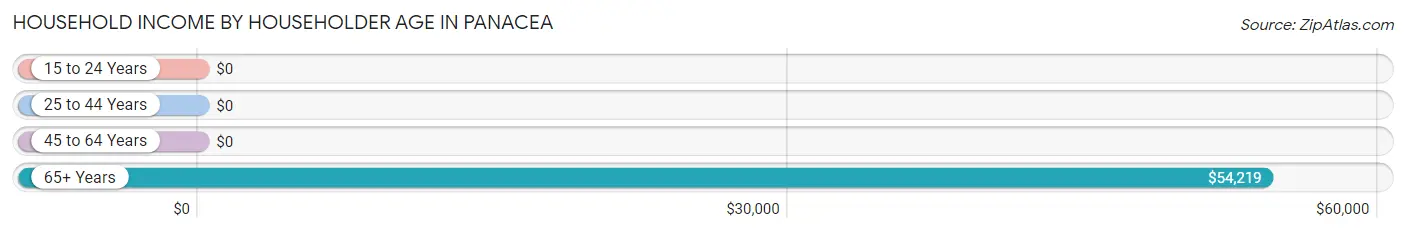
| Income Bracket | # Households | Median Income |
| 15 to 24 Years | 0 (0.0%) | $0 |
| 25 to 44 Years | 90 (22.8%) | $0 |
| 45 to 64 Years | 109 (27.6%) | $0 |
| 65+ Years | 196 (49.6%) | $54,219 |
| Total | 395 (100.0%) | $36,250 |
Poverty in Panacea
Income Below Poverty by Sex and Age in Panacea
With 19.1% poverty level for males and 28.6% for females among the residents of Panacea, under 5 year old males and under 5 year old females are the most vulnerable to poverty, with 67 males (100.0%) and 64 females (100.0%) in their respective age groups living below the poverty level.
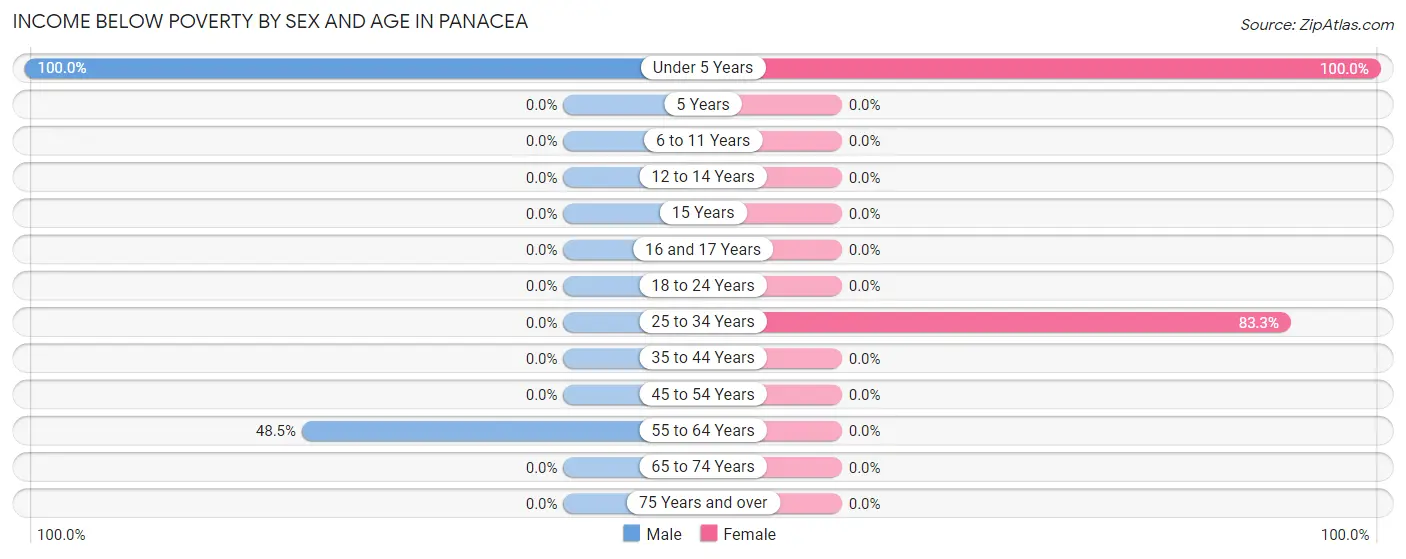
| Age Bracket | Male | Female |
| Under 5 Years | 67 (100.0%) | 64 (100.0%) |
| 5 Years | 0 (0.0%) | 0 (0.0%) |
| 6 to 11 Years | 0 (0.0%) | 0 (0.0%) |
| 12 to 14 Years | 0 (0.0%) | 0 (0.0%) |
| 15 Years | 0 (0.0%) | 0 (0.0%) |
| 16 and 17 Years | 0 (0.0%) | 0 (0.0%) |
| 18 to 24 Years | 0 (0.0%) | 0 (0.0%) |
| 25 to 34 Years | 0 (0.0%) | 90 (83.3%) |
| 35 to 44 Years | 0 (0.0%) | 0 (0.0%) |
| 45 to 54 Years | 0 (0.0%) | 0 (0.0%) |
| 55 to 64 Years | 50 (48.5%) | 0 (0.0%) |
| 65 to 74 Years | 0 (0.0%) | 0 (0.0%) |
| 75 Years and over | 0 (0.0%) | 0 (0.0%) |
| Total | 117 (19.1%) | 154 (28.6%) |
Income Above Poverty by Sex and Age in Panacea
According to the poverty statistics in Panacea, males aged 6 to 11 years and females aged 6 to 11 years are the age groups that are most secure financially, with 100.0% of males and 100.0% of females in these age groups living above the poverty line.
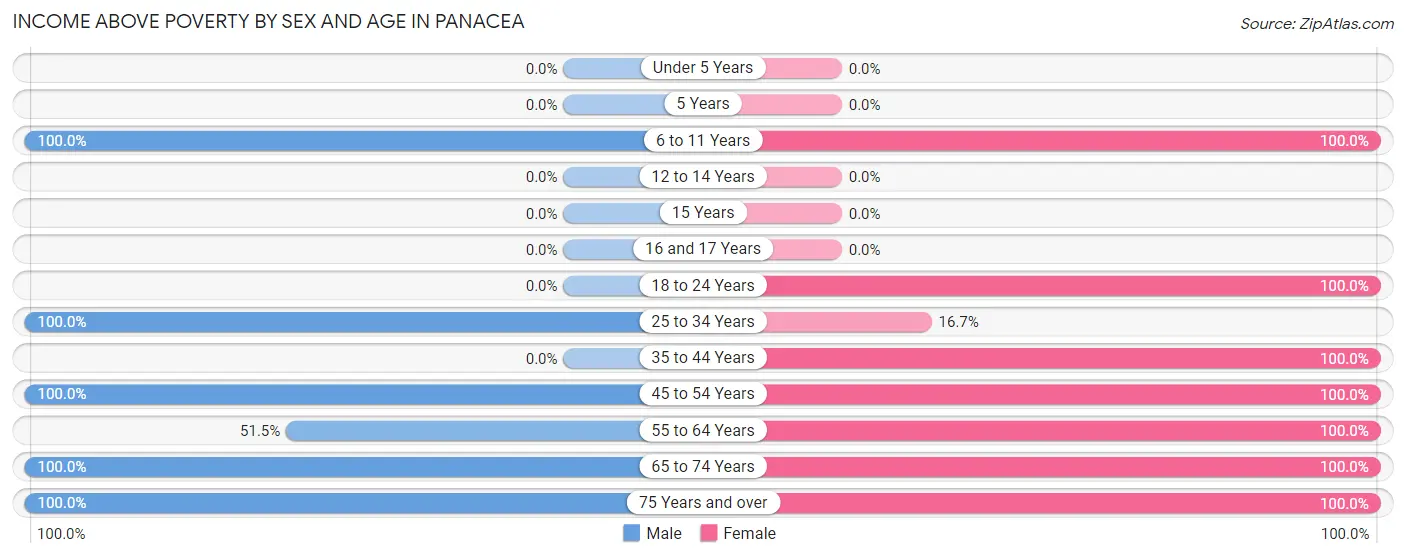
| Age Bracket | Male | Female |
| Under 5 Years | 0 (0.0%) | 0 (0.0%) |
| 5 Years | 0 (0.0%) | 0 (0.0%) |
| 6 to 11 Years | 34 (100.0%) | 42 (100.0%) |
| 12 to 14 Years | 0 (0.0%) | 0 (0.0%) |
| 15 Years | 0 (0.0%) | 0 (0.0%) |
| 16 and 17 Years | 0 (0.0%) | 0 (0.0%) |
| 18 to 24 Years | 0 (0.0%) | 62 (100.0%) |
| 25 to 34 Years | 110 (100.0%) | 18 (16.7%) |
| 35 to 44 Years | 0 (0.0%) | 34 (100.0%) |
| 45 to 54 Years | 128 (100.0%) | 66 (100.0%) |
| 55 to 64 Years | 53 (51.5%) | 28 (100.0%) |
| 65 to 74 Years | 78 (100.0%) | 120 (100.0%) |
| 75 Years and over | 93 (100.0%) | 15 (100.0%) |
| Total | 496 (80.9%) | 385 (71.4%) |
Income Below Poverty Among Married-Couple Families in Panacea
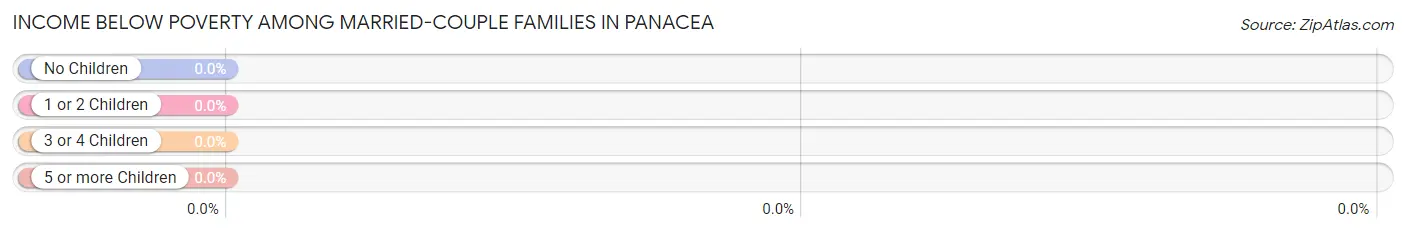
| Children | Above Poverty | Below Poverty |
| No Children | 175 (100.0%) | 0 (0.0%) |
| 1 or 2 Children | 0 (0.0%) | 0 (0.0%) |
| 3 or 4 Children | 0 (0.0%) | 0 (0.0%) |
| 5 or more Children | 0 (0.0%) | 0 (0.0%) |
| Total | 175 (100.0%) | 0 (0.0%) |
Income Below Poverty Among Single-Parent Households in Panacea
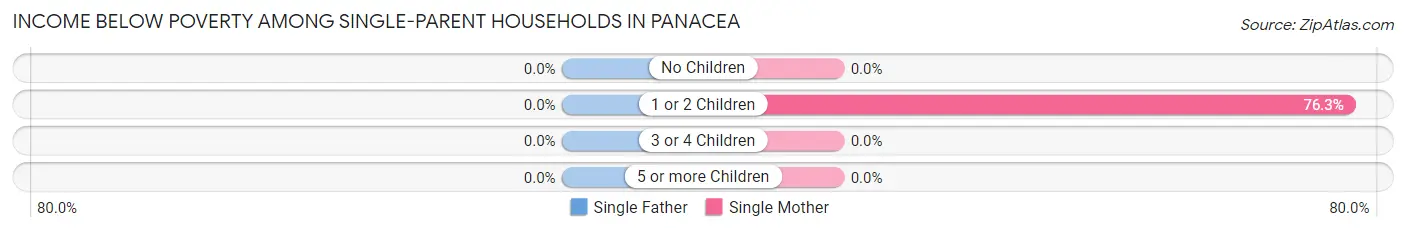
| Children | Single Father | Single Mother |
| No Children | 0 (0.0%) | 0 (0.0%) |
| 1 or 2 Children | 0 (0.0%) | 90 (76.3%) |
| 3 or 4 Children | 0 (0.0%) | 0 (0.0%) |
| 5 or more Children | 0 (0.0%) | 0 (0.0%) |
| Total | 0 (0.0%) | 90 (69.8%) |
Income Below Poverty Among Married-Couple vs Single-Parent Households in Panacea
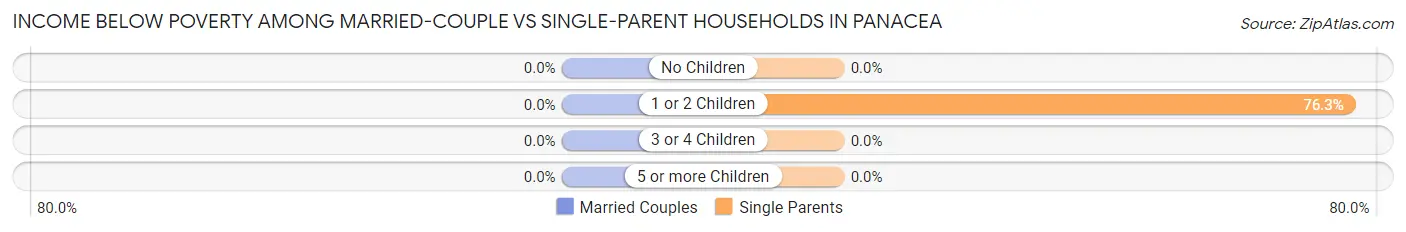
| Children | Married-Couple Families | Single-Parent Households |
| No Children | 0 (0.0%) | 0 (0.0%) |
| 1 or 2 Children | 0 (0.0%) | 90 (76.3%) |
| 3 or 4 Children | 0 (0.0%) | 0 (0.0%) |
| 5 or more Children | 0 (0.0%) | 0 (0.0%) |
| Total | 0 (0.0%) | 90 (51.1%) |
Race in Panacea
The most populous races in Panacea are White / Caucasian (1,136 | 98.6%), and Two or more Races (16 | 1.4%).
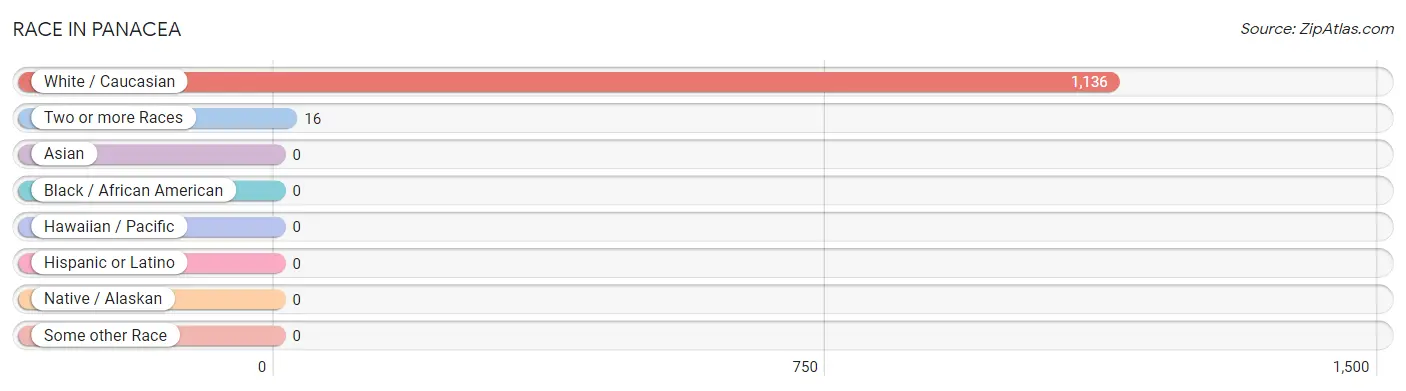
| Race | # Population | % Population |
| Asian | 0 | 0.0% |
| Black / African American | 0 | 0.0% |
| Hawaiian / Pacific | 0 | 0.0% |
| Hispanic or Latino | 0 | 0.0% |
| Native / Alaskan | 0 | 0.0% |
| White / Caucasian | 1,136 | 98.6% |
| Two or more Races | 16 | 1.4% |
| Some other Race | 0 | 0.0% |
| Total | 1,152 | 100.0% |
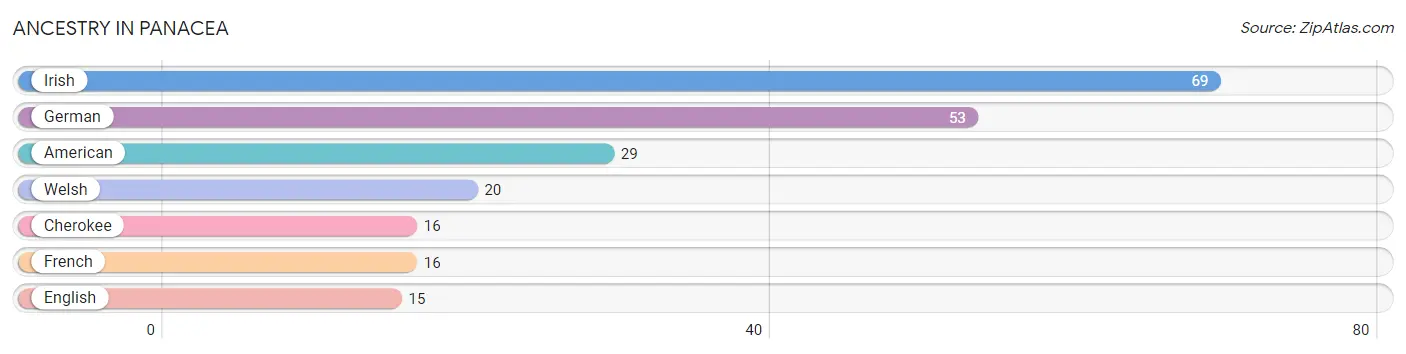
Ancestry in Panacea
The most populous ancestries reported in Panacea are Irish (69 | 6.0%), German (53 | 4.6%), American (29 | 2.5%), Welsh (20 | 1.7%), and Cherokee (16 | 1.4%), together accounting for 16.2% of all Panacea residents.
| Ancestry | # Population | % Population |
| American | 29 | 2.5% |
| Cherokee | 16 | 1.4% |
| English | 15 | 1.3% |
| French | 16 | 1.4% |
| German | 53 | 4.6% |
| Irish | 69 | 6.0% |
| Welsh | 20 | 1.7% | View All 7 Rows |
Immigrants in Panacea

| Immigration Origin | # Population | % Population | View All 0 Rows |
Sex and Age in Panacea
Sex and Age in Panacea
The most populous age groups in Panacea are 25 to 29 Years (110 | 17.9%) for men and 25 to 29 Years (108 | 20.0%) for women.
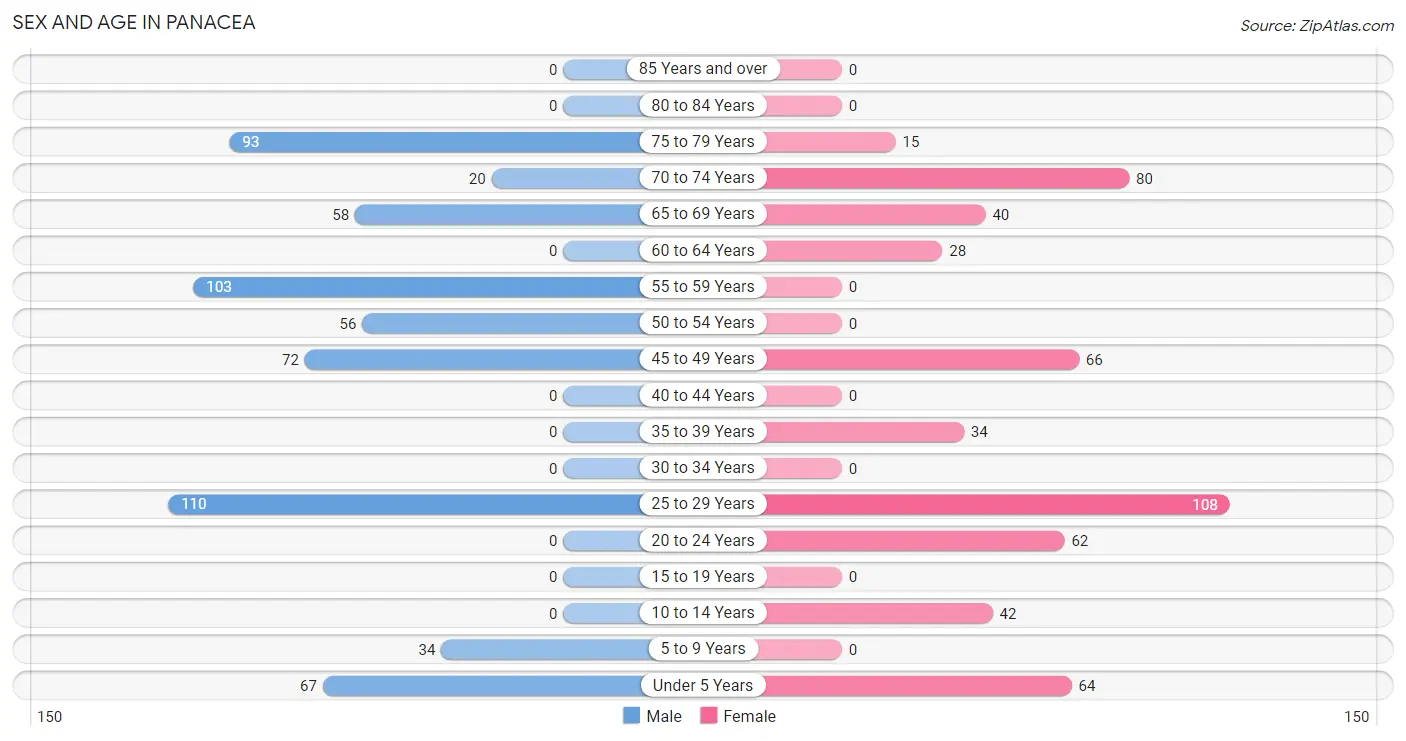
| Age Bracket | Male | Female |
| Under 5 Years | 67 (10.9%) | 64 (11.9%) |
| 5 to 9 Years | 34 (5.6%) | 0 (0.0%) |
| 10 to 14 Years | 0 (0.0%) | 42 (7.8%) |
| 15 to 19 Years | 0 (0.0%) | 0 (0.0%) |
| 20 to 24 Years | 0 (0.0%) | 62 (11.5%) |
| 25 to 29 Years | 110 (17.9%) | 108 (20.0%) |
| 30 to 34 Years | 0 (0.0%) | 0 (0.0%) |
| 35 to 39 Years | 0 (0.0%) | 34 (6.3%) |
| 40 to 44 Years | 0 (0.0%) | 0 (0.0%) |
| 45 to 49 Years | 72 (11.7%) | 66 (12.2%) |
| 50 to 54 Years | 56 (9.1%) | 0 (0.0%) |
| 55 to 59 Years | 103 (16.8%) | 0 (0.0%) |
| 60 to 64 Years | 0 (0.0%) | 28 (5.2%) |
| 65 to 69 Years | 58 (9.5%) | 40 (7.4%) |
| 70 to 74 Years | 20 (3.3%) | 80 (14.8%) |
| 75 to 79 Years | 93 (15.2%) | 15 (2.8%) |
| 80 to 84 Years | 0 (0.0%) | 0 (0.0%) |
| 85 Years and over | 0 (0.0%) | 0 (0.0%) |
| Total | 613 (100.0%) | 539 (100.0%) |
Families and Households in Panacea
Median Family Size in Panacea
The median family size in Panacea is 3.16 persons per family, with single female/mother families (129 | 36.7%) accounting for the largest median family size of 3.4 persons per family. On the other hand, married-couple families (175 | 49.9%) represent the smallest median family size with 2.93 persons per family.
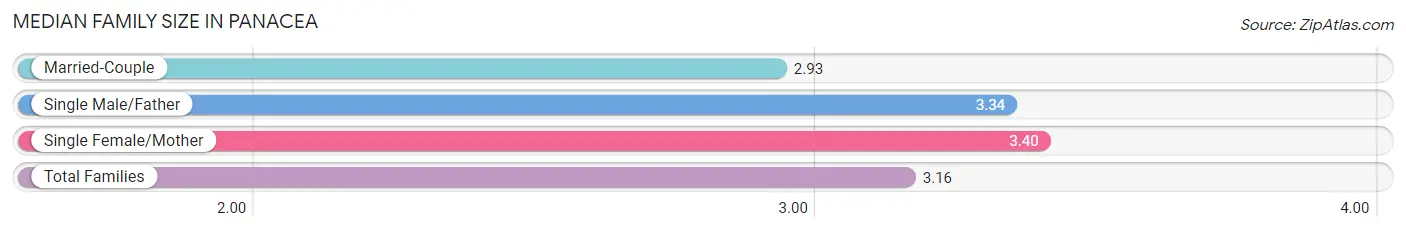
| Family Type | # Families | Family Size |
| Married-Couple | 175 (49.9%) | 2.93 |
| Single Male/Father | 47 (13.4%) | 3.34 |
| Single Female/Mother | 129 (36.7%) | 3.40 |
| Total Families | 351 (100.0%) | 3.16 |
Median Household Size in Panacea
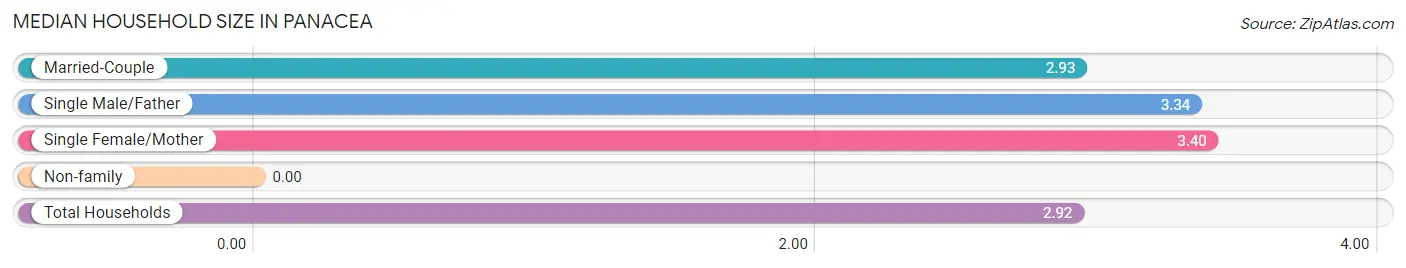
| Household Type | # Households | Household Size |
| Married-Couple | 175 (44.3%) | 2.93 |
| Single Male/Father | 47 (11.9%) | 3.34 |
| Single Female/Mother | 129 (32.7%) | 3.40 |
| Non-family | 44 (11.1%) | - |
| Total Households | 395 (100.0%) | 2.92 |
Household Size by Marriage Status in Panacea
Out of a total of 395 households in Panacea, 351 (88.9%) are family households, while 44 (11.1%) are nonfamily households. The most numerous type of family households are 2-person households, comprising 120, and the most common type of nonfamily households are 1-person households, comprising 44.
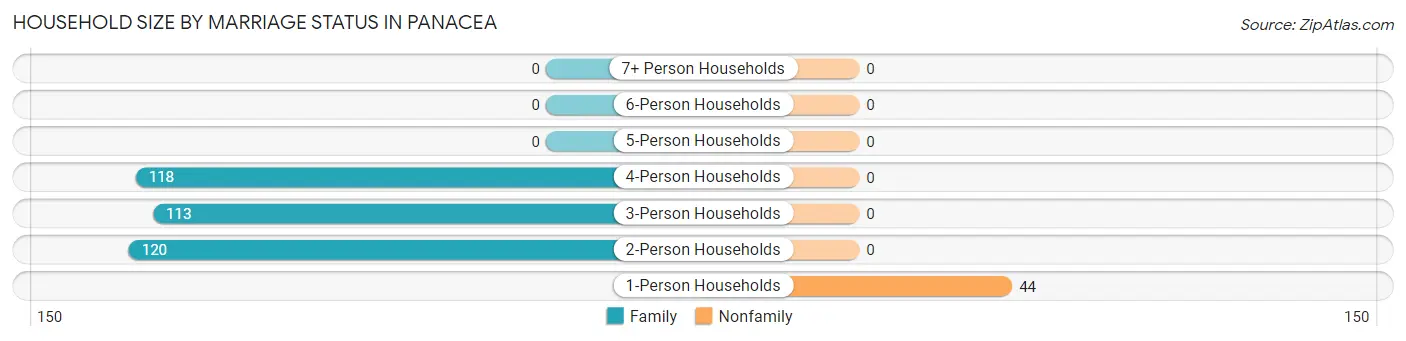
| Household Size | Family Households | Nonfamily Households |
| 1-Person Households | - | 44 (11.1%) |
| 2-Person Households | 120 (30.4%) | 0 (0.0%) |
| 3-Person Households | 113 (28.6%) | 0 (0.0%) |
| 4-Person Households | 118 (29.9%) | 0 (0.0%) |
| 5-Person Households | 0 (0.0%) | 0 (0.0%) |
| 6-Person Households | 0 (0.0%) | 0 (0.0%) |
| 7+ Person Households | 0 (0.0%) | 0 (0.0%) |
| Total | 351 (88.9%) | 44 (11.1%) |
Female Fertility in Panacea
Fertility by Age in Panacea
| Age Bracket | Women with Births | Births / 1,000 Women |
| 15 to 19 years | 0 (0.0%) | 0.0 |
| 20 to 34 years | 0 (0.0%) | 0.0 |
| 35 to 50 years | 0 (0.0%) | 0.0 |
| Total | 0 (0.0%) | 0.0 |
Fertility by Age by Marriage Status in Panacea
| Age Bracket | Married | Unmarried |
| 15 to 19 years | 0 (0.0%) | 0 (0.0%) |
| 20 to 34 years | 0 (0.0%) | 0 (0.0%) |
| 35 to 50 years | 0 (0.0%) | 0 (0.0%) |
| Total | 0 (0.0%) | 0 (0.0%) |
Fertility by Education in Panacea
| Educational Attainment | Women with Births | Births / 1,000 Women |
| Less than High School | 0 (0.0%) | 0.0 |
| High School Diploma | 0 (0.0%) | 0.0 |
| College or Associate's Degree | 0 (0.0%) | 0.0 |
| Bachelor's Degree | 0 (0.0%) | 0.0 |
| Graduate Degree | 0 (0.0%) | 0.0 |
| Total | 0 (0.0%) | 0.0 |
Fertility by Education by Marriage Status in Panacea
| Educational Attainment | Married | Unmarried |
| Less than High School | 0 (0.0%) | 0 (0.0%) |
| High School Diploma | 0 (0.0%) | 0 (0.0%) |
| College or Associate's Degree | 0 (0.0%) | 0 (0.0%) |
| Bachelor's Degree | 0 (0.0%) | 0 (0.0%) |
| Graduate Degree | 0 (0.0%) | 0 (0.0%) |
| Total | 0 (0.0%) | 0 (0.0%) |
Employment Characteristics in Panacea
Employment by Class of Employer in Panacea
Among the 386 employed individuals in Panacea, private company employees (299 | 77.5%), state government employees (57 | 14.8%), and self-employed (not incorporated) (30 | 7.8%) make up the most common classes of employment.
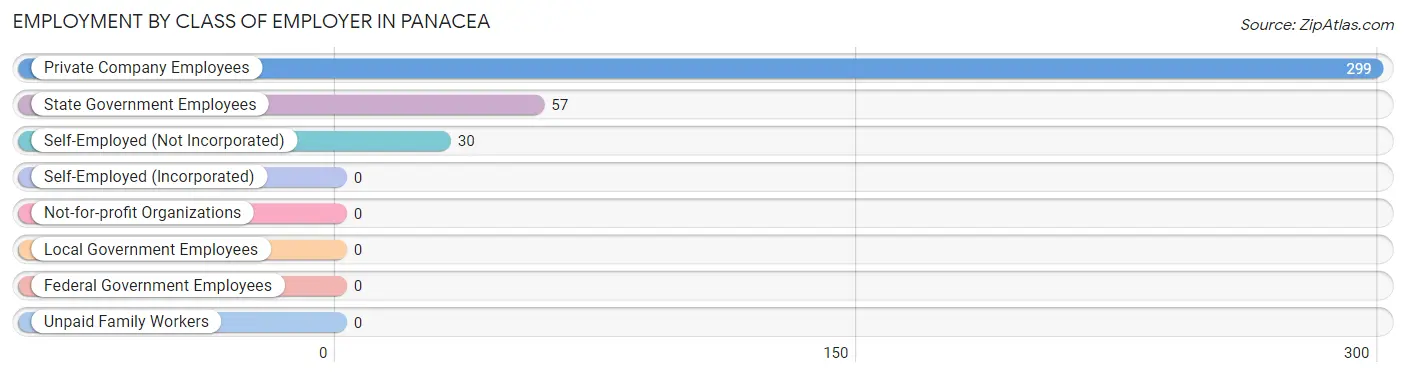
| Employer Class | # Employees | % Employees |
| Private Company Employees | 299 | 77.5% |
| Self-Employed (Incorporated) | 0 | 0.0% |
| Self-Employed (Not Incorporated) | 30 | 7.8% |
| Not-for-profit Organizations | 0 | 0.0% |
| Local Government Employees | 0 | 0.0% |
| State Government Employees | 57 | 14.8% |
| Federal Government Employees | 0 | 0.0% |
| Unpaid Family Workers | 0 | 0.0% |
| Total | 386 | 100.0% |
Employment Status by Age in Panacea
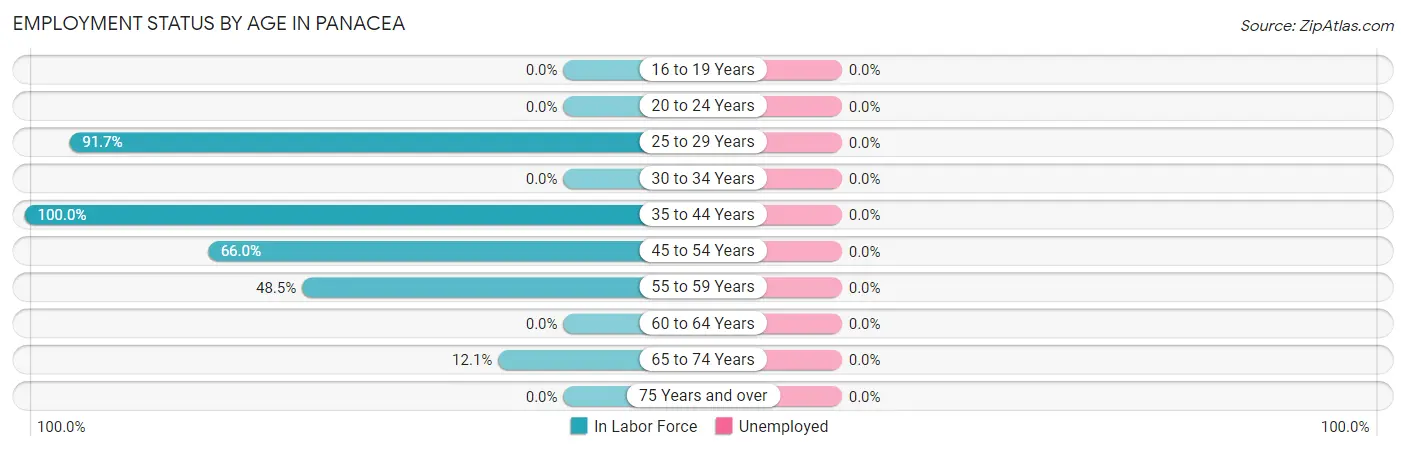
| Age Bracket | In Labor Force | Unemployed |
| 16 to 19 Years | 0 (0.0%) | 0 (0.0%) |
| 20 to 24 Years | 0 (0.0%) | 0 (0.0%) |
| 25 to 29 Years | 200 (91.7%) | 0 (0.0%) |
| 30 to 34 Years | 0 (0.0%) | 0 (0.0%) |
| 35 to 44 Years | 34 (100.0%) | 0 (0.0%) |
| 45 to 54 Years | 128 (66.0%) | 0 (0.0%) |
| 55 to 59 Years | 50 (48.5%) | 0 (0.0%) |
| 60 to 64 Years | 0 (0.0%) | 0 (0.0%) |
| 65 to 74 Years | 24 (12.1%) | 0 (0.0%) |
| 75 Years and over | 0 (0.0%) | 0 (0.0%) |
| Total | 436 (46.1%) | 0 (0.0%) |
Employment Status by Educational Attainment in Panacea
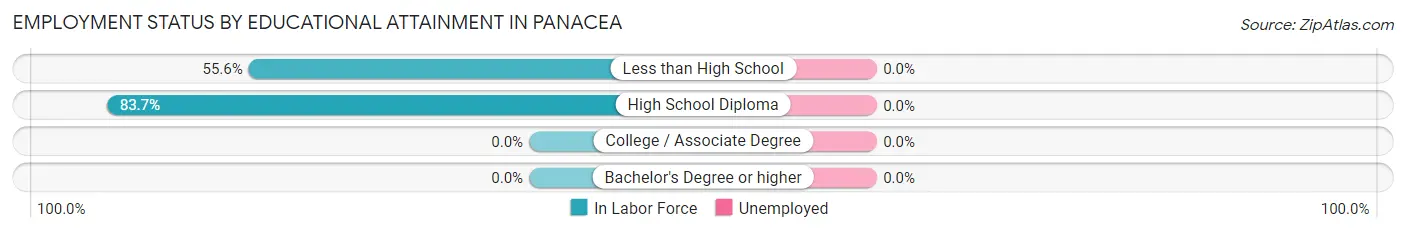
| Educational Attainment | In Labor Force | Unemployed |
| Less than High School | 140 (55.6%) | 0 (0.0%) |
| High School Diploma | 272 (83.7%) | 0 (0.0%) |
| College / Associate Degree | 0 (0.0%) | 0 (0.0%) |
| Bachelor's Degree or higher | 0 (0.0%) | 0 (0.0%) |
| Total | 412 (71.4%) | 0 (0.0%) |
Employment Occupations by Sex in Panacea
Management, Business, Science and Arts Occupations
The most common Management, Business, Science and Arts occupations in Panacea are Health Diagnosing & Treating (24 | 5.5%), and Health Technologists (24 | 5.5%).
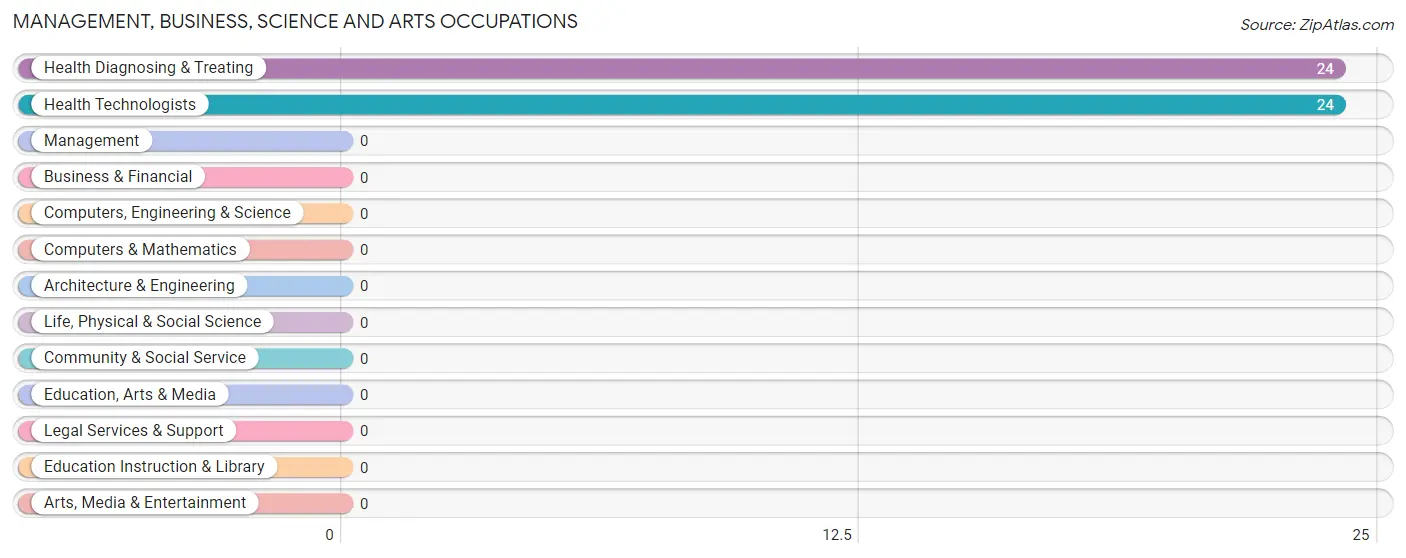
Management, Business, Science and Arts Occupations by Sex
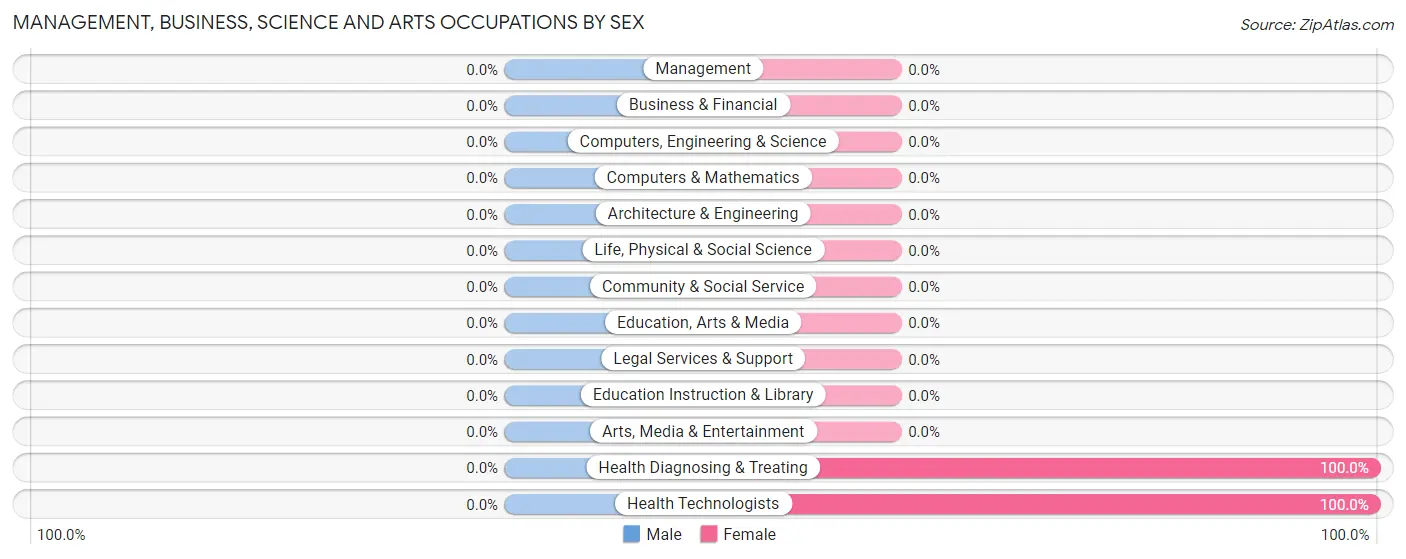
| Occupation | Male | Female |
| Management | 0 (0.0%) | 0 (0.0%) |
| Business & Financial | 0 (0.0%) | 0 (0.0%) |
| Computers, Engineering & Science | 0 (0.0%) | 0 (0.0%) |
| Computers & Mathematics | 0 (0.0%) | 0 (0.0%) |
| Architecture & Engineering | 0 (0.0%) | 0 (0.0%) |
| Life, Physical & Social Science | 0 (0.0%) | 0 (0.0%) |
| Community & Social Service | 0 (0.0%) | 0 (0.0%) |
| Education, Arts & Media | 0 (0.0%) | 0 (0.0%) |
| Legal Services & Support | 0 (0.0%) | 0 (0.0%) |
| Education Instruction & Library | 0 (0.0%) | 0 (0.0%) |
| Arts, Media & Entertainment | 0 (0.0%) | 0 (0.0%) |
| Health Diagnosing & Treating | 0 (0.0%) | 24 (100.0%) |
| Health Technologists | 0 (0.0%) | 24 (100.0%) |
| Total (Category) | 0 (0.0%) | 24 (100.0%) |
| Total (Overall) | 288 (66.1%) | 148 (33.9%) |
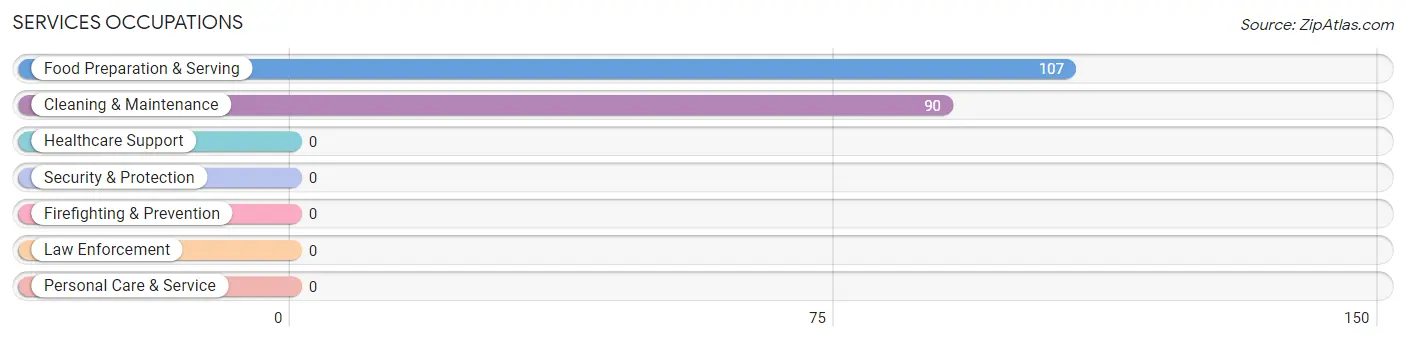
Services Occupations
The most common Services occupations in Panacea are Food Preparation & Serving (107 | 24.5%), and Cleaning & Maintenance (90 | 20.6%).
Services Occupations by Sex
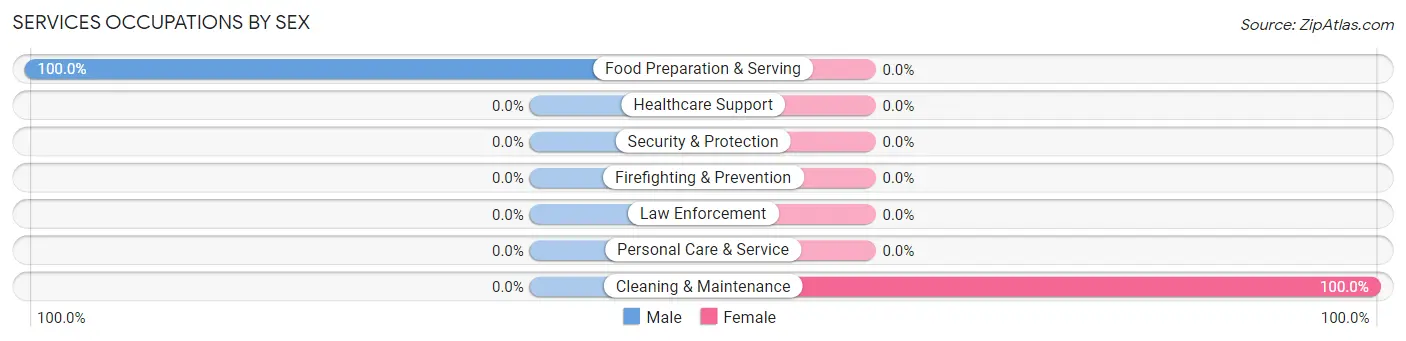
| Occupation | Male | Female |
| Healthcare Support | 0 (0.0%) | 0 (0.0%) |
| Security & Protection | 0 (0.0%) | 0 (0.0%) |
| Firefighting & Prevention | 0 (0.0%) | 0 (0.0%) |
| Law Enforcement | 0 (0.0%) | 0 (0.0%) |
| Food Preparation & Serving | 107 (100.0%) | 0 (0.0%) |
| Cleaning & Maintenance | 0 (0.0%) | 90 (100.0%) |
| Personal Care & Service | 0 (0.0%) | 0 (0.0%) |
| Total (Category) | 107 (54.3%) | 90 (45.7%) |
| Total (Overall) | 288 (66.1%) | 148 (33.9%) |
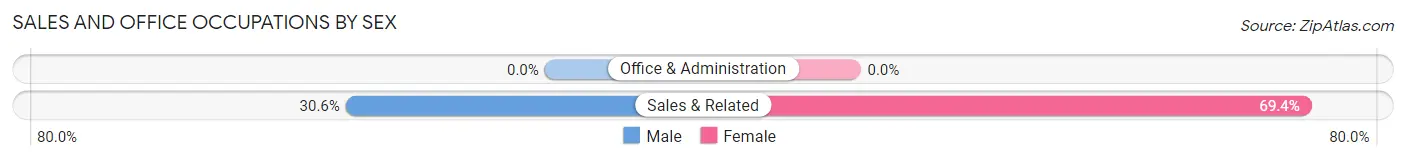
Sales and Office Occupations
The most common Sales and Office occupations in Panacea are , and Sales & Related (49 | 11.2%).
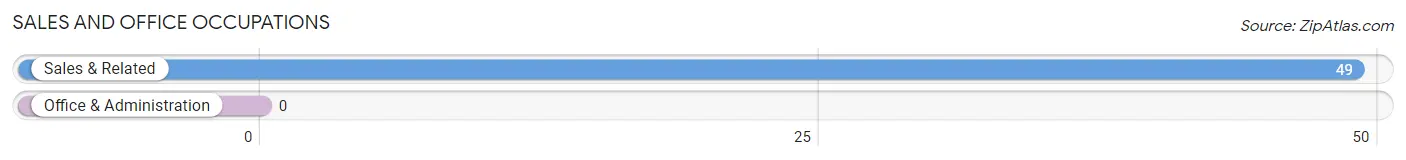
Sales and Office Occupations by Sex
| Occupation | Male | Female |
| Sales & Related | 15 (30.6%) | 34 (69.4%) |
| Office & Administration | 0 (0.0%) | 0 (0.0%) |
| Total (Category) | 15 (30.6%) | 34 (69.4%) |
| Total (Overall) | 288 (66.1%) | 148 (33.9%) |
Natural Resources, Construction and Maintenance Occupations
The most common Natural Resources, Construction and Maintenance occupations in Panacea are Farming, Fishing & Forestry (110 | 25.2%), Construction & Extraction (30 | 6.9%), and Installation, Maintenance & Repair (26 | 6.0%).
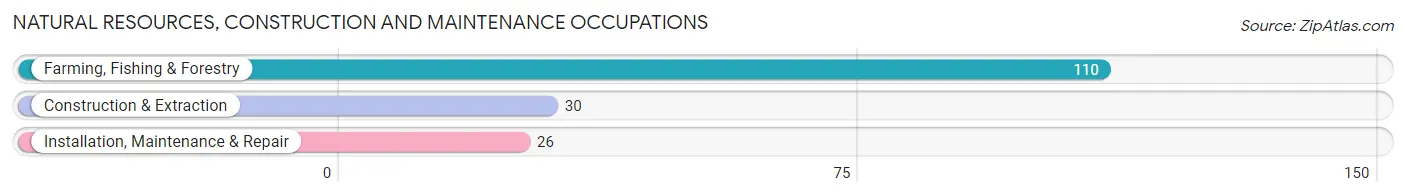
Natural Resources, Construction and Maintenance Occupations by Sex

| Occupation | Male | Female |
| Farming, Fishing & Forestry | 110 (100.0%) | 0 (0.0%) |
| Construction & Extraction | 30 (100.0%) | 0 (0.0%) |
| Installation, Maintenance & Repair | 26 (100.0%) | 0 (0.0%) |
| Total (Category) | 166 (100.0%) | 0 (0.0%) |
| Total (Overall) | 288 (66.1%) | 148 (33.9%) |
Production, Transportation and Moving Occupations
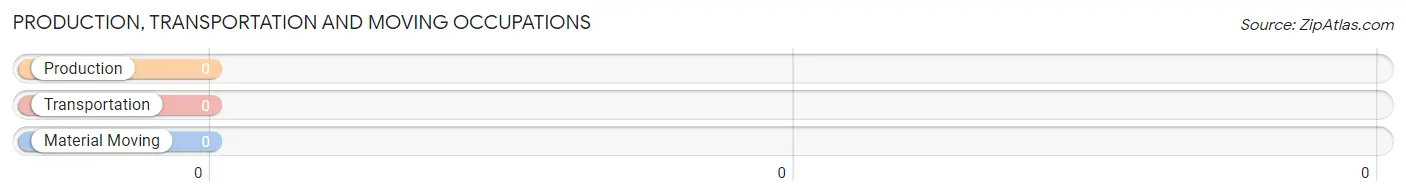
Production, Transportation and Moving Occupations by Sex
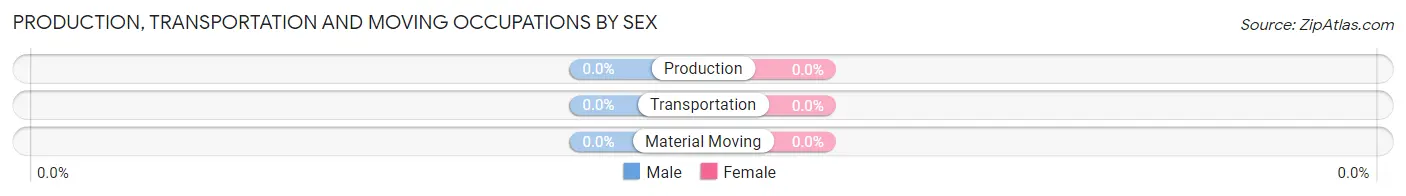
| Occupation | Male | Female |
| Production | 0 (0.0%) | 0 (0.0%) |
| Transportation | 0 (0.0%) | 0 (0.0%) |
| Material Moving | 0 (0.0%) | 0 (0.0%) |
| Total (Category) | 0 (0.0%) | 0 (0.0%) |
| Total (Overall) | 288 (66.1%) | 148 (33.9%) |
Employment Industries by Sex in Panacea
Employment Industries in Panacea
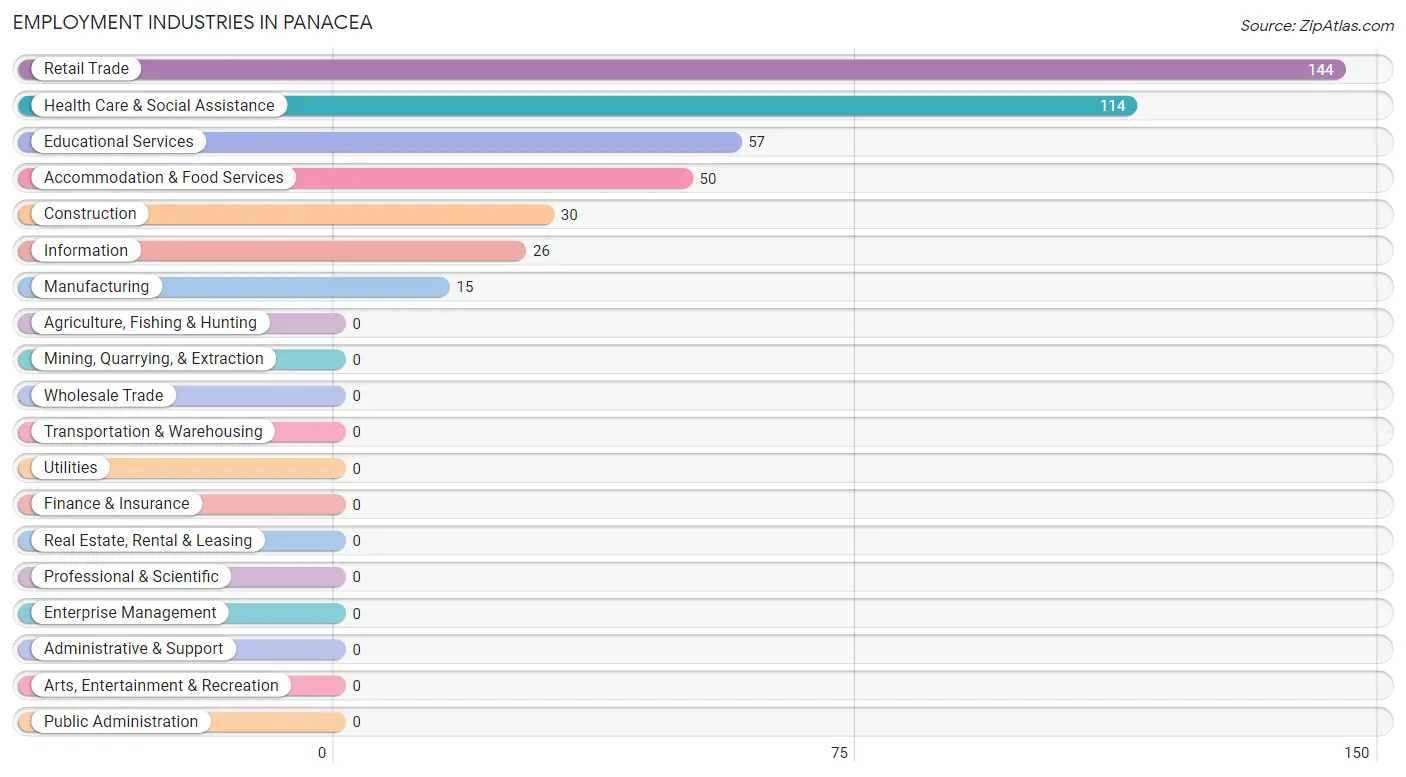
The major employment industries in Panacea include Retail Trade (144 | 33.0%), Health Care & Social Assistance (114 | 26.2%), Educational Services (57 | 13.1%), Accommodation & Food Services (50 | 11.5%), and Construction (30 | 6.9%).
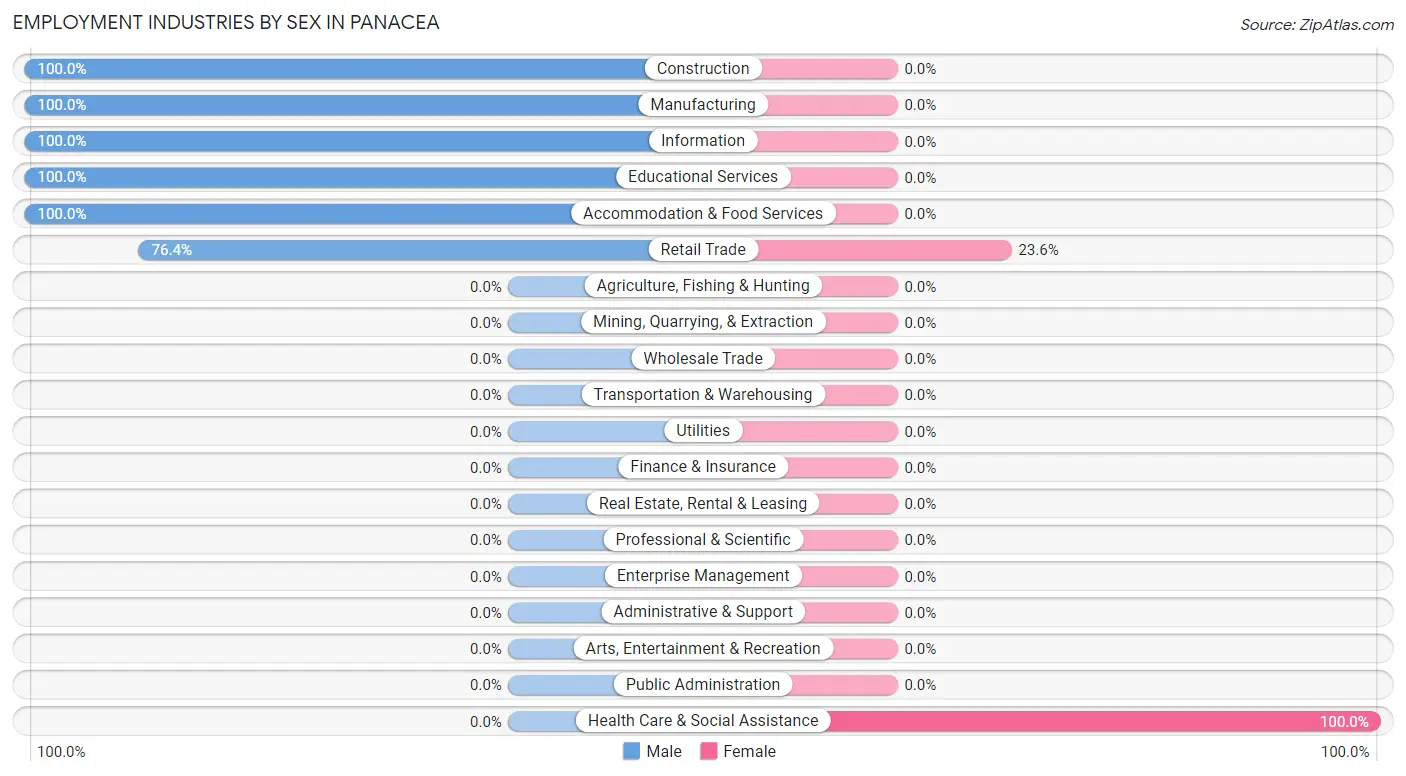
Employment Industries by Sex in Panacea
The Panacea industries that see more men than women are Construction (100.0%), Manufacturing (100.0%), and Information (100.0%), whereas the industries that tend to have a higher number of women are Health Care & Social Assistance (100.0%), and Retail Trade (23.6%).
| Industry | Male | Female |
| Agriculture, Fishing & Hunting | 0 (0.0%) | 0 (0.0%) |
| Mining, Quarrying, & Extraction | 0 (0.0%) | 0 (0.0%) |
| Construction | 30 (100.0%) | 0 (0.0%) |
| Manufacturing | 15 (100.0%) | 0 (0.0%) |
| Wholesale Trade | 0 (0.0%) | 0 (0.0%) |
| Retail Trade | 110 (76.4%) | 34 (23.6%) |
| Transportation & Warehousing | 0 (0.0%) | 0 (0.0%) |
| Utilities | 0 (0.0%) | 0 (0.0%) |
| Information | 26 (100.0%) | 0 (0.0%) |
| Finance & Insurance | 0 (0.0%) | 0 (0.0%) |
| Real Estate, Rental & Leasing | 0 (0.0%) | 0 (0.0%) |
| Professional & Scientific | 0 (0.0%) | 0 (0.0%) |
| Enterprise Management | 0 (0.0%) | 0 (0.0%) |
| Administrative & Support | 0 (0.0%) | 0 (0.0%) |
| Educational Services | 57 (100.0%) | 0 (0.0%) |
| Health Care & Social Assistance | 0 (0.0%) | 114 (100.0%) |
| Arts, Entertainment & Recreation | 0 (0.0%) | 0 (0.0%) |
| Accommodation & Food Services | 50 (100.0%) | 0 (0.0%) |
| Public Administration | 0 (0.0%) | 0 (0.0%) |
| Total | 288 (66.1%) | 148 (33.9%) |
Education in Panacea
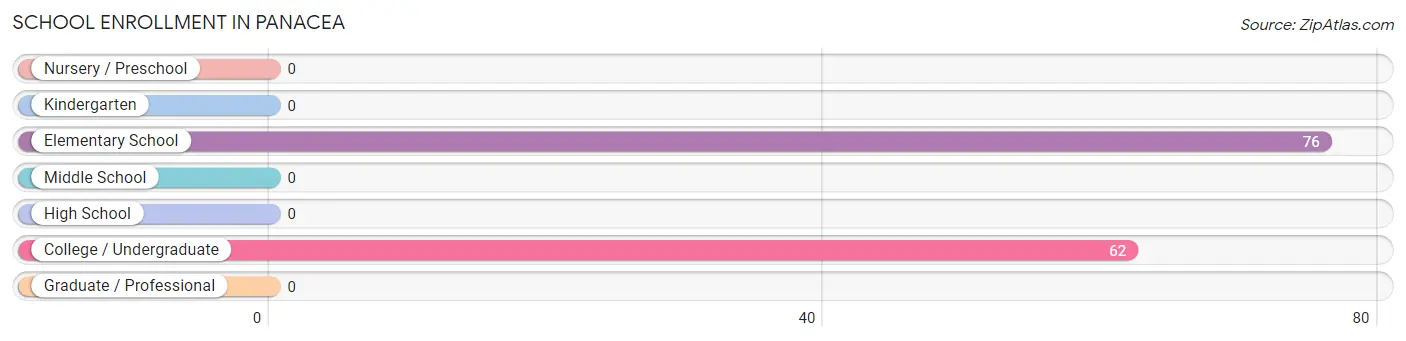
School Enrollment in Panacea
The most common levels of schooling among the 138 students in Panacea are elementary school (76 | 55.1%), and college / undergraduate (62 | 44.9%).
| School Level | # Students | % Students |
| Nursery / Preschool | 0 | 0.0% |
| Kindergarten | 0 | 0.0% |
| Elementary School | 76 | 55.1% |
| Middle School | 0 | 0.0% |
| High School | 0 | 0.0% |
| College / Undergraduate | 62 | 44.9% |
| Graduate / Professional | 0 | 0.0% |
| Total | 138 | 100.0% |
School Enrollment by Age by Funding Source in Panacea
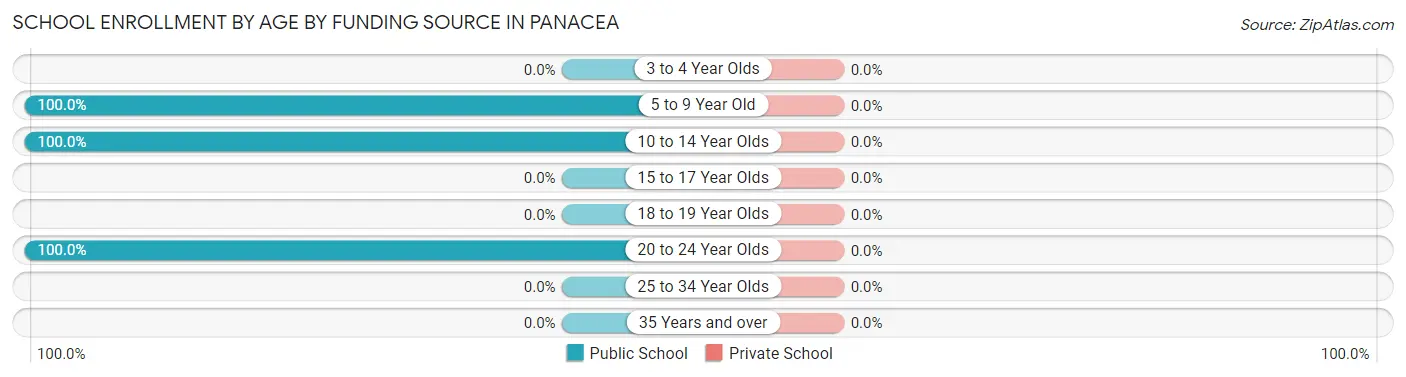
| Age Bracket | Public School | Private School |
| 3 to 4 Year Olds | 0 (0.0%) | 0 (0.0%) |
| 5 to 9 Year Old | 34 (100.0%) | 0 (0.0%) |
| 10 to 14 Year Olds | 42 (100.0%) | 0 (0.0%) |
| 15 to 17 Year Olds | 0 (0.0%) | 0 (0.0%) |
| 18 to 19 Year Olds | 0 (0.0%) | 0 (0.0%) |
| 20 to 24 Year Olds | 62 (100.0%) | 0 (0.0%) |
| 25 to 34 Year Olds | 0 (0.0%) | 0 (0.0%) |
| 35 Years and over | 0 (0.0%) | 0 (0.0%) |
| Total | 138 (100.0%) | 0 (0.0%) |
Educational Attainment by Field of Study in Panacea
Science & technology (121 | 88.3%), and social sciences (16 | 11.7%) are the most common fields of study among 137 individuals in Panacea who have obtained a bachelor's degree or higher.
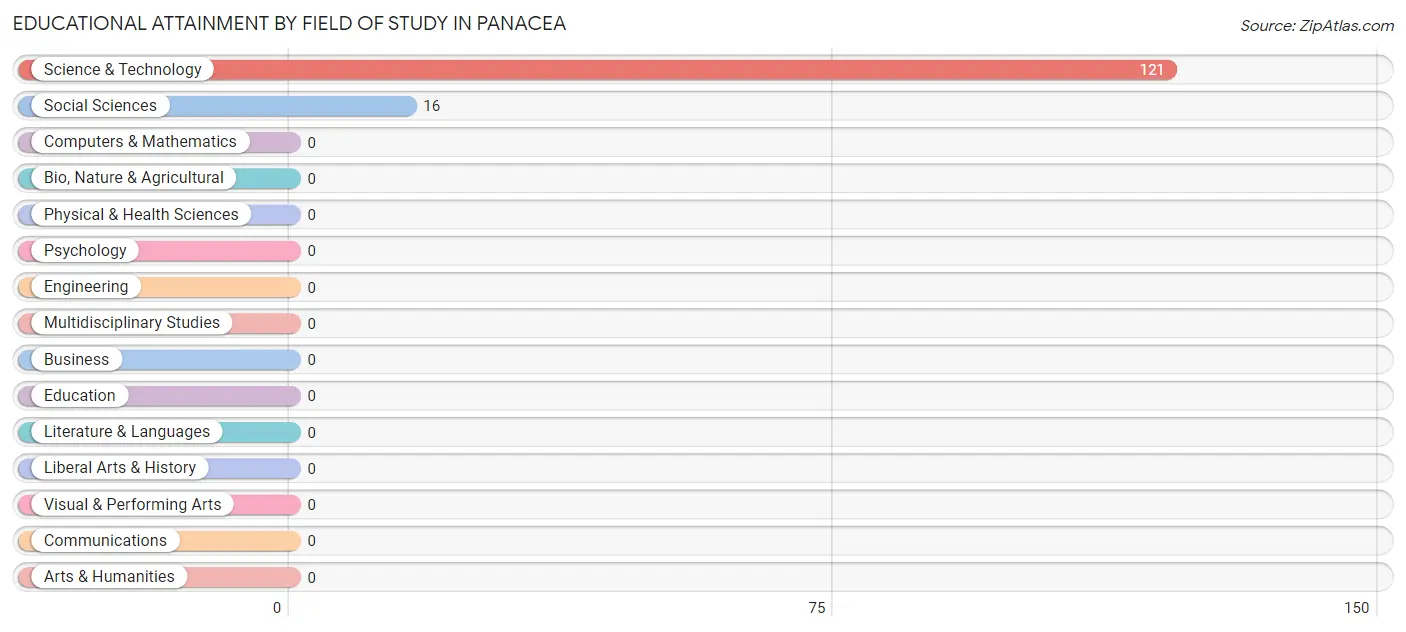
| Field of Study | # Graduates | % Graduates |
| Computers & Mathematics | 0 | 0.0% |
| Bio, Nature & Agricultural | 0 | 0.0% |
| Physical & Health Sciences | 0 | 0.0% |
| Psychology | 0 | 0.0% |
| Social Sciences | 16 | 11.7% |
| Engineering | 0 | 0.0% |
| Multidisciplinary Studies | 0 | 0.0% |
| Science & Technology | 121 | 88.3% |
| Business | 0 | 0.0% |
| Education | 0 | 0.0% |
| Literature & Languages | 0 | 0.0% |
| Liberal Arts & History | 0 | 0.0% |
| Visual & Performing Arts | 0 | 0.0% |
| Communications | 0 | 0.0% |
| Arts & Humanities | 0 | 0.0% |
| Total | 137 | 100.0% |
Transportation & Commute in Panacea
Vehicle Availability by Sex in Panacea
The most prevalent vehicle ownership categories in Panacea are males with 2 vehicles (155, accounting for 65.1%) and females with 2 vehicles (0, making up 104.7%).
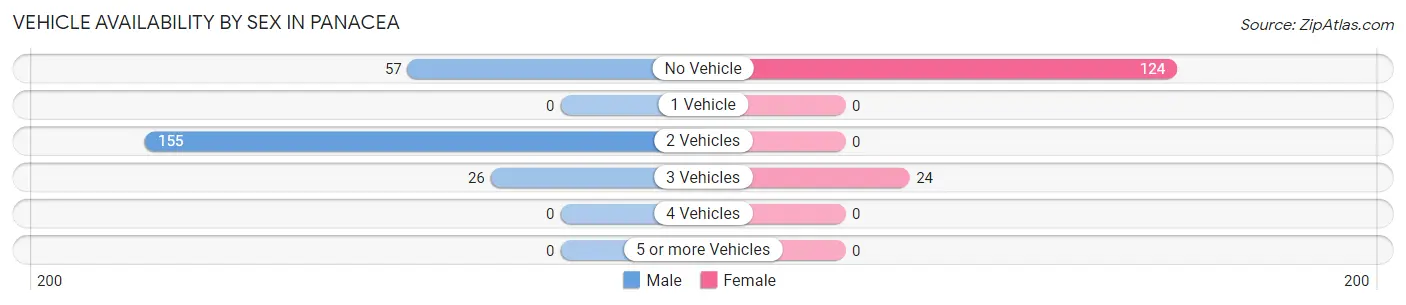
| Vehicles Available | Male | Female |
| No Vehicle | 57 (23.9%) | 124 (83.8%) |
| 1 Vehicle | 0 (0.0%) | 0 (0.0%) |
| 2 Vehicles | 155 (65.1%) | 0 (0.0%) |
| 3 Vehicles | 26 (10.9%) | 24 (16.2%) |
| 4 Vehicles | 0 (0.0%) | 0 (0.0%) |
| 5 or more Vehicles | 0 (0.0%) | 0 (0.0%) |
| Total | 238 (100.0%) | 148 (100.0%) |
Commute Time in Panacea
The most frequently occuring commute durations in Panacea are 30 to 34 minutes (167 commuters, 46.9%), 5 to 9 minutes (114 commuters, 32.0%), and 15 to 19 minutes (60 commuters, 16.9%).
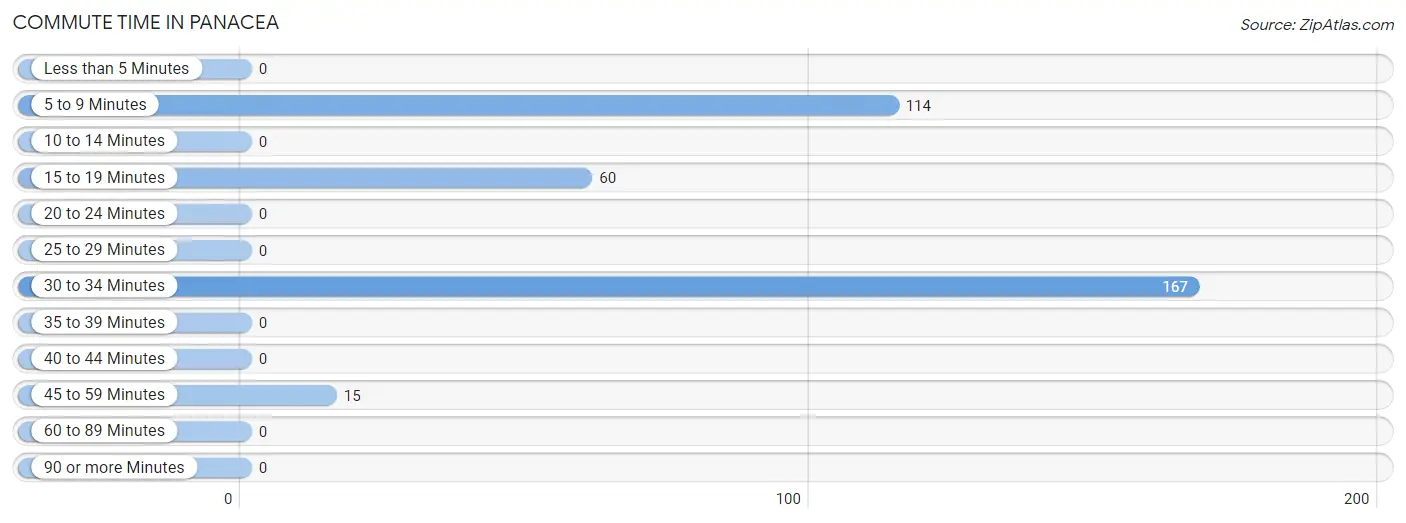
| Commute Time | # Commuters | % Commuters |
| Less than 5 Minutes | 0 | 0.0% |
| 5 to 9 Minutes | 114 | 32.0% |
| 10 to 14 Minutes | 0 | 0.0% |
| 15 to 19 Minutes | 60 | 16.9% |
| 20 to 24 Minutes | 0 | 0.0% |
| 25 to 29 Minutes | 0 | 0.0% |
| 30 to 34 Minutes | 167 | 46.9% |
| 35 to 39 Minutes | 0 | 0.0% |
| 40 to 44 Minutes | 0 | 0.0% |
| 45 to 59 Minutes | 15 | 4.2% |
| 60 to 89 Minutes | 0 | 0.0% |
| 90 or more Minutes | 0 | 0.0% |
Commute Time by Sex in Panacea
The most common commute times in Panacea are 30 to 34 minutes (167 commuters, 80.3%) for males and 5 to 9 minutes (114 commuters, 77.0%) for females.
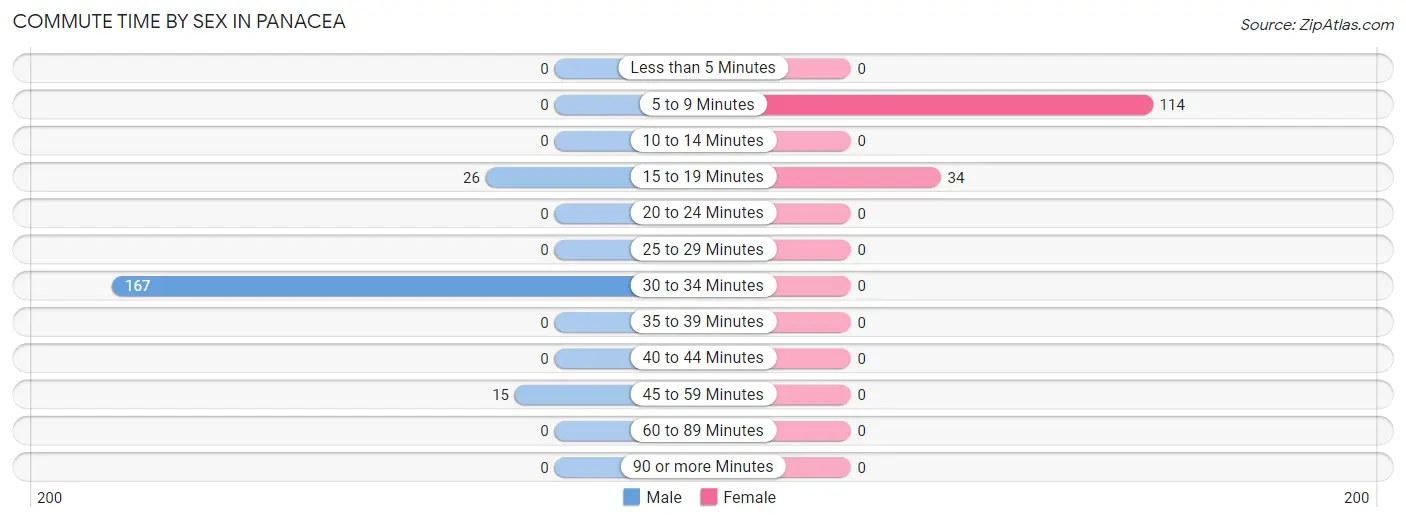
| Commute Time | Male | Female |
| Less than 5 Minutes | 0 (0.0%) | 0 (0.0%) |
| 5 to 9 Minutes | 0 (0.0%) | 114 (77.0%) |
| 10 to 14 Minutes | 0 (0.0%) | 0 (0.0%) |
| 15 to 19 Minutes | 26 (12.5%) | 34 (23.0%) |
| 20 to 24 Minutes | 0 (0.0%) | 0 (0.0%) |
| 25 to 29 Minutes | 0 (0.0%) | 0 (0.0%) |
| 30 to 34 Minutes | 167 (80.3%) | 0 (0.0%) |
| 35 to 39 Minutes | 0 (0.0%) | 0 (0.0%) |
| 40 to 44 Minutes | 0 (0.0%) | 0 (0.0%) |
| 45 to 59 Minutes | 15 (7.2%) | 0 (0.0%) |
| 60 to 89 Minutes | 0 (0.0%) | 0 (0.0%) |
| 90 or more Minutes | 0 (0.0%) | 0 (0.0%) |
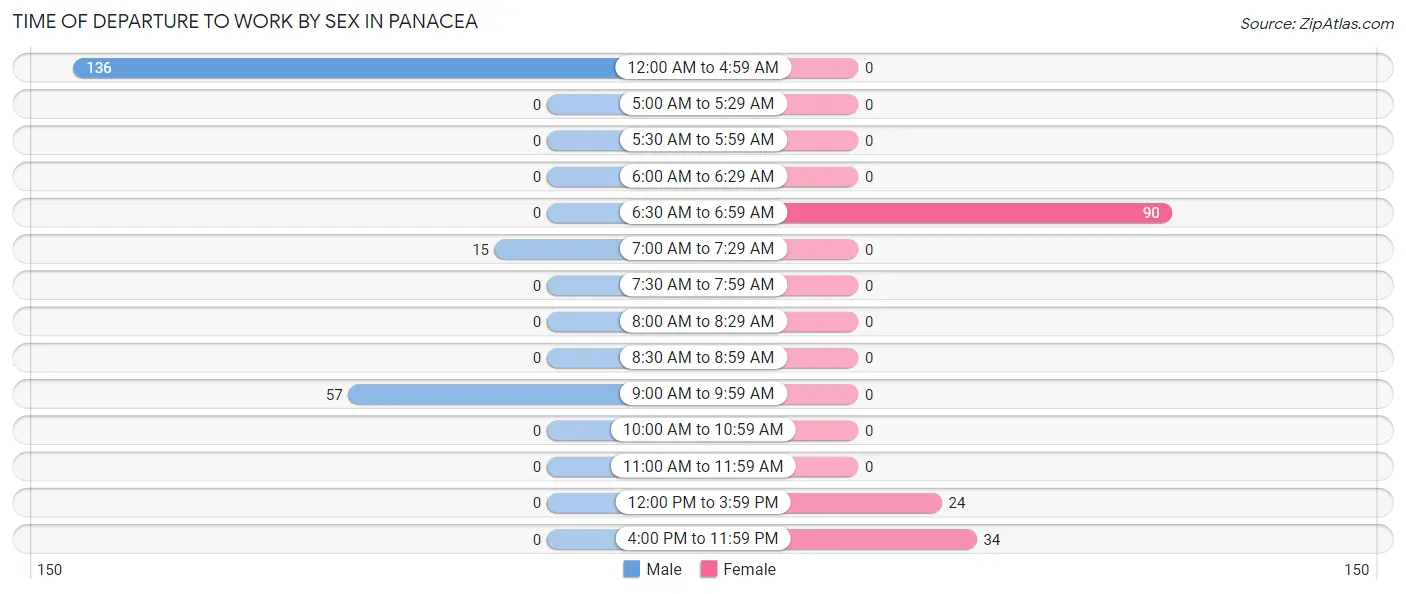
Time of Departure to Work by Sex in Panacea
The most frequent times of departure to work in Panacea are 12:00 AM to 4:59 AM (136, 65.4%) for males and 6:30 AM to 6:59 AM (90, 60.8%) for females.
| Time of Departure | Male | Female |
| 12:00 AM to 4:59 AM | 136 (65.4%) | 0 (0.0%) |
| 5:00 AM to 5:29 AM | 0 (0.0%) | 0 (0.0%) |
| 5:30 AM to 5:59 AM | 0 (0.0%) | 0 (0.0%) |
| 6:00 AM to 6:29 AM | 0 (0.0%) | 0 (0.0%) |
| 6:30 AM to 6:59 AM | 0 (0.0%) | 90 (60.8%) |
| 7:00 AM to 7:29 AM | 15 (7.2%) | 0 (0.0%) |
| 7:30 AM to 7:59 AM | 0 (0.0%) | 0 (0.0%) |
| 8:00 AM to 8:29 AM | 0 (0.0%) | 0 (0.0%) |
| 8:30 AM to 8:59 AM | 0 (0.0%) | 0 (0.0%) |
| 9:00 AM to 9:59 AM | 57 (27.4%) | 0 (0.0%) |
| 10:00 AM to 10:59 AM | 0 (0.0%) | 0 (0.0%) |
| 11:00 AM to 11:59 AM | 0 (0.0%) | 0 (0.0%) |
| 12:00 PM to 3:59 PM | 0 (0.0%) | 24 (16.2%) |
| 4:00 PM to 11:59 PM | 0 (0.0%) | 34 (23.0%) |
| Total | 208 (100.0%) | 148 (100.0%) |
Housing Occupancy in Panacea
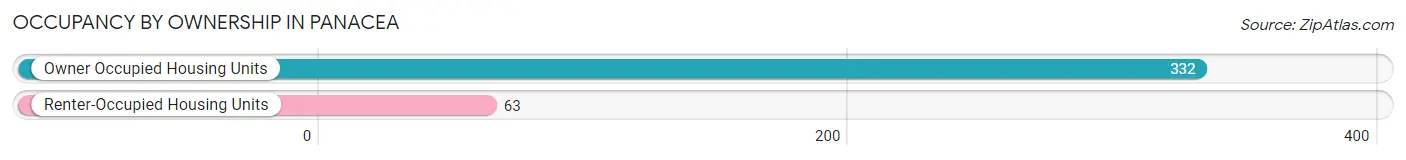
Occupancy by Ownership in Panacea
Of the total 395 dwellings in Panacea, owner-occupied units account for 332 (84.1%), while renter-occupied units make up 63 (16.0%).
| Occupancy | # Housing Units | % Housing Units |
| Owner Occupied Housing Units | 332 | 84.1% |
| Renter-Occupied Housing Units | 63 | 16.0% |
| Total Occupied Housing Units | 395 | 100.0% |
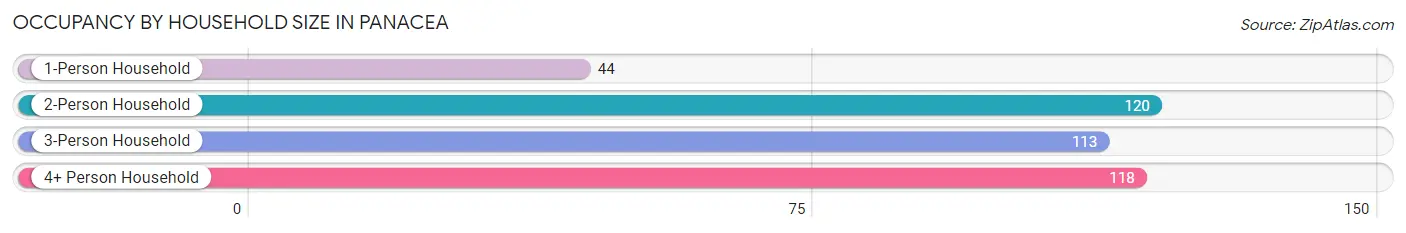
Occupancy by Household Size in Panacea
| Household Size | # Housing Units | % Housing Units |
| 1-Person Household | 44 | 11.1% |
| 2-Person Household | 120 | 30.4% |
| 3-Person Household | 113 | 28.6% |
| 4+ Person Household | 118 | 29.9% |
| Total Housing Units | 395 | 100.0% |
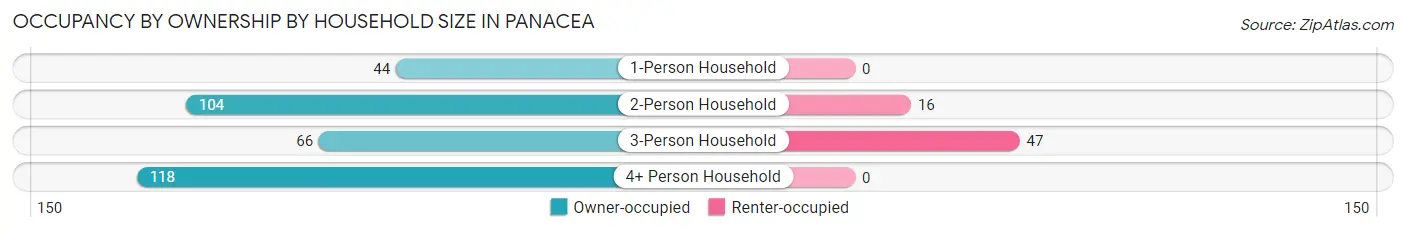
Occupancy by Ownership by Household Size in Panacea
| Household Size | Owner-occupied | Renter-occupied |
| 1-Person Household | 44 (100.0%) | 0 (0.0%) |
| 2-Person Household | 104 (86.7%) | 16 (13.3%) |
| 3-Person Household | 66 (58.4%) | 47 (41.6%) |
| 4+ Person Household | 118 (100.0%) | 0 (0.0%) |
| Total Housing Units | 332 (84.1%) | 63 (16.0%) |
Occupancy by Educational Attainment in Panacea
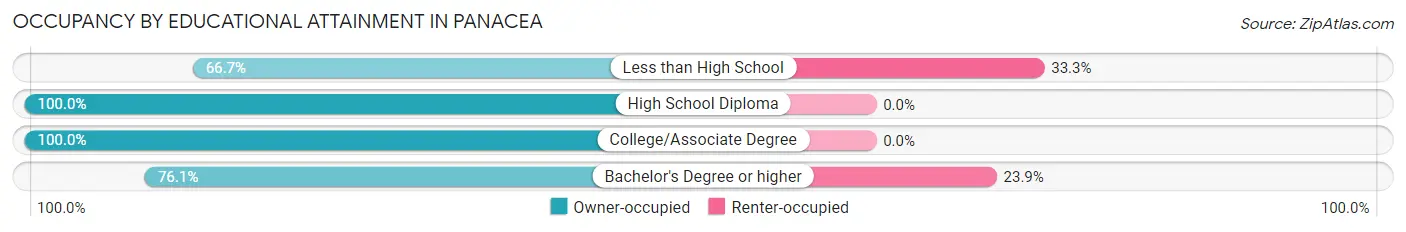
| Household Size | Owner-occupied | Renter-occupied |
| Less than High School | 94 (66.7%) | 47 (33.3%) |
| High School Diploma | 145 (100.0%) | 0 (0.0%) |
| College/Associate Degree | 42 (100.0%) | 0 (0.0%) |
| Bachelor's Degree or higher | 51 (76.1%) | 16 (23.9%) |
Occupancy by Age of Householder in Panacea
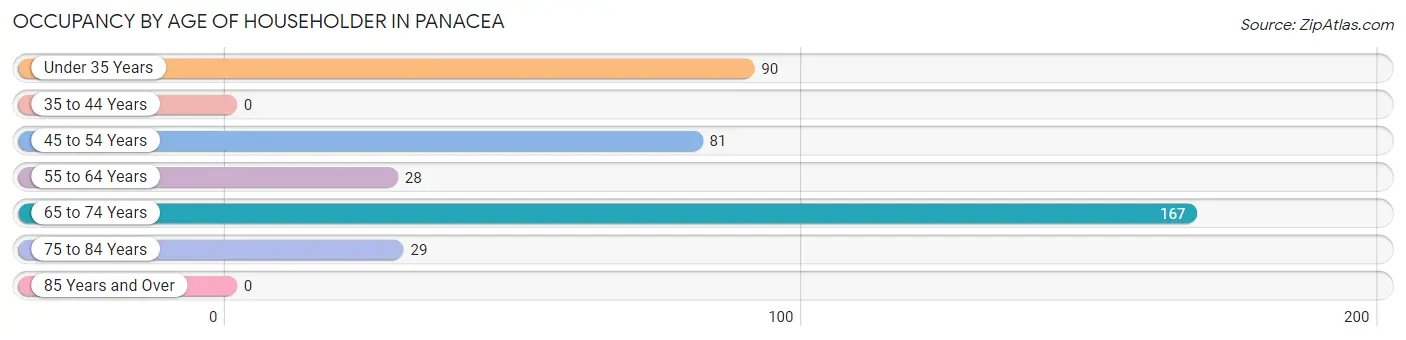
| Age Bracket | # Households | % Households |
| Under 35 Years | 90 | 22.8% |
| 35 to 44 Years | 0 | 0.0% |
| 45 to 54 Years | 81 | 20.5% |
| 55 to 64 Years | 28 | 7.1% |
| 65 to 74 Years | 167 | 42.3% |
| 75 to 84 Years | 29 | 7.3% |
| 85 Years and Over | 0 | 0.0% |
| Total | 395 | 100.0% |
Housing Finances in Panacea
Median Income by Occupancy in Panacea
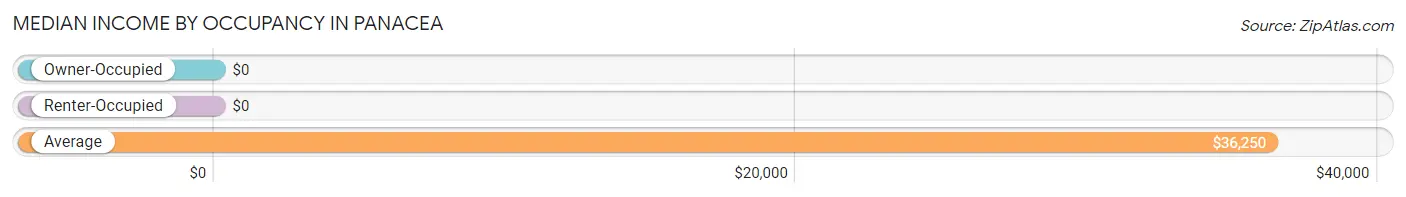
| Occupancy Type | # Households | Median Income |
| Owner-Occupied | 332 (84.1%) | $0 |
| Renter-Occupied | 63 (16.0%) | $0 |
| Average | 395 (100.0%) | $36,250 |
Occupancy by Householder Income Bracket in Panacea
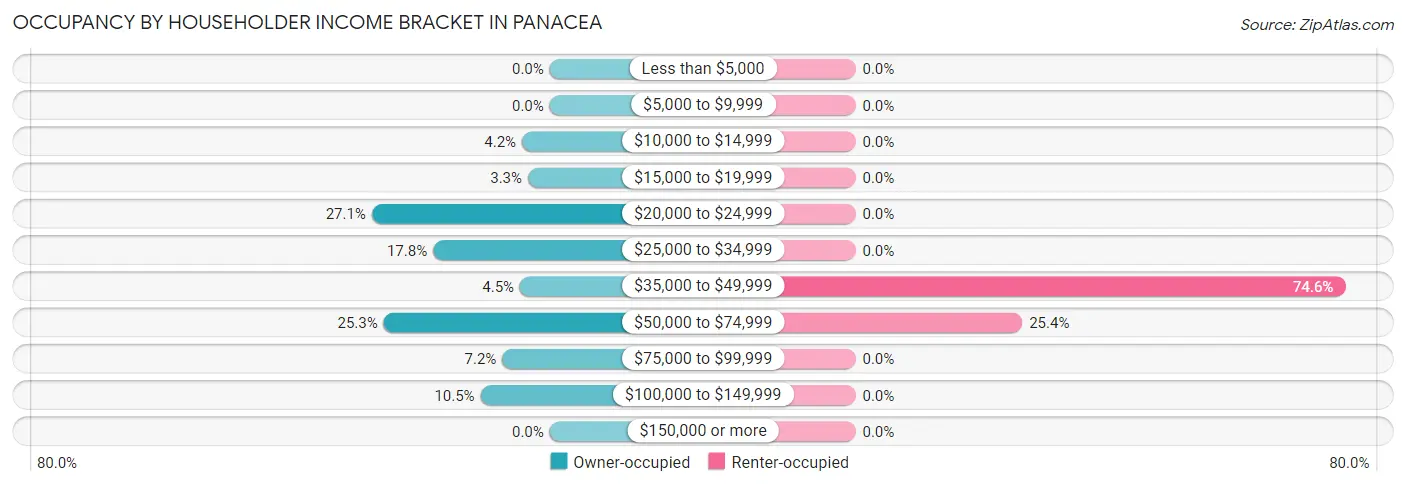
| Income Bracket | Owner-occupied | Renter-occupied |
| Less than $5,000 | 0 (0.0%) | 0 (0.0%) |
| $5,000 to $9,999 | 0 (0.0%) | 0 (0.0%) |
| $10,000 to $14,999 | 14 (4.2%) | 0 (0.0%) |
| $15,000 to $19,999 | 11 (3.3%) | 0 (0.0%) |
| $20,000 to $24,999 | 90 (27.1%) | 0 (0.0%) |
| $25,000 to $34,999 | 59 (17.8%) | 0 (0.0%) |
| $35,000 to $49,999 | 15 (4.5%) | 47 (74.6%) |
| $50,000 to $74,999 | 84 (25.3%) | 16 (25.4%) |
| $75,000 to $99,999 | 24 (7.2%) | 0 (0.0%) |
| $100,000 to $149,999 | 35 (10.5%) | 0 (0.0%) |
| $150,000 or more | 0 (0.0%) | 0 (0.0%) |
| Total | 332 (100.0%) | 63 (100.0%) |
Monthly Housing Cost Tiers in Panacea
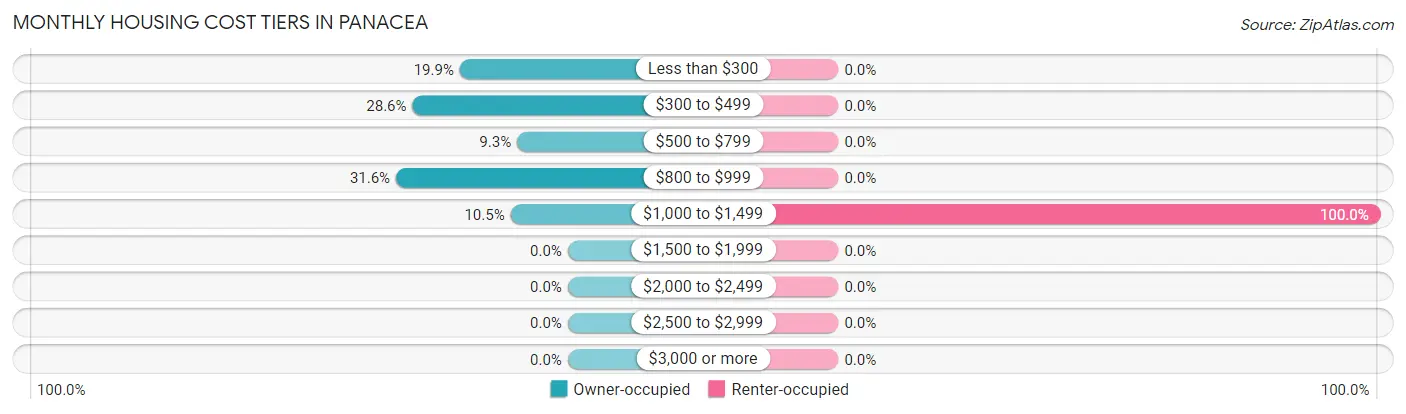
| Monthly Cost | Owner-occupied | Renter-occupied |
| Less than $300 | 66 (19.9%) | 0 (0.0%) |
| $300 to $499 | 95 (28.6%) | 0 (0.0%) |
| $500 to $799 | 31 (9.3%) | 0 (0.0%) |
| $800 to $999 | 105 (31.6%) | 0 (0.0%) |
| $1,000 to $1,499 | 35 (10.5%) | 63 (100.0%) |
| $1,500 to $1,999 | 0 (0.0%) | 0 (0.0%) |
| $2,000 to $2,499 | 0 (0.0%) | 0 (0.0%) |
| $2,500 to $2,999 | 0 (0.0%) | 0 (0.0%) |
| $3,000 or more | 0 (0.0%) | 0 (0.0%) |
| Total | 332 (100.0%) | 63 (100.0%) |
Physical Housing Characteristics in Panacea
Housing Structures in Panacea
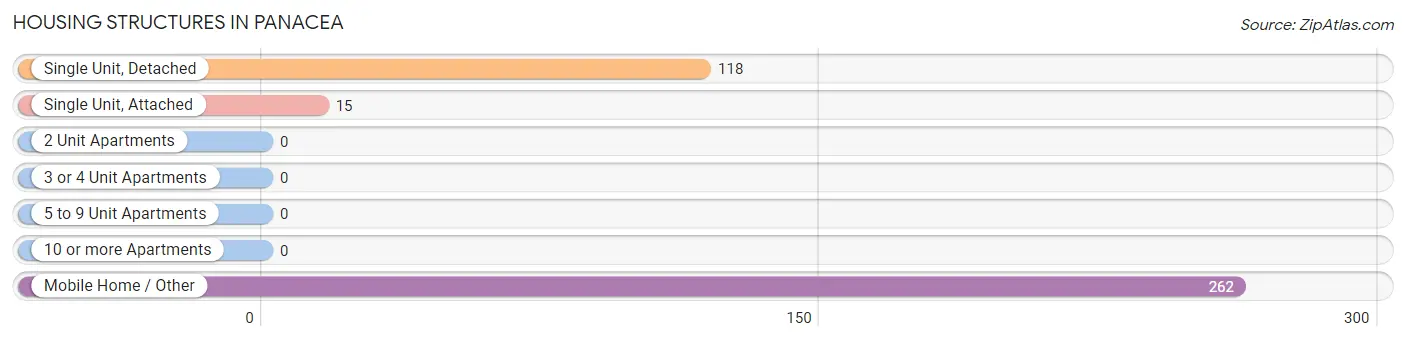
| Structure Type | # Housing Units | % Housing Units |
| Single Unit, Detached | 118 | 29.9% |
| Single Unit, Attached | 15 | 3.8% |
| 2 Unit Apartments | 0 | 0.0% |
| 3 or 4 Unit Apartments | 0 | 0.0% |
| 5 to 9 Unit Apartments | 0 | 0.0% |
| 10 or more Apartments | 0 | 0.0% |
| Mobile Home / Other | 262 | 66.3% |
| Total | 395 | 100.0% |
Housing Structures by Occupancy in Panacea
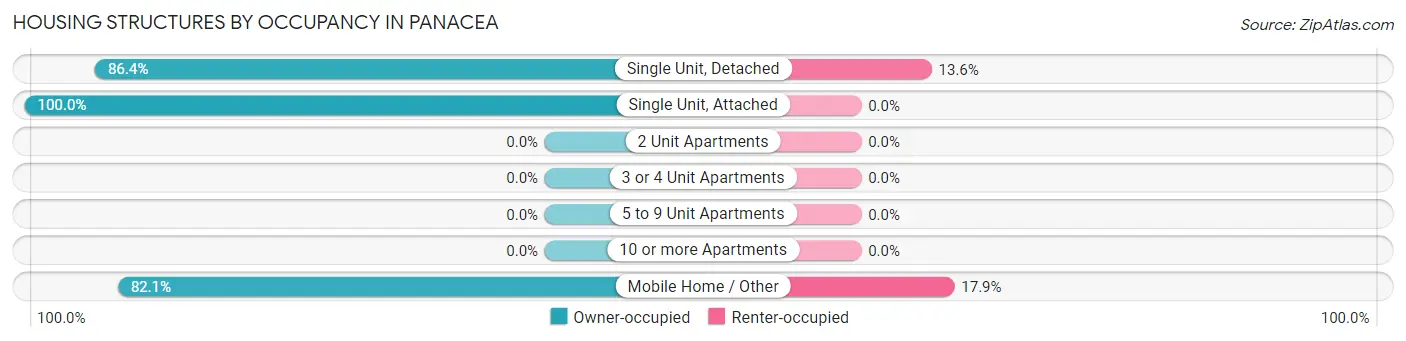
| Structure Type | Owner-occupied | Renter-occupied |
| Single Unit, Detached | 102 (86.4%) | 16 (13.6%) |
| Single Unit, Attached | 15 (100.0%) | 0 (0.0%) |
| 2 Unit Apartments | 0 (0.0%) | 0 (0.0%) |
| 3 or 4 Unit Apartments | 0 (0.0%) | 0 (0.0%) |
| 5 to 9 Unit Apartments | 0 (0.0%) | 0 (0.0%) |
| 10 or more Apartments | 0 (0.0%) | 0 (0.0%) |
| Mobile Home / Other | 215 (82.1%) | 47 (17.9%) |
| Total | 332 (84.1%) | 63 (16.0%) |
Housing Structures by Number of Rooms in Panacea
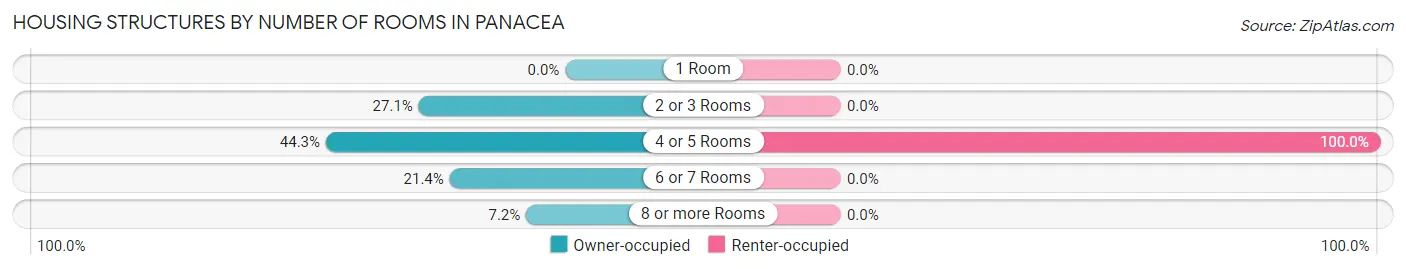
| Number of Rooms | Owner-occupied | Renter-occupied |
| 1 Room | 0 (0.0%) | 0 (0.0%) |
| 2 or 3 Rooms | 90 (27.1%) | 0 (0.0%) |
| 4 or 5 Rooms | 147 (44.3%) | 63 (100.0%) |
| 6 or 7 Rooms | 71 (21.4%) | 0 (0.0%) |
| 8 or more Rooms | 24 (7.2%) | 0 (0.0%) |
| Total | 332 (100.0%) | 63 (100.0%) |
Housing Structure by Heating Type in Panacea
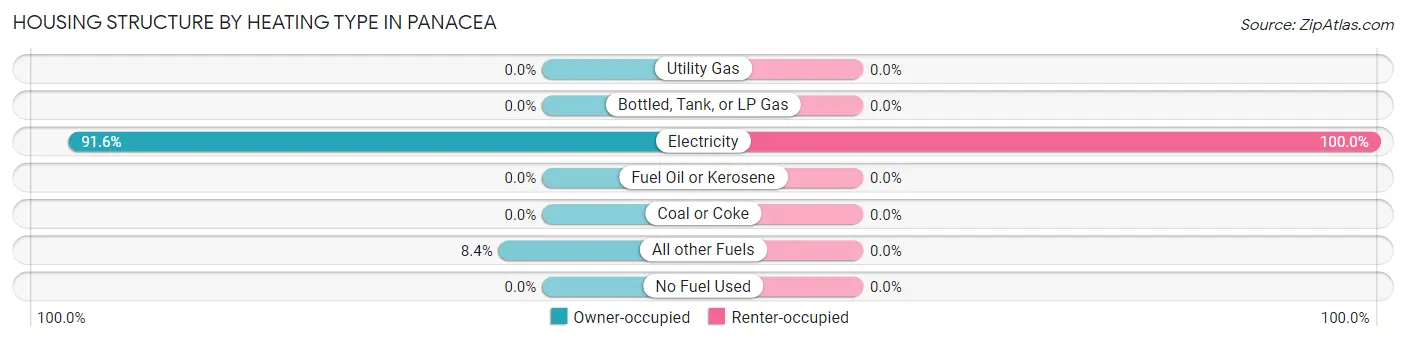
| Heating Type | Owner-occupied | Renter-occupied |
| Utility Gas | 0 (0.0%) | 0 (0.0%) |
| Bottled, Tank, or LP Gas | 0 (0.0%) | 0 (0.0%) |
| Electricity | 304 (91.6%) | 63 (100.0%) |
| Fuel Oil or Kerosene | 0 (0.0%) | 0 (0.0%) |
| Coal or Coke | 0 (0.0%) | 0 (0.0%) |
| All other Fuels | 28 (8.4%) | 0 (0.0%) |
| No Fuel Used | 0 (0.0%) | 0 (0.0%) |
| Total | 332 (100.0%) | 63 (100.0%) |
Household Vehicle Usage in Panacea
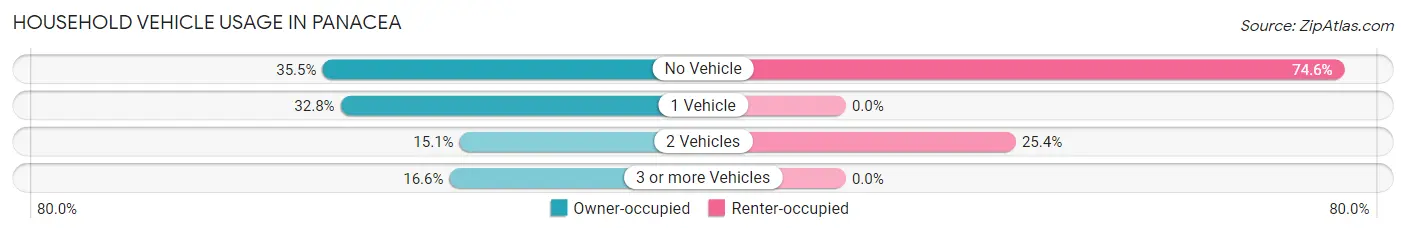
| Vehicles per Household | Owner-occupied | Renter-occupied |
| No Vehicle | 118 (35.5%) | 47 (74.6%) |
| 1 Vehicle | 109 (32.8%) | 0 (0.0%) |
| 2 Vehicles | 50 (15.1%) | 16 (25.4%) |
| 3 or more Vehicles | 55 (16.6%) | 0 (0.0%) |
| Total | 332 (100.0%) | 63 (100.0%) |
Real Estate & Mortgages in Panacea
Real Estate and Mortgage Overview in Panacea
| Characteristic | Without Mortgage | With Mortgage |
| Housing Units | 192 | 140 |
| Median Property Value | - | - |
| Median Household Income | $55,392 | $0 |
| Monthly Housing Costs | $343 | $0 |
| Real Estate Taxes | $852 | $0 |
Property Value by Mortgage Status in Panacea
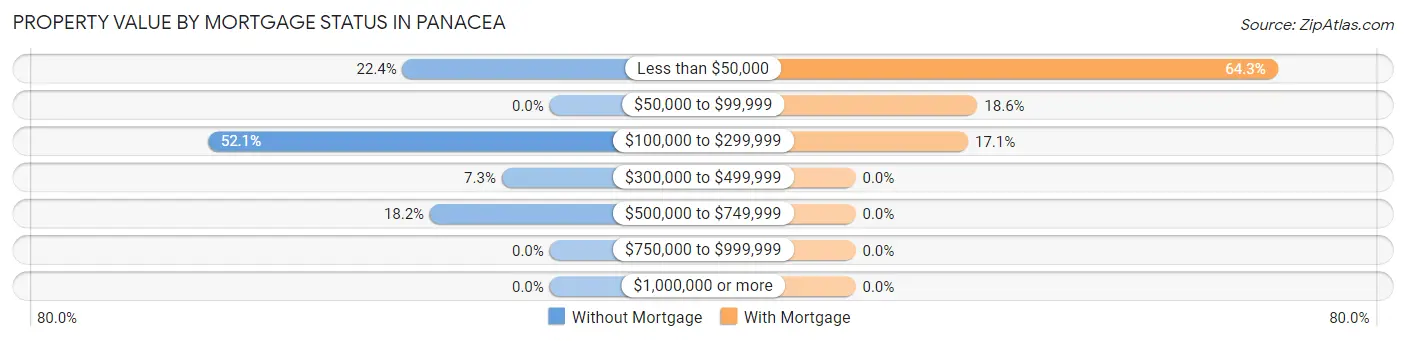
| Property Value | Without Mortgage | With Mortgage |
| Less than $50,000 | 43 (22.4%) | 90 (64.3%) |
| $50,000 to $99,999 | 0 (0.0%) | 26 (18.6%) |
| $100,000 to $299,999 | 100 (52.1%) | 24 (17.1%) |
| $300,000 to $499,999 | 14 (7.3%) | 0 (0.0%) |
| $500,000 to $749,999 | 35 (18.2%) | 0 (0.0%) |
| $750,000 to $999,999 | 0 (0.0%) | 0 (0.0%) |
| $1,000,000 or more | 0 (0.0%) | 0 (0.0%) |
| Total | 192 (100.0%) | 140 (100.0%) |
Household Income by Mortgage Status in Panacea
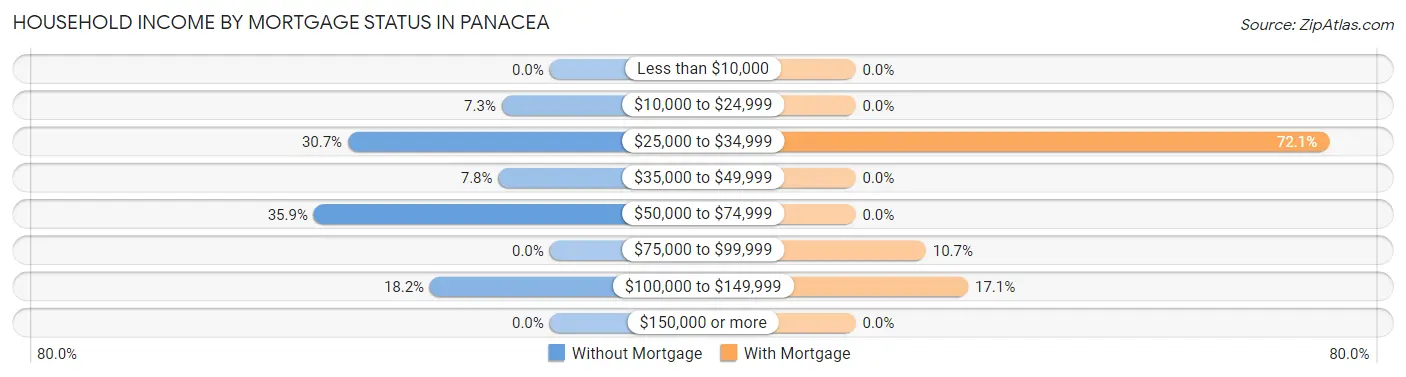
| Household Income | Without Mortgage | With Mortgage |
| Less than $10,000 | 0 (0.0%) | 0 (0.0%) |
| $10,000 to $24,999 | 14 (7.3%) | 0 (0.0%) |
| $25,000 to $34,999 | 59 (30.7%) | 101 (72.1%) |
| $35,000 to $49,999 | 15 (7.8%) | 0 (0.0%) |
| $50,000 to $74,999 | 69 (35.9%) | 0 (0.0%) |
| $75,000 to $99,999 | 0 (0.0%) | 15 (10.7%) |
| $100,000 to $149,999 | 35 (18.2%) | 24 (17.1%) |
| $150,000 or more | 0 (0.0%) | 0 (0.0%) |
| Total | 192 (100.0%) | 140 (100.0%) |
Property Value to Household Income Ratio in Panacea
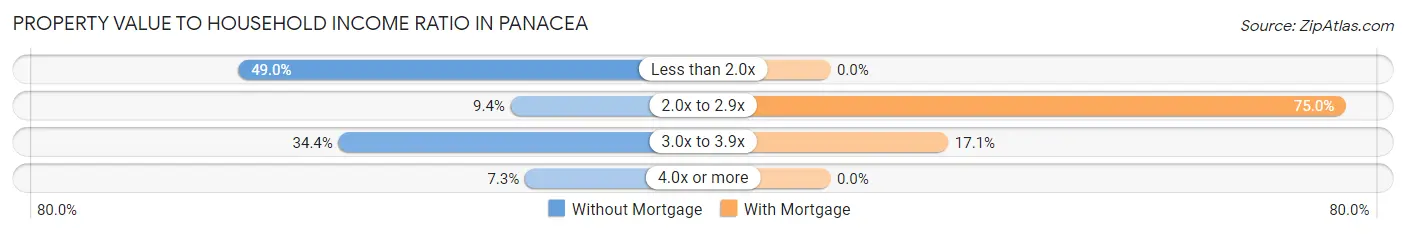
| Value-to-Income Ratio | Without Mortgage | With Mortgage |
| Less than 2.0x | 94 (49.0%) | 0 (0.0%) |
| 2.0x to 2.9x | 18 (9.4%) | 105 (75.0%) |
| 3.0x to 3.9x | 66 (34.4%) | 24 (17.1%) |
| 4.0x or more | 14 (7.3%) | 0 (0.0%) |
| Total | 192 (100.0%) | 140 (100.0%) |
Real Estate Taxes by Mortgage Status in Panacea
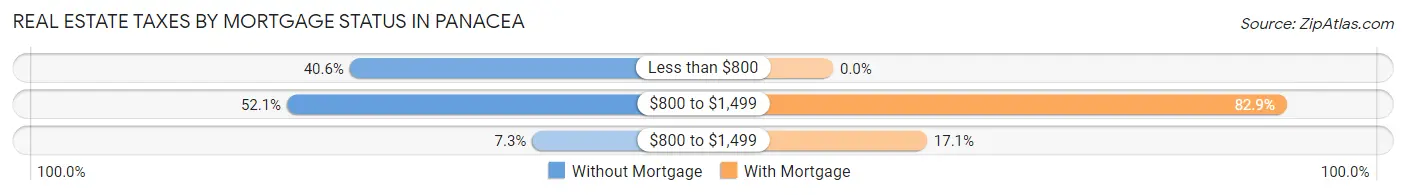
| Property Taxes | Without Mortgage | With Mortgage |
| Less than $800 | 78 (40.6%) | 0 (0.0%) |
| $800 to $1,499 | 100 (52.1%) | 116 (82.9%) |
| $800 to $1,499 | 14 (7.3%) | 24 (17.1%) |
| Total | 192 (100.0%) | 140 (100.0%) |
Health & Disability in Panacea
Health Insurance Coverage by Age in Panacea
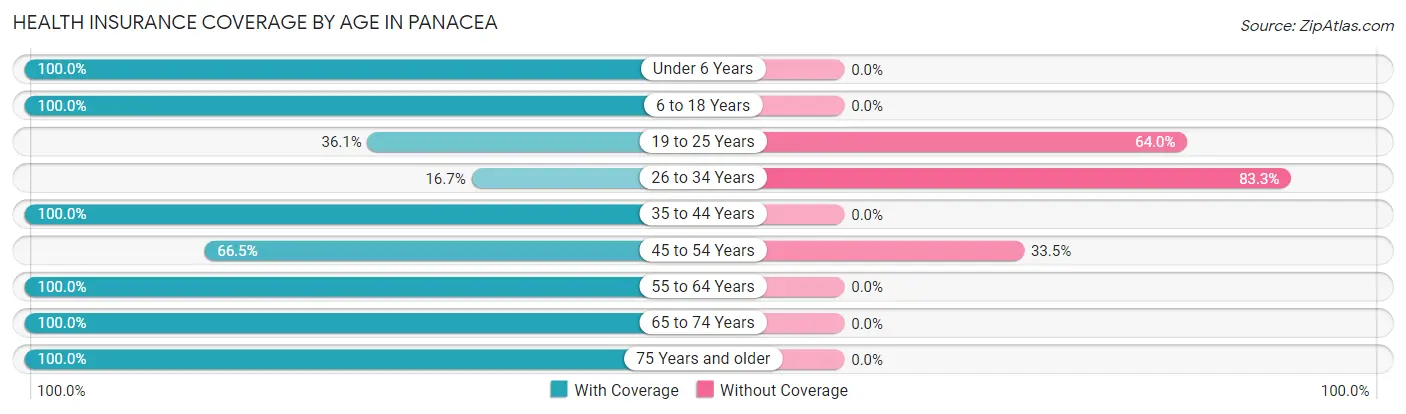
| Age Bracket | With Coverage | Without Coverage |
| Under 6 Years | 131 (100.0%) | 0 (0.0%) |
| 6 to 18 Years | 76 (100.0%) | 0 (0.0%) |
| 19 to 25 Years | 62 (36.0%) | 110 (63.9%) |
| 26 to 34 Years | 18 (16.7%) | 90 (83.3%) |
| 35 to 44 Years | 34 (100.0%) | 0 (0.0%) |
| 45 to 54 Years | 129 (66.5%) | 65 (33.5%) |
| 55 to 64 Years | 131 (100.0%) | 0 (0.0%) |
| 65 to 74 Years | 198 (100.0%) | 0 (0.0%) |
| 75 Years and older | 108 (100.0%) | 0 (0.0%) |
| Total | 887 (77.0%) | 265 (23.0%) |
Health Insurance Coverage by Citizenship Status in Panacea
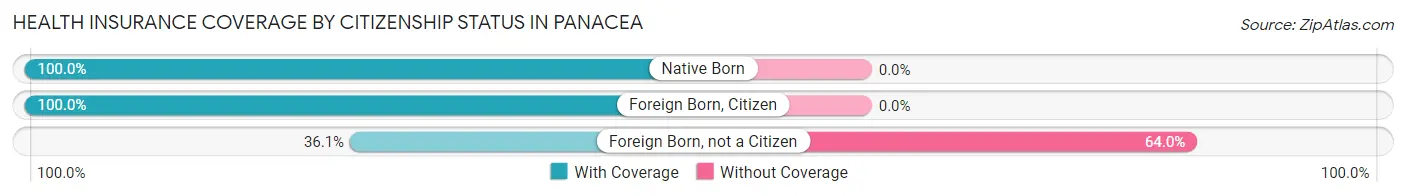
| Citizenship Status | With Coverage | Without Coverage |
| Native Born | 131 (100.0%) | 0 (0.0%) |
| Foreign Born, Citizen | 76 (100.0%) | 0 (0.0%) |
| Foreign Born, not a Citizen | 62 (36.0%) | 110 (63.9%) |
Health Insurance Coverage by Household Income in Panacea
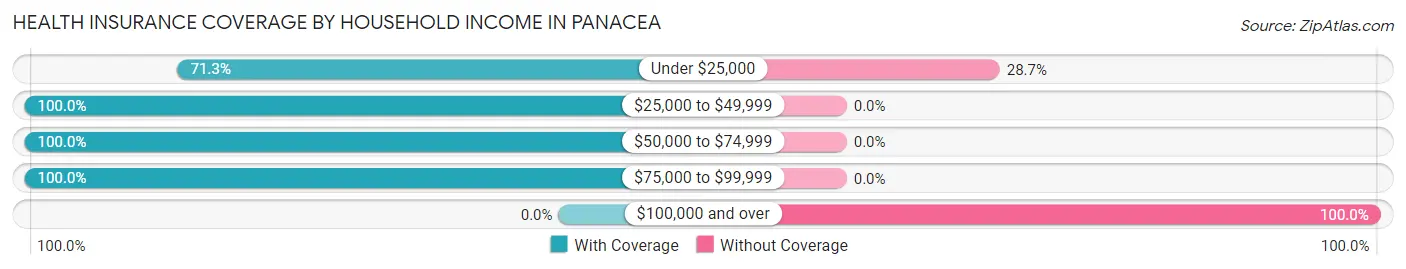
| Household Income | With Coverage | Without Coverage |
| Under $25,000 | 224 (71.3%) | 90 (28.7%) |
| $25,000 to $49,999 | 429 (100.0%) | 0 (0.0%) |
| $50,000 to $74,999 | 190 (100.0%) | 0 (0.0%) |
| $75,000 to $99,999 | 44 (100.0%) | 0 (0.0%) |
| $100,000 and over | 0 (0.0%) | 175 (100.0%) |
Public vs Private Health Insurance Coverage by Age in Panacea
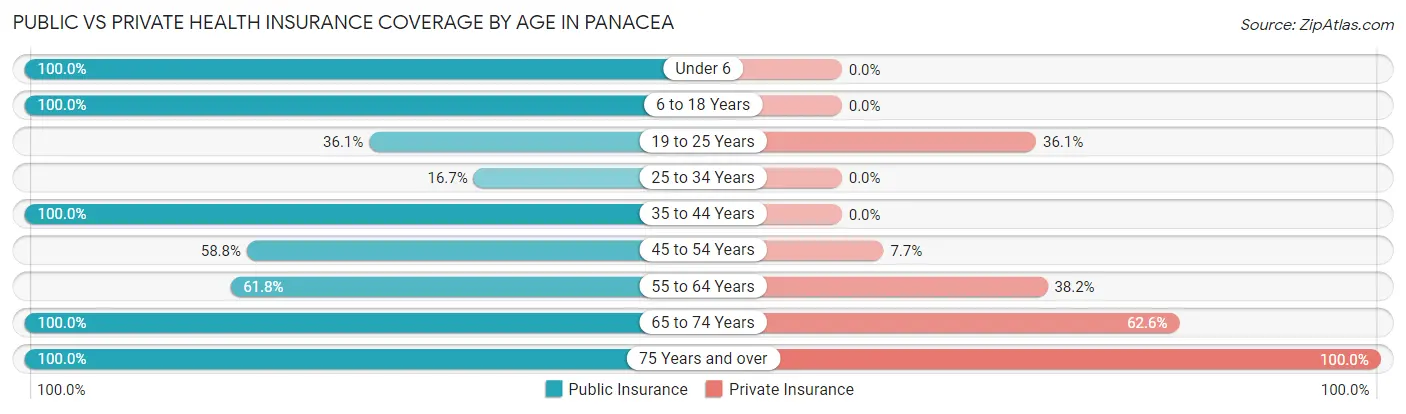
| Age Bracket | Public Insurance | Private Insurance |
| Under 6 | 131 (100.0%) | 0 (0.0%) |
| 6 to 18 Years | 76 (100.0%) | 0 (0.0%) |
| 19 to 25 Years | 62 (36.0%) | 62 (36.0%) |
| 25 to 34 Years | 18 (16.7%) | 0 (0.0%) |
| 35 to 44 Years | 34 (100.0%) | 0 (0.0%) |
| 45 to 54 Years | 114 (58.8%) | 15 (7.7%) |
| 55 to 64 Years | 81 (61.8%) | 50 (38.2%) |
| 65 to 74 Years | 198 (100.0%) | 124 (62.6%) |
| 75 Years and over | 108 (100.0%) | 108 (100.0%) |
| Total | 822 (71.4%) | 359 (31.2%) |
Disability Status by Sex by Age in Panacea
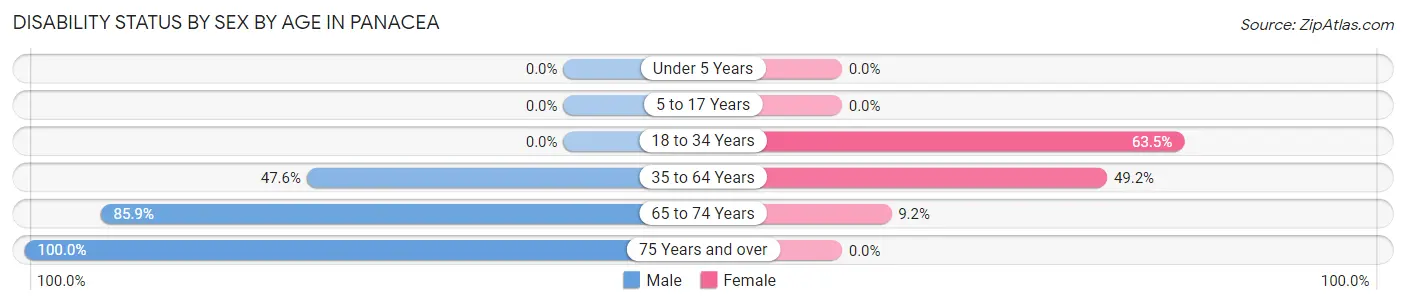
| Age Bracket | Male | Female |
| Under 5 Years | 0 (0.0%) | 0 (0.0%) |
| 5 to 17 Years | 0 (0.0%) | 0 (0.0%) |
| 18 to 34 Years | 0 (0.0%) | 108 (63.5%) |
| 35 to 64 Years | 110 (47.6%) | 63 (49.2%) |
| 65 to 74 Years | 67 (85.9%) | 11 (9.2%) |
| 75 Years and over | 93 (100.0%) | 0 (0.0%) |
Disability Class by Sex by Age in Panacea
Disability Class: Hearing Difficulty
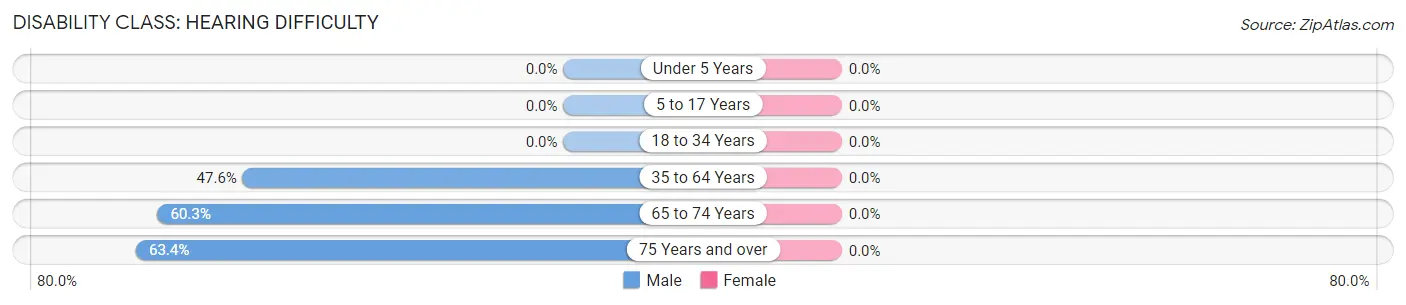
| Age Bracket | Male | Female |
| Under 5 Years | 0 (0.0%) | 0 (0.0%) |
| 5 to 17 Years | 0 (0.0%) | 0 (0.0%) |
| 18 to 34 Years | 0 (0.0%) | 0 (0.0%) |
| 35 to 64 Years | 110 (47.6%) | 0 (0.0%) |
| 65 to 74 Years | 47 (60.3%) | 0 (0.0%) |
| 75 Years and over | 59 (63.4%) | 0 (0.0%) |
Disability Class: Vision Difficulty
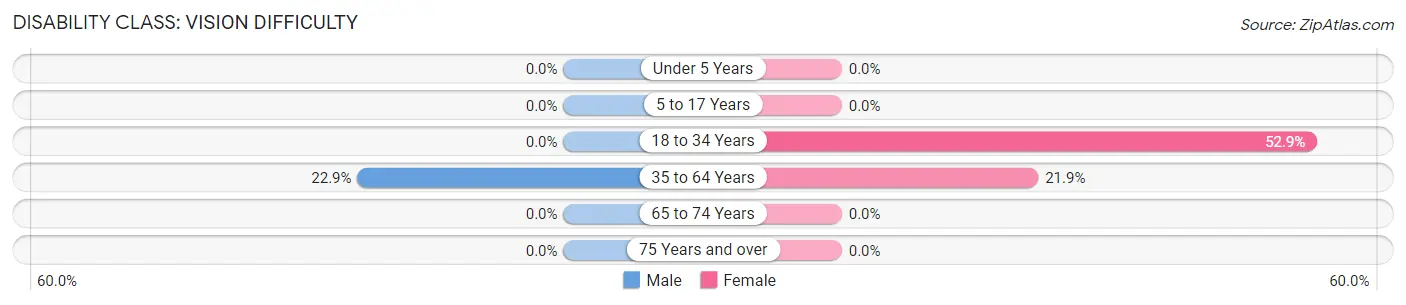
| Age Bracket | Male | Female |
| Under 5 Years | 0 (0.0%) | 0 (0.0%) |
| 5 to 17 Years | 0 (0.0%) | 0 (0.0%) |
| 18 to 34 Years | 0 (0.0%) | 90 (52.9%) |
| 35 to 64 Years | 53 (22.9%) | 28 (21.9%) |
| 65 to 74 Years | 0 (0.0%) | 0 (0.0%) |
| 75 Years and over | 0 (0.0%) | 0 (0.0%) |
Disability Class: Cognitive Difficulty
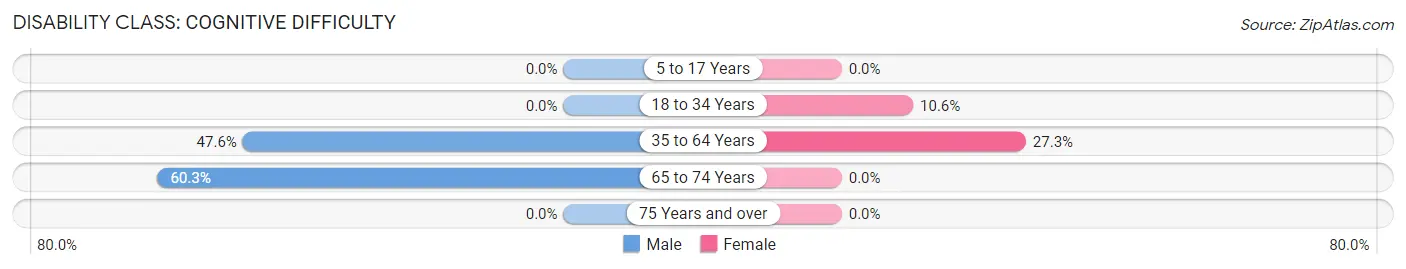
| Age Bracket | Male | Female |
| 5 to 17 Years | 0 (0.0%) | 0 (0.0%) |
| 18 to 34 Years | 0 (0.0%) | 18 (10.6%) |
| 35 to 64 Years | 110 (47.6%) | 35 (27.3%) |
| 65 to 74 Years | 47 (60.3%) | 0 (0.0%) |
| 75 Years and over | 0 (0.0%) | 0 (0.0%) |
Disability Class: Ambulatory Difficulty
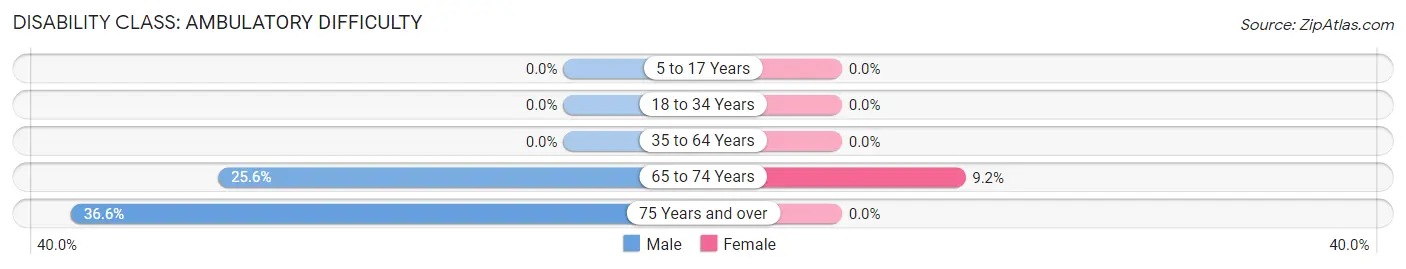
| Age Bracket | Male | Female |
| 5 to 17 Years | 0 (0.0%) | 0 (0.0%) |
| 18 to 34 Years | 0 (0.0%) | 0 (0.0%) |
| 35 to 64 Years | 0 (0.0%) | 0 (0.0%) |
| 65 to 74 Years | 20 (25.6%) | 11 (9.2%) |
| 75 Years and over | 34 (36.6%) | 0 (0.0%) |
Disability Class: Self-Care Difficulty
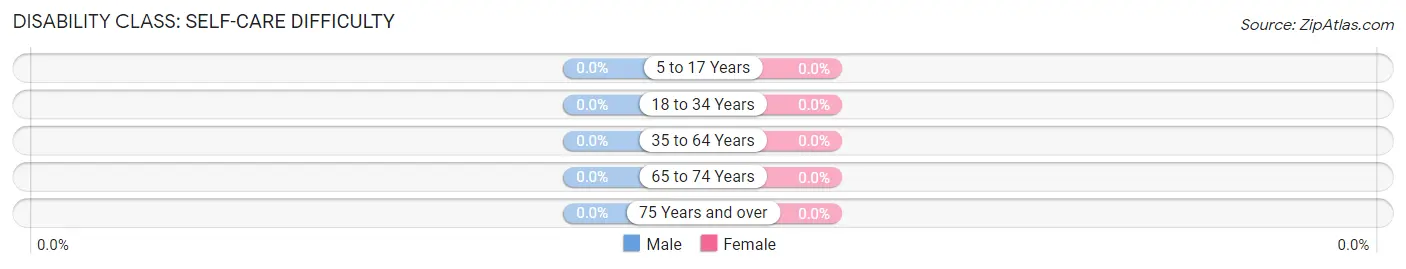
| Age Bracket | Male | Female |
| 5 to 17 Years | 0 (0.0%) | 0 (0.0%) |
| 18 to 34 Years | 0 (0.0%) | 0 (0.0%) |
| 35 to 64 Years | 0 (0.0%) | 0 (0.0%) |
| 65 to 74 Years | 0 (0.0%) | 0 (0.0%) |
| 75 Years and over | 0 (0.0%) | 0 (0.0%) |
Technology Access in Panacea
Computing Device Access in Panacea
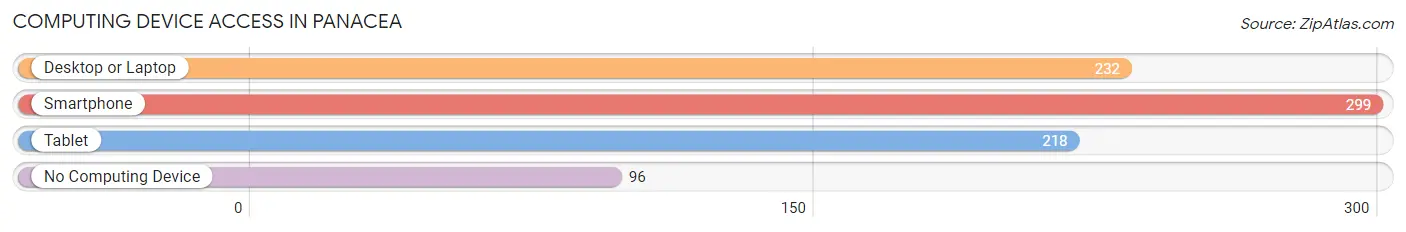
| Device Type | # Households | % Households |
| Desktop or Laptop | 232 | 58.7% |
| Smartphone | 299 | 75.7% |
| Tablet | 218 | 55.2% |
| No Computing Device | 96 | 24.3% |
| Total | 395 | 100.0% |
Internet Access in Panacea
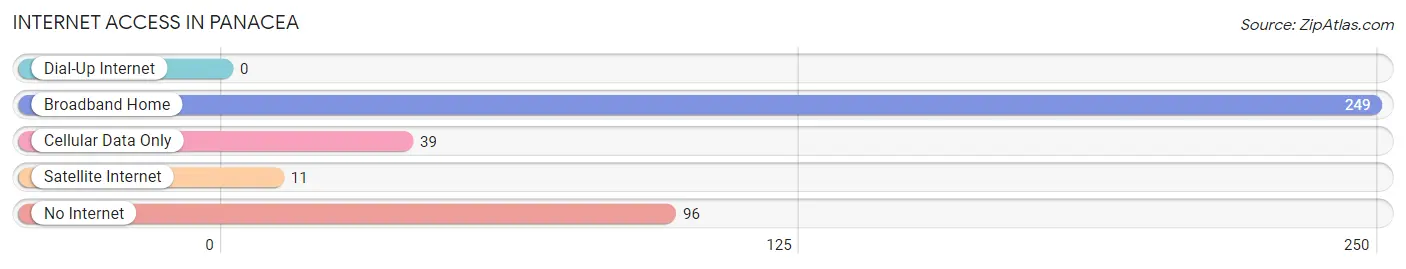
| Internet Type | # Households | % Households |
| Dial-Up Internet | 0 | 0.0% |
| Broadband Home | 249 | 63.0% |
| Cellular Data Only | 39 | 9.9% |
| Satellite Internet | 11 | 2.8% |
| No Internet | 96 | 24.3% |
| Total | 395 | 100.0% |
Panacea Summary
Panacea is a small fishing village located in Wakulla County, Florida. It is situated on the Gulf of Mexico, just south of the city of Tallahassee. The population of Panacea was 1,093 as of the 2010 census.
Geography
Panacea is located at 30°09'N 84°37'W (30.15, -84.62). It is situated on the Gulf of Mexico, just south of the city of Tallahassee. The town is located on the eastern shore of the Ochlockonee Bay, which is part of the Apalachee Bay estuary system. The town is bordered by the Ochlockonee River to the north and the Wakulla River to the south. The town is located on a peninsula, with the Gulf of Mexico to the west and the Ochlockonee Bay to the east.
The town is located in a humid subtropical climate zone, with hot, humid summers and mild winters. The average temperature in the summer is around 90°F (32°C), and the average temperature in the winter is around 60°F (15°C). The average annual precipitation is around 55 inches (140 cm).
Economy
The economy of Panacea is largely based on fishing and tourism. The town is home to several seafood restaurants, as well as a number of charter fishing boats. The town is also home to a number of bed and breakfasts, as well as a few small hotels.
The town is also home to a number of small businesses, including a marina, a bait and tackle shop, a convenience store, and a few gift shops. The town is also home to a number of art galleries, as well as a few antique stores.
Demographics
As of the 2010 census, the population of Panacea was 1,093. The racial makeup of the town was 94.3% White, 2.2% African American, 0.7% Native American, 0.3% Asian, 0.1% Pacific Islander, 0.7% from other races, and 1.7% from two or more races. Hispanic or Latino of any race were 2.2% of the population.
The median income for a household in the town was $37,500, and the median income for a family was $45,000. The per capita income for the town was $20,845. About 11.2% of families and 14.2% of the population were below the poverty line, including 18.2% of those under age 18 and 8.3% of those age 65 or over.
Conclusion
Panacea is a small fishing village located in Wakulla County, Florida. It is situated on the Gulf of Mexico, just south of the city of Tallahassee. The population of Panacea was 1,093 as of the 2010 census. The economy of Panacea is largely based on fishing and tourism, and the town is home to several seafood restaurants, charter fishing boats, bed and breakfasts, and small businesses. The racial makeup of the town was 94.3% White, 2.2% African American, 0.7% Native American, 0.3% Asian, 0.1% Pacific Islander, 0.7% from other races, and 1.7% from two or more races. The median income for a household in the town was $37,500, and the median income for a family was $45,000. The per capita income for the town was $20,845. About 11.2% of families and 14.2% of the population were below the poverty line.
Common Questions
What is Per Capita Income in Panacea?
Per Capita income in Panacea is $22,148.
What is the Median Family Income in Panacea?
Median Family Income in Panacea is $35,824.
What is the Median Household income in Panacea?
Median Household Income in Panacea is $36,250.
What is Inequality or Gini Index in Panacea?
Inequality or Gini Index in Panacea is 0.35.
What is the Total Population of Panacea?
Total Population of Panacea is 1,152.
What is the Total Male Population of Panacea?
Total Male Population of Panacea is 613.
What is the Total Female Population of Panacea?
Total Female Population of Panacea is 539.
What is the Ratio of Males per 100 Females in Panacea?
There are 113.73 Males per 100 Females in Panacea.
What is the Ratio of Females per 100 Males in Panacea?
There are 87.93 Females per 100 Males in Panacea.
What is the Median Population Age in Panacea?
Median Population Age in Panacea is 46.7 Years.
What is the Average Family Size in Panacea
Average Family Size in Panacea is 3.2 People.
What is the Average Household Size in Panacea
Average Household Size in Panacea is 2.9 People.
How Large is the Labor Force in Panacea?
There are 436 People in the Labor Forcein in Panacea.
What is the Percentage of People in the Labor Force in Panacea?
46.1% of People are in the Labor Force in Panacea.