Fort Myers Beach, FL Map & Demographics
Fort Myers Beach Map
Fort Myers Beach Overview
$75,988
PER CAPITA INCOME
$121,563
AVG FAMILY INCOME
$87,204
AVG HOUSEHOLD INCOME
42.9%
WAGE / INCOME GAP [ % ]
57.1¢/ $1
WAGE / INCOME GAP [ $ ]
$10,547
FAMILY INCOME DEFICIT
0.53
INEQUALITY / GINI INDEX
5,650
TOTAL POPULATION
2,755
MALE POPULATION
2,895
FEMALE POPULATION
95.16
MALES / 100 FEMALES
105.08
FEMALES / 100 MALES
66.6
MEDIAN AGE
2.4
AVG FAMILY SIZE
1.9
AVG HOUSEHOLD SIZE
1,839
LABOR FORCE [ PEOPLE ]
34.0%
PERCENT IN LABOR FORCE
3.6%
UNEMPLOYMENT RATE
Fort Myers Beach Zip Codes
Fort Myers Beach Area Codes
Income in Fort Myers Beach
Income Overview in Fort Myers Beach
Per Capita Income in Fort Myers Beach is $75,988, while median incomes of families and households are $121,563 and $87,204 respectively.
| Characteristic | Number | Measure |
| Per Capita Income | 5,650 | $75,988 |
| Median Family Income | 1,842 | $121,563 |
| Mean Family Income | 1,842 | $174,495 |
| Median Household Income | 2,879 | $87,204 |
| Mean Household Income | 2,879 | $146,183 |
| Income Deficit | 1,842 | $10,547 |
| Wage / Income Gap (%) | 5,650 | 42.89% |
| Wage / Income Gap ($) | 5,650 | 57.11¢ per $1 |
| Gini / Inequality Index | 5,650 | 0.53 |
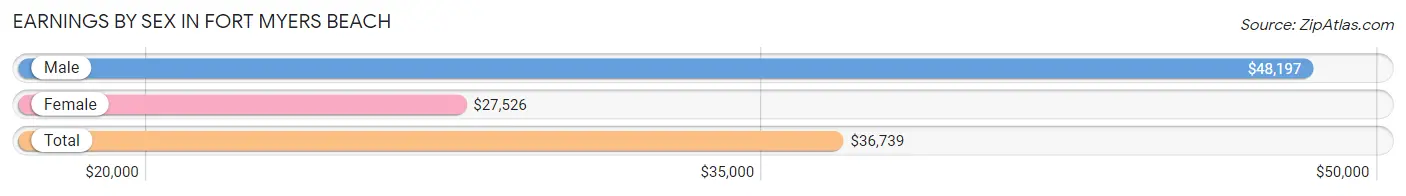
Earnings by Sex in Fort Myers Beach
Average Earnings in Fort Myers Beach are $36,739, $48,197 for men and $27,526 for women, a difference of 42.9%.
| Sex | Number | Average Earnings |
| Male | 995 (49.4%) | $48,197 |
| Female | 1,021 (50.6%) | $27,526 |
| Total | 2,016 (100.0%) | $36,739 |
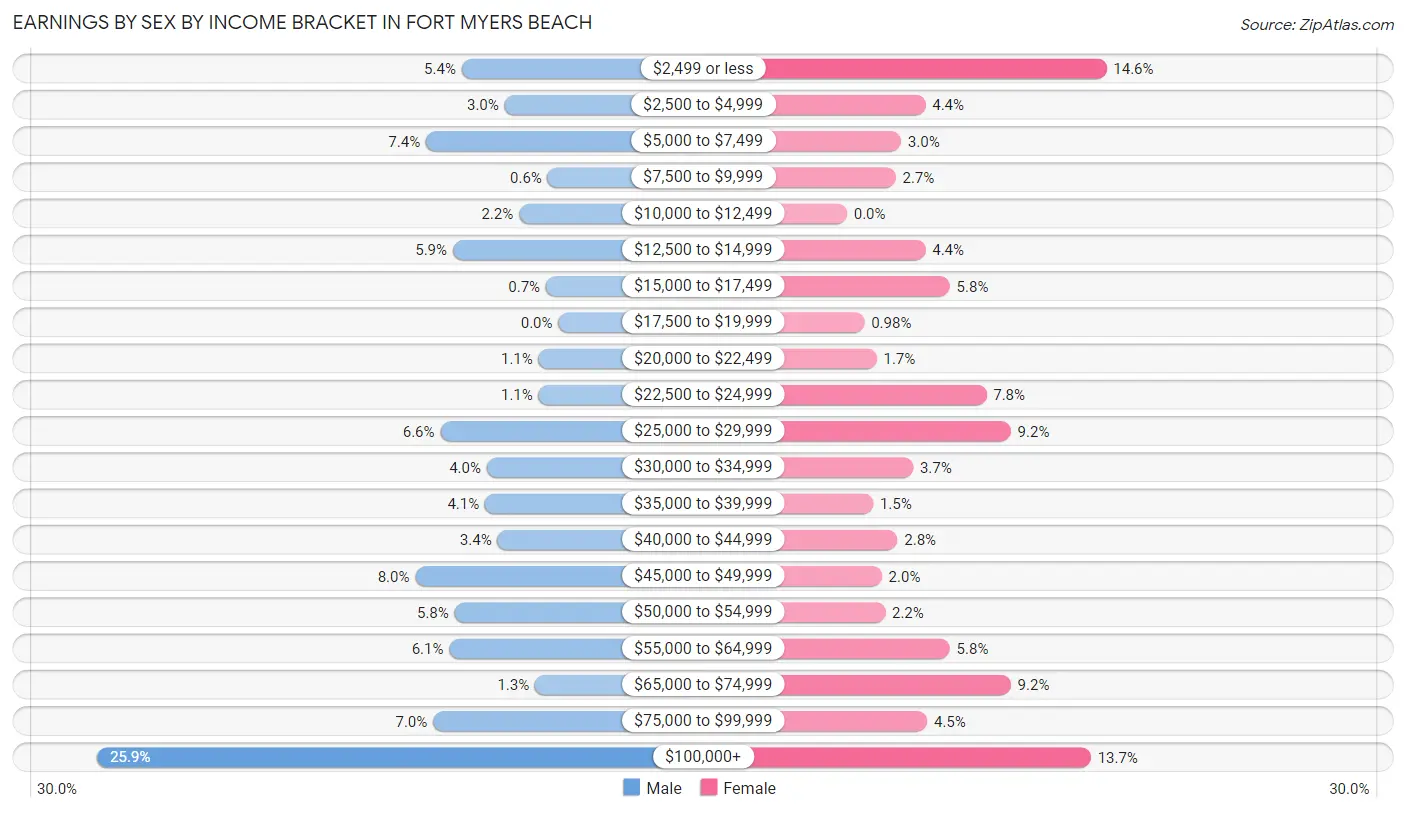
Earnings by Sex by Income Bracket in Fort Myers Beach
The most common earnings brackets in Fort Myers Beach are $100,000+ for men (258 | 25.9%) and $2,499 or less for women (149 | 14.6%).
| Income | Male | Female |
| $2,499 or less | 54 (5.4%) | 149 (14.6%) |
| $2,500 to $4,999 | 30 (3.0%) | 45 (4.4%) |
| $5,000 to $7,499 | 74 (7.4%) | 31 (3.0%) |
| $7,500 to $9,999 | 6 (0.6%) | 28 (2.7%) |
| $10,000 to $12,499 | 22 (2.2%) | 0 (0.0%) |
| $12,500 to $14,999 | 59 (5.9%) | 45 (4.4%) |
| $15,000 to $17,499 | 7 (0.7%) | 59 (5.8%) |
| $17,500 to $19,999 | 0 (0.0%) | 10 (1.0%) |
| $20,000 to $22,499 | 11 (1.1%) | 17 (1.7%) |
| $22,500 to $24,999 | 11 (1.1%) | 80 (7.8%) |
| $25,000 to $29,999 | 66 (6.6%) | 94 (9.2%) |
| $30,000 to $34,999 | 40 (4.0%) | 38 (3.7%) |
| $35,000 to $39,999 | 41 (4.1%) | 15 (1.5%) |
| $40,000 to $44,999 | 34 (3.4%) | 29 (2.8%) |
| $45,000 to $49,999 | 80 (8.0%) | 20 (2.0%) |
| $50,000 to $54,999 | 58 (5.8%) | 22 (2.1%) |
| $55,000 to $64,999 | 61 (6.1%) | 59 (5.8%) |
| $65,000 to $74,999 | 13 (1.3%) | 94 (9.2%) |
| $75,000 to $99,999 | 70 (7.0%) | 46 (4.5%) |
| $100,000+ | 258 (25.9%) | 140 (13.7%) |
| Total | 995 (100.0%) | 1,021 (100.0%) |
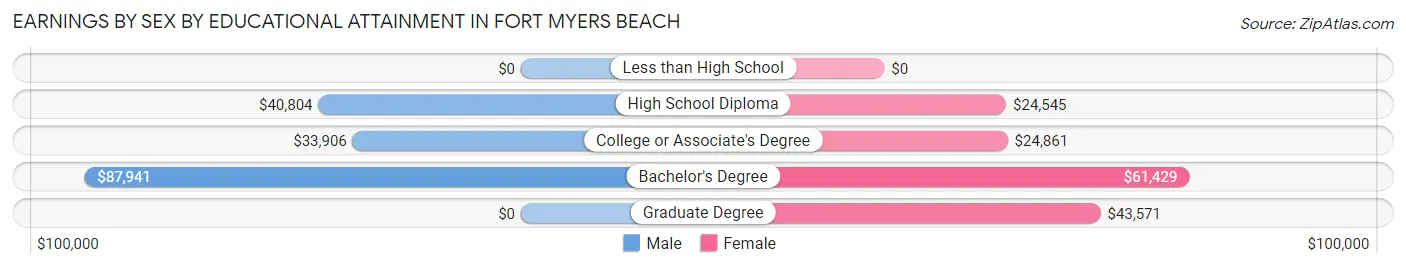
Earnings by Sex by Educational Attainment in Fort Myers Beach
Average earnings in Fort Myers Beach are $50,441 for men and $27,744 for women, a difference of 45.0%. Men with an educational attainment of bachelor's degree enjoy the highest average annual earnings of $87,941, while those with college or associate's degree education earn the least with $33,906. Women with an educational attainment of bachelor's degree earn the most with the average annual earnings of $61,429, while those with high school diploma education have the smallest earnings of $24,545.
| Educational Attainment | Male Income | Female Income |
| Less than High School | - | - |
| High School Diploma | $40,804 | $24,545 |
| College or Associate's Degree | $33,906 | $24,861 |
| Bachelor's Degree | $87,941 | $61,429 |
| Graduate Degree | - | - |
| Total | $50,441 | $27,744 |
Family Income in Fort Myers Beach
Family Income Brackets in Fort Myers Beach
According to the Fort Myers Beach family income data, there are 446 families falling into the $200,000+ income range, which is the most common income bracket and makes up 24.2% of all families.
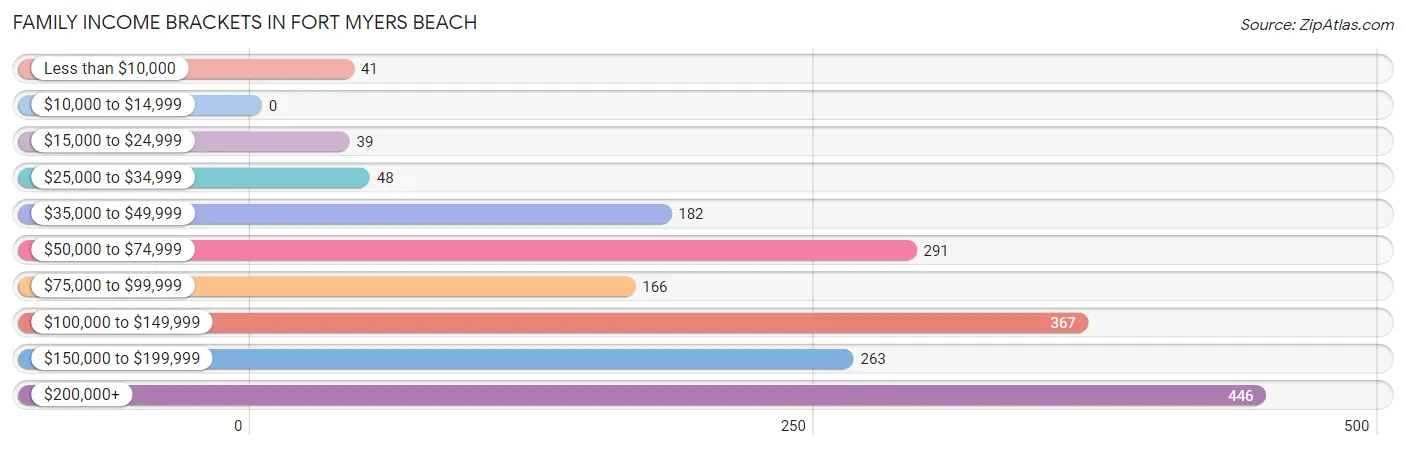
| Income Bracket | # Families | % Families |
| Less than $10,000 | 41 | 2.2% |
| $10,000 to $14,999 | 0 | 0.0% |
| $15,000 to $24,999 | 39 | 2.1% |
| $25,000 to $34,999 | 48 | 2.6% |
| $35,000 to $49,999 | 182 | 9.9% |
| $50,000 to $74,999 | 291 | 15.8% |
| $75,000 to $99,999 | 166 | 9.0% |
| $100,000 to $149,999 | 367 | 19.9% |
| $150,000 to $199,999 | 263 | 14.3% |
| $200,000+ | 446 | 24.2% |
Family Income by Famaliy Size in Fort Myers Beach
3-person families (209 | 11.4%) account for the highest median family income in Fort Myers Beach with $152,096 per family, while 2-person families (1,546 | 83.9%) have the highest median income of $56,022 per family member.
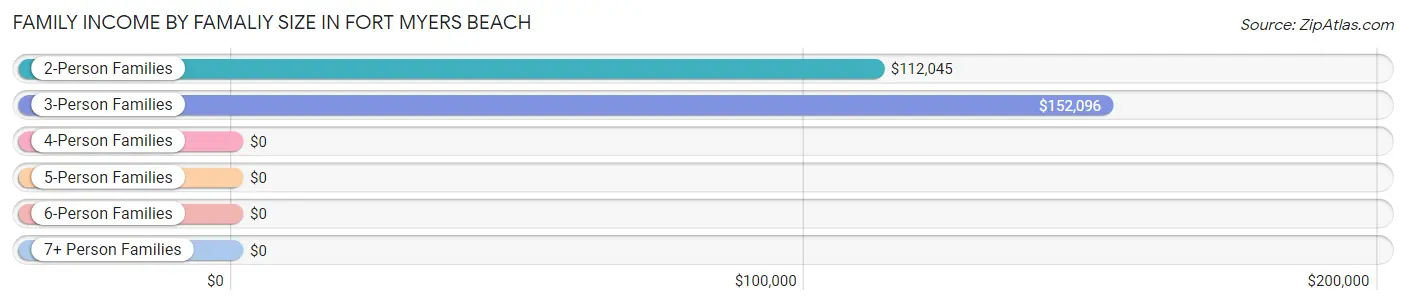
| Income Bracket | # Families | Median Income |
| 2-Person Families | 1,546 (83.9%) | $112,045 |
| 3-Person Families | 209 (11.4%) | $152,096 |
| 4-Person Families | 38 (2.1%) | $0 |
| 5-Person Families | 24 (1.3%) | $0 |
| 6-Person Families | 14 (0.8%) | $0 |
| 7+ Person Families | 11 (0.6%) | $0 |
| Total | 1,842 (100.0%) | $121,563 |
Family Income by Number of Earners in Fort Myers Beach
The median family income in Fort Myers Beach is $121,563, with families comprising 1 earner (447) having the highest median family income of $151,806, while families with no earners (957) have the lowest median family income of $105,298, accounting for 24.3% and 51.9% of families, respectively.
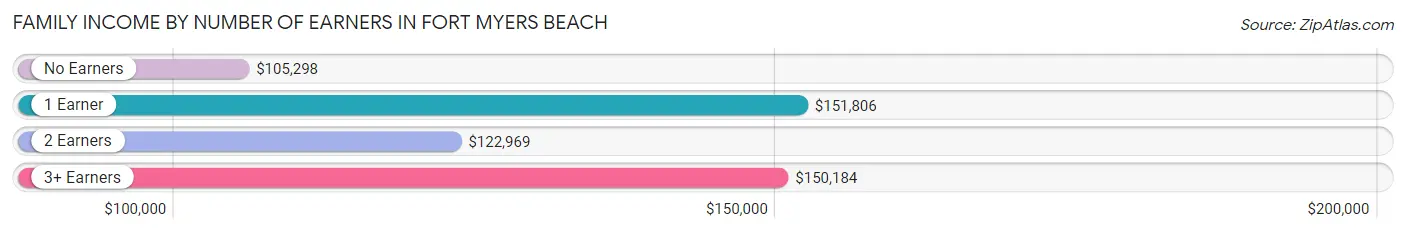
| Number of Earners | # Families | Median Income |
| No Earners | 957 (51.9%) | $105,298 |
| 1 Earner | 447 (24.3%) | $151,806 |
| 2 Earners | 365 (19.8%) | $122,969 |
| 3+ Earners | 73 (4.0%) | $150,184 |
| Total | 1,842 (100.0%) | $121,563 |
Household Income in Fort Myers Beach
Household Income Brackets in Fort Myers Beach
With 556 households falling in the category, the $200,000+ income range is the most frequent in Fort Myers Beach, accounting for 19.3% of all households. In contrast, only 29 households (1.0%) fall into the $10,000 to $14,999 income bracket, making it the least populous group.
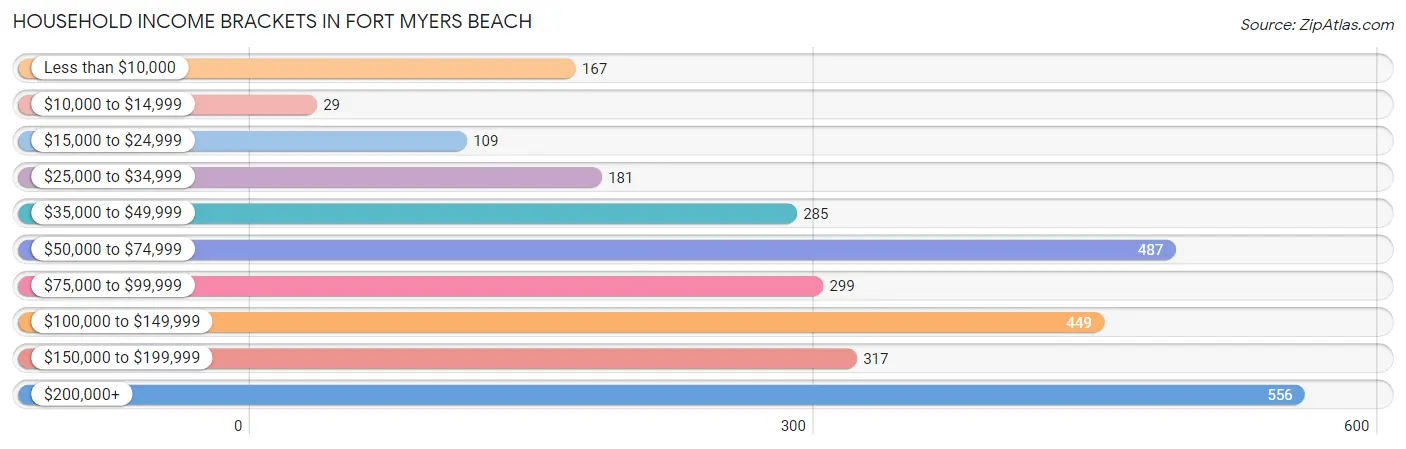
| Income Bracket | # Households | % Households |
| Less than $10,000 | 167 | 5.8% |
| $10,000 to $14,999 | 29 | 1.0% |
| $15,000 to $24,999 | 109 | 3.8% |
| $25,000 to $34,999 | 181 | 6.3% |
| $35,000 to $49,999 | 285 | 9.9% |
| $50,000 to $74,999 | 487 | 16.9% |
| $75,000 to $99,999 | 299 | 10.4% |
| $100,000 to $149,999 | 449 | 15.6% |
| $150,000 to $199,999 | 317 | 11.0% |
| $200,000+ | 556 | 19.3% |
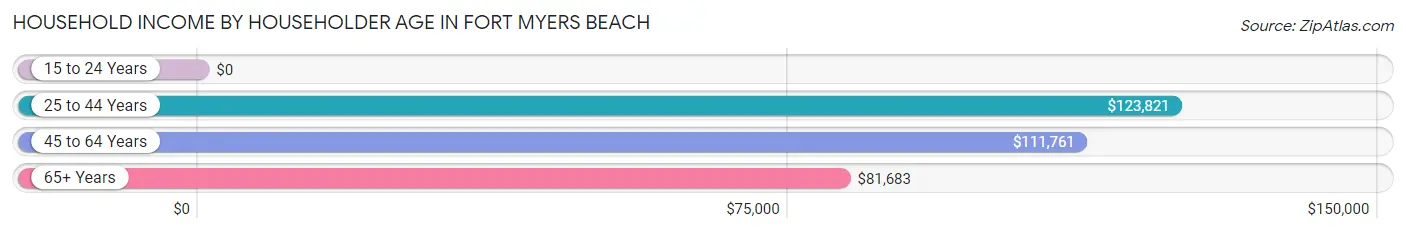
Household Income by Householder Age in Fort Myers Beach
The median household income in Fort Myers Beach is $87,204, with the highest median household income of $123,821 found in the 25 to 44 years age bracket for the primary householder. A total of 95 households (3.3%) fall into this category.
| Income Bracket | # Households | Median Income |
| 15 to 24 Years | 0 (0.0%) | $0 |
| 25 to 44 Years | 95 (3.3%) | $123,821 |
| 45 to 64 Years | 817 (28.4%) | $111,761 |
| 65+ Years | 1,967 (68.3%) | $81,683 |
| Total | 2,879 (100.0%) | $87,204 |
Poverty in Fort Myers Beach
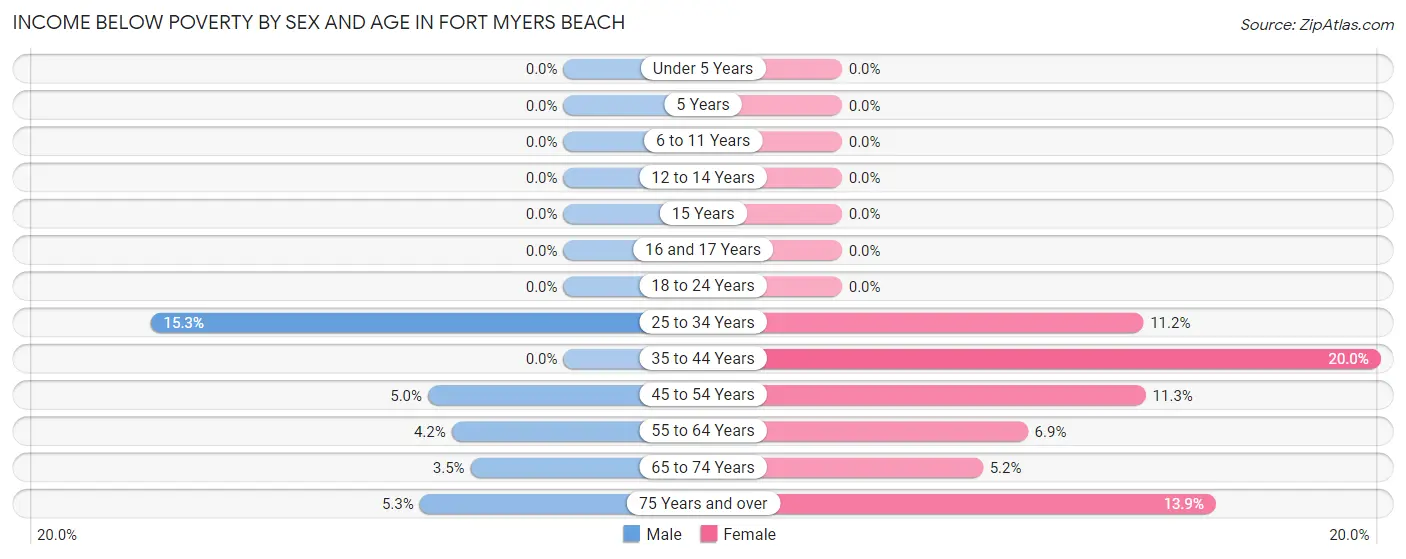
Income Below Poverty by Sex and Age in Fort Myers Beach
With 4.3% poverty level for males and 8.3% for females among the residents of Fort Myers Beach, 25 to 34 year old males and 35 to 44 year old females are the most vulnerable to poverty, with 17 males (15.3%) and 20 females (20.0%) in their respective age groups living below the poverty level.
| Age Bracket | Male | Female |
| Under 5 Years | 0 (0.0%) | 0 (0.0%) |
| 5 Years | 0 (0.0%) | 0 (0.0%) |
| 6 to 11 Years | 0 (0.0%) | 0 (0.0%) |
| 12 to 14 Years | 0 (0.0%) | 0 (0.0%) |
| 15 Years | 0 (0.0%) | 0 (0.0%) |
| 16 and 17 Years | 0 (0.0%) | 0 (0.0%) |
| 18 to 24 Years | 0 (0.0%) | 0 (0.0%) |
| 25 to 34 Years | 17 (15.3%) | 15 (11.2%) |
| 35 to 44 Years | 0 (0.0%) | 20 (20.0%) |
| 45 to 54 Years | 8 (5.0%) | 30 (11.3%) |
| 55 to 64 Years | 21 (4.2%) | 41 (6.9%) |
| 65 to 74 Years | 30 (3.5%) | 48 (5.2%) |
| 75 Years and over | 41 (5.3%) | 87 (13.9%) |
| Total | 117 (4.3%) | 241 (8.3%) |
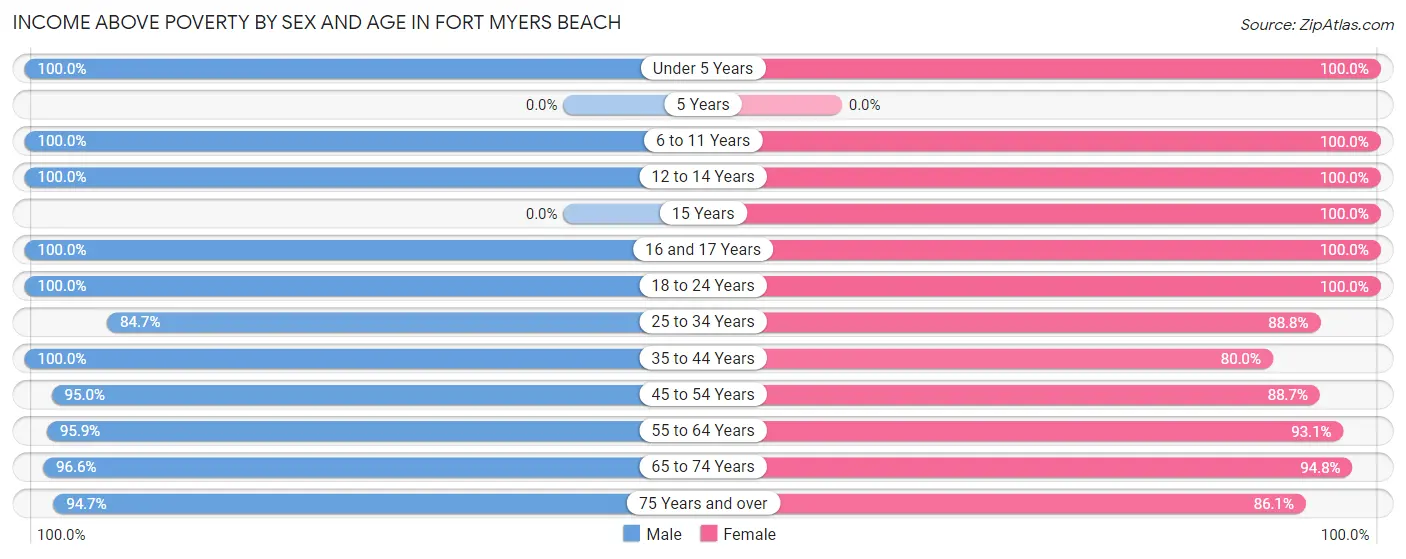
Income Above Poverty by Sex and Age in Fort Myers Beach
According to the poverty statistics in Fort Myers Beach, males aged under 5 years and females aged under 5 years are the age groups that are most secure financially, with 100.0% of males and 100.0% of females in these age groups living above the poverty line.
| Age Bracket | Male | Female |
| Under 5 Years | 63 (100.0%) | 17 (100.0%) |
| 5 Years | 0 (0.0%) | 0 (0.0%) |
| 6 to 11 Years | 37 (100.0%) | 34 (100.0%) |
| 12 to 14 Years | 19 (100.0%) | 44 (100.0%) |
| 15 Years | 0 (0.0%) | 28 (100.0%) |
| 16 and 17 Years | 22 (100.0%) | 21 (100.0%) |
| 18 to 24 Years | 98 (100.0%) | 112 (100.0%) |
| 25 to 34 Years | 94 (84.7%) | 119 (88.8%) |
| 35 to 44 Years | 103 (100.0%) | 80 (80.0%) |
| 45 to 54 Years | 151 (95.0%) | 236 (88.7%) |
| 55 to 64 Years | 485 (95.9%) | 553 (93.1%) |
| 65 to 74 Years | 839 (96.6%) | 870 (94.8%) |
| 75 Years and over | 727 (94.7%) | 540 (86.1%) |
| Total | 2,638 (95.8%) | 2,654 (91.7%) |
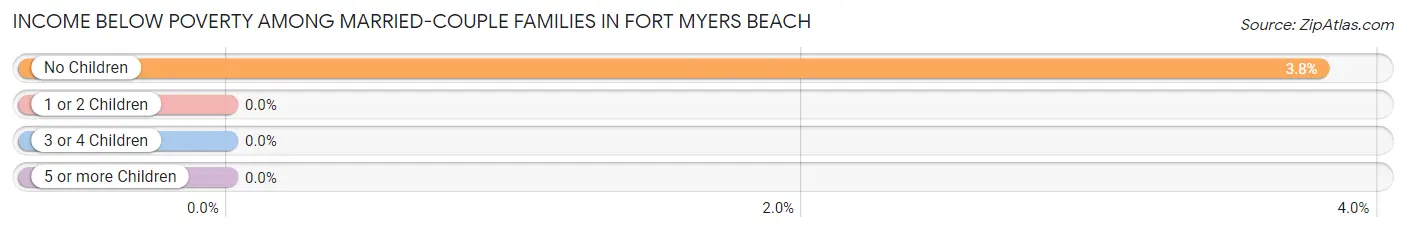
Income Below Poverty Among Married-Couple Families in Fort Myers Beach
The poverty statistics for married-couple families in Fort Myers Beach show that 3.6% or 62 of the total 1,729 families live below the poverty line. Families with no children have the highest poverty rate of 3.8%, comprising of 62 families. On the other hand, families with 1 or 2 children have the lowest poverty rate of 0.0%, which includes 0 families.
| Children | Above Poverty | Below Poverty |
| No Children | 1,570 (96.2%) | 62 (3.8%) |
| 1 or 2 Children | 55 (100.0%) | 0 (0.0%) |
| 3 or 4 Children | 31 (100.0%) | 0 (0.0%) |
| 5 or more Children | 11 (100.0%) | 0 (0.0%) |
| Total | 1,667 (96.4%) | 62 (3.6%) |
Income Below Poverty Among Single-Parent Households in Fort Myers Beach
| Children | Single Father | Single Mother |
| No Children | 0 (0.0%) | 0 (0.0%) |
| 1 or 2 Children | 0 (0.0%) | 0 (0.0%) |
| 3 or 4 Children | 0 (0.0%) | 0 (0.0%) |
| 5 or more Children | 0 (0.0%) | 0 (0.0%) |
| Total | 0 (0.0%) | 0 (0.0%) |
Income Below Poverty Among Married-Couple vs Single-Parent Households in Fort Myers Beach
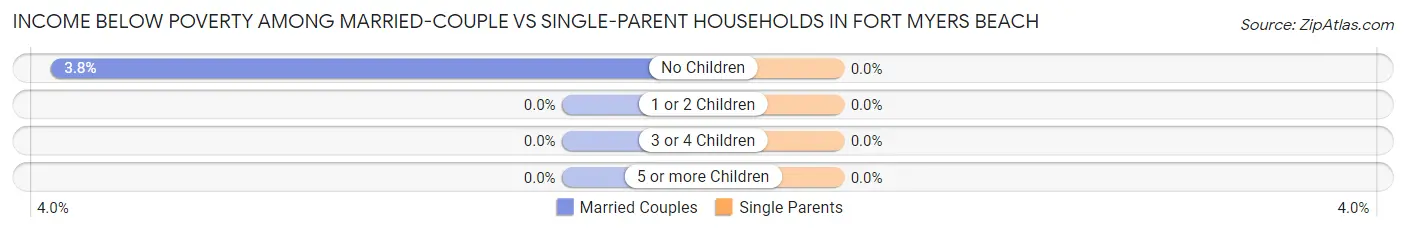
| Children | Married-Couple Families | Single-Parent Households |
| No Children | 62 (3.8%) | 0 (0.0%) |
| 1 or 2 Children | 0 (0.0%) | 0 (0.0%) |
| 3 or 4 Children | 0 (0.0%) | 0 (0.0%) |
| 5 or more Children | 0 (0.0%) | 0 (0.0%) |
| Total | 62 (3.6%) | 0 (0.0%) |
Race in Fort Myers Beach
The most populous races in Fort Myers Beach are White / Caucasian (5,258 | 93.1%), Hispanic or Latino (303 | 5.4%), and Two or more Races (231 | 4.1%).
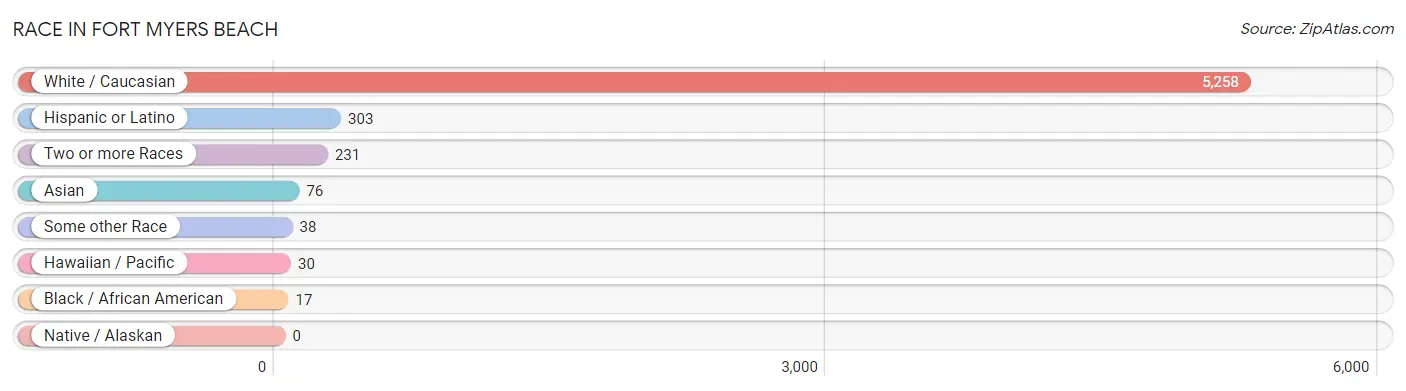
| Race | # Population | % Population |
| Asian | 76 | 1.3% |
| Black / African American | 17 | 0.3% |
| Hawaiian / Pacific | 30 | 0.5% |
| Hispanic or Latino | 303 | 5.4% |
| Native / Alaskan | 0 | 0.0% |
| White / Caucasian | 5,258 | 93.1% |
| Two or more Races | 231 | 4.1% |
| Some other Race | 38 | 0.7% |
| Total | 5,650 | 100.0% |
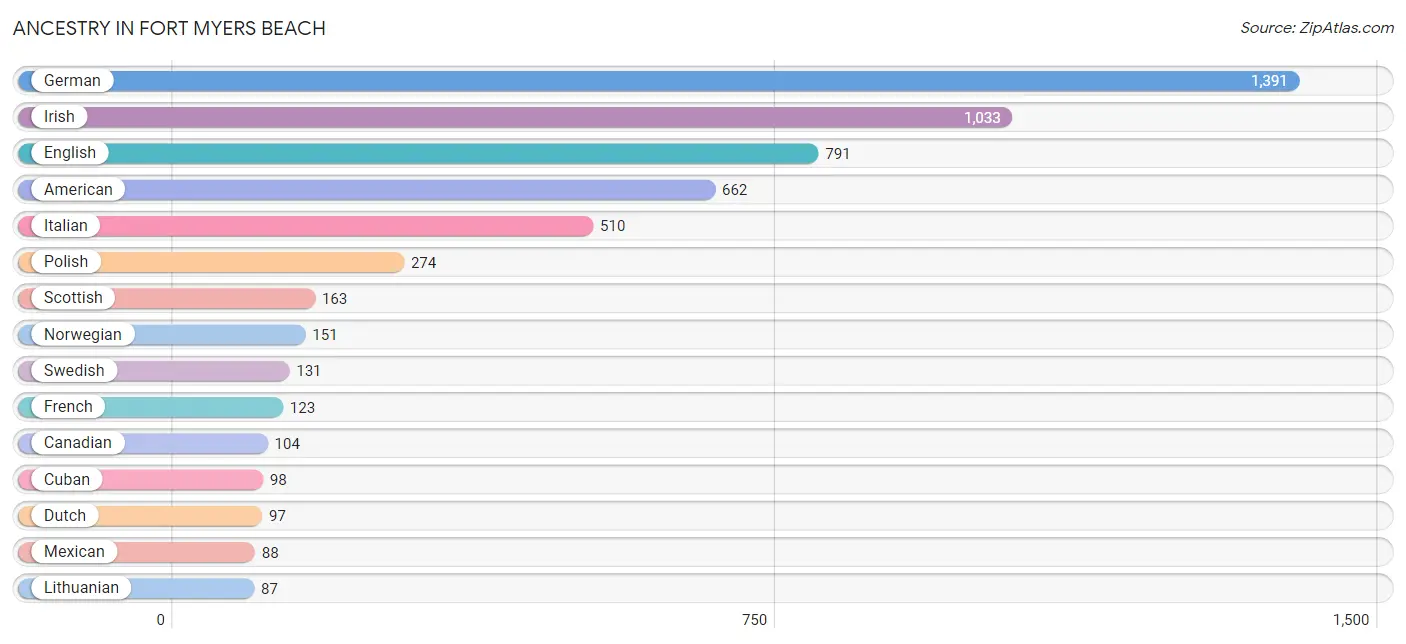
Ancestry in Fort Myers Beach
The most populous ancestries reported in Fort Myers Beach are German (1,391 | 24.6%), Irish (1,033 | 18.3%), English (791 | 14.0%), American (662 | 11.7%), and Italian (510 | 9.0%), together accounting for 77.6% of all Fort Myers Beach residents.
| Ancestry | # Population | % Population |
| American | 662 | 11.7% |
| Arab | 45 | 0.8% |
| Austrian | 78 | 1.4% |
| Belgian | 21 | 0.4% |
| British | 53 | 0.9% |
| Canadian | 104 | 1.8% |
| Central American | 33 | 0.6% |
| Chickasaw | 11 | 0.2% |
| Colombian | 9 | 0.2% |
| Croatian | 6 | 0.1% |
| Cuban | 98 | 1.7% |
| Czech | 42 | 0.7% |
| Czechoslovakian | 7 | 0.1% |
| Danish | 26 | 0.5% |
| Dutch | 97 | 1.7% |
| Eastern European | 24 | 0.4% |
| Ecuadorian | 11 | 0.2% |
| Egyptian | 8 | 0.1% |
| English | 791 | 14.0% |
| European | 39 | 0.7% |
| Finnish | 62 | 1.1% |
| French | 123 | 2.2% |
| French Canadian | 67 | 1.2% |
| German | 1,391 | 24.6% |
| Greek | 14 | 0.3% |
| Guamanian / Chamorro | 4 | 0.1% |
| Hungarian | 41 | 0.7% |
| Indian (Asian) | 8 | 0.1% |
| Irish | 1,033 | 18.3% |
| Italian | 510 | 9.0% |
| Korean | 20 | 0.4% |
| Latvian | 6 | 0.1% |
| Lebanese | 9 | 0.2% |
| Lithuanian | 87 | 1.5% |
| Mexican | 88 | 1.6% |
| Northern European | 14 | 0.3% |
| Norwegian | 151 | 2.7% |
| Palestinian | 18 | 0.3% |
| Panamanian | 33 | 0.6% |
| Polish | 274 | 4.9% |
| Portuguese | 11 | 0.2% |
| Puerto Rican | 38 | 0.7% |
| Romanian | 15 | 0.3% |
| Russian | 49 | 0.9% |
| Samoan | 26 | 0.5% |
| Scandinavian | 7 | 0.1% |
| Scotch-Irish | 50 | 0.9% |
| Scottish | 163 | 2.9% |
| Slovak | 42 | 0.7% |
| Slovene | 17 | 0.3% |
| South American | 20 | 0.4% |
| Sri Lankan | 48 | 0.9% |
| Swedish | 131 | 2.3% |
| Swiss | 17 | 0.3% |
| Syrian | 10 | 0.2% |
| Ukrainian | 9 | 0.2% |
| Welsh | 54 | 1.0% | View All 57 Rows |
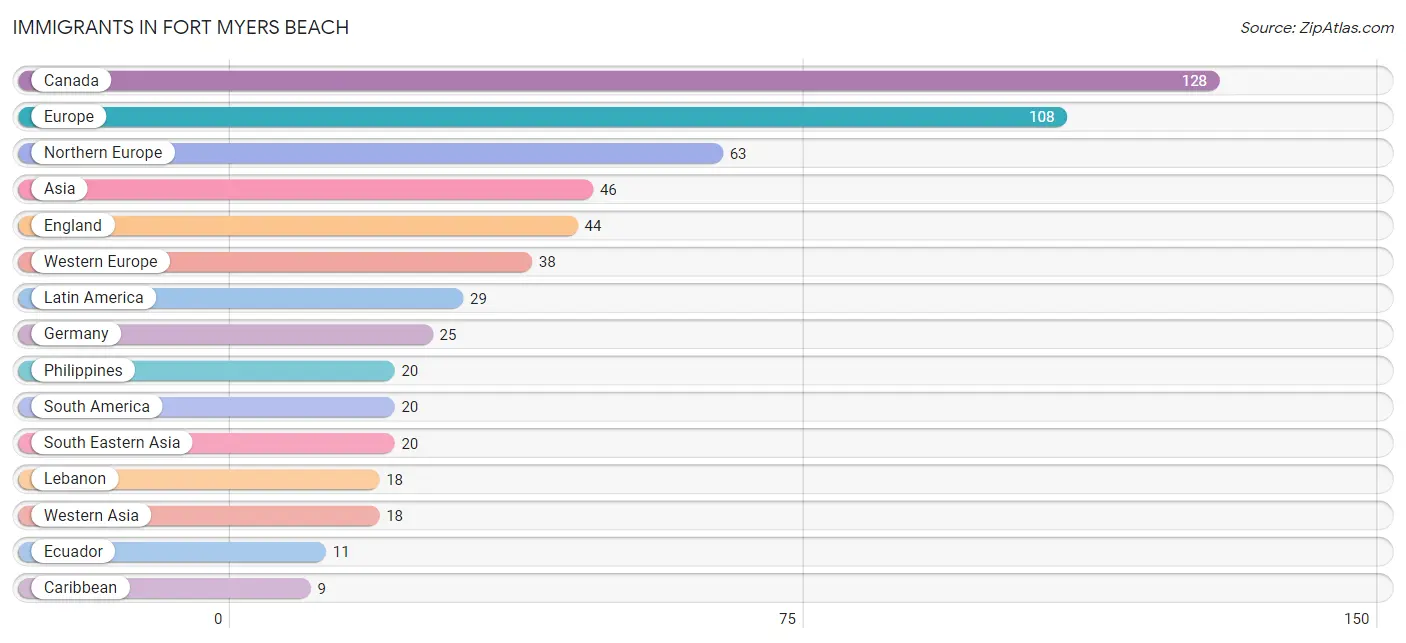
Immigrants in Fort Myers Beach
The most numerous immigrant groups reported in Fort Myers Beach came from Canada (128 | 2.3%), Europe (108 | 1.9%), Northern Europe (63 | 1.1%), Asia (46 | 0.8%), and England (44 | 0.8%), together accounting for 6.9% of all Fort Myers Beach residents.
| Immigration Origin | # Population | % Population |
| Africa | 8 | 0.1% |
| Asia | 46 | 0.8% |
| Belgium | 5 | 0.1% |
| Canada | 128 | 2.3% |
| Caribbean | 9 | 0.2% |
| China | 8 | 0.1% |
| Colombia | 9 | 0.2% |
| Cuba | 9 | 0.2% |
| Eastern Asia | 8 | 0.1% |
| Ecuador | 11 | 0.2% |
| Egypt | 8 | 0.1% |
| England | 44 | 0.8% |
| Europe | 108 | 1.9% |
| Germany | 25 | 0.4% |
| Italy | 7 | 0.1% |
| Latin America | 29 | 0.5% |
| Lebanon | 18 | 0.3% |
| Netherlands | 8 | 0.1% |
| Northern Africa | 8 | 0.1% |
| Northern Europe | 63 | 1.1% |
| Philippines | 20 | 0.4% |
| South America | 20 | 0.4% |
| South Eastern Asia | 20 | 0.4% |
| Southern Europe | 7 | 0.1% |
| Western Asia | 18 | 0.3% |
| Western Europe | 38 | 0.7% | View All 26 Rows |
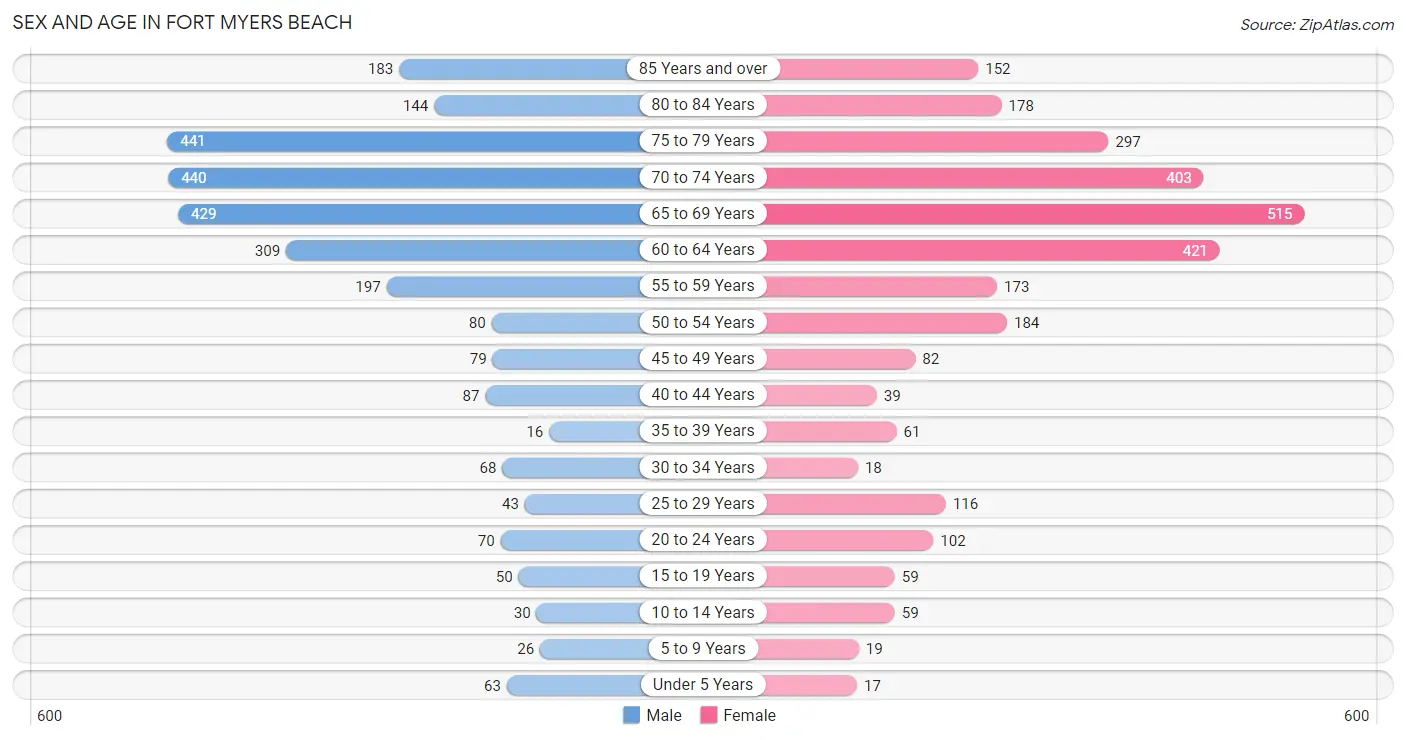
Sex and Age in Fort Myers Beach
Sex and Age in Fort Myers Beach
The most populous age groups in Fort Myers Beach are 75 to 79 Years (441 | 16.0%) for men and 65 to 69 Years (515 | 17.8%) for women.
| Age Bracket | Male | Female |
| Under 5 Years | 63 (2.3%) | 17 (0.6%) |
| 5 to 9 Years | 26 (0.9%) | 19 (0.7%) |
| 10 to 14 Years | 30 (1.1%) | 59 (2.0%) |
| 15 to 19 Years | 50 (1.8%) | 59 (2.0%) |
| 20 to 24 Years | 70 (2.5%) | 102 (3.5%) |
| 25 to 29 Years | 43 (1.6%) | 116 (4.0%) |
| 30 to 34 Years | 68 (2.5%) | 18 (0.6%) |
| 35 to 39 Years | 16 (0.6%) | 61 (2.1%) |
| 40 to 44 Years | 87 (3.2%) | 39 (1.3%) |
| 45 to 49 Years | 79 (2.9%) | 82 (2.8%) |
| 50 to 54 Years | 80 (2.9%) | 184 (6.4%) |
| 55 to 59 Years | 197 (7.1%) | 173 (6.0%) |
| 60 to 64 Years | 309 (11.2%) | 421 (14.5%) |
| 65 to 69 Years | 429 (15.6%) | 515 (17.8%) |
| 70 to 74 Years | 440 (16.0%) | 403 (13.9%) |
| 75 to 79 Years | 441 (16.0%) | 297 (10.3%) |
| 80 to 84 Years | 144 (5.2%) | 178 (6.1%) |
| 85 Years and over | 183 (6.6%) | 152 (5.2%) |
| Total | 2,755 (100.0%) | 2,895 (100.0%) |
Families and Households in Fort Myers Beach
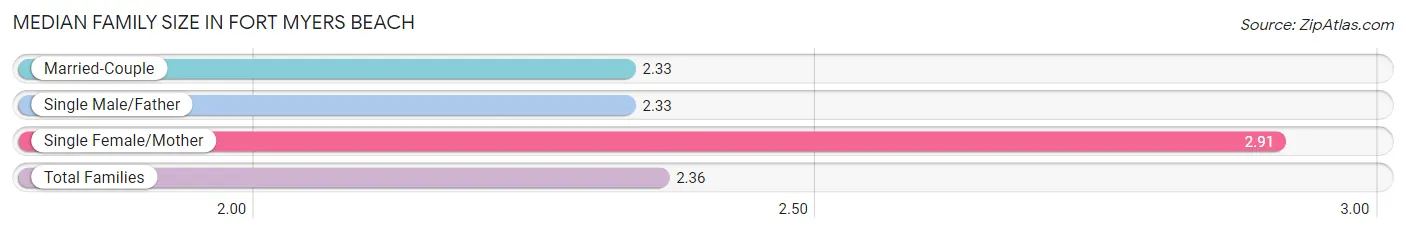
Median Family Size in Fort Myers Beach
The median family size in Fort Myers Beach is 2.36 persons per family, with single female/mother families (95 | 5.2%) accounting for the largest median family size of 2.91 persons per family. On the other hand, married-couple families (1,729 | 93.9%) represent the smallest median family size with 2.33 persons per family.
| Family Type | # Families | Family Size |
| Married-Couple | 1,729 (93.9%) | 2.33 |
| Single Male/Father | 18 (1.0%) | 2.33 |
| Single Female/Mother | 95 (5.2%) | 2.91 |
| Total Families | 1,842 (100.0%) | 2.36 |
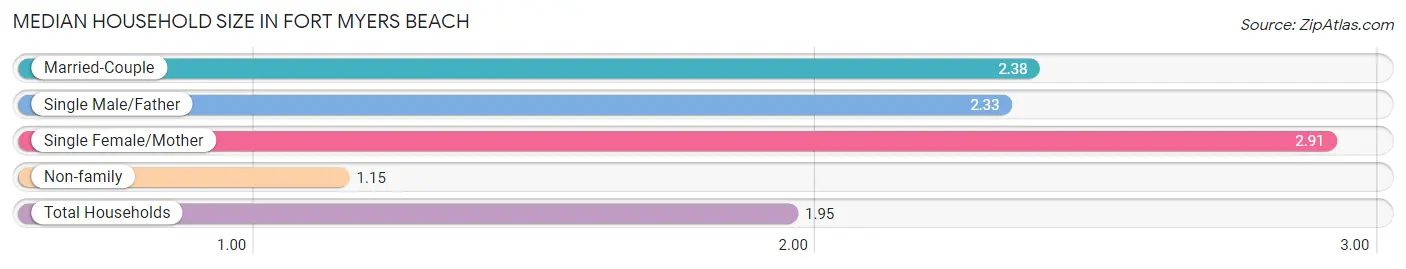
Median Household Size in Fort Myers Beach
The median household size in Fort Myers Beach is 1.95 persons per household, with single female/mother households (95 | 3.3%) accounting for the largest median household size of 2.91 persons per household. non-family households (1,037 | 36.0%) represent the smallest median household size with 1.15 persons per household.
| Household Type | # Households | Household Size |
| Married-Couple | 1,729 (60.1%) | 2.38 |
| Single Male/Father | 18 (0.6%) | 2.33 |
| Single Female/Mother | 95 (3.3%) | 2.91 |
| Non-family | 1,037 (36.0%) | 1.15 |
| Total Households | 2,879 (100.0%) | 1.95 |
Household Size by Marriage Status in Fort Myers Beach
Out of a total of 2,879 households in Fort Myers Beach, 1,842 (64.0%) are family households, while 1,037 (36.0%) are nonfamily households. The most numerous type of family households are 2-person households, comprising 1,546, and the most common type of nonfamily households are 1-person households, comprising 909.
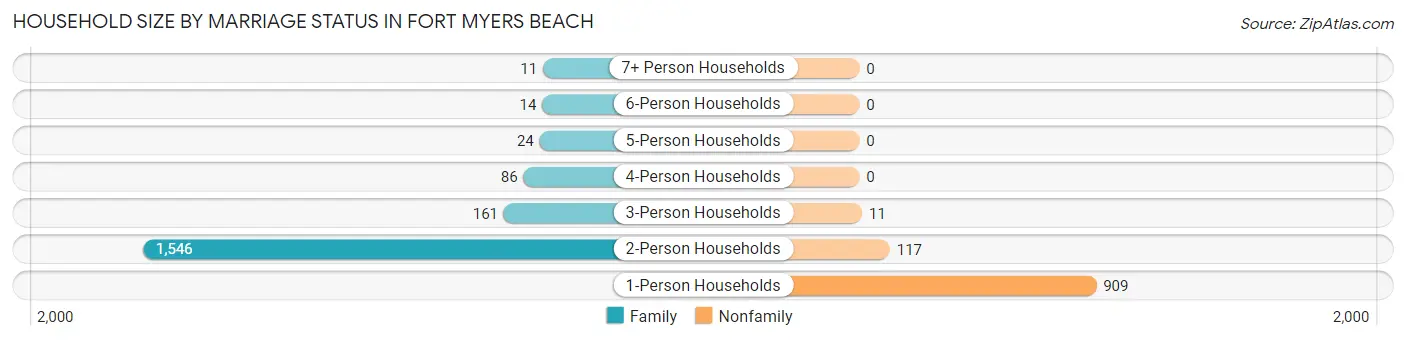
| Household Size | Family Households | Nonfamily Households |
| 1-Person Households | - | 909 (31.6%) |
| 2-Person Households | 1,546 (53.7%) | 117 (4.1%) |
| 3-Person Households | 161 (5.6%) | 11 (0.4%) |
| 4-Person Households | 86 (3.0%) | 0 (0.0%) |
| 5-Person Households | 24 (0.8%) | 0 (0.0%) |
| 6-Person Households | 14 (0.5%) | 0 (0.0%) |
| 7+ Person Households | 11 (0.4%) | 0 (0.0%) |
| Total | 1,842 (64.0%) | 1,037 (36.0%) |
Female Fertility in Fort Myers Beach
Fertility by Age in Fort Myers Beach
| Age Bracket | Women with Births | Births / 1,000 Women |
| 15 to 19 years | 0 (0.0%) | 0.0 |
| 20 to 34 years | 0 (0.0%) | 0.0 |
| 35 to 50 years | 0 (0.0%) | 0.0 |
| Total | 0 (0.0%) | 0.0 |
Fertility by Age by Marriage Status in Fort Myers Beach
| Age Bracket | Married | Unmarried |
| 15 to 19 years | 0 (0.0%) | 0 (0.0%) |
| 20 to 34 years | 0 (0.0%) | 0 (0.0%) |
| 35 to 50 years | 0 (0.0%) | 0 (0.0%) |
| Total | 0 (0.0%) | 0 (0.0%) |
Fertility by Education in Fort Myers Beach
| Educational Attainment | Women with Births | Births / 1,000 Women |
| Less than High School | 0 (0.0%) | 0.0 |
| High School Diploma | 0 (0.0%) | 0.0 |
| College or Associate's Degree | 0 (0.0%) | 0.0 |
| Bachelor's Degree | 0 (0.0%) | 0.0 |
| Graduate Degree | 0 (0.0%) | 0.0 |
| Total | 0 (0.0%) | 0.0 |
Fertility by Education by Marriage Status in Fort Myers Beach
| Educational Attainment | Married | Unmarried |
| Less than High School | 0 (0.0%) | 0 (0.0%) |
| High School Diploma | 0 (0.0%) | 0 (0.0%) |
| College or Associate's Degree | 0 (0.0%) | 0 (0.0%) |
| Bachelor's Degree | 0 (0.0%) | 0 (0.0%) |
| Graduate Degree | 0 (0.0%) | 0 (0.0%) |
| Total | 0 (0.0%) | 0 (0.0%) |
Employment Characteristics in Fort Myers Beach
Employment by Class of Employer in Fort Myers Beach
Among the 1,749 employed individuals in Fort Myers Beach, private company employees (1,160 | 66.3%), self-employed (incorporated) (231 | 13.2%), and self-employed (not incorporated) (134 | 7.7%) make up the most common classes of employment.
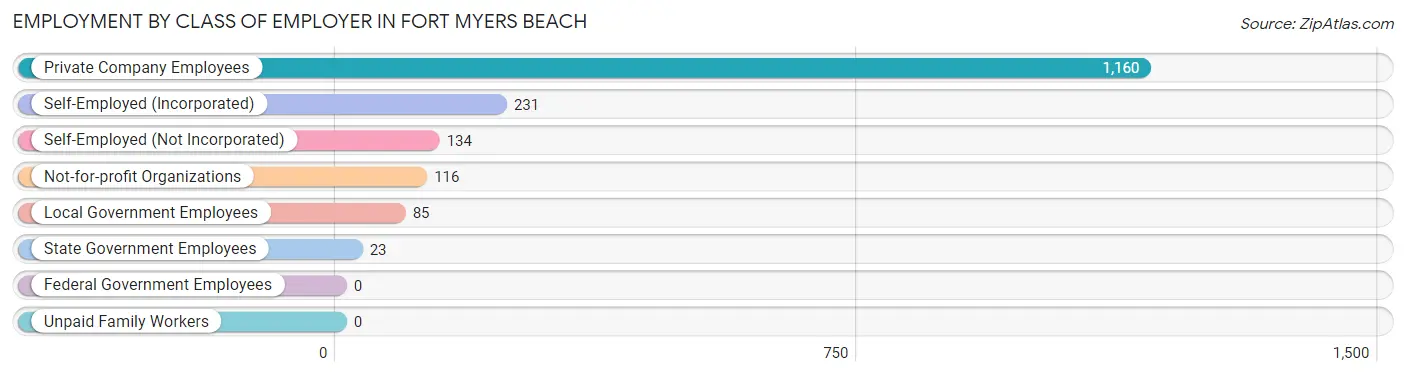
| Employer Class | # Employees | % Employees |
| Private Company Employees | 1,160 | 66.3% |
| Self-Employed (Incorporated) | 231 | 13.2% |
| Self-Employed (Not Incorporated) | 134 | 7.7% |
| Not-for-profit Organizations | 116 | 6.6% |
| Local Government Employees | 85 | 4.9% |
| State Government Employees | 23 | 1.3% |
| Federal Government Employees | 0 | 0.0% |
| Unpaid Family Workers | 0 | 0.0% |
| Total | 1,749 | 100.0% |
Employment Status by Age in Fort Myers Beach
According to the labor force statistics for Fort Myers Beach, out of the total population over 16 years of age (5,408), 34.0% or 1,839 individuals are in the labor force, with 3.6% or 66 of them unemployed. The age group with the highest labor force participation rate is 20 to 24 years, with 91.3% or 157 individuals in the labor force. Within the labor force, the 30 to 34 years age range has the highest percentage of unemployed individuals, with 25.0% or 17 of them being unemployed.
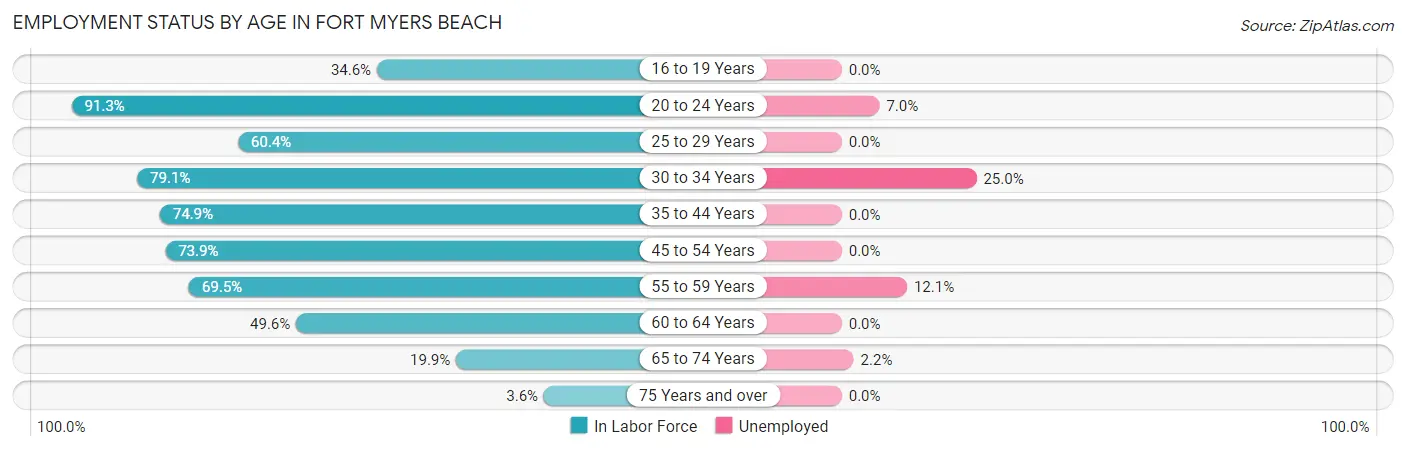
| Age Bracket | In Labor Force | Unemployed |
| 16 to 19 Years | 28 (34.6%) | 0 (0.0%) |
| 20 to 24 Years | 157 (91.3%) | 11 (7.0%) |
| 25 to 29 Years | 96 (60.4%) | 0 (0.0%) |
| 30 to 34 Years | 68 (79.1%) | 17 (25.0%) |
| 35 to 44 Years | 152 (74.9%) | 0 (0.0%) |
| 45 to 54 Years | 314 (73.9%) | 0 (0.0%) |
| 55 to 59 Years | 257 (69.5%) | 31 (12.1%) |
| 60 to 64 Years | 362 (49.6%) | 0 (0.0%) |
| 65 to 74 Years | 356 (19.9%) | 8 (2.2%) |
| 75 Years and over | 50 (3.6%) | 0 (0.0%) |
| Total | 1,839 (34.0%) | 66 (3.6%) |
Employment Status by Educational Attainment in Fort Myers Beach
According to labor force statistics for Fort Myers Beach, 63.3% of individuals (1,249) out of the total population between 25 and 64 years of age (1,973) are in the labor force, with 3.8% or 47 of them being unemployed. The group with the highest labor force participation rate are those with the educational attainment of less than high school, with 75.0% or 54 individuals in the labor force. Within the labor force, individuals with college / associate degree education have the highest percentage of unemployment, with 5.0% or 17 of them being unemployed.
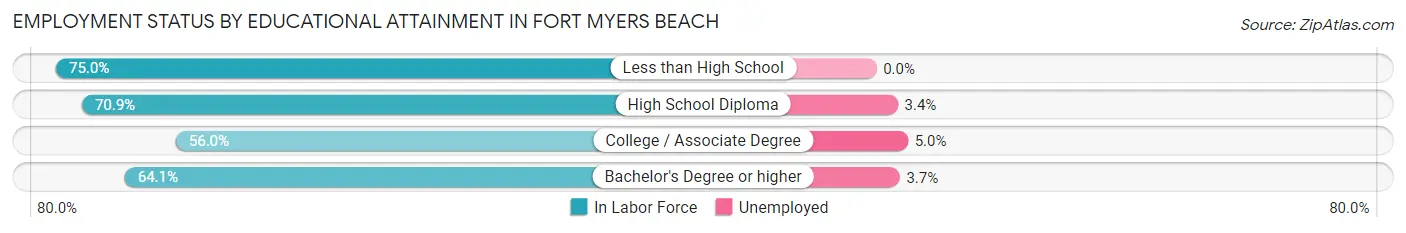
| Educational Attainment | In Labor Force | Unemployed |
| Less than High School | 54 (75.0%) | 0 (0.0%) |
| High School Diploma | 261 (70.9%) | 13 (3.4%) |
| College / Associate Degree | 340 (56.0%) | 30 (5.0%) |
| Bachelor's Degree or higher | 594 (64.1%) | 34 (3.7%) |
| Total | 1,249 (63.3%) | 75 (3.8%) |
Employment Occupations by Sex in Fort Myers Beach
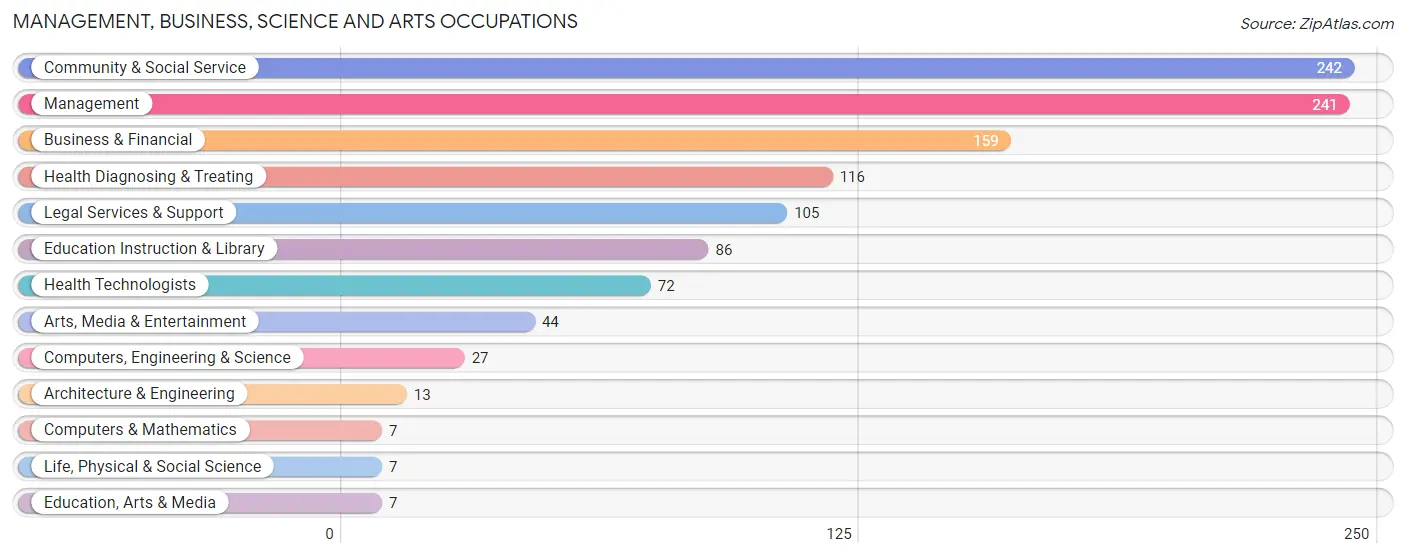
Management, Business, Science and Arts Occupations
The most common Management, Business, Science and Arts occupations in Fort Myers Beach are Community & Social Service (242 | 13.7%), Management (241 | 13.6%), Business & Financial (159 | 9.0%), Health Diagnosing & Treating (116 | 6.5%), and Legal Services & Support (105 | 5.9%).
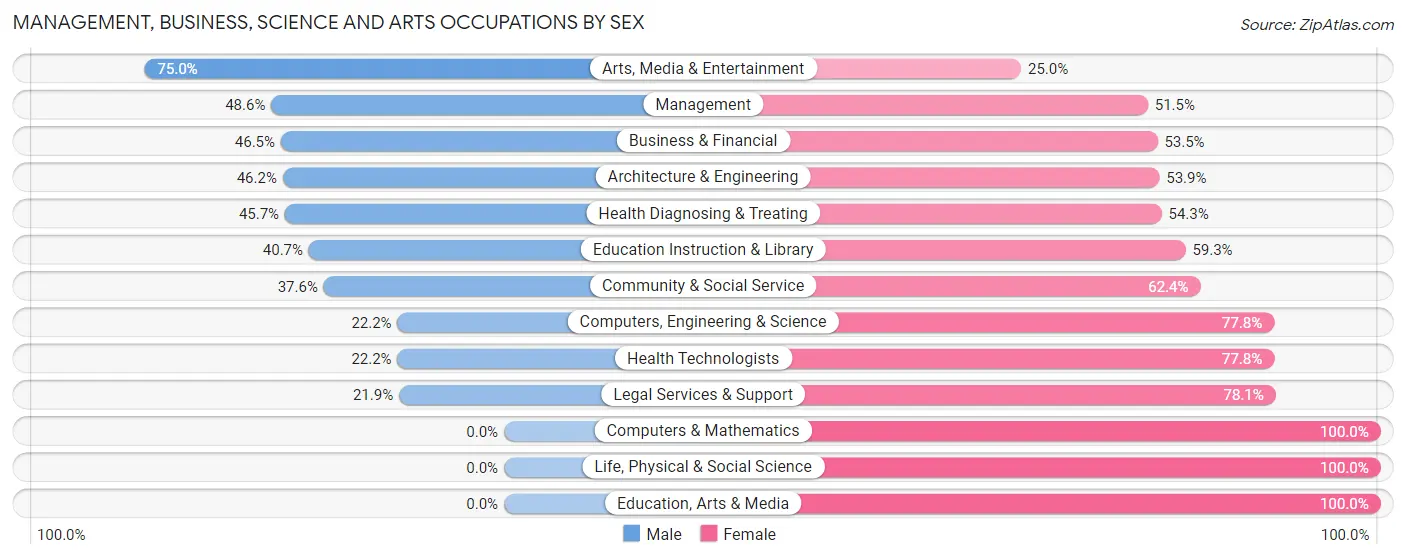
Management, Business, Science and Arts Occupations by Sex
Within the Management, Business, Science and Arts occupations in Fort Myers Beach, the most male-oriented occupations are Arts, Media & Entertainment (75.0%), Management (48.5%), and Business & Financial (46.5%), while the most female-oriented occupations are Computers & Mathematics (100.0%), Life, Physical & Social Science (100.0%), and Education, Arts & Media (100.0%).
| Occupation | Male | Female |
| Management | 117 (48.5%) | 124 (51.4%) |
| Business & Financial | 74 (46.5%) | 85 (53.5%) |
| Computers, Engineering & Science | 6 (22.2%) | 21 (77.8%) |
| Computers & Mathematics | 0 (0.0%) | 7 (100.0%) |
| Architecture & Engineering | 6 (46.2%) | 7 (53.8%) |
| Life, Physical & Social Science | 0 (0.0%) | 7 (100.0%) |
| Community & Social Service | 91 (37.6%) | 151 (62.4%) |
| Education, Arts & Media | 0 (0.0%) | 7 (100.0%) |
| Legal Services & Support | 23 (21.9%) | 82 (78.1%) |
| Education Instruction & Library | 35 (40.7%) | 51 (59.3%) |
| Arts, Media & Entertainment | 33 (75.0%) | 11 (25.0%) |
| Health Diagnosing & Treating | 53 (45.7%) | 63 (54.3%) |
| Health Technologists | 16 (22.2%) | 56 (77.8%) |
| Total (Category) | 341 (43.4%) | 444 (56.6%) |
| Total (Overall) | 865 (48.8%) | 908 (51.2%) |
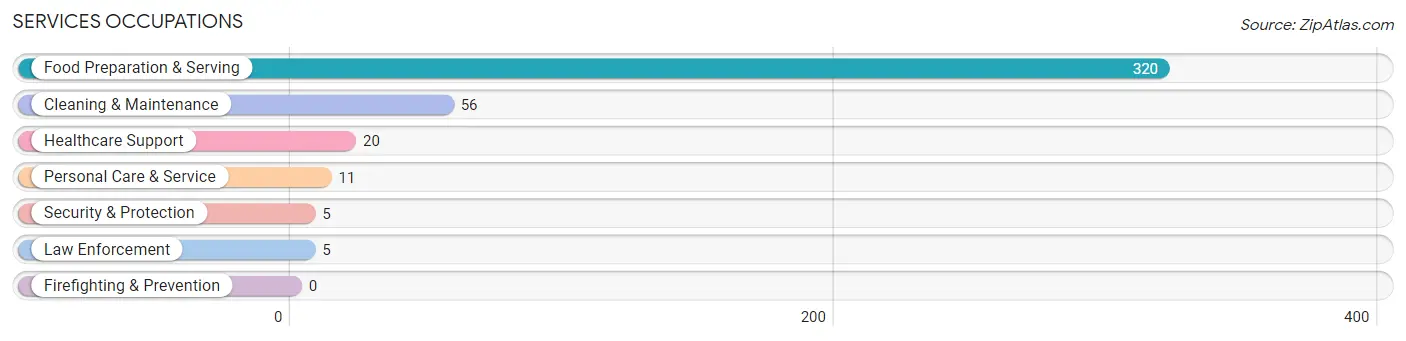
Services Occupations
The most common Services occupations in Fort Myers Beach are Food Preparation & Serving (320 | 18.0%), Cleaning & Maintenance (56 | 3.2%), Healthcare Support (20 | 1.1%), Personal Care & Service (11 | 0.6%), and Security & Protection (5 | 0.3%).
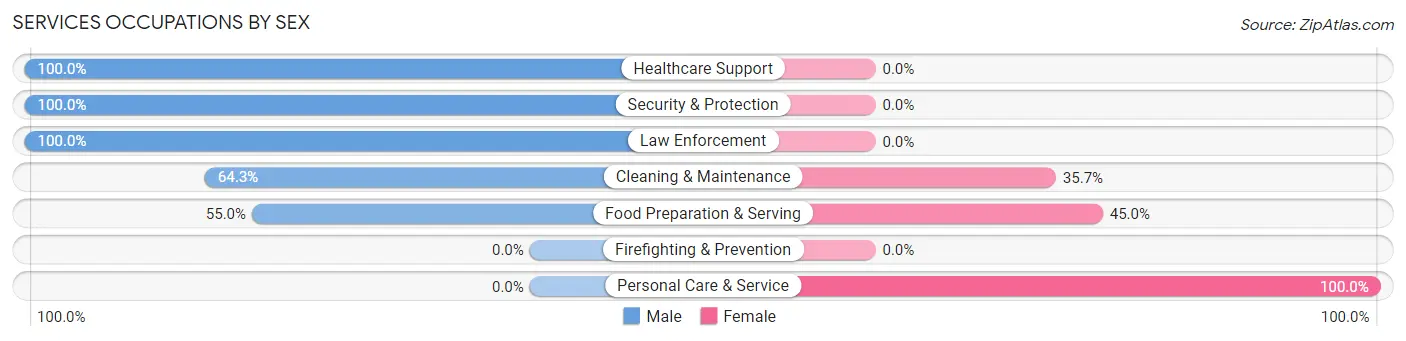
Services Occupations by Sex
Within the Services occupations in Fort Myers Beach, the most male-oriented occupations are Healthcare Support (100.0%), Security & Protection (100.0%), and Law Enforcement (100.0%), while the most female-oriented occupations are Personal Care & Service (100.0%), Food Preparation & Serving (45.0%), and Cleaning & Maintenance (35.7%).
| Occupation | Male | Female |
| Healthcare Support | 20 (100.0%) | 0 (0.0%) |
| Security & Protection | 5 (100.0%) | 0 (0.0%) |
| Firefighting & Prevention | 0 (0.0%) | 0 (0.0%) |
| Law Enforcement | 5 (100.0%) | 0 (0.0%) |
| Food Preparation & Serving | 176 (55.0%) | 144 (45.0%) |
| Cleaning & Maintenance | 36 (64.3%) | 20 (35.7%) |
| Personal Care & Service | 0 (0.0%) | 11 (100.0%) |
| Total (Category) | 237 (57.5%) | 175 (42.5%) |
| Total (Overall) | 865 (48.8%) | 908 (51.2%) |
Sales and Office Occupations
The most common Sales and Office occupations in Fort Myers Beach are Sales & Related (216 | 12.2%), and Office & Administration (101 | 5.7%).
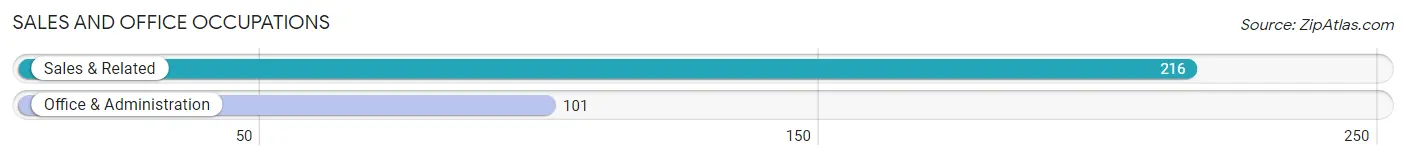
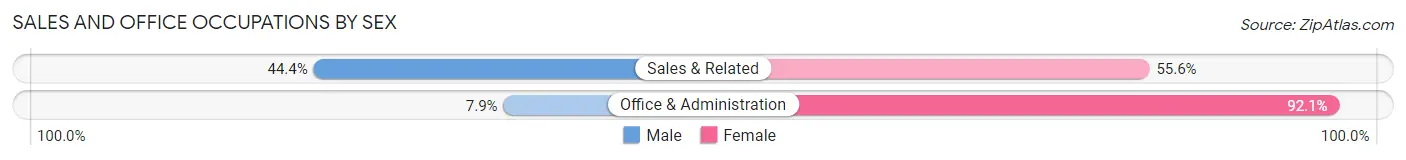
Sales and Office Occupations by Sex
| Occupation | Male | Female |
| Sales & Related | 96 (44.4%) | 120 (55.6%) |
| Office & Administration | 8 (7.9%) | 93 (92.1%) |
| Total (Category) | 104 (32.8%) | 213 (67.2%) |
| Total (Overall) | 865 (48.8%) | 908 (51.2%) |
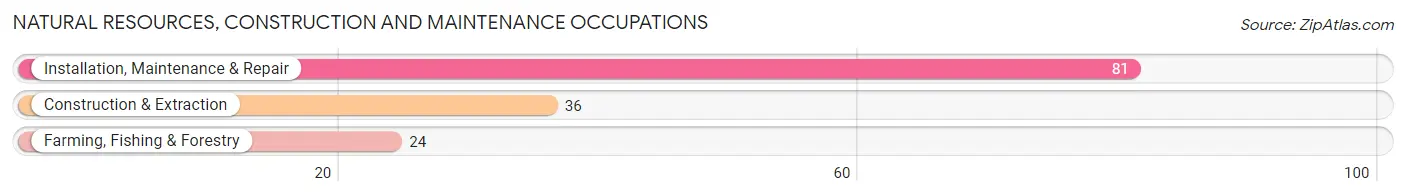
Natural Resources, Construction and Maintenance Occupations
The most common Natural Resources, Construction and Maintenance occupations in Fort Myers Beach are Installation, Maintenance & Repair (81 | 4.6%), Construction & Extraction (36 | 2.0%), and Farming, Fishing & Forestry (24 | 1.3%).
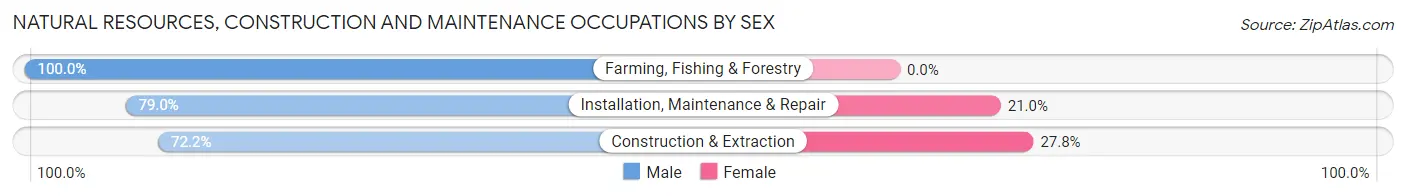
Natural Resources, Construction and Maintenance Occupations by Sex
| Occupation | Male | Female |
| Farming, Fishing & Forestry | 24 (100.0%) | 0 (0.0%) |
| Construction & Extraction | 26 (72.2%) | 10 (27.8%) |
| Installation, Maintenance & Repair | 64 (79.0%) | 17 (21.0%) |
| Total (Category) | 114 (80.8%) | 27 (19.2%) |
| Total (Overall) | 865 (48.8%) | 908 (51.2%) |
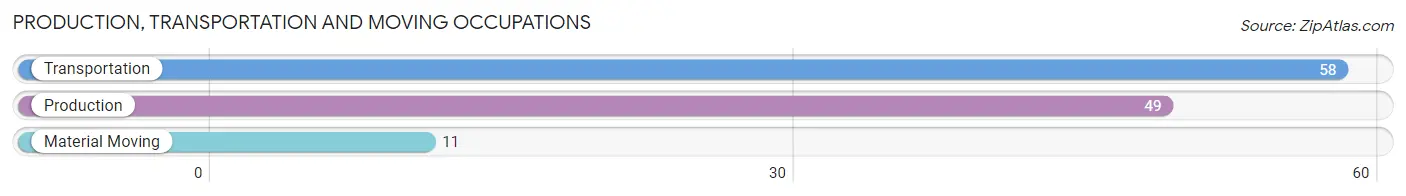
Production, Transportation and Moving Occupations
The most common Production, Transportation and Moving occupations in Fort Myers Beach are Transportation (58 | 3.3%), Production (49 | 2.8%), and Material Moving (11 | 0.6%).
Production, Transportation and Moving Occupations by Sex
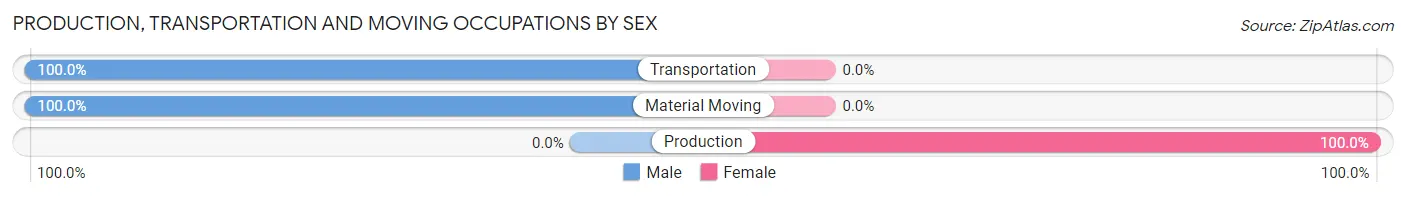
| Occupation | Male | Female |
| Production | 0 (0.0%) | 49 (100.0%) |
| Transportation | 58 (100.0%) | 0 (0.0%) |
| Material Moving | 11 (100.0%) | 0 (0.0%) |
| Total (Category) | 69 (58.5%) | 49 (41.5%) |
| Total (Overall) | 865 (48.8%) | 908 (51.2%) |
Employment Industries by Sex in Fort Myers Beach
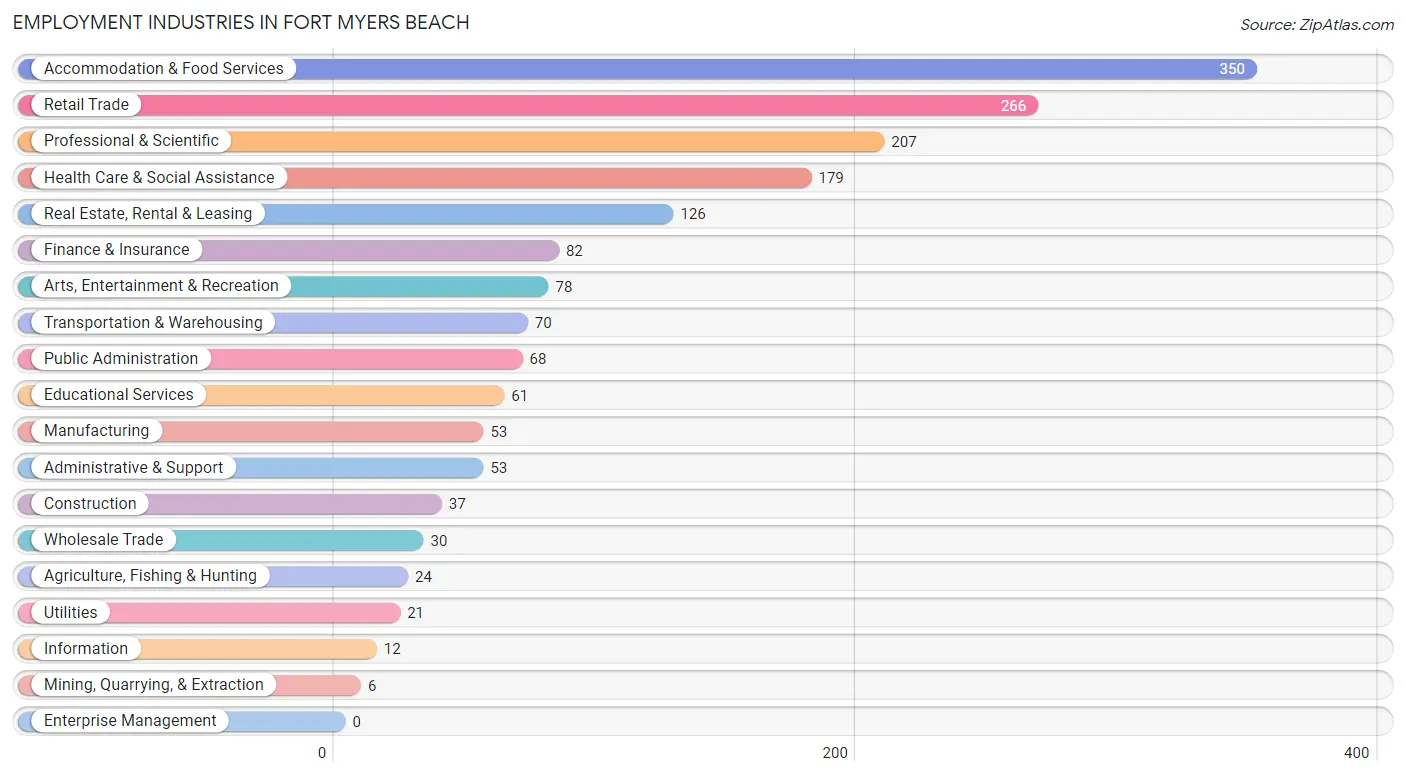
Employment Industries in Fort Myers Beach
The major employment industries in Fort Myers Beach include Accommodation & Food Services (350 | 19.7%), Retail Trade (266 | 15.0%), Professional & Scientific (207 | 11.7%), Health Care & Social Assistance (179 | 10.1%), and Real Estate, Rental & Leasing (126 | 7.1%).
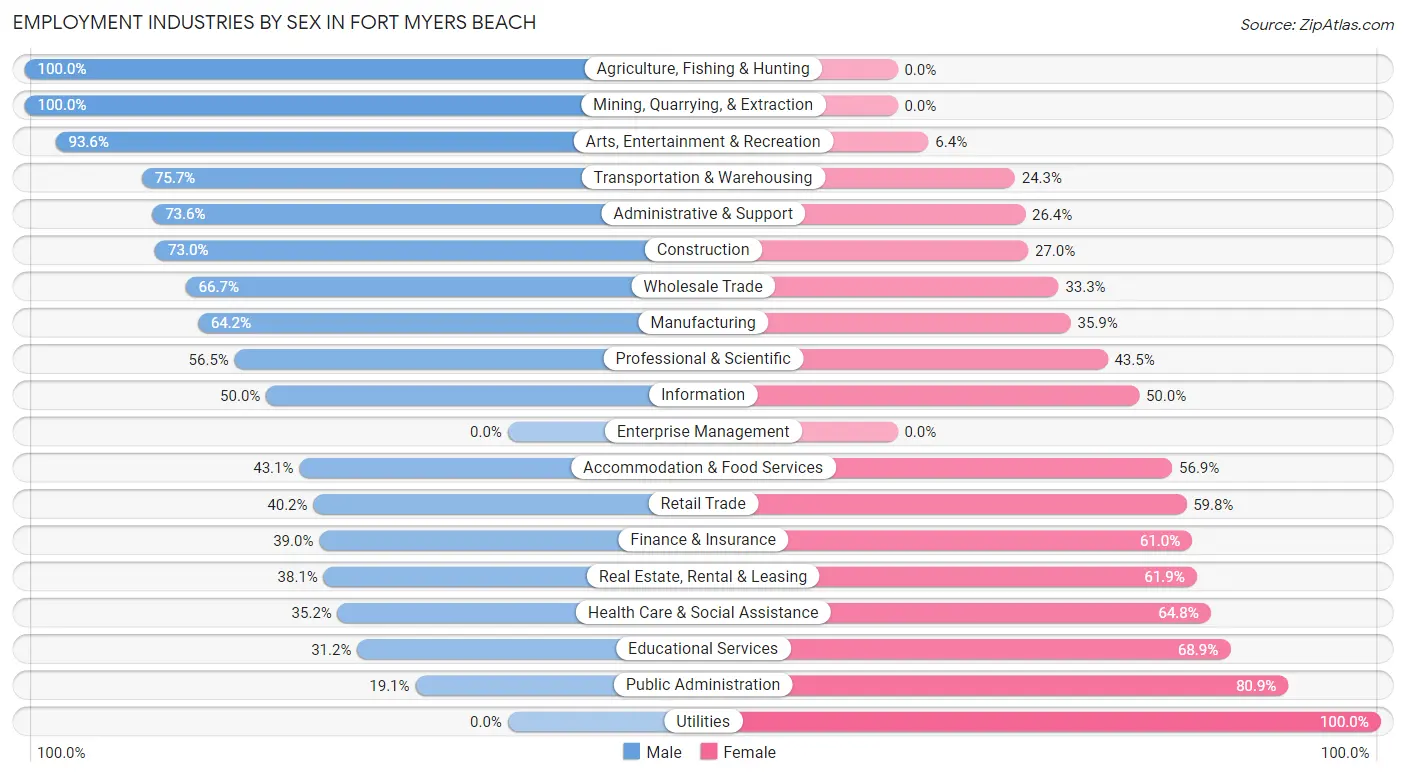
Employment Industries by Sex in Fort Myers Beach
The Fort Myers Beach industries that see more men than women are Agriculture, Fishing & Hunting (100.0%), Mining, Quarrying, & Extraction (100.0%), and Arts, Entertainment & Recreation (93.6%), whereas the industries that tend to have a higher number of women are Utilities (100.0%), Public Administration (80.9%), and Educational Services (68.9%).
| Industry | Male | Female |
| Agriculture, Fishing & Hunting | 24 (100.0%) | 0 (0.0%) |
| Mining, Quarrying, & Extraction | 6 (100.0%) | 0 (0.0%) |
| Construction | 27 (73.0%) | 10 (27.0%) |
| Manufacturing | 34 (64.1%) | 19 (35.8%) |
| Wholesale Trade | 20 (66.7%) | 10 (33.3%) |
| Retail Trade | 107 (40.2%) | 159 (59.8%) |
| Transportation & Warehousing | 53 (75.7%) | 17 (24.3%) |
| Utilities | 0 (0.0%) | 21 (100.0%) |
| Information | 6 (50.0%) | 6 (50.0%) |
| Finance & Insurance | 32 (39.0%) | 50 (61.0%) |
| Real Estate, Rental & Leasing | 48 (38.1%) | 78 (61.9%) |
| Professional & Scientific | 117 (56.5%) | 90 (43.5%) |
| Enterprise Management | 0 (0.0%) | 0 (0.0%) |
| Administrative & Support | 39 (73.6%) | 14 (26.4%) |
| Educational Services | 19 (31.1%) | 42 (68.9%) |
| Health Care & Social Assistance | 63 (35.2%) | 116 (64.8%) |
| Arts, Entertainment & Recreation | 73 (93.6%) | 5 (6.4%) |
| Accommodation & Food Services | 151 (43.1%) | 199 (56.9%) |
| Public Administration | 13 (19.1%) | 55 (80.9%) |
| Total | 865 (48.8%) | 908 (51.2%) |
Education in Fort Myers Beach
School Enrollment in Fort Myers Beach
The most common levels of schooling among the 439 students in Fort Myers Beach are college / undergraduate (141 | 32.1%), high school (99 | 22.6%), and middle school (89 | 20.3%).
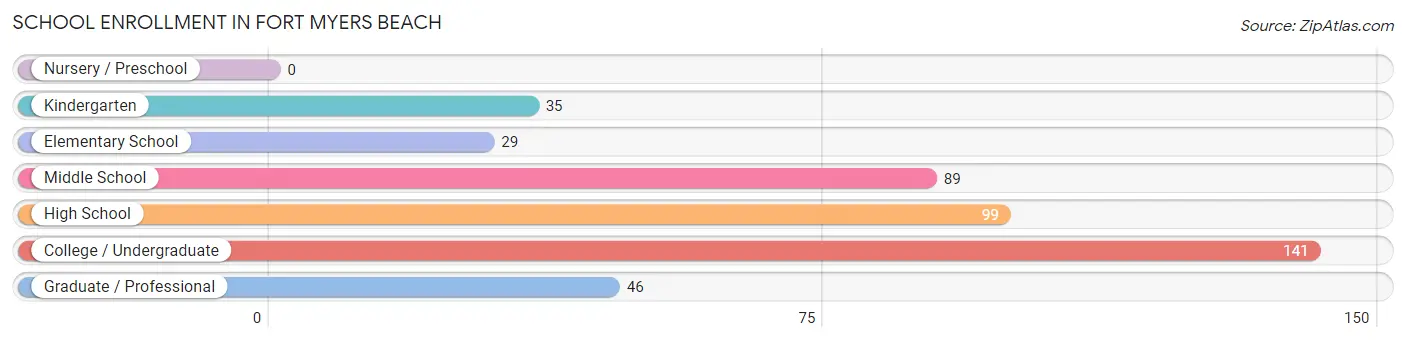
| School Level | # Students | % Students |
| Nursery / Preschool | 0 | 0.0% |
| Kindergarten | 35 | 8.0% |
| Elementary School | 29 | 6.6% |
| Middle School | 89 | 20.3% |
| High School | 99 | 22.6% |
| College / Undergraduate | 141 | 32.1% |
| Graduate / Professional | 46 | 10.5% |
| Total | 439 | 100.0% |
School Enrollment by Age by Funding Source in Fort Myers Beach
Out of a total of 439 students who are enrolled in schools in Fort Myers Beach, 199 (45.3%) attend a private institution, while the remaining 240 (54.7%) are enrolled in public schools. The age group of 15 to 17 year olds has the highest likelihood of being enrolled in private schools, with 62 (87.3% in the age bracket) enrolled. Conversely, the age group of 3 to 4 year olds has the lowest likelihood of being enrolled in a private school, with 19 (100.0% in the age bracket) attending a public institution.
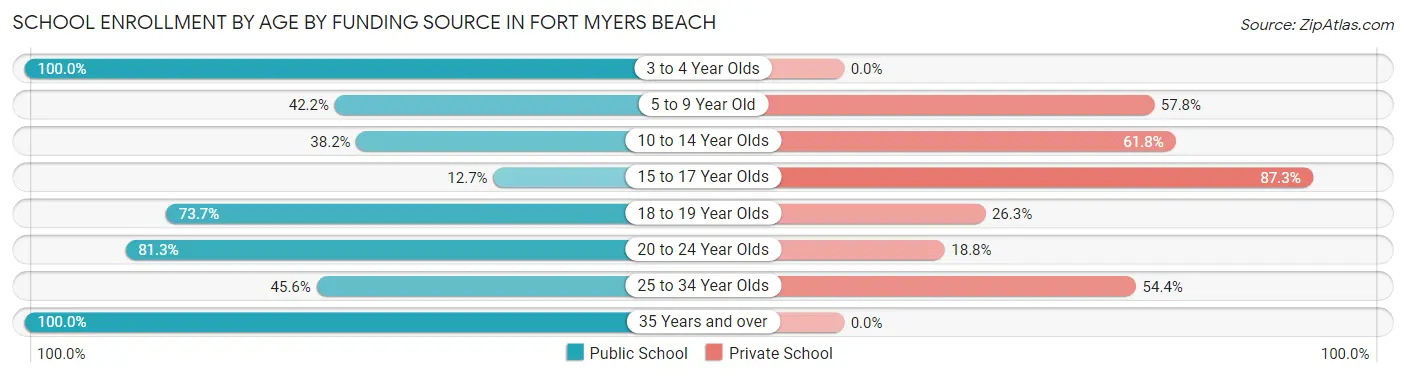
| Age Bracket | Public School | Private School |
| 3 to 4 Year Olds | 19 (100.0%) | 0 (0.0%) |
| 5 to 9 Year Old | 19 (42.2%) | 26 (57.8%) |
| 10 to 14 Year Olds | 34 (38.2%) | 55 (61.8%) |
| 15 to 17 Year Olds | 9 (12.7%) | 62 (87.3%) |
| 18 to 19 Year Olds | 28 (73.7%) | 10 (26.3%) |
| 20 to 24 Year Olds | 65 (81.2%) | 15 (18.8%) |
| 25 to 34 Year Olds | 26 (45.6%) | 31 (54.4%) |
| 35 Years and over | 40 (100.0%) | 0 (0.0%) |
| Total | 240 (54.7%) | 199 (45.3%) |
Educational Attainment by Field of Study in Fort Myers Beach
Education (479 | 18.8%), business (470 | 18.4%), social sciences (241 | 9.4%), literature & languages (176 | 6.9%), and psychology (171 | 6.7%) are the most common fields of study among 2,552 individuals in Fort Myers Beach who have obtained a bachelor's degree or higher.
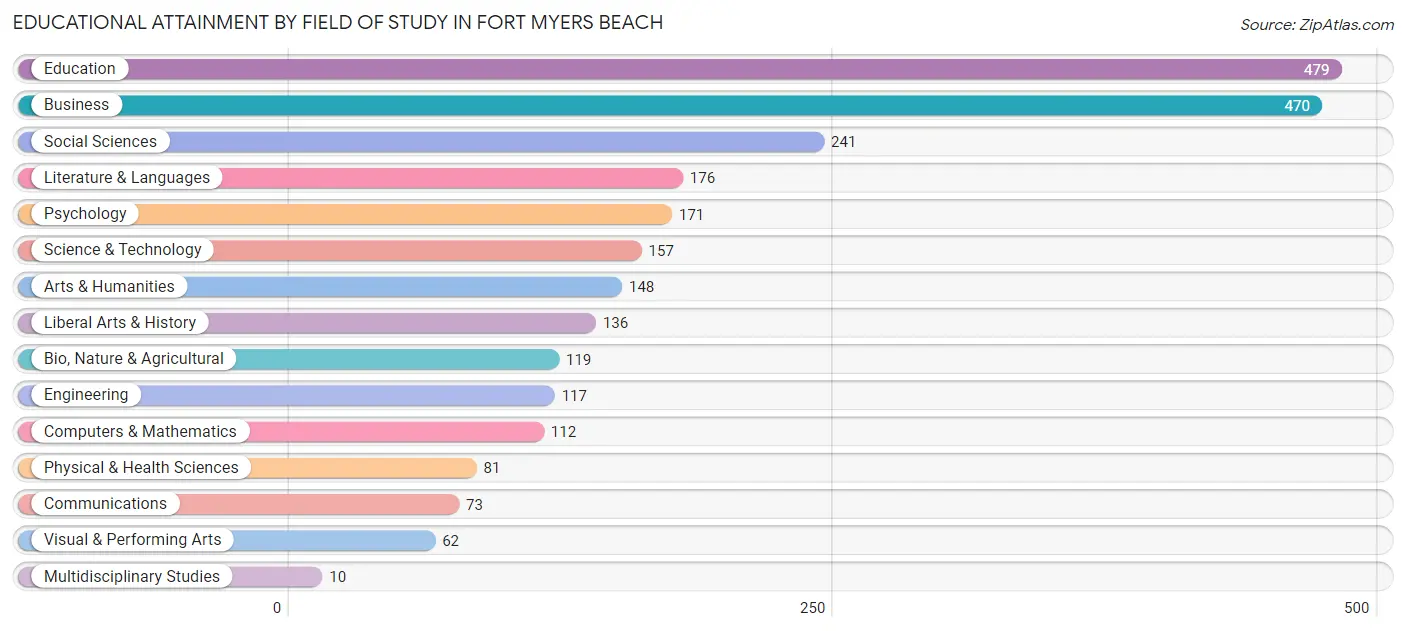
| Field of Study | # Graduates | % Graduates |
| Computers & Mathematics | 112 | 4.4% |
| Bio, Nature & Agricultural | 119 | 4.7% |
| Physical & Health Sciences | 81 | 3.2% |
| Psychology | 171 | 6.7% |
| Social Sciences | 241 | 9.4% |
| Engineering | 117 | 4.6% |
| Multidisciplinary Studies | 10 | 0.4% |
| Science & Technology | 157 | 6.1% |
| Business | 470 | 18.4% |
| Education | 479 | 18.8% |
| Literature & Languages | 176 | 6.9% |
| Liberal Arts & History | 136 | 5.3% |
| Visual & Performing Arts | 62 | 2.4% |
| Communications | 73 | 2.9% |
| Arts & Humanities | 148 | 5.8% |
| Total | 2,552 | 100.0% |
Transportation & Commute in Fort Myers Beach
Vehicle Availability by Sex in Fort Myers Beach
The most prevalent vehicle ownership categories in Fort Myers Beach are males with 2 vehicles (341, accounting for 40.6%) and females with 2 vehicles (356, making up 37.6%).
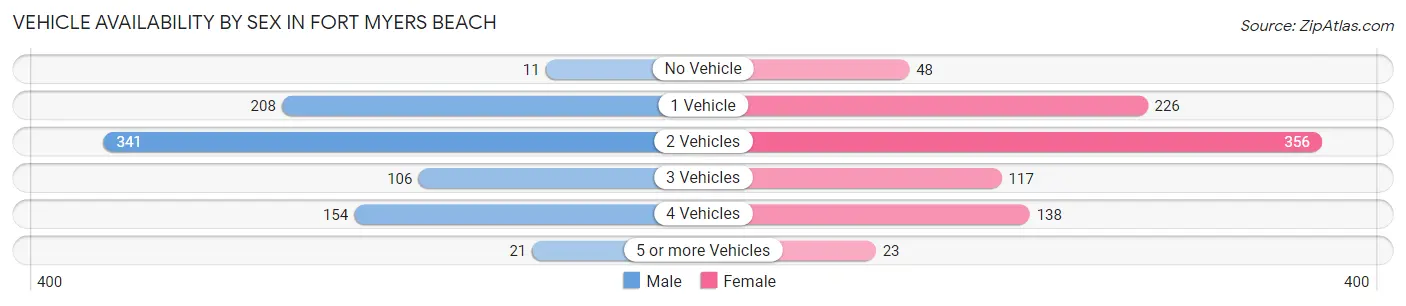
| Vehicles Available | Male | Female |
| No Vehicle | 11 (1.3%) | 48 (5.3%) |
| 1 Vehicle | 208 (24.7%) | 226 (24.9%) |
| 2 Vehicles | 341 (40.6%) | 356 (39.2%) |
| 3 Vehicles | 106 (12.6%) | 117 (12.9%) |
| 4 Vehicles | 154 (18.3%) | 138 (15.2%) |
| 5 or more Vehicles | 21 (2.5%) | 23 (2.5%) |
| Total | 841 (100.0%) | 908 (100.0%) |
Commute Time in Fort Myers Beach
The most frequently occuring commute durations in Fort Myers Beach are 5 to 9 minutes (266 commuters, 19.3%), 10 to 14 minutes (258 commuters, 18.7%), and less than 5 minutes (141 commuters, 10.2%).
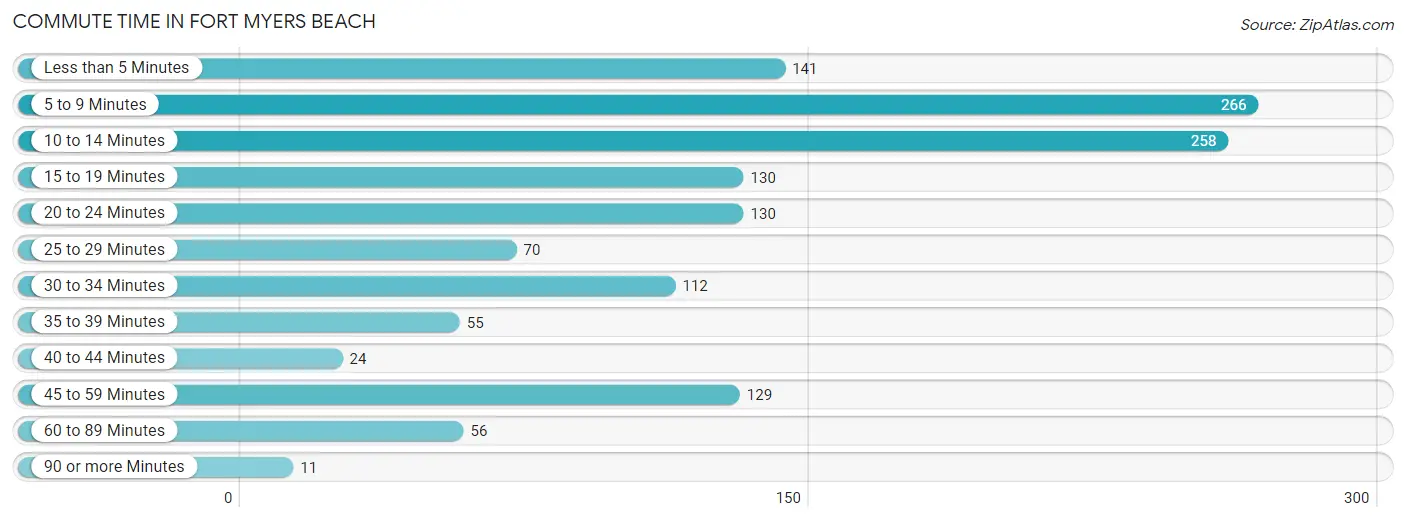
| Commute Time | # Commuters | % Commuters |
| Less than 5 Minutes | 141 | 10.2% |
| 5 to 9 Minutes | 266 | 19.3% |
| 10 to 14 Minutes | 258 | 18.7% |
| 15 to 19 Minutes | 130 | 9.4% |
| 20 to 24 Minutes | 130 | 9.4% |
| 25 to 29 Minutes | 70 | 5.1% |
| 30 to 34 Minutes | 112 | 8.1% |
| 35 to 39 Minutes | 55 | 4.0% |
| 40 to 44 Minutes | 24 | 1.7% |
| 45 to 59 Minutes | 129 | 9.3% |
| 60 to 89 Minutes | 56 | 4.1% |
| 90 or more Minutes | 11 | 0.8% |
Commute Time by Sex in Fort Myers Beach
The most common commute times in Fort Myers Beach are 5 to 9 minutes (132 commuters, 20.6%) for males and 5 to 9 minutes (134 commuters, 18.1%) for females.
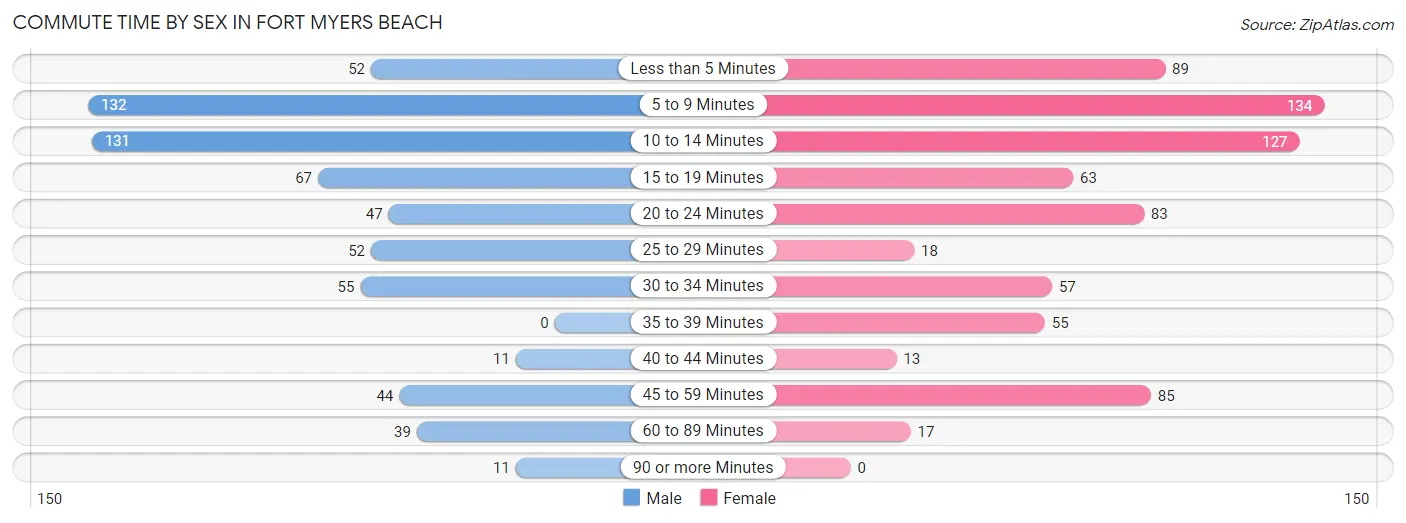
| Commute Time | Male | Female |
| Less than 5 Minutes | 52 (8.1%) | 89 (12.0%) |
| 5 to 9 Minutes | 132 (20.6%) | 134 (18.1%) |
| 10 to 14 Minutes | 131 (20.4%) | 127 (17.1%) |
| 15 to 19 Minutes | 67 (10.4%) | 63 (8.5%) |
| 20 to 24 Minutes | 47 (7.3%) | 83 (11.2%) |
| 25 to 29 Minutes | 52 (8.1%) | 18 (2.4%) |
| 30 to 34 Minutes | 55 (8.6%) | 57 (7.7%) |
| 35 to 39 Minutes | 0 (0.0%) | 55 (7.4%) |
| 40 to 44 Minutes | 11 (1.7%) | 13 (1.8%) |
| 45 to 59 Minutes | 44 (6.9%) | 85 (11.5%) |
| 60 to 89 Minutes | 39 (6.1%) | 17 (2.3%) |
| 90 or more Minutes | 11 (1.7%) | 0 (0.0%) |
Time of Departure to Work by Sex in Fort Myers Beach
The most frequent times of departure to work in Fort Myers Beach are 6:30 AM to 6:59 AM (106, 16.5%) for males and 8:00 AM to 8:29 AM (137, 18.5%) for females.
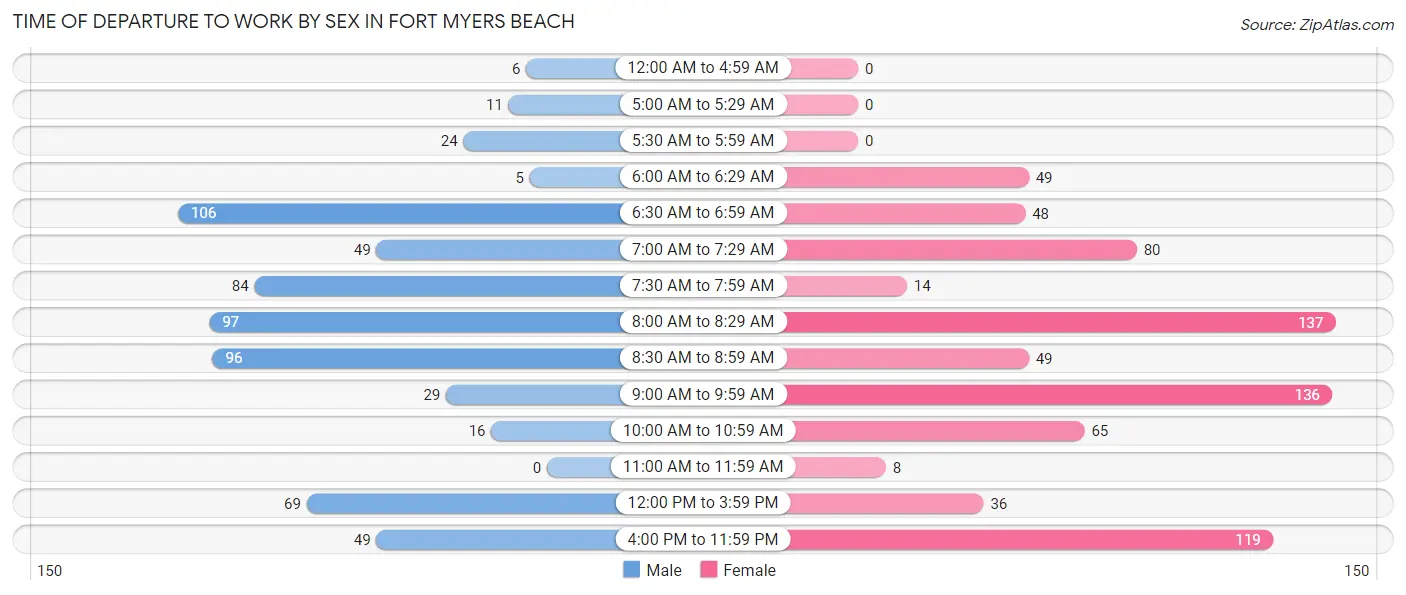
| Time of Departure | Male | Female |
| 12:00 AM to 4:59 AM | 6 (0.9%) | 0 (0.0%) |
| 5:00 AM to 5:29 AM | 11 (1.7%) | 0 (0.0%) |
| 5:30 AM to 5:59 AM | 24 (3.7%) | 0 (0.0%) |
| 6:00 AM to 6:29 AM | 5 (0.8%) | 49 (6.6%) |
| 6:30 AM to 6:59 AM | 106 (16.5%) | 48 (6.5%) |
| 7:00 AM to 7:29 AM | 49 (7.6%) | 80 (10.8%) |
| 7:30 AM to 7:59 AM | 84 (13.1%) | 14 (1.9%) |
| 8:00 AM to 8:29 AM | 97 (15.1%) | 137 (18.5%) |
| 8:30 AM to 8:59 AM | 96 (15.0%) | 49 (6.6%) |
| 9:00 AM to 9:59 AM | 29 (4.5%) | 136 (18.3%) |
| 10:00 AM to 10:59 AM | 16 (2.5%) | 65 (8.8%) |
| 11:00 AM to 11:59 AM | 0 (0.0%) | 8 (1.1%) |
| 12:00 PM to 3:59 PM | 69 (10.8%) | 36 (4.9%) |
| 4:00 PM to 11:59 PM | 49 (7.6%) | 119 (16.1%) |
| Total | 641 (100.0%) | 741 (100.0%) |
Housing Occupancy in Fort Myers Beach
Occupancy by Ownership in Fort Myers Beach
Of the total 2,879 dwellings in Fort Myers Beach, owner-occupied units account for 2,596 (90.2%), while renter-occupied units make up 283 (9.8%).
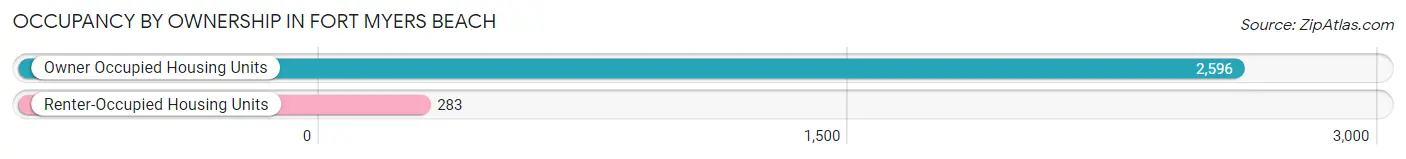
| Occupancy | # Housing Units | % Housing Units |
| Owner Occupied Housing Units | 2,596 | 90.2% |
| Renter-Occupied Housing Units | 283 | 9.8% |
| Total Occupied Housing Units | 2,879 | 100.0% |
Occupancy by Household Size in Fort Myers Beach
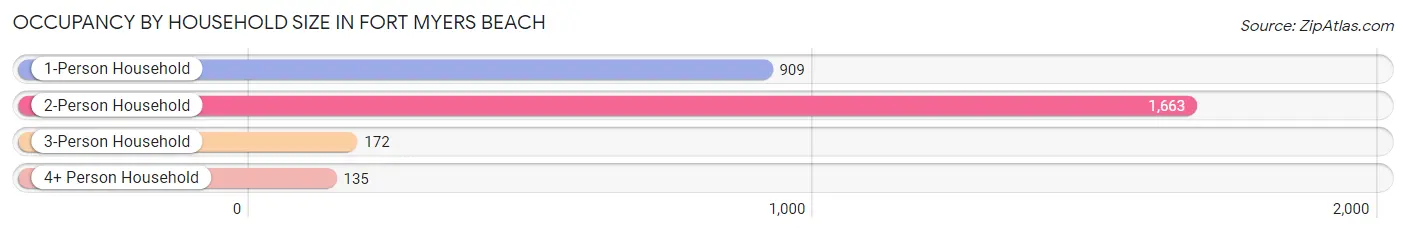
| Household Size | # Housing Units | % Housing Units |
| 1-Person Household | 909 | 31.6% |
| 2-Person Household | 1,663 | 57.8% |
| 3-Person Household | 172 | 6.0% |
| 4+ Person Household | 135 | 4.7% |
| Total Housing Units | 2,879 | 100.0% |
Occupancy by Ownership by Household Size in Fort Myers Beach
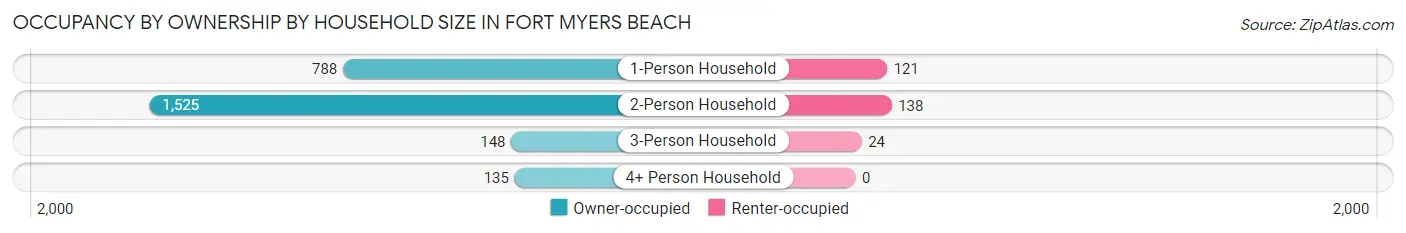
| Household Size | Owner-occupied | Renter-occupied |
| 1-Person Household | 788 (86.7%) | 121 (13.3%) |
| 2-Person Household | 1,525 (91.7%) | 138 (8.3%) |
| 3-Person Household | 148 (86.1%) | 24 (14.0%) |
| 4+ Person Household | 135 (100.0%) | 0 (0.0%) |
| Total Housing Units | 2,596 (90.2%) | 283 (9.8%) |
Occupancy by Educational Attainment in Fort Myers Beach
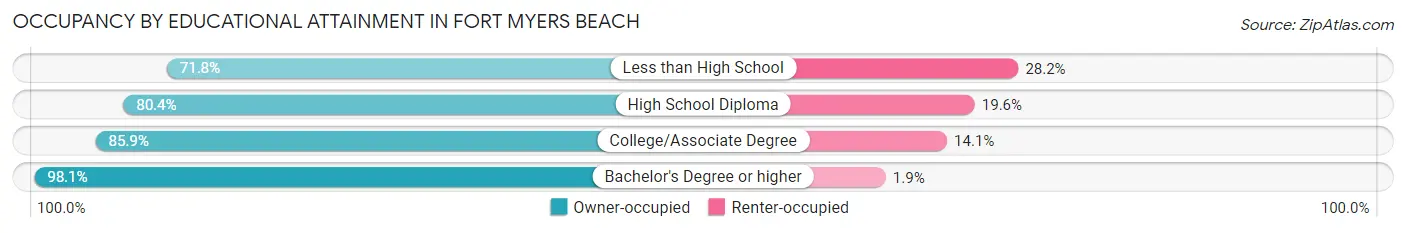
| Household Size | Owner-occupied | Renter-occupied |
| Less than High School | 84 (71.8%) | 33 (28.2%) |
| High School Diploma | 452 (80.4%) | 110 (19.6%) |
| College/Associate Degree | 690 (85.9%) | 113 (14.1%) |
| Bachelor's Degree or higher | 1,370 (98.1%) | 27 (1.9%) |
Occupancy by Age of Householder in Fort Myers Beach
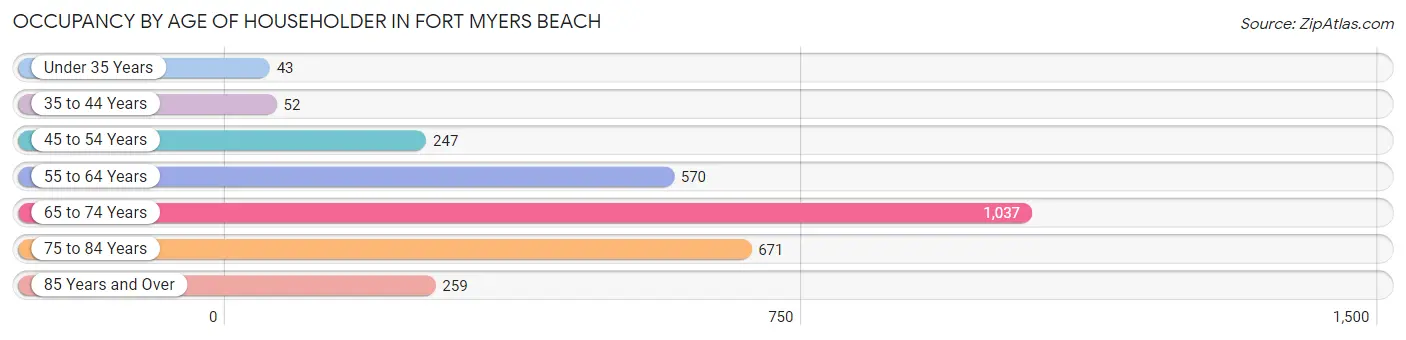
| Age Bracket | # Households | % Households |
| Under 35 Years | 43 | 1.5% |
| 35 to 44 Years | 52 | 1.8% |
| 45 to 54 Years | 247 | 8.6% |
| 55 to 64 Years | 570 | 19.8% |
| 65 to 74 Years | 1,037 | 36.0% |
| 75 to 84 Years | 671 | 23.3% |
| 85 Years and Over | 259 | 9.0% |
| Total | 2,879 | 100.0% |
Housing Finances in Fort Myers Beach
Median Income by Occupancy in Fort Myers Beach
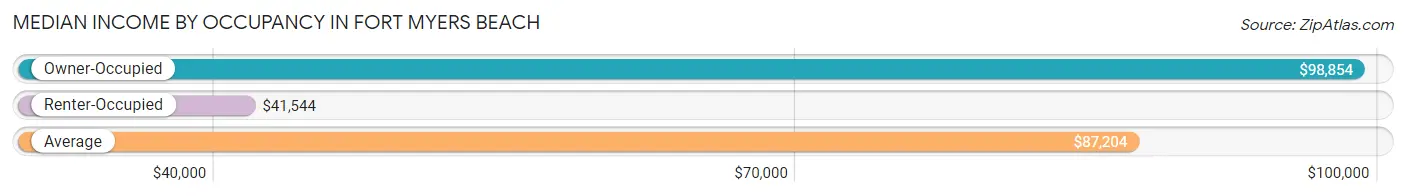
| Occupancy Type | # Households | Median Income |
| Owner-Occupied | 2,596 (90.2%) | $98,854 |
| Renter-Occupied | 283 (9.8%) | $41,544 |
| Average | 2,879 (100.0%) | $87,204 |
Occupancy by Householder Income Bracket in Fort Myers Beach
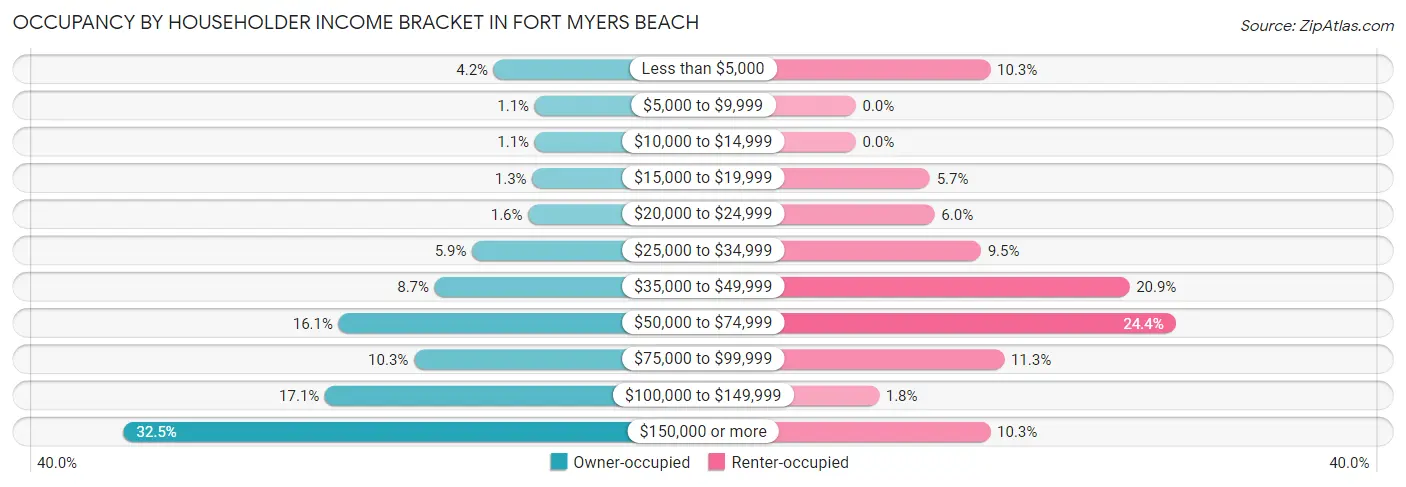
| Income Bracket | Owner-occupied | Renter-occupied |
| Less than $5,000 | 110 (4.2%) | 29 (10.2%) |
| $5,000 to $9,999 | 29 (1.1%) | 0 (0.0%) |
| $10,000 to $14,999 | 29 (1.1%) | 0 (0.0%) |
| $15,000 to $19,999 | 34 (1.3%) | 16 (5.7%) |
| $20,000 to $24,999 | 42 (1.6%) | 17 (6.0%) |
| $25,000 to $34,999 | 153 (5.9%) | 27 (9.5%) |
| $35,000 to $49,999 | 227 (8.7%) | 59 (20.8%) |
| $50,000 to $74,999 | 417 (16.1%) | 69 (24.4%) |
| $75,000 to $99,999 | 268 (10.3%) | 32 (11.3%) |
| $100,000 to $149,999 | 444 (17.1%) | 5 (1.8%) |
| $150,000 or more | 843 (32.5%) | 29 (10.2%) |
| Total | 2,596 (100.0%) | 283 (100.0%) |
Monthly Housing Cost Tiers in Fort Myers Beach
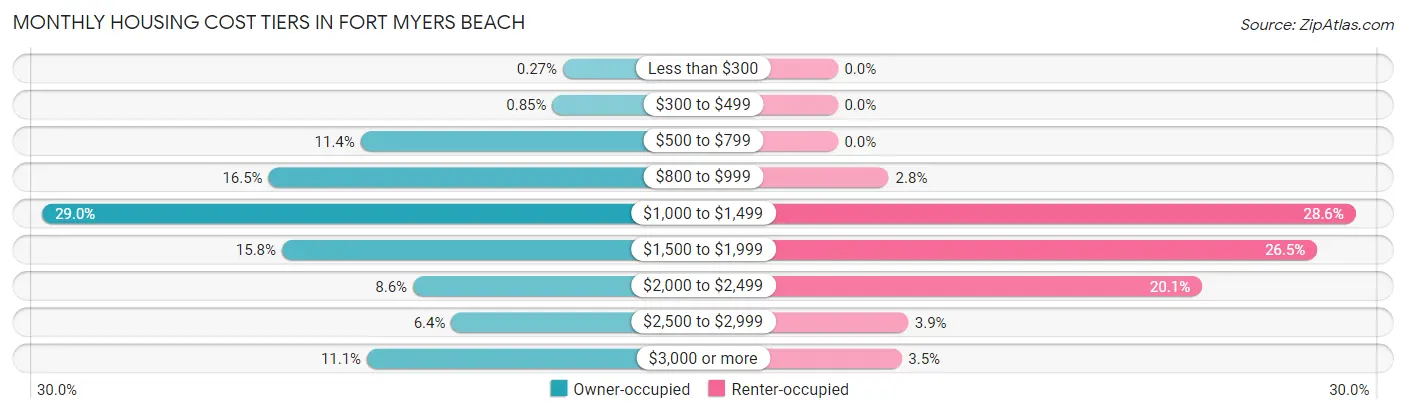
| Monthly Cost | Owner-occupied | Renter-occupied |
| Less than $300 | 7 (0.3%) | 0 (0.0%) |
| $300 to $499 | 22 (0.9%) | 0 (0.0%) |
| $500 to $799 | 297 (11.4%) | 0 (0.0%) |
| $800 to $999 | 429 (16.5%) | 8 (2.8%) |
| $1,000 to $1,499 | 754 (29.0%) | 81 (28.6%) |
| $1,500 to $1,999 | 410 (15.8%) | 75 (26.5%) |
| $2,000 to $2,499 | 222 (8.6%) | 57 (20.1%) |
| $2,500 to $2,999 | 167 (6.4%) | 11 (3.9%) |
| $3,000 or more | 288 (11.1%) | 10 (3.5%) |
| Total | 2,596 (100.0%) | 283 (100.0%) |
Physical Housing Characteristics in Fort Myers Beach
Housing Structures in Fort Myers Beach
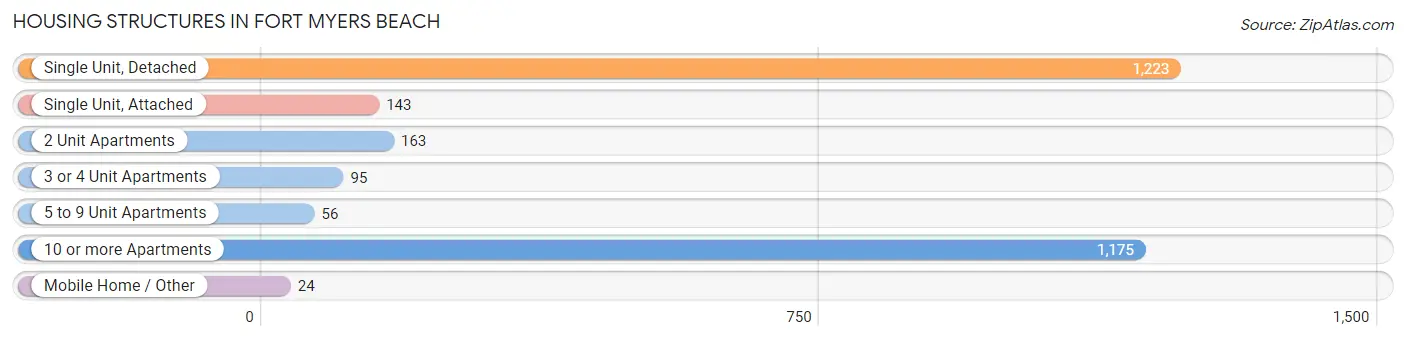
| Structure Type | # Housing Units | % Housing Units |
| Single Unit, Detached | 1,223 | 42.5% |
| Single Unit, Attached | 143 | 5.0% |
| 2 Unit Apartments | 163 | 5.7% |
| 3 or 4 Unit Apartments | 95 | 3.3% |
| 5 to 9 Unit Apartments | 56 | 1.9% |
| 10 or more Apartments | 1,175 | 40.8% |
| Mobile Home / Other | 24 | 0.8% |
| Total | 2,879 | 100.0% |
Housing Structures by Occupancy in Fort Myers Beach
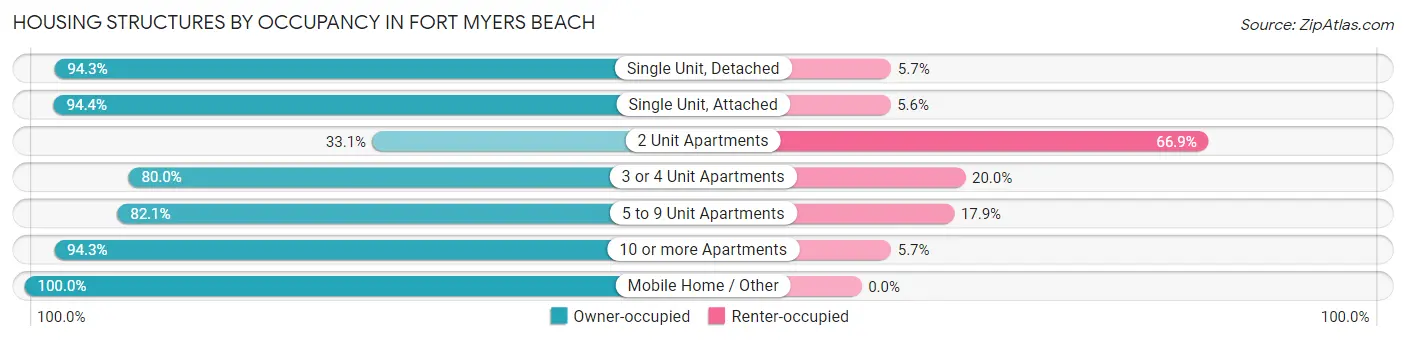
| Structure Type | Owner-occupied | Renter-occupied |
| Single Unit, Detached | 1,153 (94.3%) | 70 (5.7%) |
| Single Unit, Attached | 135 (94.4%) | 8 (5.6%) |
| 2 Unit Apartments | 54 (33.1%) | 109 (66.9%) |
| 3 or 4 Unit Apartments | 76 (80.0%) | 19 (20.0%) |
| 5 to 9 Unit Apartments | 46 (82.1%) | 10 (17.9%) |
| 10 or more Apartments | 1,108 (94.3%) | 67 (5.7%) |
| Mobile Home / Other | 24 (100.0%) | 0 (0.0%) |
| Total | 2,596 (90.2%) | 283 (9.8%) |
Housing Structures by Number of Rooms in Fort Myers Beach
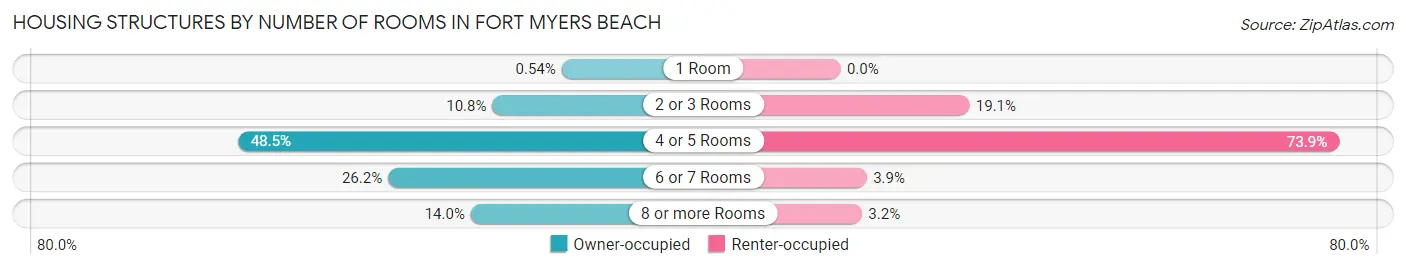
| Number of Rooms | Owner-occupied | Renter-occupied |
| 1 Room | 14 (0.5%) | 0 (0.0%) |
| 2 or 3 Rooms | 280 (10.8%) | 54 (19.1%) |
| 4 or 5 Rooms | 1,258 (48.5%) | 209 (73.9%) |
| 6 or 7 Rooms | 681 (26.2%) | 11 (3.9%) |
| 8 or more Rooms | 363 (14.0%) | 9 (3.2%) |
| Total | 2,596 (100.0%) | 283 (100.0%) |
Housing Structure by Heating Type in Fort Myers Beach
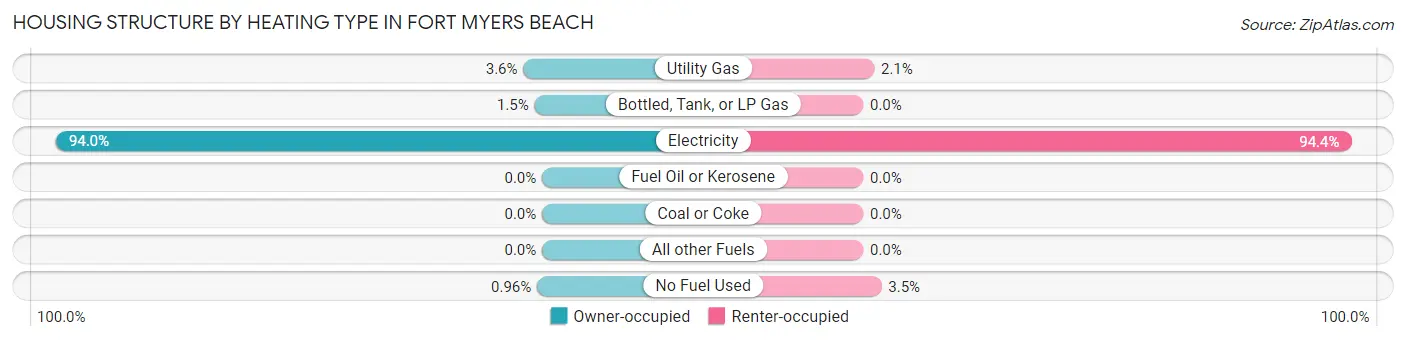
| Heating Type | Owner-occupied | Renter-occupied |
| Utility Gas | 94 (3.6%) | 6 (2.1%) |
| Bottled, Tank, or LP Gas | 38 (1.5%) | 0 (0.0%) |
| Electricity | 2,439 (94.0%) | 267 (94.4%) |
| Fuel Oil or Kerosene | 0 (0.0%) | 0 (0.0%) |
| Coal or Coke | 0 (0.0%) | 0 (0.0%) |
| All other Fuels | 0 (0.0%) | 0 (0.0%) |
| No Fuel Used | 25 (1.0%) | 10 (3.5%) |
| Total | 2,596 (100.0%) | 283 (100.0%) |
Household Vehicle Usage in Fort Myers Beach
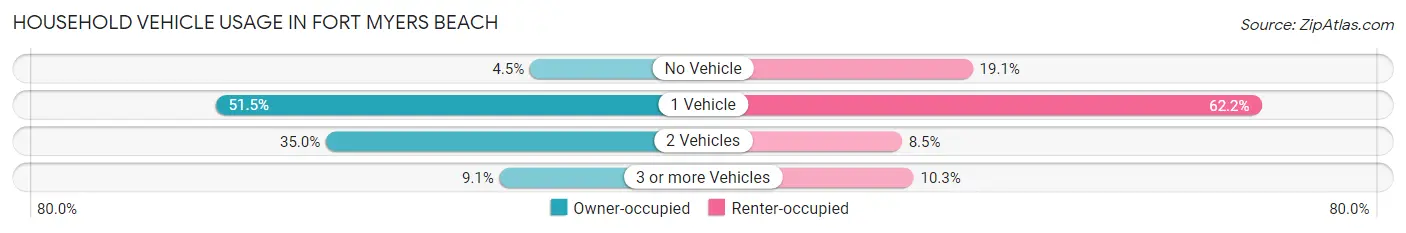
| Vehicles per Household | Owner-occupied | Renter-occupied |
| No Vehicle | 117 (4.5%) | 54 (19.1%) |
| 1 Vehicle | 1,336 (51.5%) | 176 (62.2%) |
| 2 Vehicles | 908 (35.0%) | 24 (8.5%) |
| 3 or more Vehicles | 235 (9.0%) | 29 (10.2%) |
| Total | 2,596 (100.0%) | 283 (100.0%) |
Real Estate & Mortgages in Fort Myers Beach
Real Estate and Mortgage Overview in Fort Myers Beach
| Characteristic | Without Mortgage | With Mortgage |
| Housing Units | 1,767 | 829 |
| Median Property Value | $547,200 | $520,800 |
| Median Household Income | $86,875 | $333 |
| Monthly Housing Costs | $1,173 | $283 |
| Real Estate Taxes | $4,835 | $0 |
Property Value by Mortgage Status in Fort Myers Beach
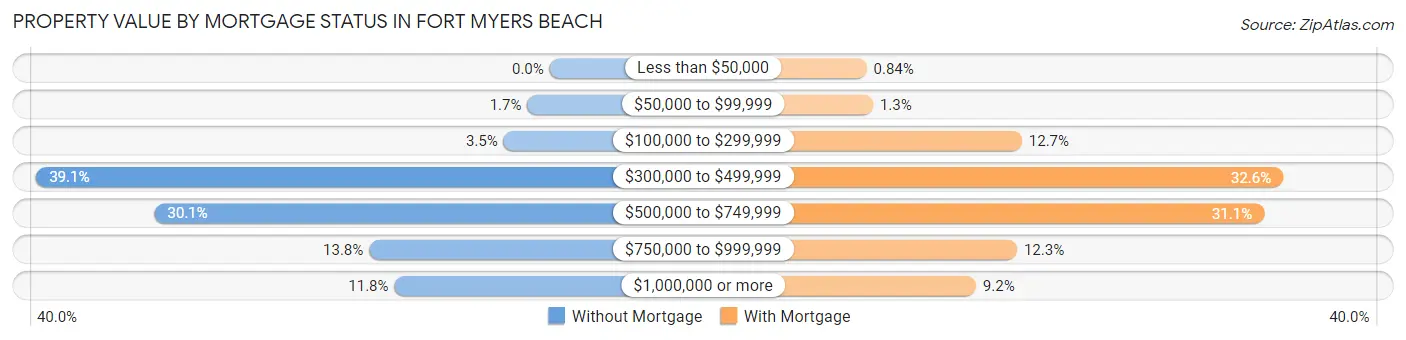
| Property Value | Without Mortgage | With Mortgage |
| Less than $50,000 | 0 (0.0%) | 7 (0.8%) |
| $50,000 to $99,999 | 30 (1.7%) | 11 (1.3%) |
| $100,000 to $299,999 | 62 (3.5%) | 105 (12.7%) |
| $300,000 to $499,999 | 691 (39.1%) | 270 (32.6%) |
| $500,000 to $749,999 | 532 (30.1%) | 258 (31.1%) |
| $750,000 to $999,999 | 243 (13.8%) | 102 (12.3%) |
| $1,000,000 or more | 209 (11.8%) | 76 (9.2%) |
| Total | 1,767 (100.0%) | 829 (100.0%) |
Household Income by Mortgage Status in Fort Myers Beach
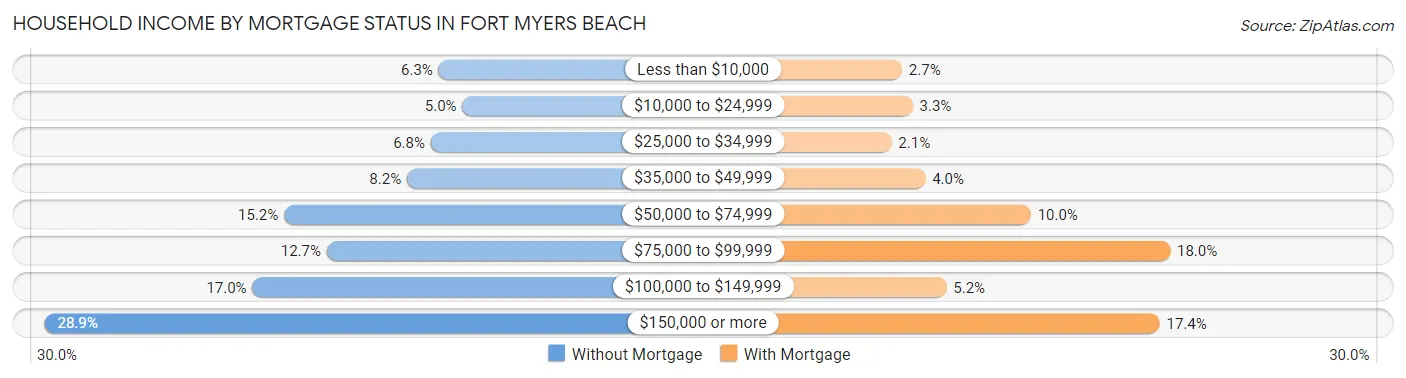
| Household Income | Without Mortgage | With Mortgage |
| Less than $10,000 | 112 (6.3%) | 22 (2.6%) |
| $10,000 to $24,999 | 88 (5.0%) | 27 (3.3%) |
| $25,000 to $34,999 | 120 (6.8%) | 17 (2.1%) |
| $35,000 to $49,999 | 144 (8.2%) | 33 (4.0%) |
| $50,000 to $74,999 | 268 (15.2%) | 83 (10.0%) |
| $75,000 to $99,999 | 225 (12.7%) | 149 (18.0%) |
| $100,000 to $149,999 | 300 (17.0%) | 43 (5.2%) |
| $150,000 or more | 510 (28.9%) | 144 (17.4%) |
| Total | 1,767 (100.0%) | 829 (100.0%) |
Property Value to Household Income Ratio in Fort Myers Beach
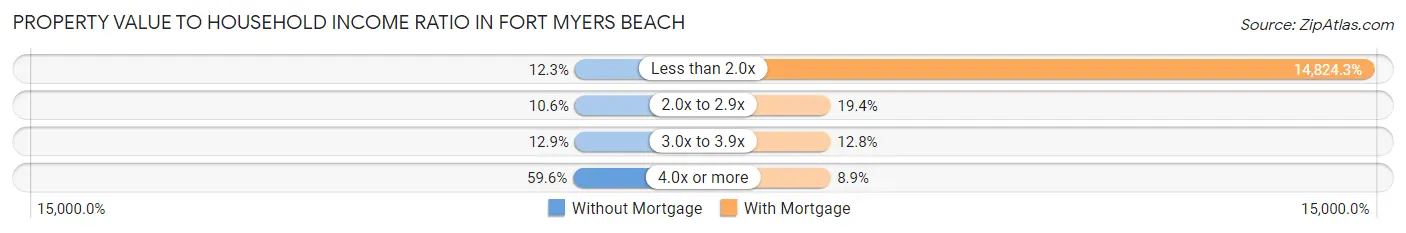
| Value-to-Income Ratio | Without Mortgage | With Mortgage |
| Less than 2.0x | 218 (12.3%) | 122,893 (14,824.3%) |
| 2.0x to 2.9x | 187 (10.6%) | 161 (19.4%) |
| 3.0x to 3.9x | 227 (12.9%) | 106 (12.8%) |
| 4.0x or more | 1,053 (59.6%) | 74 (8.9%) |
| Total | 1,767 (100.0%) | 829 (100.0%) |
Real Estate Taxes by Mortgage Status in Fort Myers Beach
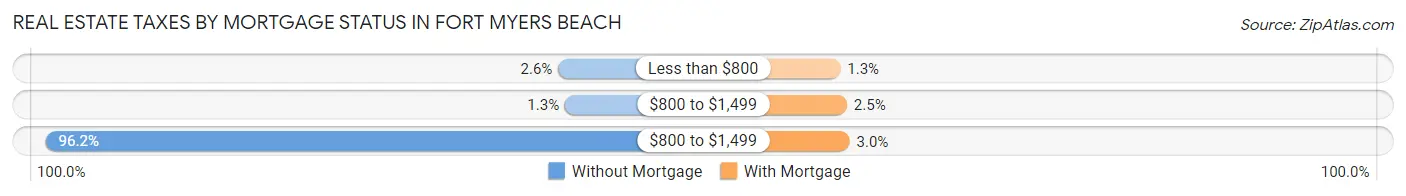
| Property Taxes | Without Mortgage | With Mortgage |
| Less than $800 | 45 (2.5%) | 11 (1.3%) |
| $800 to $1,499 | 23 (1.3%) | 21 (2.5%) |
| $800 to $1,499 | 1,699 (96.2%) | 25 (3.0%) |
| Total | 1,767 (100.0%) | 829 (100.0%) |
Health & Disability in Fort Myers Beach
Health Insurance Coverage by Age in Fort Myers Beach
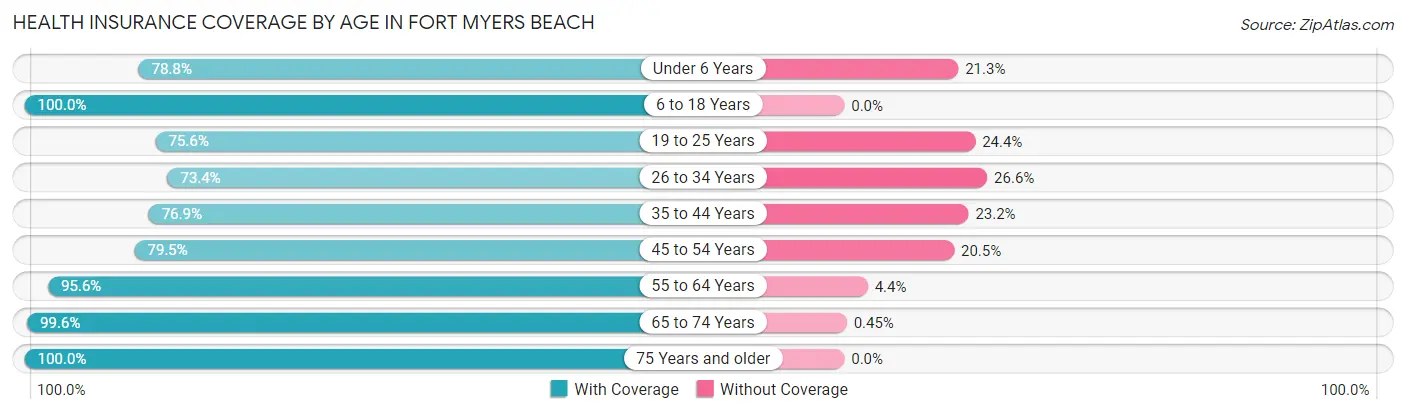
| Age Bracket | With Coverage | Without Coverage |
| Under 6 Years | 63 (78.7%) | 17 (21.2%) |
| 6 to 18 Years | 233 (100.0%) | 0 (0.0%) |
| 19 to 25 Years | 161 (75.6%) | 52 (24.4%) |
| 26 to 34 Years | 157 (73.4%) | 57 (26.6%) |
| 35 to 44 Years | 156 (76.8%) | 47 (23.2%) |
| 45 to 54 Years | 338 (79.5%) | 87 (20.5%) |
| 55 to 64 Years | 1,052 (95.6%) | 48 (4.4%) |
| 65 to 74 Years | 1,779 (99.6%) | 8 (0.4%) |
| 75 Years and older | 1,395 (100.0%) | 0 (0.0%) |
| Total | 5,334 (94.4%) | 316 (5.6%) |
Health Insurance Coverage by Citizenship Status in Fort Myers Beach
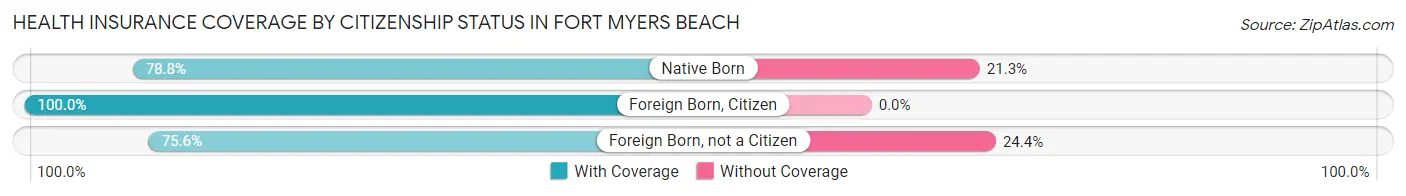
| Citizenship Status | With Coverage | Without Coverage |
| Native Born | 63 (78.7%) | 17 (21.2%) |
| Foreign Born, Citizen | 233 (100.0%) | 0 (0.0%) |
| Foreign Born, not a Citizen | 161 (75.6%) | 52 (24.4%) |
Health Insurance Coverage by Household Income in Fort Myers Beach
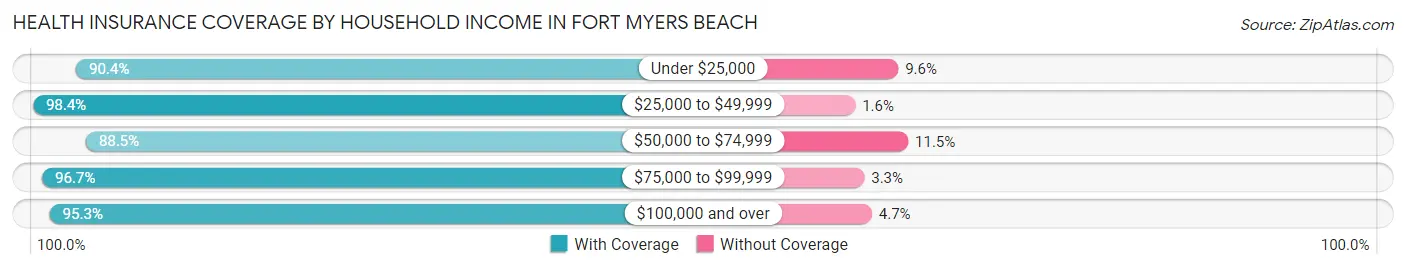
| Household Income | With Coverage | Without Coverage |
| Under $25,000 | 356 (90.4%) | 38 (9.6%) |
| $25,000 to $49,999 | 689 (98.4%) | 11 (1.6%) |
| $50,000 to $74,999 | 809 (88.5%) | 105 (11.5%) |
| $75,000 to $99,999 | 530 (96.7%) | 18 (3.3%) |
| $100,000 and over | 2,923 (95.3%) | 144 (4.7%) |
Public vs Private Health Insurance Coverage by Age in Fort Myers Beach
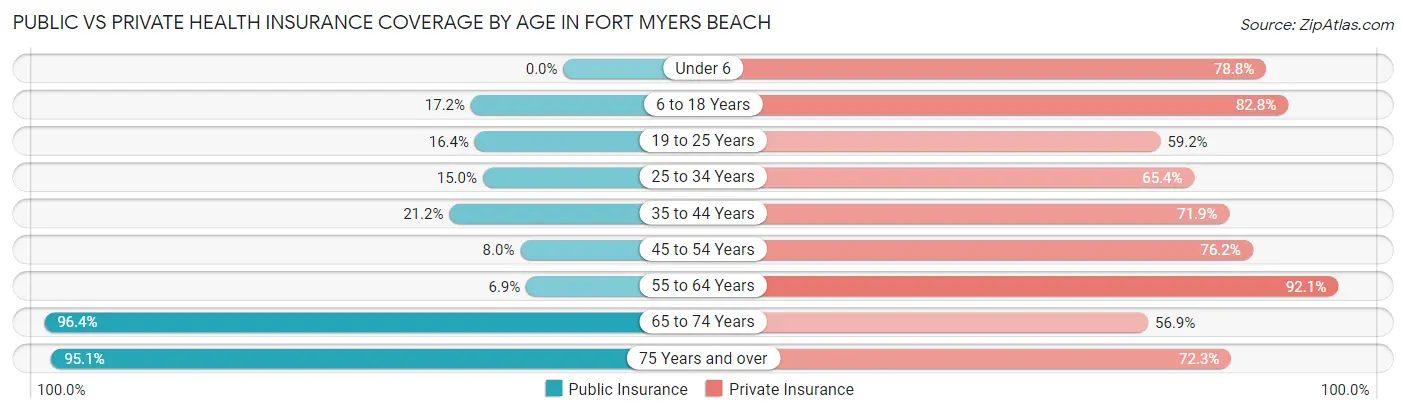
| Age Bracket | Public Insurance | Private Insurance |
| Under 6 | 0 (0.0%) | 63 (78.7%) |
| 6 to 18 Years | 40 (17.2%) | 193 (82.8%) |
| 19 to 25 Years | 35 (16.4%) | 126 (59.2%) |
| 25 to 34 Years | 32 (14.9%) | 140 (65.4%) |
| 35 to 44 Years | 43 (21.2%) | 146 (71.9%) |
| 45 to 54 Years | 34 (8.0%) | 324 (76.2%) |
| 55 to 64 Years | 76 (6.9%) | 1,013 (92.1%) |
| 65 to 74 Years | 1,722 (96.4%) | 1,016 (56.9%) |
| 75 Years and over | 1,326 (95.1%) | 1,008 (72.3%) |
| Total | 3,308 (58.6%) | 4,029 (71.3%) |
Disability Status by Sex by Age in Fort Myers Beach
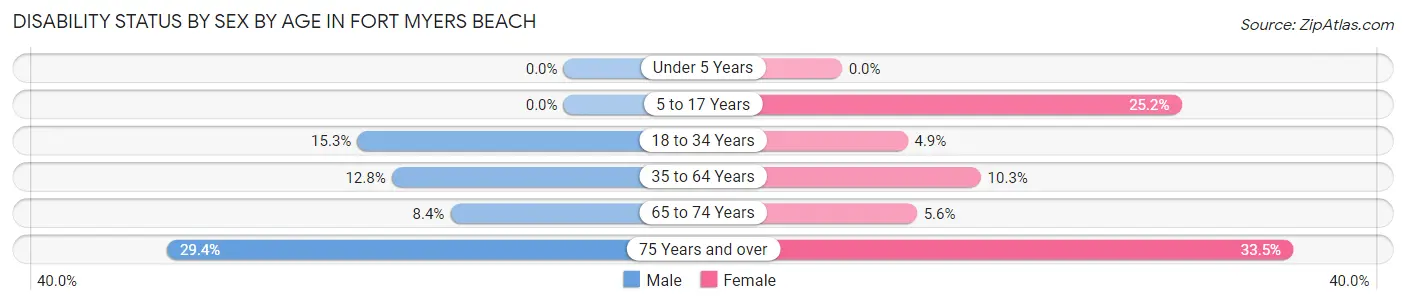
| Age Bracket | Male | Female |
| Under 5 Years | 0 (0.0%) | 0 (0.0%) |
| 5 to 17 Years | 0 (0.0%) | 32 (25.2%) |
| 18 to 34 Years | 32 (15.3%) | 12 (4.9%) |
| 35 to 64 Years | 98 (12.8%) | 99 (10.3%) |
| 65 to 74 Years | 73 (8.4%) | 51 (5.6%) |
| 75 Years and over | 226 (29.4%) | 210 (33.5%) |
Disability Class by Sex by Age in Fort Myers Beach
Disability Class: Hearing Difficulty
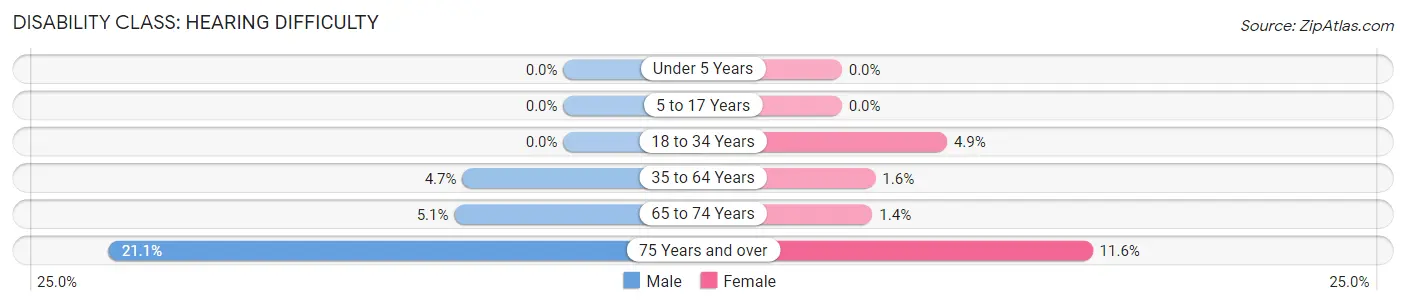
| Age Bracket | Male | Female |
| Under 5 Years | 0 (0.0%) | 0 (0.0%) |
| 5 to 17 Years | 0 (0.0%) | 0 (0.0%) |
| 18 to 34 Years | 0 (0.0%) | 12 (4.9%) |
| 35 to 64 Years | 36 (4.7%) | 15 (1.6%) |
| 65 to 74 Years | 44 (5.1%) | 13 (1.4%) |
| 75 Years and over | 162 (21.1%) | 73 (11.6%) |
Disability Class: Vision Difficulty
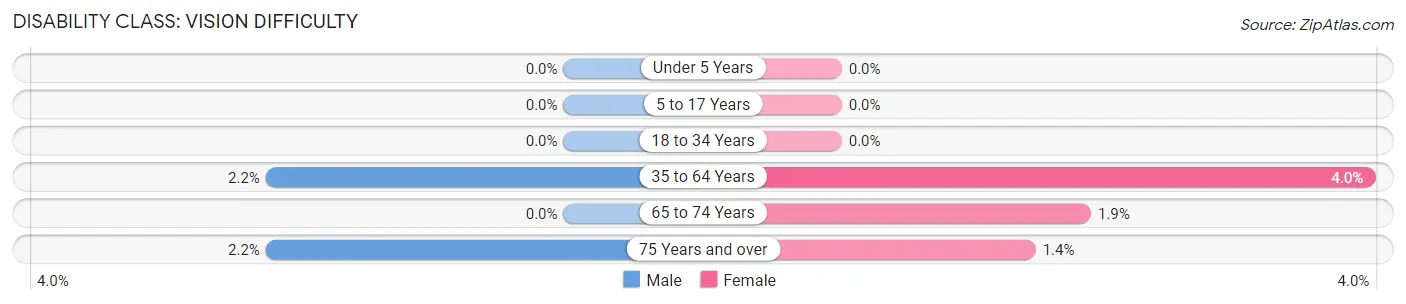
| Age Bracket | Male | Female |
| Under 5 Years | 0 (0.0%) | 0 (0.0%) |
| 5 to 17 Years | 0 (0.0%) | 0 (0.0%) |
| 18 to 34 Years | 0 (0.0%) | 0 (0.0%) |
| 35 to 64 Years | 17 (2.2%) | 38 (4.0%) |
| 65 to 74 Years | 0 (0.0%) | 17 (1.8%) |
| 75 Years and over | 17 (2.2%) | 9 (1.4%) |
Disability Class: Cognitive Difficulty
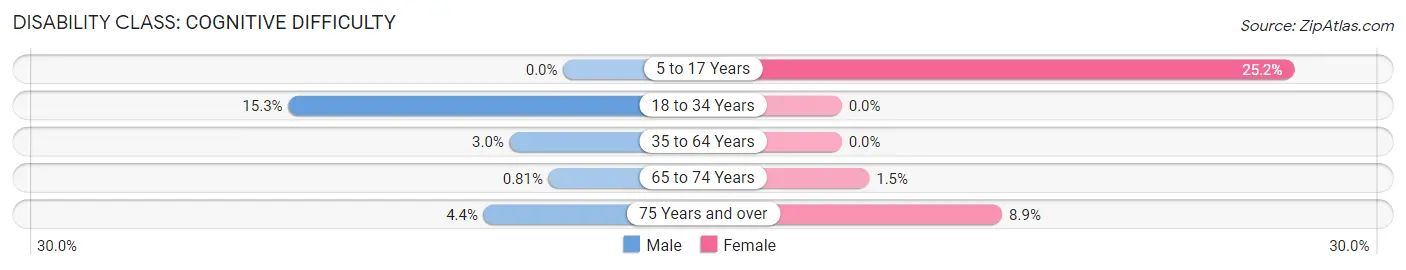
| Age Bracket | Male | Female |
| 5 to 17 Years | 0 (0.0%) | 32 (25.2%) |
| 18 to 34 Years | 32 (15.3%) | 0 (0.0%) |
| 35 to 64 Years | 23 (3.0%) | 0 (0.0%) |
| 65 to 74 Years | 7 (0.8%) | 14 (1.5%) |
| 75 Years and over | 34 (4.4%) | 56 (8.9%) |
Disability Class: Ambulatory Difficulty
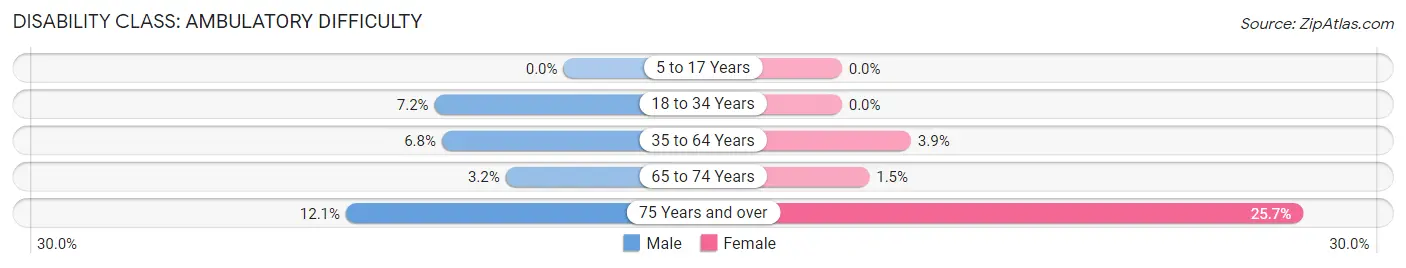
| Age Bracket | Male | Female |
| 5 to 17 Years | 0 (0.0%) | 0 (0.0%) |
| 18 to 34 Years | 15 (7.2%) | 0 (0.0%) |
| 35 to 64 Years | 52 (6.8%) | 37 (3.8%) |
| 65 to 74 Years | 28 (3.2%) | 14 (1.5%) |
| 75 Years and over | 93 (12.1%) | 161 (25.7%) |
Disability Class: Self-Care Difficulty
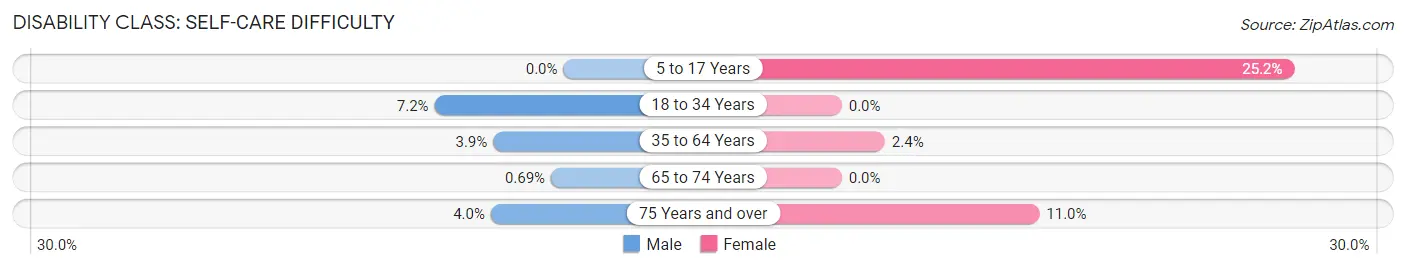
| Age Bracket | Male | Female |
| 5 to 17 Years | 0 (0.0%) | 32 (25.2%) |
| 18 to 34 Years | 15 (7.2%) | 0 (0.0%) |
| 35 to 64 Years | 30 (3.9%) | 23 (2.4%) |
| 65 to 74 Years | 6 (0.7%) | 0 (0.0%) |
| 75 Years and over | 31 (4.0%) | 69 (11.0%) |
Technology Access in Fort Myers Beach
Computing Device Access in Fort Myers Beach
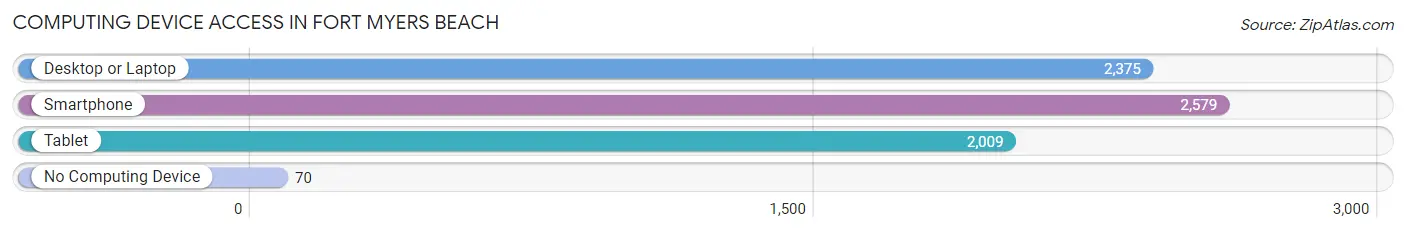
| Device Type | # Households | % Households |
| Desktop or Laptop | 2,375 | 82.5% |
| Smartphone | 2,579 | 89.6% |
| Tablet | 2,009 | 69.8% |
| No Computing Device | 70 | 2.4% |
| Total | 2,879 | 100.0% |
Internet Access in Fort Myers Beach
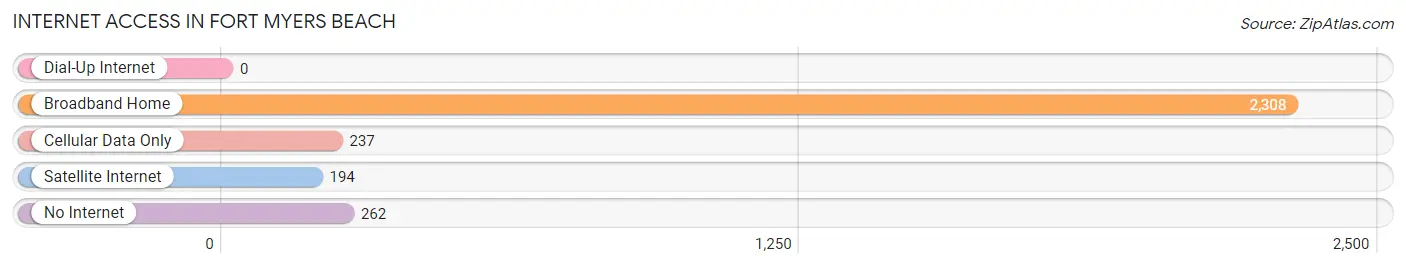
| Internet Type | # Households | % Households |
| Dial-Up Internet | 0 | 0.0% |
| Broadband Home | 2,308 | 80.2% |
| Cellular Data Only | 237 | 8.2% |
| Satellite Internet | 194 | 6.7% |
| No Internet | 262 | 9.1% |
| Total | 2,879 | 100.0% |
Fort Myers Beach Summary
History
Myers Beach, Florida is a small town located on the Gulf Coast of Florida. It is part of Lee County and is situated on Estero Island, which is connected to the mainland by a bridge. The town was originally known as “Estero Island” and was first settled by the Calusa Indians. The Calusa were a Native American tribe that lived in the area for centuries before the arrival of Europeans.
In the late 1800s, the area was settled by a group of fishermen from the Bahamas. They named the area “Myers Beach” after the first settler, John Myers. The town was incorporated in 1957 and has since become a popular tourist destination.
Geography
Myers Beach is located on the Gulf Coast of Florida, approximately 25 miles south of Fort Myers. It is situated on Estero Island, which is connected to the mainland by a bridge. The town is bordered by the Gulf of Mexico to the west and the Estero Bay to the east. The town is approximately 4.5 miles long and 0.5 miles wide.
The town has a tropical climate with hot, humid summers and mild winters. The average temperature in the summer is around 90 degrees Fahrenheit and the average temperature in the winter is around 70 degrees Fahrenheit.
Economy
Myers Beach is a popular tourist destination and the town’s economy is largely dependent on tourism. The town is home to several resorts, hotels, restaurants, and shops. The town also has a thriving fishing industry, with many local fishermen selling their catch to local restaurants and markets.
The town is also home to several marinas, which provide boat rentals and other services to tourists and locals alike. The town also has a vibrant arts and culture scene, with several galleries, museums, and theaters.
Demographics
As of the 2010 census, the population of Myers Beach was 6,277. The population is predominantly white (90.2%) and the median age is 54. The median household income is $50,945 and the median home value is $323,400.
The town is home to a diverse population, with people from all over the world. The town is also home to a large number of retirees, with many people choosing to retire in the town due to its warm climate and laid-back atmosphere.
Conclusion
Myers Beach, Florida is a small town located on the Gulf Coast of Florida. It is part of Lee County and is situated on Estero Island, which is connected to the mainland by a bridge. The town was originally known as “Estero Island” and was first settled by the Calusa Indians. The town is a popular tourist destination and the economy is largely dependent on tourism. The town is home to a diverse population, with people from all over the world. The town is also home to a large number of retirees, with many people choosing to retire in the town due to its warm climate and laid-back atmosphere.
Common Questions
What is Per Capita Income in Fort Myers Beach?
Per Capita income in Fort Myers Beach is $75,988.
What is the Median Family Income in Fort Myers Beach?
Median Family Income in Fort Myers Beach is $121,563.
What is the Median Household income in Fort Myers Beach?
Median Household Income in Fort Myers Beach is $87,204.
What is Income or Wage Gap in Fort Myers Beach?
Income or Wage Gap in Fort Myers Beach is 42.9%.
Women in Fort Myers Beach earn 57.1 cents for every dollar earned by a man.
What is Family Income Deficit in Fort Myers Beach?
Family Income Deficit in Fort Myers Beach is $10,547.
Families that are below poverty line in Fort Myers Beach earn $10,547 less on average than the poverty threshold level.
What is Inequality or Gini Index in Fort Myers Beach?
Inequality or Gini Index in Fort Myers Beach is 0.53.
What is the Total Population of Fort Myers Beach?
Total Population of Fort Myers Beach is 5,650.
What is the Total Male Population of Fort Myers Beach?
Total Male Population of Fort Myers Beach is 2,755.
What is the Total Female Population of Fort Myers Beach?
Total Female Population of Fort Myers Beach is 2,895.
What is the Ratio of Males per 100 Females in Fort Myers Beach?
There are 95.16 Males per 100 Females in Fort Myers Beach.
What is the Ratio of Females per 100 Males in Fort Myers Beach?
There are 105.08 Females per 100 Males in Fort Myers Beach.
What is the Median Population Age in Fort Myers Beach?
Median Population Age in Fort Myers Beach is 66.6 Years.
What is the Average Family Size in Fort Myers Beach
Average Family Size in Fort Myers Beach is 2.4 People.
What is the Average Household Size in Fort Myers Beach
Average Household Size in Fort Myers Beach is 1.9 People.
How Large is the Labor Force in Fort Myers Beach?
There are 1,839 People in the Labor Forcein in Fort Myers Beach.
What is the Percentage of People in the Labor Force in Fort Myers Beach?
34.0% of People are in the Labor Force in Fort Myers Beach.
What is the Unemployment Rate in Fort Myers Beach?
Unemployment Rate in Fort Myers Beach is 3.6%.