Homosassa Springs, FL Map & Demographics
Homosassa Springs Map
Homosassa Springs Overview
$24,897
PER CAPITA INCOME
$51,915
AVG FAMILY INCOME
$46,047
AVG HOUSEHOLD INCOME
0.5%
WAGE / INCOME GAP [ % ]
99.5¢/ $1
WAGE / INCOME GAP [ $ ]
$7,886
FAMILY INCOME DEFICIT
0.43
INEQUALITY / GINI INDEX
15,365
TOTAL POPULATION
7,846
MALE POPULATION
7,519
FEMALE POPULATION
104.35
MALES / 100 FEMALES
95.83
FEMALES / 100 MALES
51.0
MEDIAN AGE
3.0
AVG FAMILY SIZE
2.6
AVG HOUSEHOLD SIZE
5,360
LABOR FORCE [ PEOPLE ]
40.7%
PERCENT IN LABOR FORCE
8.8%
UNEMPLOYMENT RATE
Homosassa Springs Area Codes
Income in Homosassa Springs
Income Overview in Homosassa Springs
Per Capita Income in Homosassa Springs is $24,897, while median incomes of families and households are $51,915 and $46,047 respectively.
| Characteristic | Number | Measure |
| Per Capita Income | 15,365 | $24,897 |
| Median Family Income | 4,230 | $51,915 |
| Mean Family Income | 4,230 | $68,196 |
| Median Household Income | 5,981 | $46,047 |
| Mean Household Income | 5,981 | $61,155 |
| Income Deficit | 4,230 | $7,886 |
| Wage / Income Gap (%) | 15,365 | 0.51% |
| Wage / Income Gap ($) | 15,365 | 99.49¢ per $1 |
| Gini / Inequality Index | 15,365 | 0.43 |
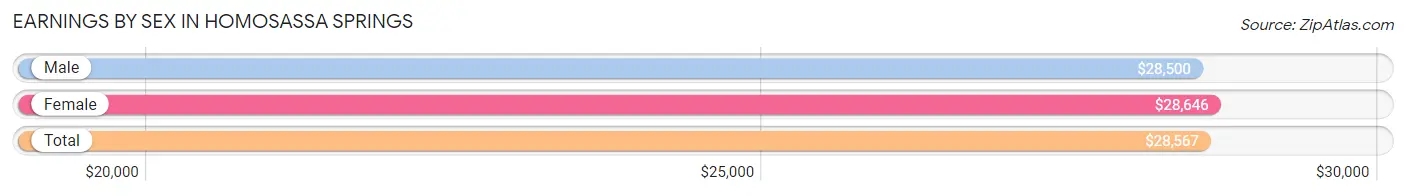
Earnings by Sex in Homosassa Springs
Average Earnings in Homosassa Springs are $28,567, $28,500 for men and $28,646 for women, a difference of 0.5%.
| Sex | Number | Average Earnings |
| Male | 3,292 (55.4%) | $28,500 |
| Female | 2,651 (44.6%) | $28,646 |
| Total | 5,943 (100.0%) | $28,567 |
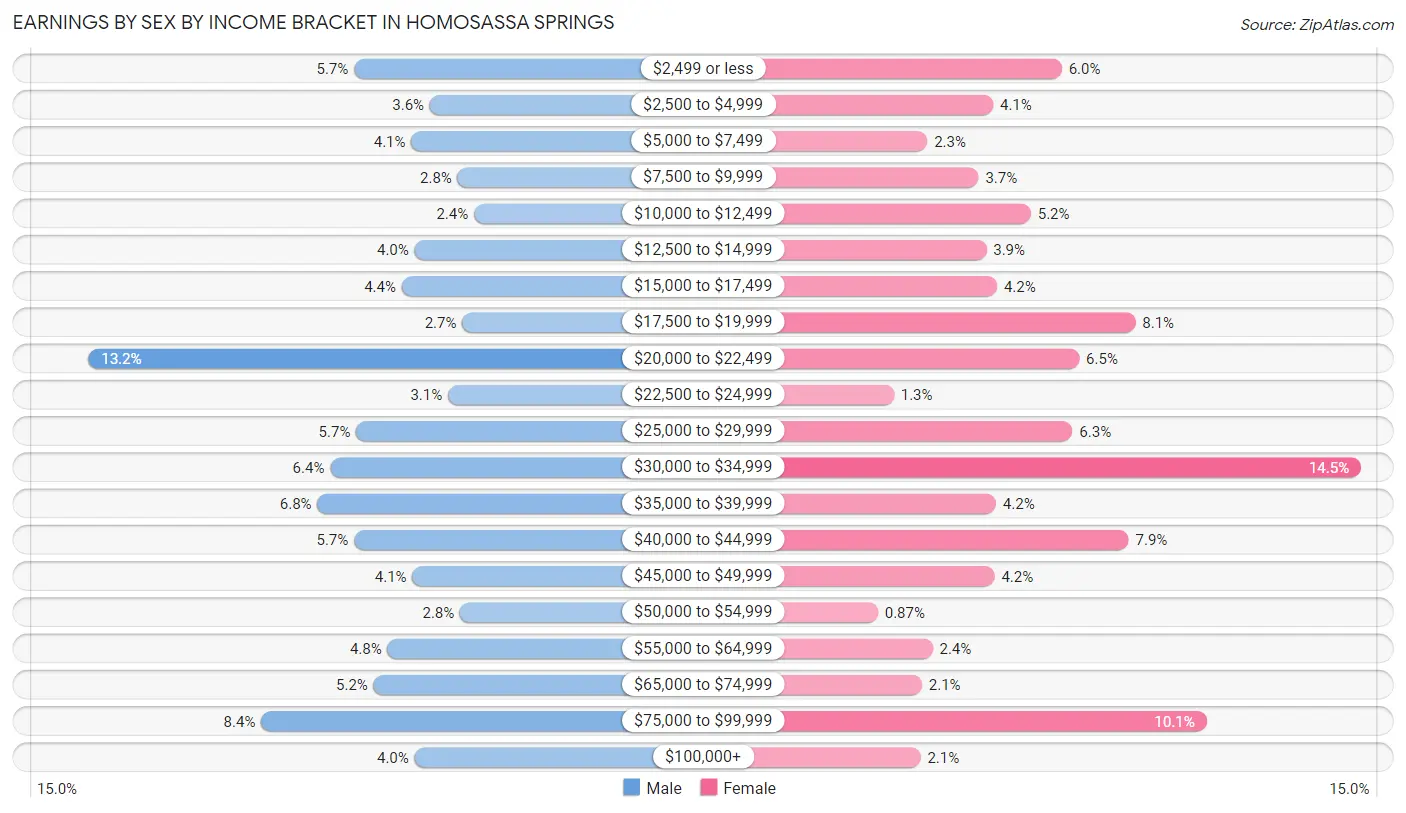
Earnings by Sex by Income Bracket in Homosassa Springs
The most common earnings brackets in Homosassa Springs are $20,000 to $22,499 for men (435 | 13.2%) and $30,000 to $34,999 for women (383 | 14.4%).
| Income | Male | Female |
| $2,499 or less | 189 (5.7%) | 160 (6.0%) |
| $2,500 to $4,999 | 119 (3.6%) | 109 (4.1%) |
| $5,000 to $7,499 | 136 (4.1%) | 60 (2.3%) |
| $7,500 to $9,999 | 93 (2.8%) | 98 (3.7%) |
| $10,000 to $12,499 | 78 (2.4%) | 137 (5.2%) |
| $12,500 to $14,999 | 133 (4.0%) | 104 (3.9%) |
| $15,000 to $17,499 | 145 (4.4%) | 112 (4.2%) |
| $17,500 to $19,999 | 89 (2.7%) | 215 (8.1%) |
| $20,000 to $22,499 | 435 (13.2%) | 173 (6.5%) |
| $22,500 to $24,999 | 102 (3.1%) | 35 (1.3%) |
| $25,000 to $29,999 | 187 (5.7%) | 168 (6.3%) |
| $30,000 to $34,999 | 211 (6.4%) | 383 (14.4%) |
| $35,000 to $39,999 | 223 (6.8%) | 111 (4.2%) |
| $40,000 to $44,999 | 189 (5.7%) | 210 (7.9%) |
| $45,000 to $49,999 | 135 (4.1%) | 110 (4.2%) |
| $50,000 to $54,999 | 91 (2.8%) | 23 (0.9%) |
| $55,000 to $64,999 | 158 (4.8%) | 64 (2.4%) |
| $65,000 to $74,999 | 171 (5.2%) | 56 (2.1%) |
| $75,000 to $99,999 | 275 (8.4%) | 268 (10.1%) |
| $100,000+ | 133 (4.0%) | 55 (2.1%) |
| Total | 3,292 (100.0%) | 2,651 (100.0%) |
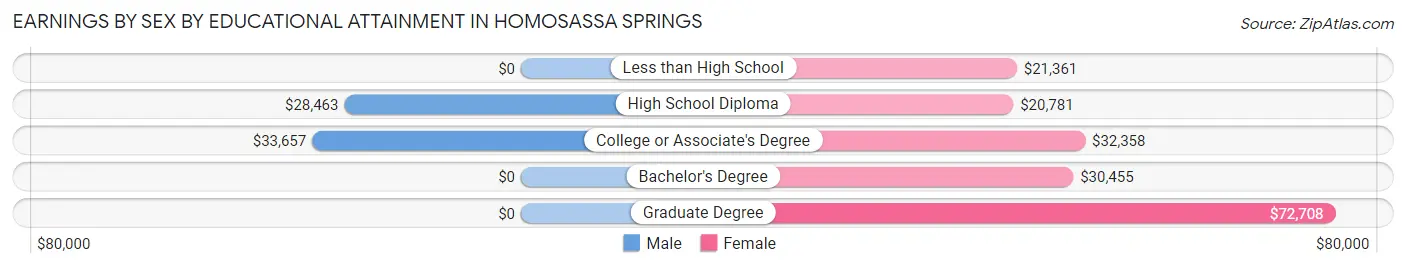
Earnings by Sex by Educational Attainment in Homosassa Springs
Average earnings in Homosassa Springs are $30,829 for men and $30,477 for women, a difference of 1.1%. Men with an educational attainment of college or associate's degree enjoy the highest average annual earnings of $33,657, while those with high school diploma education earn the least with $28,463. Women with an educational attainment of graduate degree earn the most with the average annual earnings of $72,708, while those with high school diploma education have the smallest earnings of $20,781.
| Educational Attainment | Male Income | Female Income |
| Less than High School | - | - |
| High School Diploma | $28,463 | $20,781 |
| College or Associate's Degree | $33,657 | $32,358 |
| Bachelor's Degree | - | - |
| Graduate Degree | - | - |
| Total | $30,829 | $30,477 |
Family Income in Homosassa Springs
Family Income Brackets in Homosassa Springs
According to the Homosassa Springs family income data, there are 1,159 families falling into the $50,000 to $74,999 income range, which is the most common income bracket and makes up 27.4% of all families. Conversely, the $200,000+ income bracket is the least frequent group with only 38 families (0.9%) belonging to this category.
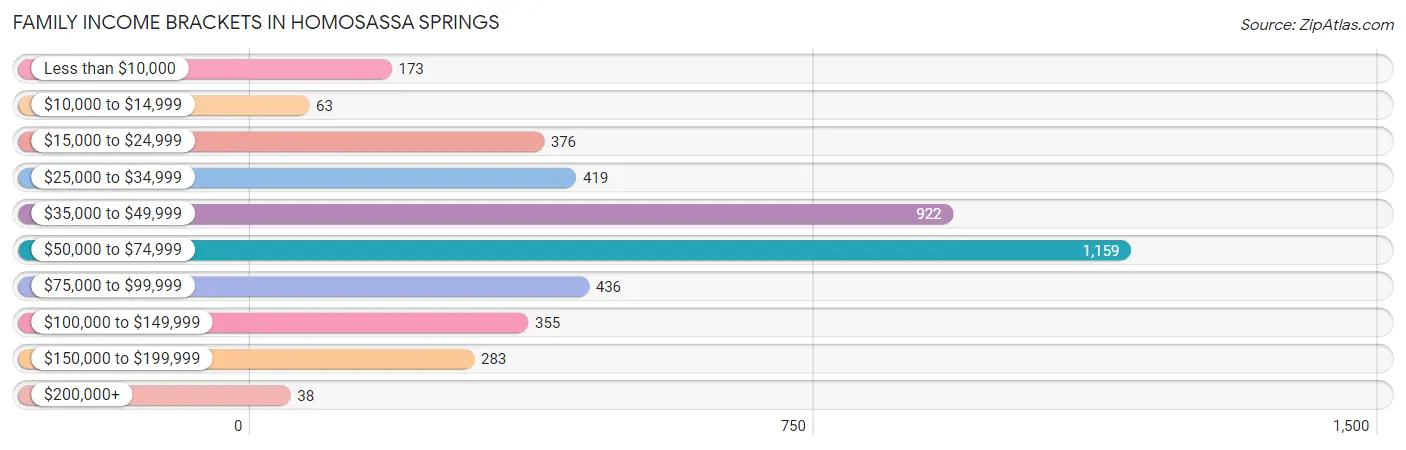
| Income Bracket | # Families | % Families |
| Less than $10,000 | 173 | 4.1% |
| $10,000 to $14,999 | 63 | 1.5% |
| $15,000 to $24,999 | 376 | 8.9% |
| $25,000 to $34,999 | 419 | 9.9% |
| $35,000 to $49,999 | 922 | 21.8% |
| $50,000 to $74,999 | 1,159 | 27.4% |
| $75,000 to $99,999 | 436 | 10.3% |
| $100,000 to $149,999 | 355 | 8.4% |
| $150,000 to $199,999 | 283 | 6.7% |
| $200,000+ | 38 | 0.9% |
Family Income by Famaliy Size in Homosassa Springs
7+ person families (80 | 1.9%) account for the highest median family income in Homosassa Springs with $98,545 per family, while 3-person families (944 | 22.3%) have the highest median income of $25,708 per family member.
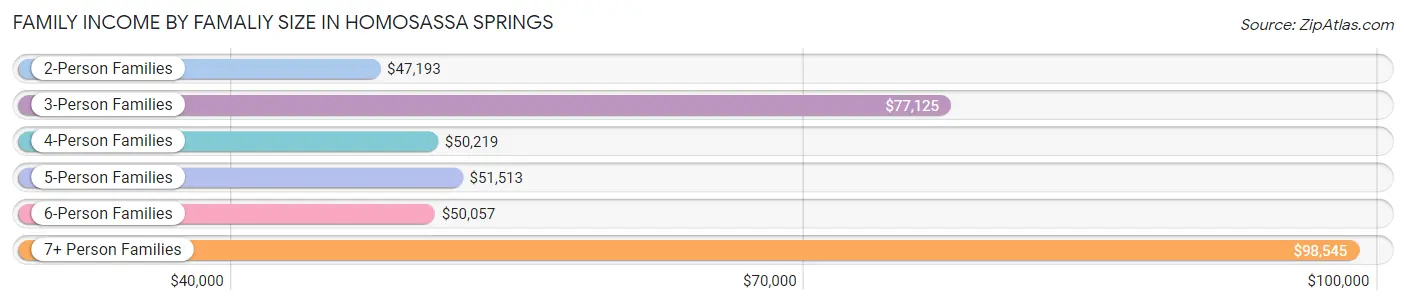
| Income Bracket | # Families | Median Income |
| 2-Person Families | 2,542 (60.1%) | $47,193 |
| 3-Person Families | 944 (22.3%) | $77,125 |
| 4-Person Families | 446 (10.5%) | $50,219 |
| 5-Person Families | 121 (2.9%) | $51,513 |
| 6-Person Families | 97 (2.3%) | $50,057 |
| 7+ Person Families | 80 (1.9%) | $98,545 |
| Total | 4,230 (100.0%) | $51,915 |
Family Income by Number of Earners in Homosassa Springs
The median family income in Homosassa Springs is $51,915, with families comprising 3+ earners (200) having the highest median family income of $93,750, while families with no earners (1,422) have the lowest median family income of $36,415, accounting for 4.7% and 33.6% of families, respectively.
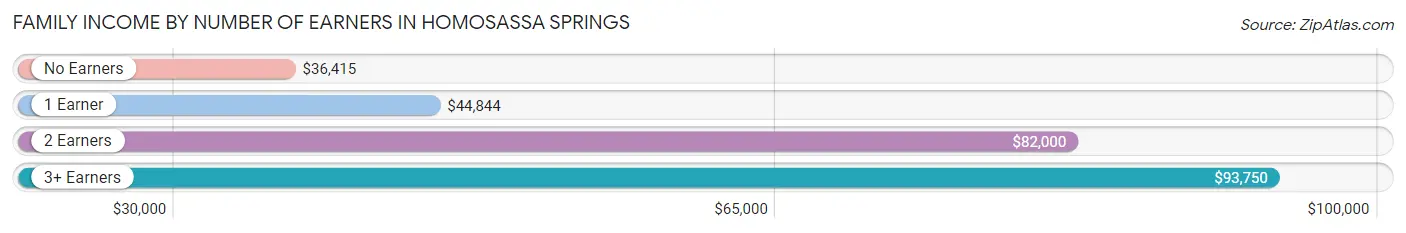
| Number of Earners | # Families | Median Income |
| No Earners | 1,422 (33.6%) | $36,415 |
| 1 Earner | 1,362 (32.2%) | $44,844 |
| 2 Earners | 1,246 (29.5%) | $82,000 |
| 3+ Earners | 200 (4.7%) | $93,750 |
| Total | 4,230 (100.0%) | $51,915 |
Household Income in Homosassa Springs
Household Income Brackets in Homosassa Springs
With 1,394 households falling in the category, the $50,000 to $74,999 income range is the most frequent in Homosassa Springs, accounting for 23.3% of all households. In contrast, only 60 households (1.0%) fall into the $200,000+ income bracket, making it the least populous group.
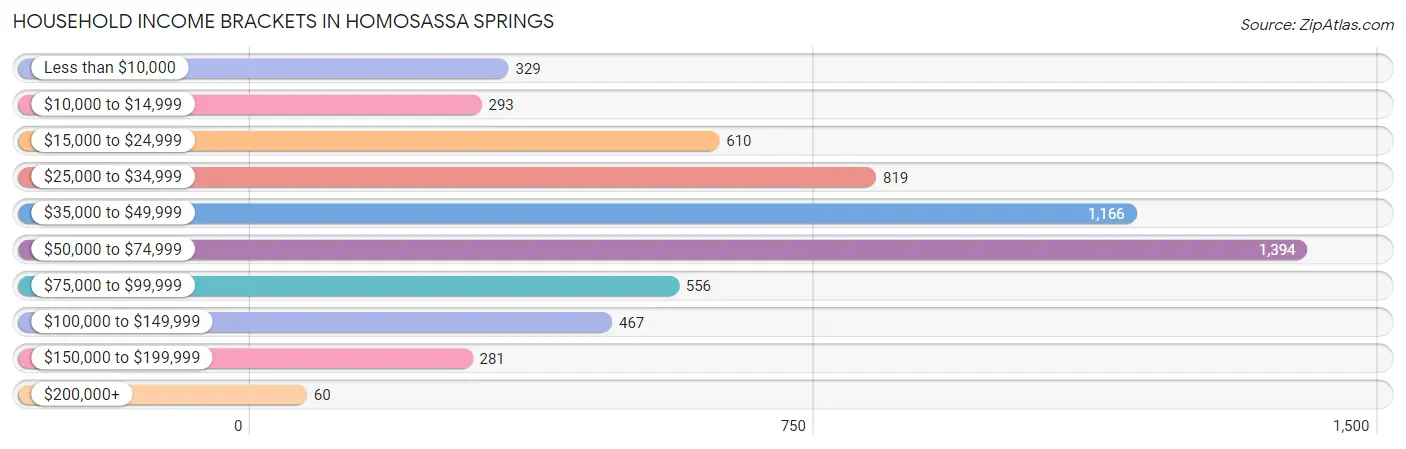
| Income Bracket | # Households | % Households |
| Less than $10,000 | 329 | 5.5% |
| $10,000 to $14,999 | 293 | 4.9% |
| $15,000 to $24,999 | 610 | 10.2% |
| $25,000 to $34,999 | 819 | 13.7% |
| $35,000 to $49,999 | 1,166 | 19.5% |
| $50,000 to $74,999 | 1,394 | 23.3% |
| $75,000 to $99,999 | 556 | 9.3% |
| $100,000 to $149,999 | 467 | 7.8% |
| $150,000 to $199,999 | 281 | 4.7% |
| $200,000+ | 60 | 1.0% |
Household Income by Householder Age in Homosassa Springs
The median household income in Homosassa Springs is $46,047, with the highest median household income of $72,682 found in the 25 to 44 years age bracket for the primary householder. A total of 1,018 households (17.0%) fall into this category. Meanwhile, the 15 to 24 years age bracket for the primary householder has the lowest median household income of $0, with 99 households (1.7%) in this group.
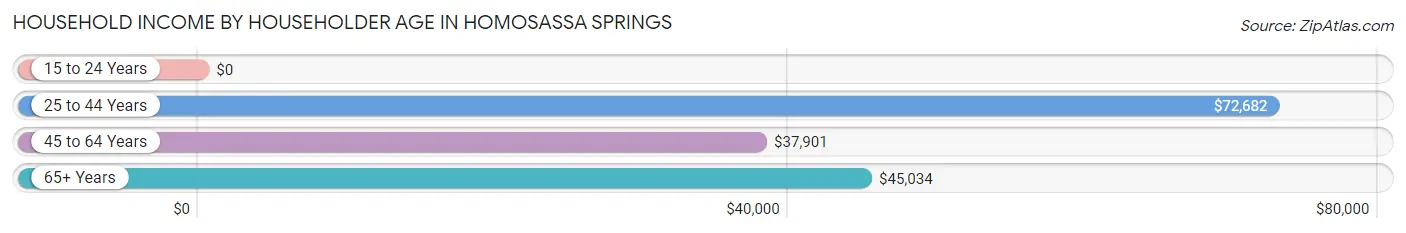
| Income Bracket | # Households | Median Income |
| 15 to 24 Years | 99 (1.7%) | $0 |
| 25 to 44 Years | 1,018 (17.0%) | $72,682 |
| 45 to 64 Years | 2,249 (37.6%) | $37,901 |
| 65+ Years | 2,615 (43.7%) | $45,034 |
| Total | 5,981 (100.0%) | $46,047 |
Poverty in Homosassa Springs
Income Below Poverty by Sex and Age in Homosassa Springs
With 20.1% poverty level for males and 18.8% for females among the residents of Homosassa Springs, 6 to 11 year old males and 5 year old females are the most vulnerable to poverty, with 253 males (49.5%) and 19 females (100.0%) in their respective age groups living below the poverty level.
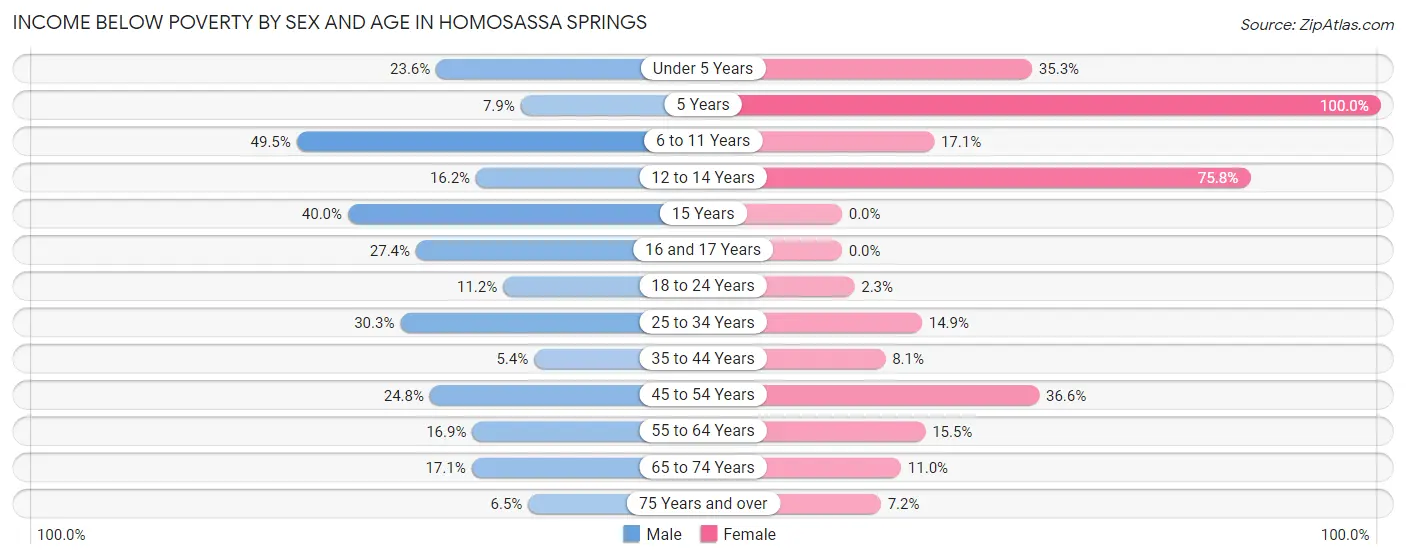
| Age Bracket | Male | Female |
| Under 5 Years | 120 (23.6%) | 102 (35.3%) |
| 5 Years | 5 (7.9%) | 19 (100.0%) |
| 6 to 11 Years | 253 (49.5%) | 39 (17.1%) |
| 12 to 14 Years | 36 (16.2%) | 197 (75.8%) |
| 15 Years | 12 (40.0%) | 0 (0.0%) |
| 16 and 17 Years | 69 (27.4%) | 0 (0.0%) |
| 18 to 24 Years | 50 (11.2%) | 9 (2.3%) |
| 25 to 34 Years | 225 (30.3%) | 147 (14.8%) |
| 35 to 44 Years | 30 (5.4%) | 40 (8.1%) |
| 45 to 54 Years | 318 (24.8%) | 454 (36.6%) |
| 55 to 64 Years | 210 (16.9%) | 187 (15.5%) |
| 65 to 74 Years | 186 (17.1%) | 165 (11.0%) |
| 75 Years and over | 59 (6.5%) | 53 (7.2%) |
| Total | 1,573 (20.1%) | 1,412 (18.8%) |
Income Above Poverty by Sex and Age in Homosassa Springs
According to the poverty statistics in Homosassa Springs, males aged 35 to 44 years and females aged 15 years are the age groups that are most secure financially, with 94.6% of males and 100.0% of females in these age groups living above the poverty line.
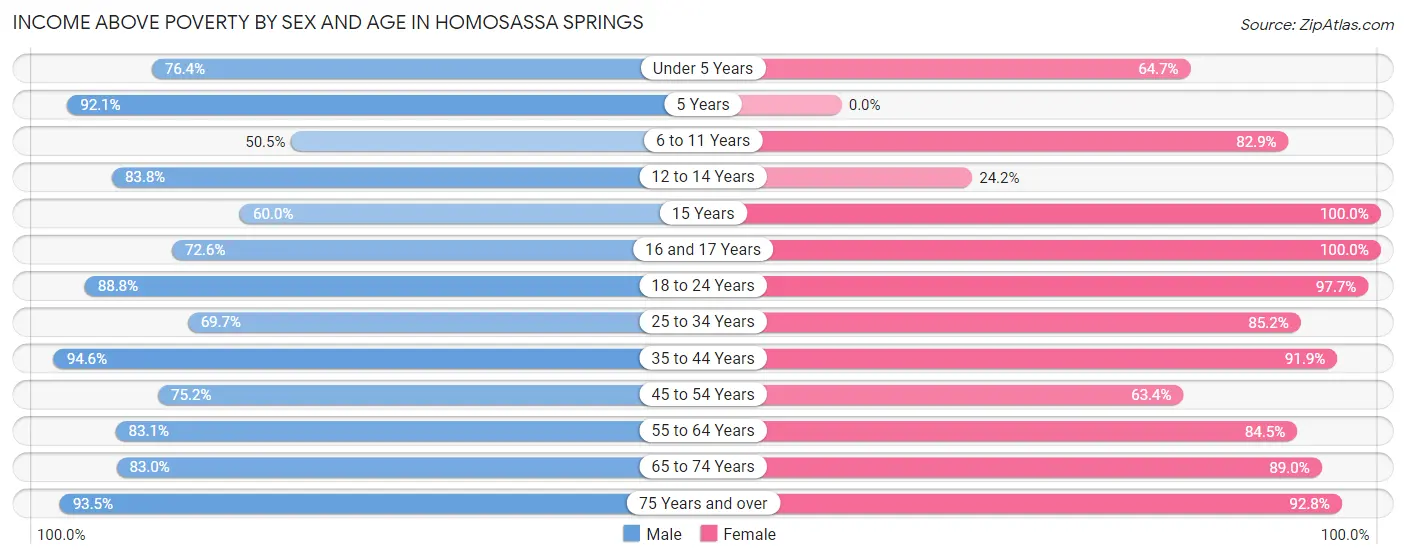
| Age Bracket | Male | Female |
| Under 5 Years | 388 (76.4%) | 187 (64.7%) |
| 5 Years | 58 (92.1%) | 0 (0.0%) |
| 6 to 11 Years | 258 (50.5%) | 189 (82.9%) |
| 12 to 14 Years | 186 (83.8%) | 63 (24.2%) |
| 15 Years | 18 (60.0%) | 47 (100.0%) |
| 16 and 17 Years | 183 (72.6%) | 98 (100.0%) |
| 18 to 24 Years | 397 (88.8%) | 379 (97.7%) |
| 25 to 34 Years | 518 (69.7%) | 843 (85.2%) |
| 35 to 44 Years | 521 (94.6%) | 456 (91.9%) |
| 45 to 54 Years | 965 (75.2%) | 786 (63.4%) |
| 55 to 64 Years | 1,032 (83.1%) | 1,021 (84.5%) |
| 65 to 74 Years | 905 (83.0%) | 1,339 (89.0%) |
| 75 Years and over | 844 (93.5%) | 680 (92.8%) |
| Total | 6,273 (79.9%) | 6,088 (81.2%) |
Income Below Poverty Among Married-Couple Families in Homosassa Springs
The poverty statistics for married-couple families in Homosassa Springs show that 7.6% or 218 of the total 2,882 families live below the poverty line. Families with 1 or 2 children have the highest poverty rate of 31.4%, comprising of 167 families. On the other hand, families with 3 or 4 children have the lowest poverty rate of 0.0%, which includes 0 families.
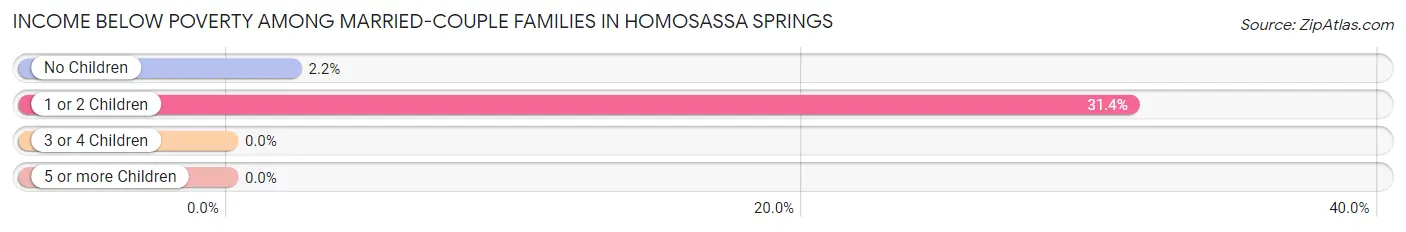
| Children | Above Poverty | Below Poverty |
| No Children | 2,252 (97.8%) | 51 (2.2%) |
| 1 or 2 Children | 365 (68.6%) | 167 (31.4%) |
| 3 or 4 Children | 39 (100.0%) | 0 (0.0%) |
| 5 or more Children | 8 (100.0%) | 0 (0.0%) |
| Total | 2,664 (92.4%) | 218 (7.6%) |
Income Below Poverty Among Single-Parent Households in Homosassa Springs
According to the poverty data in Homosassa Springs, 44.9% or 202 single-father households and 17.6% or 158 single-mother households are living below the poverty line. Among single-father households, those with no children have the highest poverty rate, with 120 households (50.2%) experiencing poverty. Likewise, among single-mother households, those with 3 or 4 children have the highest poverty rate, with 66 households (67.3%) falling below the poverty line.
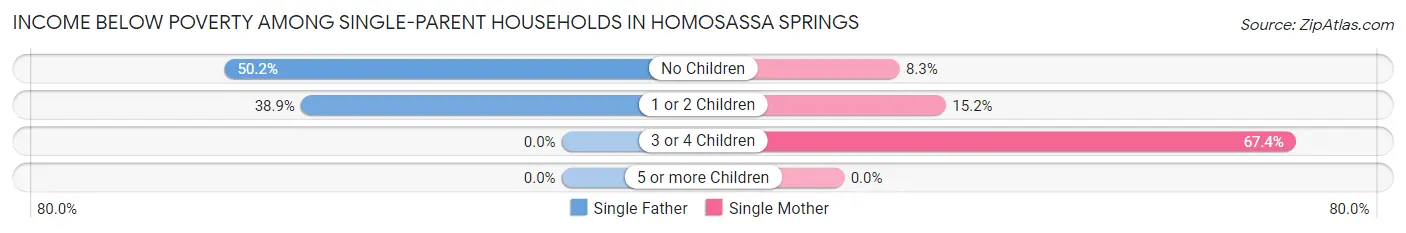
| Children | Single Father | Single Mother |
| No Children | 120 (50.2%) | 35 (8.3%) |
| 1 or 2 Children | 82 (38.9%) | 57 (15.2%) |
| 3 or 4 Children | 0 (0.0%) | 66 (67.3%) |
| 5 or more Children | 0 (0.0%) | 0 (0.0%) |
| Total | 202 (44.9%) | 158 (17.6%) |
Income Below Poverty Among Married-Couple vs Single-Parent Households in Homosassa Springs
The poverty data for Homosassa Springs shows that 218 of the married-couple family households (7.6%) and 360 of the single-parent households (26.7%) are living below the poverty level. Within the married-couple family households, those with 1 or 2 children have the highest poverty rate, with 167 households (31.4%) falling below the poverty line. Among the single-parent households, those with 3 or 4 children have the highest poverty rate, with 66 household (67.3%) living below poverty.
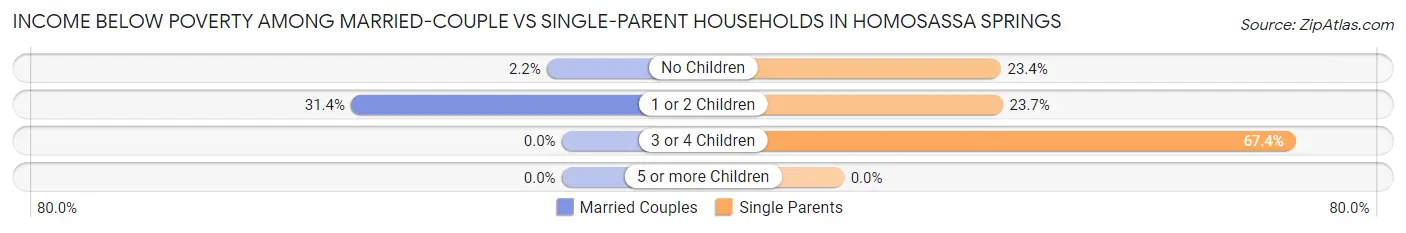
| Children | Married-Couple Families | Single-Parent Households |
| No Children | 51 (2.2%) | 155 (23.4%) |
| 1 or 2 Children | 167 (31.4%) | 139 (23.7%) |
| 3 or 4 Children | 0 (0.0%) | 66 (67.3%) |
| 5 or more Children | 0 (0.0%) | 0 (0.0%) |
| Total | 218 (7.6%) | 360 (26.7%) |
Race in Homosassa Springs
The most populous races in Homosassa Springs are White / Caucasian (14,472 | 94.2%), Hispanic or Latino (713 | 4.6%), and Two or more Races (565 | 3.7%).
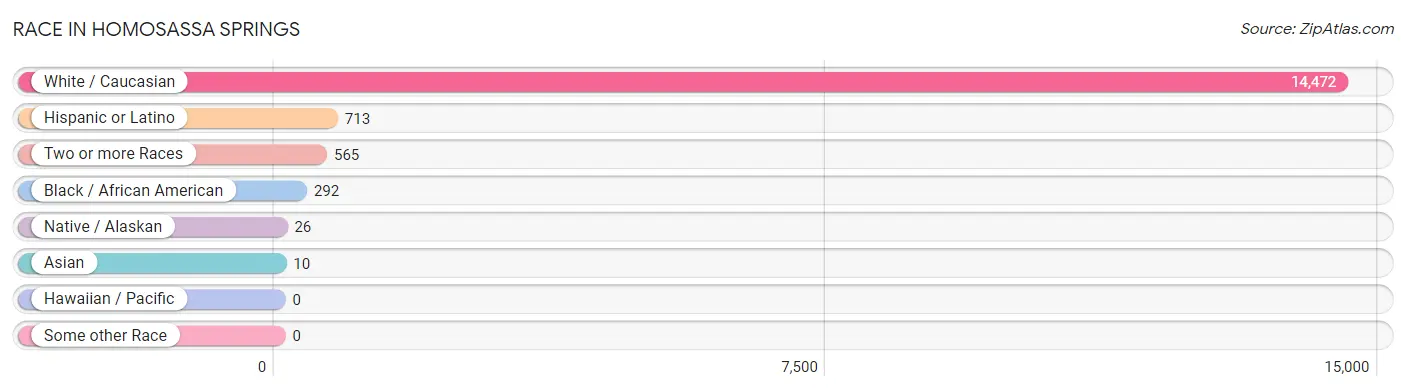
| Race | # Population | % Population |
| Asian | 10 | 0.1% |
| Black / African American | 292 | 1.9% |
| Hawaiian / Pacific | 0 | 0.0% |
| Hispanic or Latino | 713 | 4.6% |
| Native / Alaskan | 26 | 0.2% |
| White / Caucasian | 14,472 | 94.2% |
| Two or more Races | 565 | 3.7% |
| Some other Race | 0 | 0.0% |
| Total | 15,365 | 100.0% |
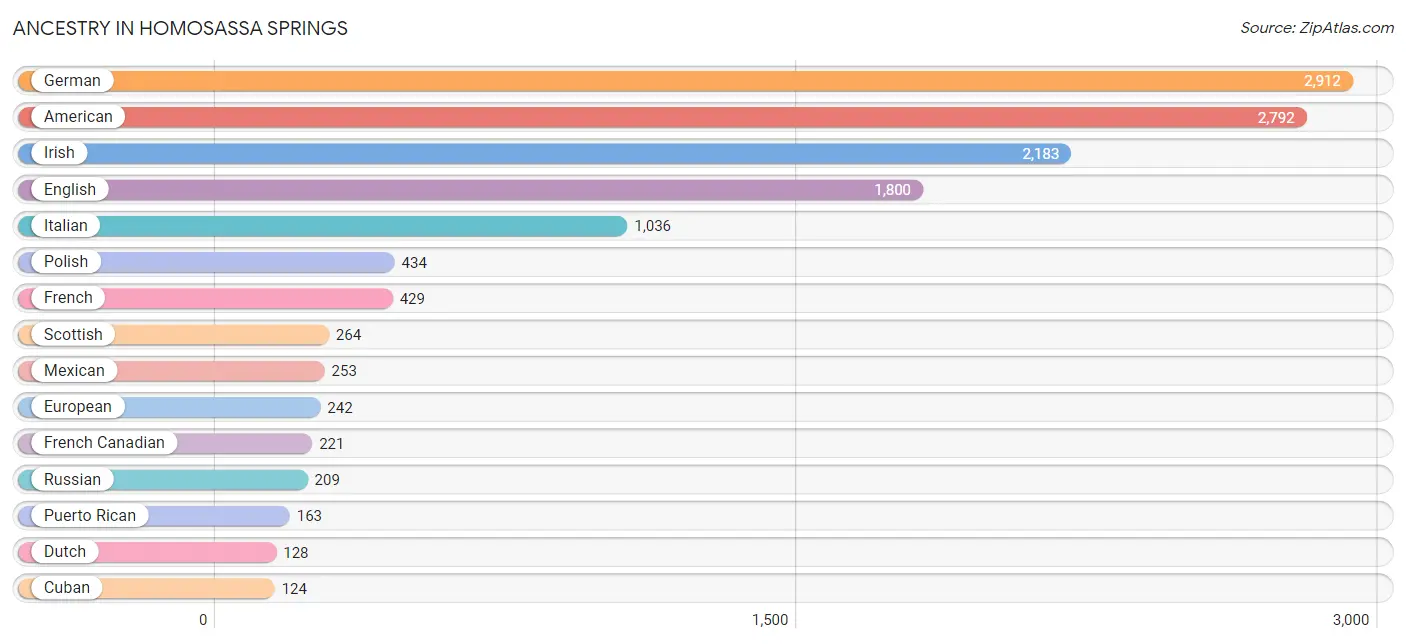
Ancestry in Homosassa Springs
The most populous ancestries reported in Homosassa Springs are German (2,912 | 19.0%), American (2,792 | 18.2%), Irish (2,183 | 14.2%), English (1,800 | 11.7%), and Italian (1,036 | 6.7%), together accounting for 69.8% of all Homosassa Springs residents.
| Ancestry | # Population | % Population |
| American | 2,792 | 18.2% |
| Armenian | 15 | 0.1% |
| Austrian | 17 | 0.1% |
| Blackfeet | 20 | 0.1% |
| British | 32 | 0.2% |
| Canadian | 15 | 0.1% |
| Central American | 47 | 0.3% |
| Cherokee | 72 | 0.5% |
| Colombian | 18 | 0.1% |
| Costa Rican | 47 | 0.3% |
| Cuban | 124 | 0.8% |
| Czech | 16 | 0.1% |
| Czechoslovakian | 18 | 0.1% |
| Danish | 16 | 0.1% |
| Dominican | 3 | 0.0% |
| Dutch | 128 | 0.8% |
| English | 1,800 | 11.7% |
| European | 242 | 1.6% |
| Finnish | 56 | 0.4% |
| French | 429 | 2.8% |
| French Canadian | 221 | 1.4% |
| German | 2,912 | 19.0% |
| Greek | 59 | 0.4% |
| Hungarian | 94 | 0.6% |
| Irish | 2,183 | 14.2% |
| Iroquois | 46 | 0.3% |
| Italian | 1,036 | 6.7% |
| Korean | 38 | 0.3% |
| Lithuanian | 12 | 0.1% |
| Mexican | 253 | 1.7% |
| Mexican American Indian | 9 | 0.1% |
| Norwegian | 49 | 0.3% |
| Pennsylvania German | 40 | 0.3% |
| Polish | 434 | 2.8% |
| Portuguese | 30 | 0.2% |
| Puerto Rican | 163 | 1.1% |
| Romanian | 20 | 0.1% |
| Russian | 209 | 1.4% |
| Scandinavian | 15 | 0.1% |
| Scotch-Irish | 71 | 0.5% |
| Scottish | 264 | 1.7% |
| Slovak | 21 | 0.1% |
| Slovene | 24 | 0.2% |
| South American | 18 | 0.1% |
| Swedish | 85 | 0.5% |
| Swiss | 18 | 0.1% |
| Ukrainian | 40 | 0.3% |
| Welsh | 112 | 0.7% | View All 48 Rows |
Immigrants in Homosassa Springs
The most numerous immigrant groups reported in Homosassa Springs came from Latin America (149 | 1.0%), Europe (116 | 0.7%), Central America (102 | 0.7%), Eastern Europe (101 | 0.7%), and Mexico (85 | 0.5%), together accounting for 3.6% of all Homosassa Springs residents.
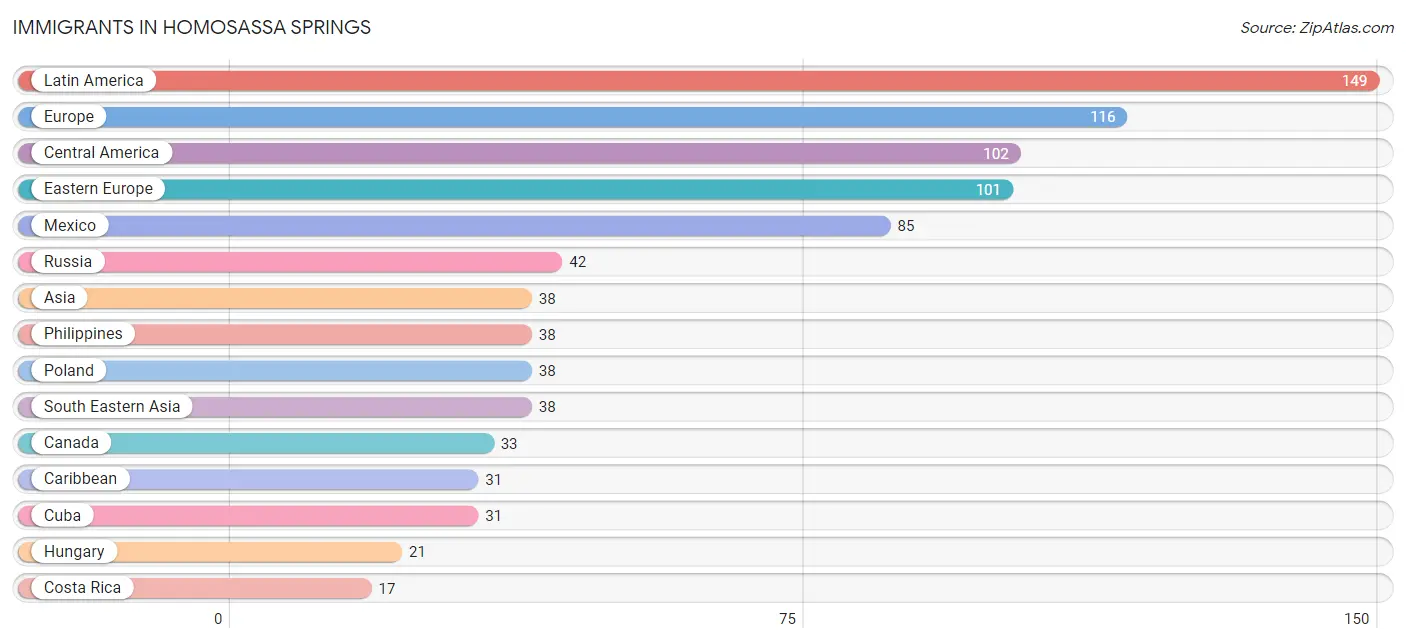
| Immigration Origin | # Population | % Population |
| Asia | 38 | 0.3% |
| Canada | 33 | 0.2% |
| Caribbean | 31 | 0.2% |
| Central America | 102 | 0.7% |
| Colombia | 16 | 0.1% |
| Costa Rica | 17 | 0.1% |
| Cuba | 31 | 0.2% |
| Eastern Europe | 101 | 0.7% |
| England | 15 | 0.1% |
| Europe | 116 | 0.7% |
| Hungary | 21 | 0.1% |
| Latin America | 149 | 1.0% |
| Mexico | 85 | 0.5% |
| Northern Europe | 15 | 0.1% |
| Philippines | 38 | 0.3% |
| Poland | 38 | 0.3% |
| Russia | 42 | 0.3% |
| South America | 16 | 0.1% |
| South Eastern Asia | 38 | 0.3% | View All 19 Rows |
Sex and Age in Homosassa Springs
Sex and Age in Homosassa Springs
The most populous age groups in Homosassa Springs are 55 to 59 Years (696 | 8.9%) for men and 50 to 54 Years (790 | 10.5%) for women.
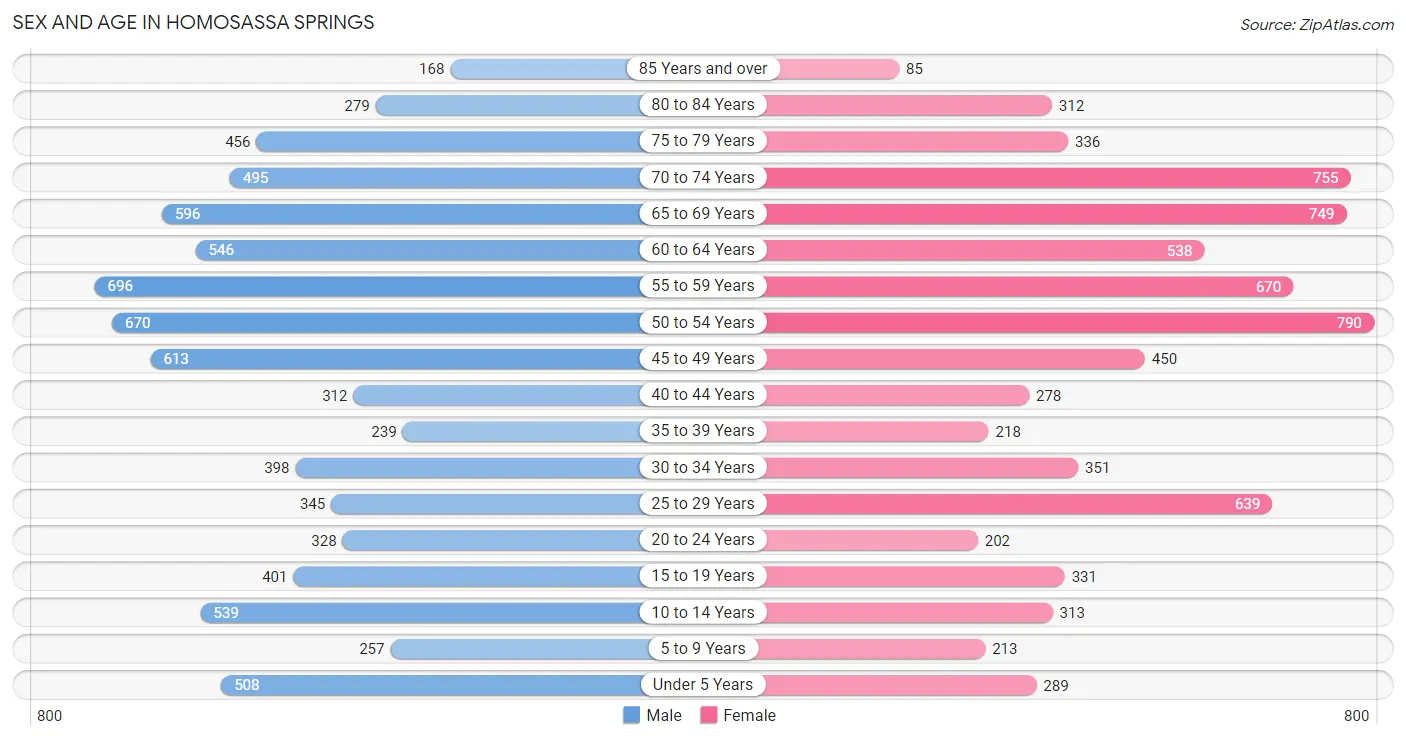
| Age Bracket | Male | Female |
| Under 5 Years | 508 (6.5%) | 289 (3.8%) |
| 5 to 9 Years | 257 (3.3%) | 213 (2.8%) |
| 10 to 14 Years | 539 (6.9%) | 313 (4.2%) |
| 15 to 19 Years | 401 (5.1%) | 331 (4.4%) |
| 20 to 24 Years | 328 (4.2%) | 202 (2.7%) |
| 25 to 29 Years | 345 (4.4%) | 639 (8.5%) |
| 30 to 34 Years | 398 (5.1%) | 351 (4.7%) |
| 35 to 39 Years | 239 (3.0%) | 218 (2.9%) |
| 40 to 44 Years | 312 (4.0%) | 278 (3.7%) |
| 45 to 49 Years | 613 (7.8%) | 450 (6.0%) |
| 50 to 54 Years | 670 (8.5%) | 790 (10.5%) |
| 55 to 59 Years | 696 (8.9%) | 670 (8.9%) |
| 60 to 64 Years | 546 (7.0%) | 538 (7.2%) |
| 65 to 69 Years | 596 (7.6%) | 749 (10.0%) |
| 70 to 74 Years | 495 (6.3%) | 755 (10.0%) |
| 75 to 79 Years | 456 (5.8%) | 336 (4.5%) |
| 80 to 84 Years | 279 (3.6%) | 312 (4.2%) |
| 85 Years and over | 168 (2.1%) | 85 (1.1%) |
| Total | 7,846 (100.0%) | 7,519 (100.0%) |
Families and Households in Homosassa Springs
Median Family Size in Homosassa Springs
The median family size in Homosassa Springs is 2.96 persons per family, with single female/mother families (898 | 21.2%) accounting for the largest median family size of 3.59 persons per family. On the other hand, single male/father families (450 | 10.6%) represent the smallest median family size with 2.14 persons per family.
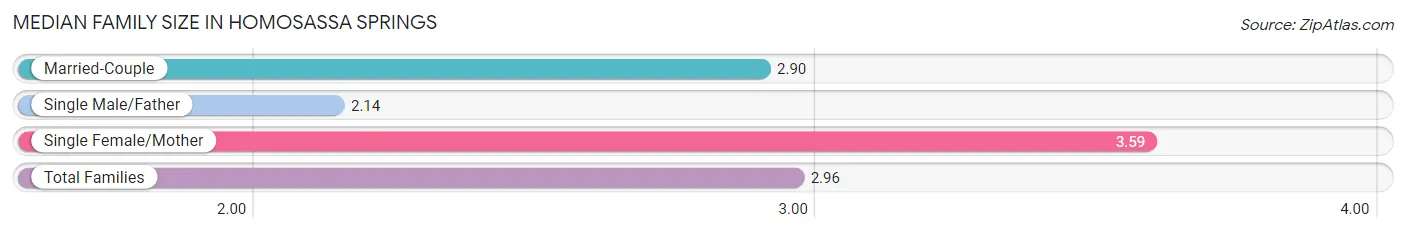
| Family Type | # Families | Family Size |
| Married-Couple | 2,882 (68.1%) | 2.90 |
| Single Male/Father | 450 (10.6%) | 2.14 |
| Single Female/Mother | 898 (21.2%) | 3.59 |
| Total Families | 4,230 (100.0%) | 2.96 |
Median Household Size in Homosassa Springs
The median household size in Homosassa Springs is 2.56 persons per household, with single female/mother households (898 | 15.0%) accounting for the largest median household size of 3.83 persons per household. non-family households (1,751 | 29.3%) represent the smallest median household size with 1.20 persons per household.
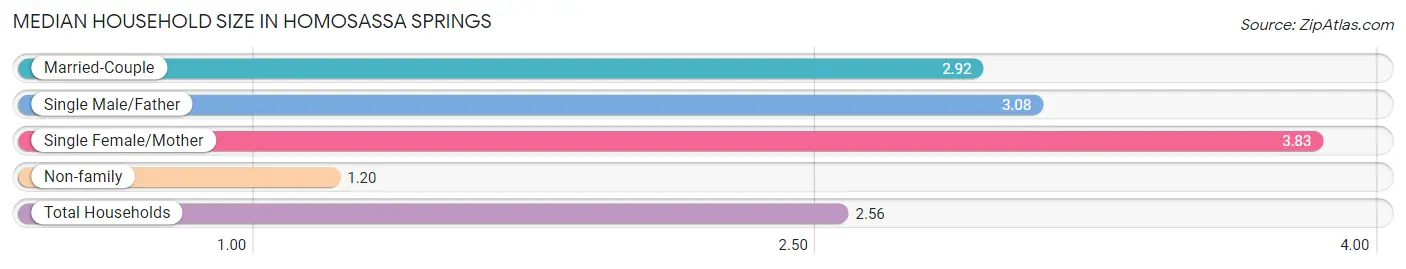
| Household Type | # Households | Household Size |
| Married-Couple | 2,882 (48.2%) | 2.92 |
| Single Male/Father | 450 (7.5%) | 3.08 |
| Single Female/Mother | 898 (15.0%) | 3.83 |
| Non-family | 1,751 (29.3%) | 1.20 |
| Total Households | 5,981 (100.0%) | 2.56 |
Household Size by Marriage Status in Homosassa Springs
Out of a total of 5,981 households in Homosassa Springs, 4,230 (70.7%) are family households, while 1,751 (29.3%) are nonfamily households. The most numerous type of family households are 2-person households, comprising 2,193, and the most common type of nonfamily households are 1-person households, comprising 1,462.
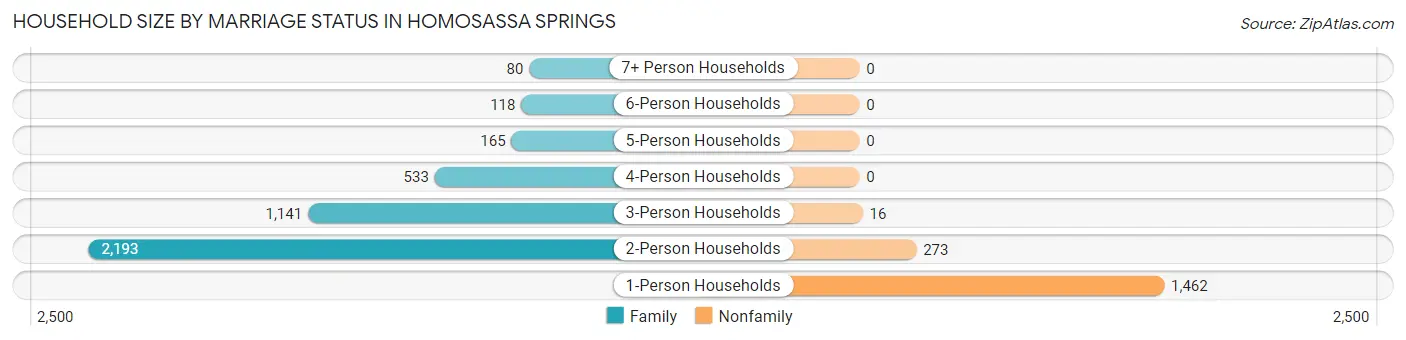
| Household Size | Family Households | Nonfamily Households |
| 1-Person Households | - | 1,462 (24.4%) |
| 2-Person Households | 2,193 (36.7%) | 273 (4.6%) |
| 3-Person Households | 1,141 (19.1%) | 16 (0.3%) |
| 4-Person Households | 533 (8.9%) | 0 (0.0%) |
| 5-Person Households | 165 (2.8%) | 0 (0.0%) |
| 6-Person Households | 118 (2.0%) | 0 (0.0%) |
| 7+ Person Households | 80 (1.3%) | 0 (0.0%) |
| Total | 4,230 (70.7%) | 1,751 (29.3%) |
Female Fertility in Homosassa Springs
Fertility by Age in Homosassa Springs
Average fertility rate in Homosassa Springs is 44.0 births per 1,000 women. Women in the age bracket of 20 to 34 years have the highest fertility rate with 102.0 births per 1,000 women. Women in the age bracket of 20 to 34 years acount for 100.0% of all women with births.
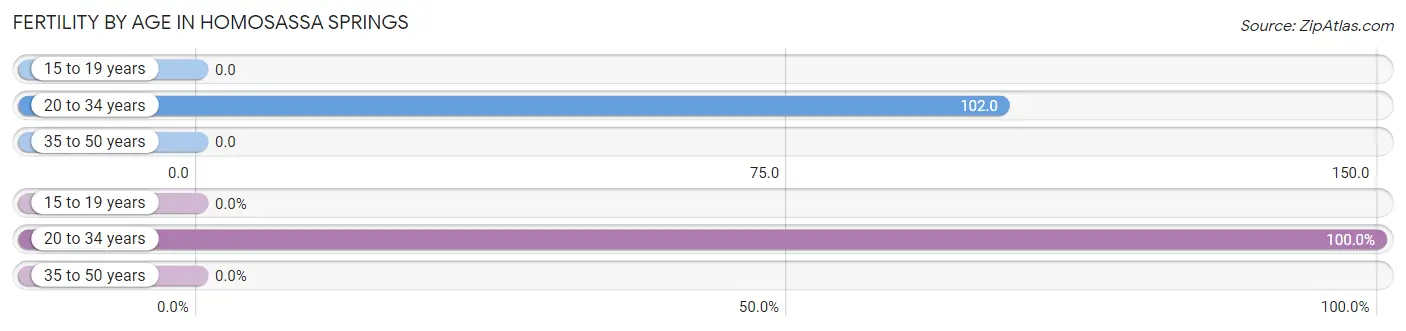
| Age Bracket | Women with Births | Births / 1,000 Women |
| 15 to 19 years | 0 (0.0%) | 0.0 |
| 20 to 34 years | 121 (100.0%) | 102.0 |
| 35 to 50 years | 0 (0.0%) | 0.0 |
| Total | 121 (100.0%) | 44.0 |
Fertility by Age by Marriage Status in Homosassa Springs
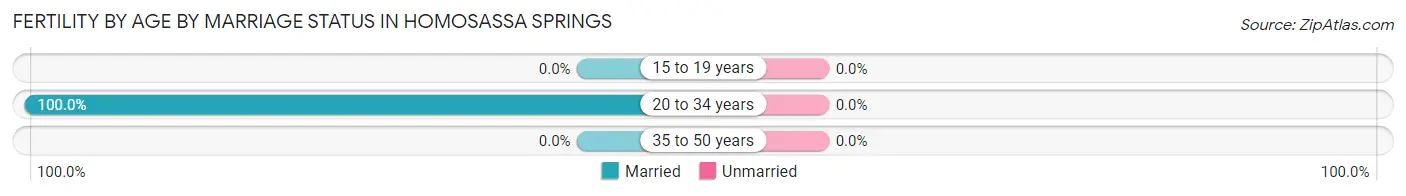
| Age Bracket | Married | Unmarried |
| 15 to 19 years | 0 (0.0%) | 0 (0.0%) |
| 20 to 34 years | 121 (100.0%) | 0 (0.0%) |
| 35 to 50 years | 0 (0.0%) | 0 (0.0%) |
| Total | 121 (100.0%) | 0 (0.0%) |
Fertility by Education in Homosassa Springs
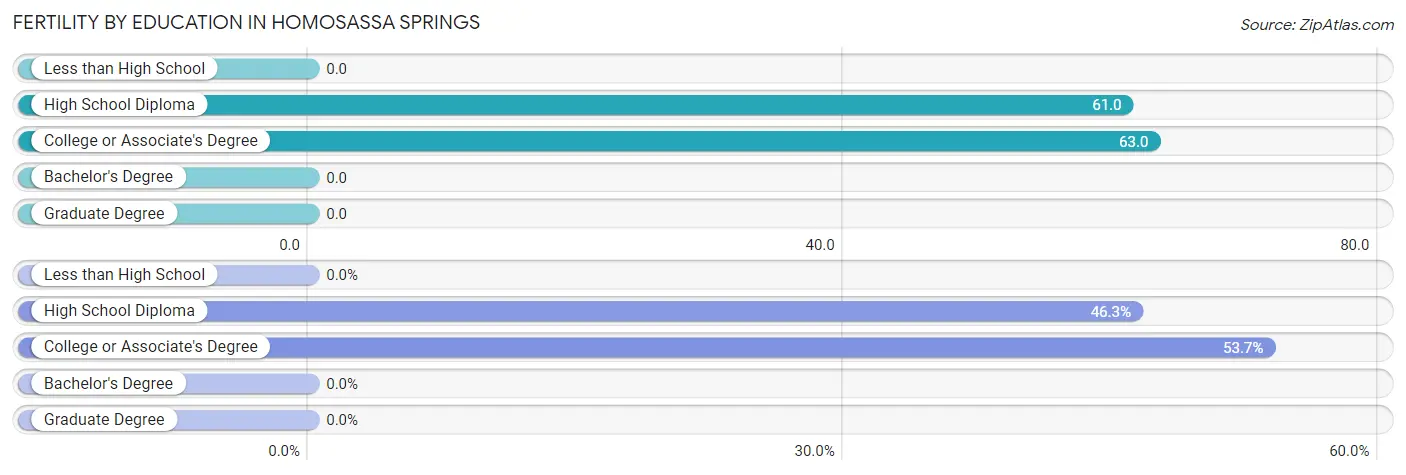
| Educational Attainment | Women with Births | Births / 1,000 Women |
| Less than High School | 0 (0.0%) | 0.0 |
| High School Diploma | 56 (46.3%) | 61.0 |
| College or Associate's Degree | 65 (53.7%) | 63.0 |
| Bachelor's Degree | 0 (0.0%) | 0.0 |
| Graduate Degree | 0 (0.0%) | 0.0 |
| Total | 121 (100.0%) | 44.0 |
Fertility by Education by Marriage Status in Homosassa Springs
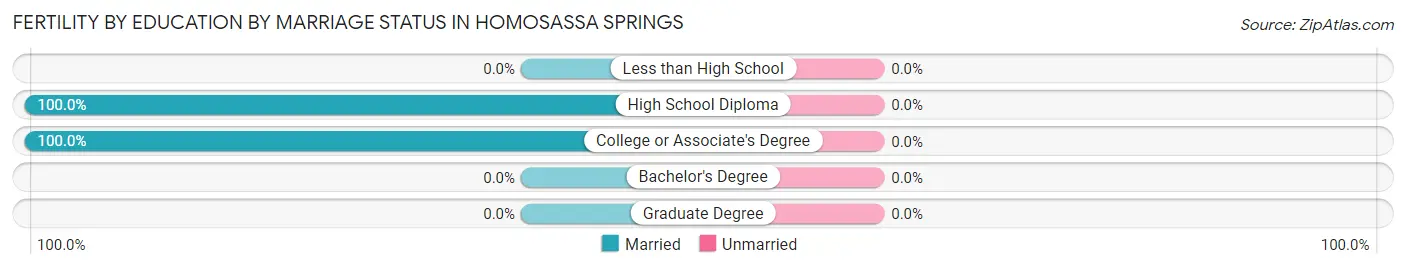
| Educational Attainment | Married | Unmarried |
| Less than High School | 0 (0.0%) | 0 (0.0%) |
| High School Diploma | 56 (100.0%) | 0 (0.0%) |
| College or Associate's Degree | 65 (100.0%) | 0 (0.0%) |
| Bachelor's Degree | 0 (0.0%) | 0 (0.0%) |
| Graduate Degree | 0 (0.0%) | 0 (0.0%) |
| Total | 121 (100.0%) | 0 (0.0%) |
Employment Characteristics in Homosassa Springs
Employment by Class of Employer in Homosassa Springs
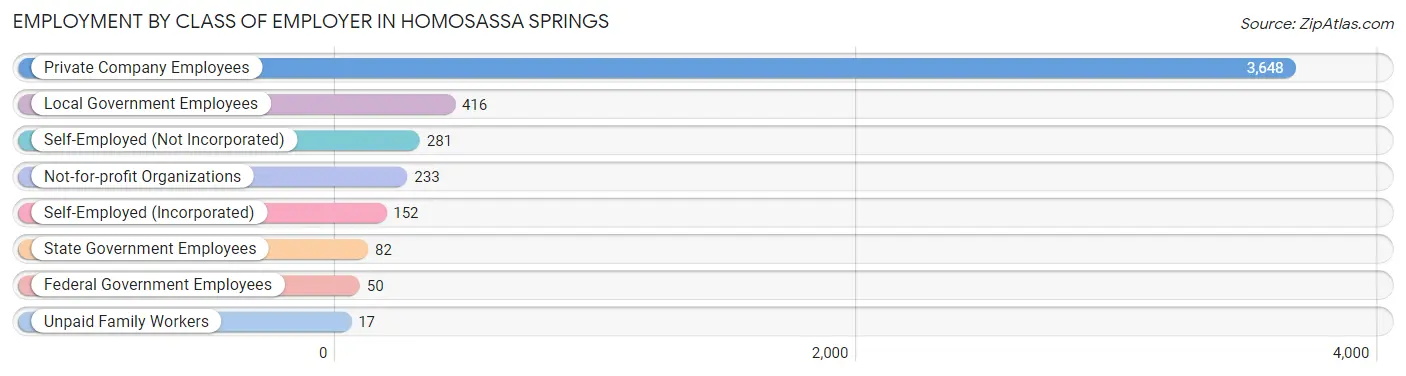
Among the 4,879 employed individuals in Homosassa Springs, private company employees (3,648 | 74.8%), local government employees (416 | 8.5%), and self-employed (not incorporated) (281 | 5.8%) make up the most common classes of employment.
| Employer Class | # Employees | % Employees |
| Private Company Employees | 3,648 | 74.8% |
| Self-Employed (Incorporated) | 152 | 3.1% |
| Self-Employed (Not Incorporated) | 281 | 5.8% |
| Not-for-profit Organizations | 233 | 4.8% |
| Local Government Employees | 416 | 8.5% |
| State Government Employees | 82 | 1.7% |
| Federal Government Employees | 50 | 1.0% |
| Unpaid Family Workers | 17 | 0.4% |
| Total | 4,879 | 100.0% |
Employment Status by Age in Homosassa Springs
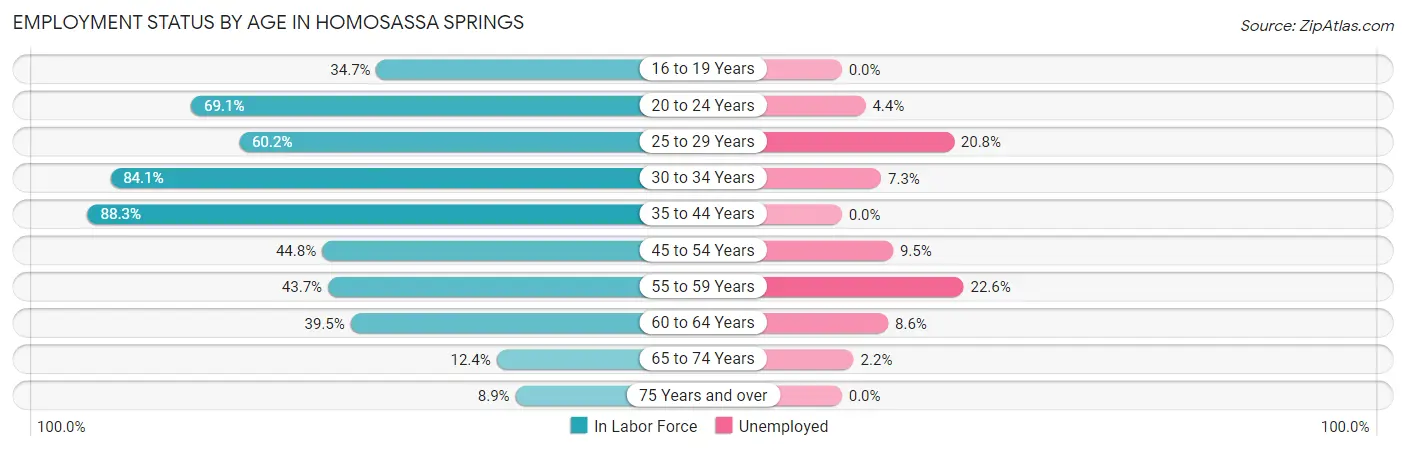
According to the labor force statistics for Homosassa Springs, out of the total population over 16 years of age (13,169), 40.7% or 5,360 individuals are in the labor force, with 8.8% or 472 of them unemployed. The age group with the highest labor force participation rate is 35 to 44 years, with 88.3% or 925 individuals in the labor force. Within the labor force, the 55 to 59 years age range has the highest percentage of unemployed individuals, with 22.6% or 135 of them being unemployed.
| Age Bracket | In Labor Force | Unemployed |
| 16 to 19 Years | 227 (34.7%) | 0 (0.0%) |
| 20 to 24 Years | 366 (69.1%) | 16 (4.4%) |
| 25 to 29 Years | 592 (60.2%) | 123 (20.8%) |
| 30 to 34 Years | 630 (84.1%) | 46 (7.3%) |
| 35 to 44 Years | 925 (88.3%) | 0 (0.0%) |
| 45 to 54 Years | 1,130 (44.8%) | 107 (9.5%) |
| 55 to 59 Years | 597 (43.7%) | 135 (22.6%) |
| 60 to 64 Years | 428 (39.5%) | 37 (8.6%) |
| 65 to 74 Years | 322 (12.4%) | 7 (2.2%) |
| 75 Years and over | 146 (8.9%) | 0 (0.0%) |
| Total | 5,360 (40.7%) | 472 (8.8%) |
Employment Status by Educational Attainment in Homosassa Springs
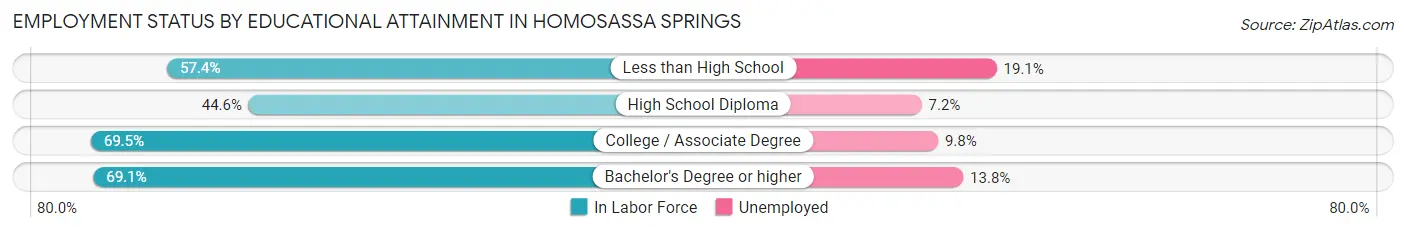
According to labor force statistics for Homosassa Springs, 55.5% of individuals (4,303) out of the total population between 25 and 64 years of age (7,753) are in the labor force, with 10.4% or 448 of them being unemployed. The group with the highest labor force participation rate are those with the educational attainment of college / associate degree, with 69.5% or 1,535 individuals in the labor force. Within the labor force, individuals with less than high school education have the highest percentage of unemployment, with 19.1% or 106 of them being unemployed.
| Educational Attainment | In Labor Force | Unemployed |
| Less than High School | 556 (57.4%) | 185 (19.1%) |
| High School Diploma | 1,732 (44.6%) | 280 (7.2%) |
| College / Associate Degree | 1,535 (69.5%) | 216 (9.8%) |
| Bachelor's Degree or higher | 478 (69.1%) | 95 (13.8%) |
| Total | 4,303 (55.5%) | 806 (10.4%) |
Employment Occupations by Sex in Homosassa Springs
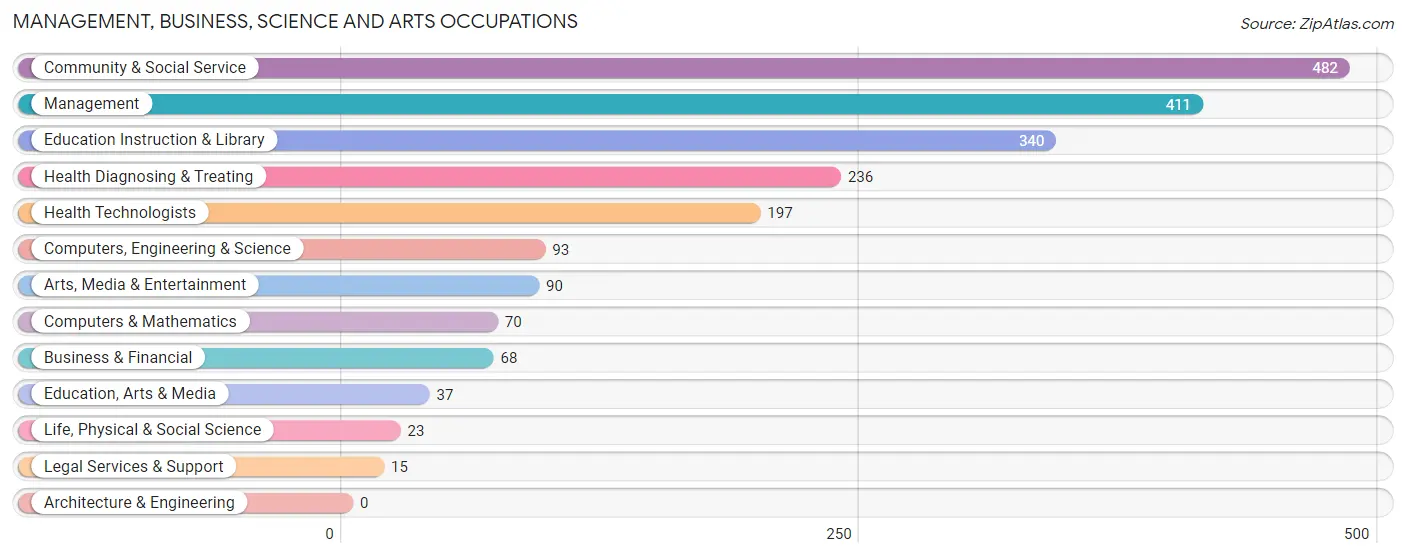
Management, Business, Science and Arts Occupations
The most common Management, Business, Science and Arts occupations in Homosassa Springs are Community & Social Service (482 | 9.9%), Management (411 | 8.5%), Education Instruction & Library (340 | 7.0%), Health Diagnosing & Treating (236 | 4.9%), and Health Technologists (197 | 4.1%).
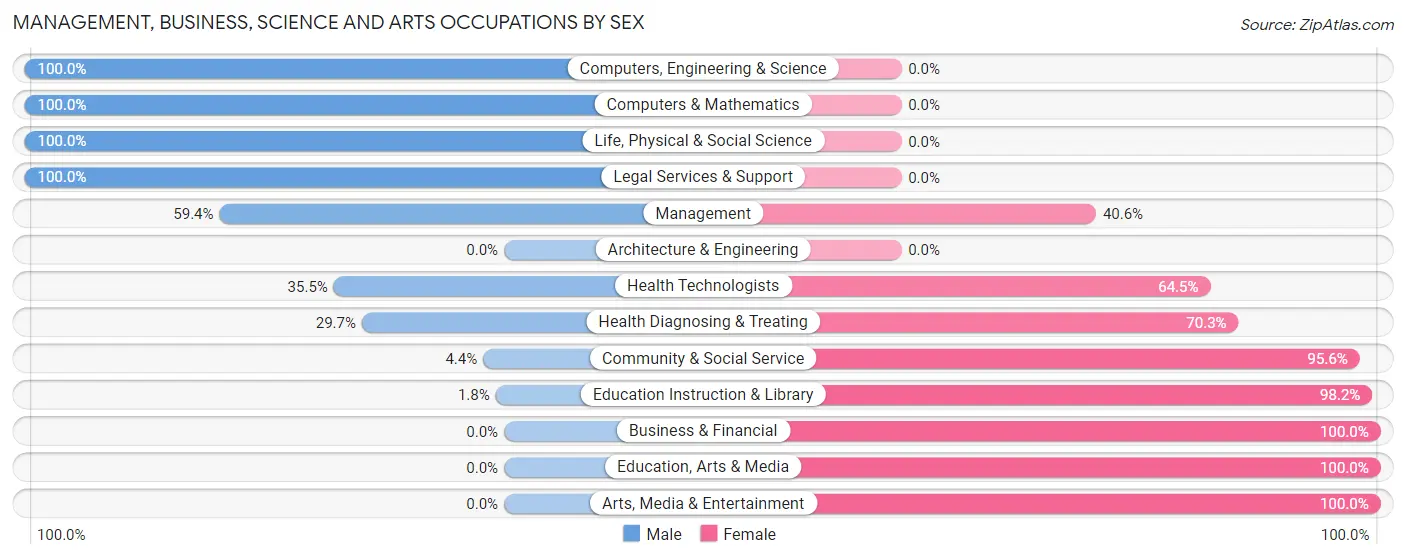
Management, Business, Science and Arts Occupations by Sex
Within the Management, Business, Science and Arts occupations in Homosassa Springs, the most male-oriented occupations are Computers, Engineering & Science (100.0%), Computers & Mathematics (100.0%), and Life, Physical & Social Science (100.0%), while the most female-oriented occupations are Business & Financial (100.0%), Education, Arts & Media (100.0%), and Arts, Media & Entertainment (100.0%).
| Occupation | Male | Female |
| Management | 244 (59.4%) | 167 (40.6%) |
| Business & Financial | 0 (0.0%) | 68 (100.0%) |
| Computers, Engineering & Science | 93 (100.0%) | 0 (0.0%) |
| Computers & Mathematics | 70 (100.0%) | 0 (0.0%) |
| Architecture & Engineering | 0 (0.0%) | 0 (0.0%) |
| Life, Physical & Social Science | 23 (100.0%) | 0 (0.0%) |
| Community & Social Service | 21 (4.4%) | 461 (95.6%) |
| Education, Arts & Media | 0 (0.0%) | 37 (100.0%) |
| Legal Services & Support | 15 (100.0%) | 0 (0.0%) |
| Education Instruction & Library | 6 (1.8%) | 334 (98.2%) |
| Arts, Media & Entertainment | 0 (0.0%) | 90 (100.0%) |
| Health Diagnosing & Treating | 70 (29.7%) | 166 (70.3%) |
| Health Technologists | 70 (35.5%) | 127 (64.5%) |
| Total (Category) | 428 (33.2%) | 862 (66.8%) |
| Total (Overall) | 2,604 (53.5%) | 2,260 (46.5%) |
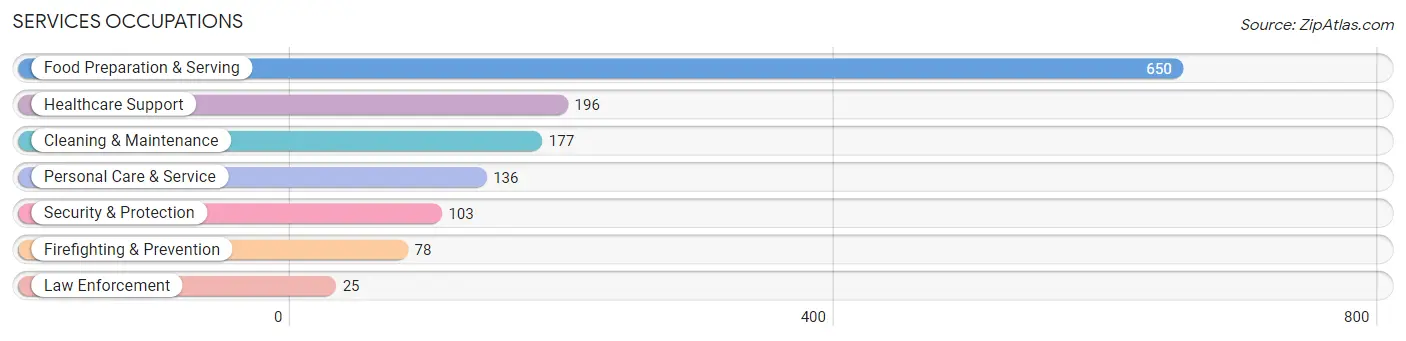
Services Occupations
The most common Services occupations in Homosassa Springs are Food Preparation & Serving (650 | 13.4%), Healthcare Support (196 | 4.0%), Cleaning & Maintenance (177 | 3.6%), Personal Care & Service (136 | 2.8%), and Security & Protection (103 | 2.1%).
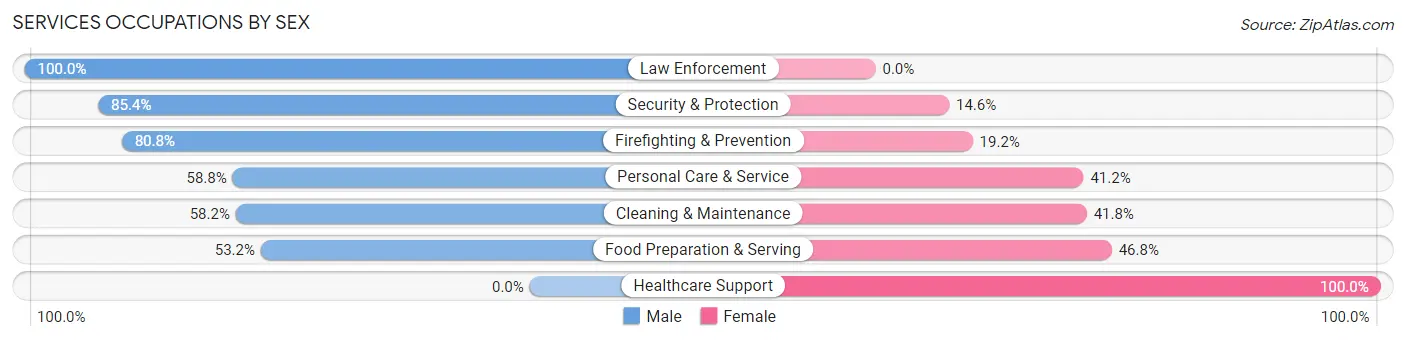
Services Occupations by Sex
Within the Services occupations in Homosassa Springs, the most male-oriented occupations are Law Enforcement (100.0%), Security & Protection (85.4%), and Firefighting & Prevention (80.8%), while the most female-oriented occupations are Healthcare Support (100.0%), Food Preparation & Serving (46.8%), and Cleaning & Maintenance (41.8%).
| Occupation | Male | Female |
| Healthcare Support | 0 (0.0%) | 196 (100.0%) |
| Security & Protection | 88 (85.4%) | 15 (14.6%) |
| Firefighting & Prevention | 63 (80.8%) | 15 (19.2%) |
| Law Enforcement | 25 (100.0%) | 0 (0.0%) |
| Food Preparation & Serving | 346 (53.2%) | 304 (46.8%) |
| Cleaning & Maintenance | 103 (58.2%) | 74 (41.8%) |
| Personal Care & Service | 80 (58.8%) | 56 (41.2%) |
| Total (Category) | 617 (48.9%) | 645 (51.1%) |
| Total (Overall) | 2,604 (53.5%) | 2,260 (46.5%) |
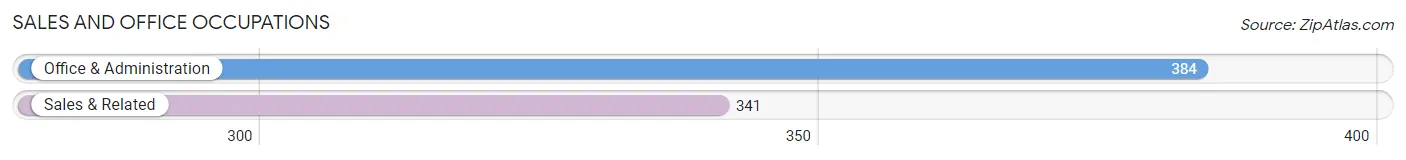
Sales and Office Occupations
The most common Sales and Office occupations in Homosassa Springs are Office & Administration (384 | 7.9%), and Sales & Related (341 | 7.0%).
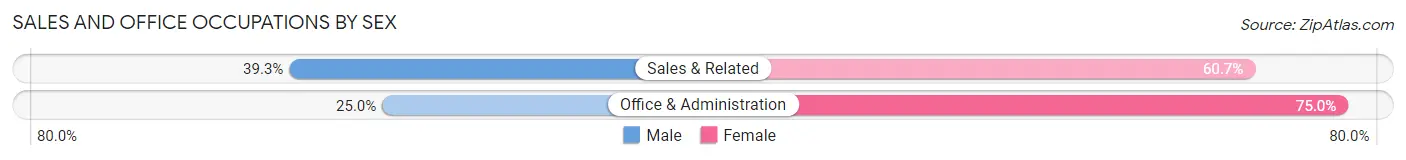
Sales and Office Occupations by Sex
| Occupation | Male | Female |
| Sales & Related | 134 (39.3%) | 207 (60.7%) |
| Office & Administration | 96 (25.0%) | 288 (75.0%) |
| Total (Category) | 230 (31.7%) | 495 (68.3%) |
| Total (Overall) | 2,604 (53.5%) | 2,260 (46.5%) |
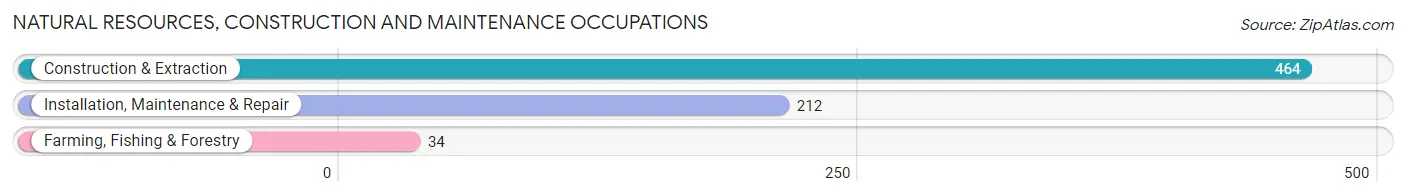
Natural Resources, Construction and Maintenance Occupations
The most common Natural Resources, Construction and Maintenance occupations in Homosassa Springs are Construction & Extraction (464 | 9.5%), Installation, Maintenance & Repair (212 | 4.4%), and Farming, Fishing & Forestry (34 | 0.7%).
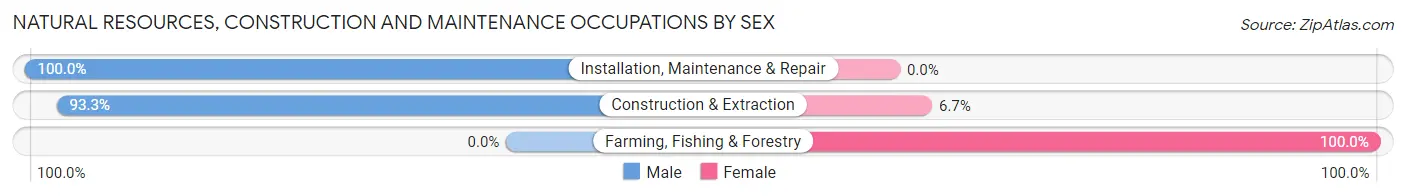
Natural Resources, Construction and Maintenance Occupations by Sex
| Occupation | Male | Female |
| Farming, Fishing & Forestry | 0 (0.0%) | 34 (100.0%) |
| Construction & Extraction | 433 (93.3%) | 31 (6.7%) |
| Installation, Maintenance & Repair | 212 (100.0%) | 0 (0.0%) |
| Total (Category) | 645 (90.8%) | 65 (9.1%) |
| Total (Overall) | 2,604 (53.5%) | 2,260 (46.5%) |
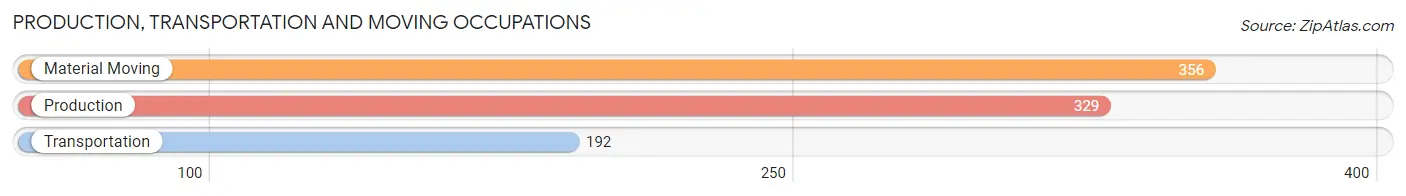
Production, Transportation and Moving Occupations
The most common Production, Transportation and Moving occupations in Homosassa Springs are Material Moving (356 | 7.3%), Production (329 | 6.8%), and Transportation (192 | 4.0%).
Production, Transportation and Moving Occupations by Sex
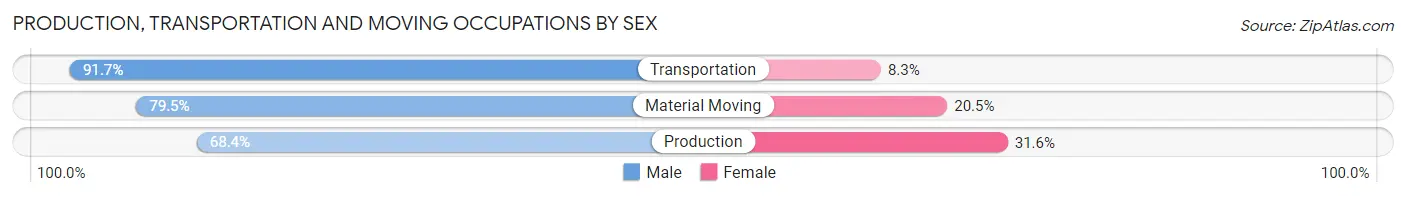
| Occupation | Male | Female |
| Production | 225 (68.4%) | 104 (31.6%) |
| Transportation | 176 (91.7%) | 16 (8.3%) |
| Material Moving | 283 (79.5%) | 73 (20.5%) |
| Total (Category) | 684 (78.0%) | 193 (22.0%) |
| Total (Overall) | 2,604 (53.5%) | 2,260 (46.5%) |
Employment Industries by Sex in Homosassa Springs
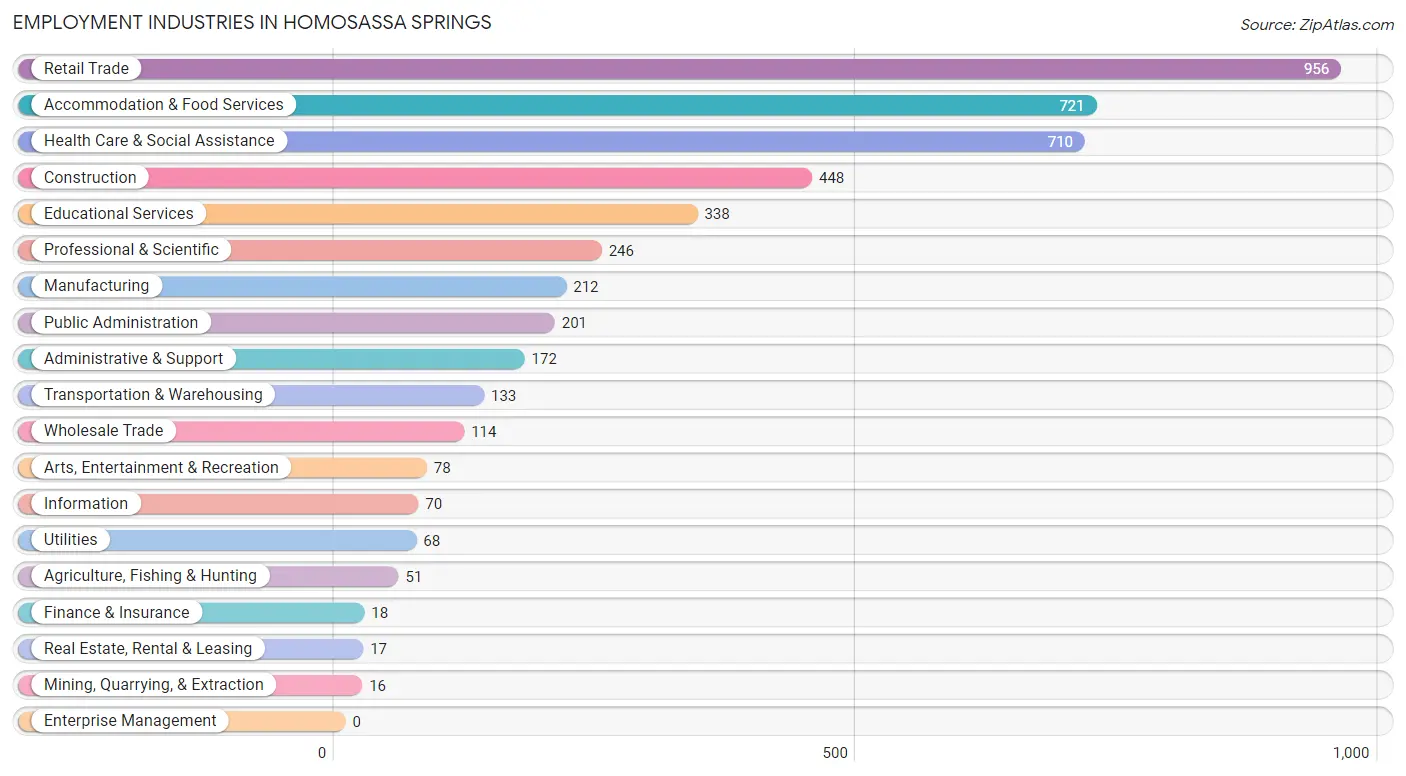
Employment Industries in Homosassa Springs
The major employment industries in Homosassa Springs include Retail Trade (956 | 19.7%), Accommodation & Food Services (721 | 14.8%), Health Care & Social Assistance (710 | 14.6%), Construction (448 | 9.2%), and Educational Services (338 | 7.0%).
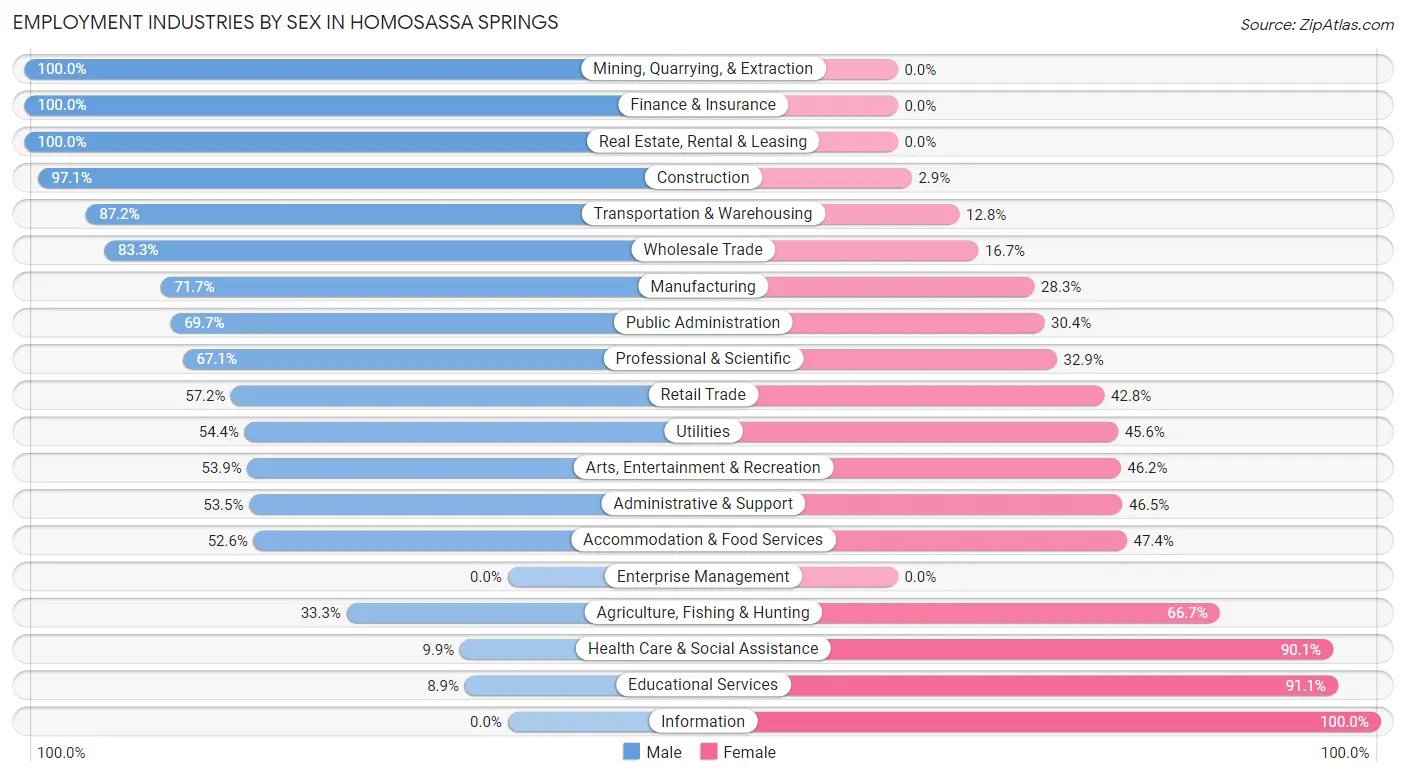
Employment Industries by Sex in Homosassa Springs
The Homosassa Springs industries that see more men than women are Mining, Quarrying, & Extraction (100.0%), Finance & Insurance (100.0%), and Real Estate, Rental & Leasing (100.0%), whereas the industries that tend to have a higher number of women are Information (100.0%), Educational Services (91.1%), and Health Care & Social Assistance (90.1%).
| Industry | Male | Female |
| Agriculture, Fishing & Hunting | 17 (33.3%) | 34 (66.7%) |
| Mining, Quarrying, & Extraction | 16 (100.0%) | 0 (0.0%) |
| Construction | 435 (97.1%) | 13 (2.9%) |
| Manufacturing | 152 (71.7%) | 60 (28.3%) |
| Wholesale Trade | 95 (83.3%) | 19 (16.7%) |
| Retail Trade | 547 (57.2%) | 409 (42.8%) |
| Transportation & Warehousing | 116 (87.2%) | 17 (12.8%) |
| Utilities | 37 (54.4%) | 31 (45.6%) |
| Information | 0 (0.0%) | 70 (100.0%) |
| Finance & Insurance | 18 (100.0%) | 0 (0.0%) |
| Real Estate, Rental & Leasing | 17 (100.0%) | 0 (0.0%) |
| Professional & Scientific | 165 (67.1%) | 81 (32.9%) |
| Enterprise Management | 0 (0.0%) | 0 (0.0%) |
| Administrative & Support | 92 (53.5%) | 80 (46.5%) |
| Educational Services | 30 (8.9%) | 308 (91.1%) |
| Health Care & Social Assistance | 70 (9.9%) | 640 (90.1%) |
| Arts, Entertainment & Recreation | 42 (53.8%) | 36 (46.2%) |
| Accommodation & Food Services | 379 (52.6%) | 342 (47.4%) |
| Public Administration | 140 (69.7%) | 61 (30.3%) |
| Total | 2,604 (53.5%) | 2,260 (46.5%) |
Education in Homosassa Springs
School Enrollment in Homosassa Springs
The most common levels of schooling among the 2,312 students in Homosassa Springs are middle school (646 | 27.9%), high school (604 | 26.1%), and elementary school (483 | 20.9%).
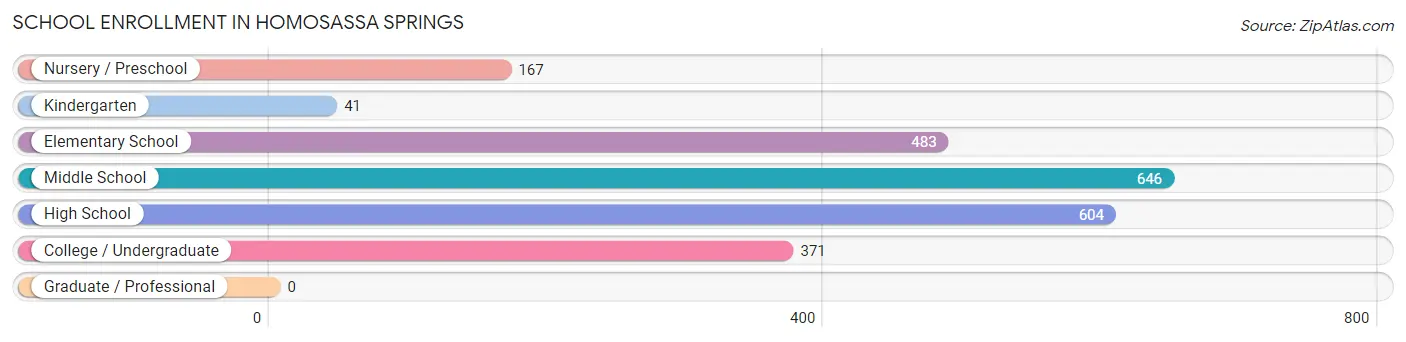
| School Level | # Students | % Students |
| Nursery / Preschool | 167 | 7.2% |
| Kindergarten | 41 | 1.8% |
| Elementary School | 483 | 20.9% |
| Middle School | 646 | 27.9% |
| High School | 604 | 26.1% |
| College / Undergraduate | 371 | 16.1% |
| Graduate / Professional | 0 | 0.0% |
| Total | 2,312 | 100.0% |
School Enrollment by Age by Funding Source in Homosassa Springs
Out of a total of 2,312 students who are enrolled in schools in Homosassa Springs, 238 (10.3%) attend a private institution, while the remaining 2,074 (89.7%) are enrolled in public schools. The age group of 35 years and over has the highest likelihood of being enrolled in private schools, with 60 (60.6% in the age bracket) enrolled. Conversely, the age group of 25 to 34 year olds has the lowest likelihood of being enrolled in a private school, with 10 (100.0% in the age bracket) attending a public institution.
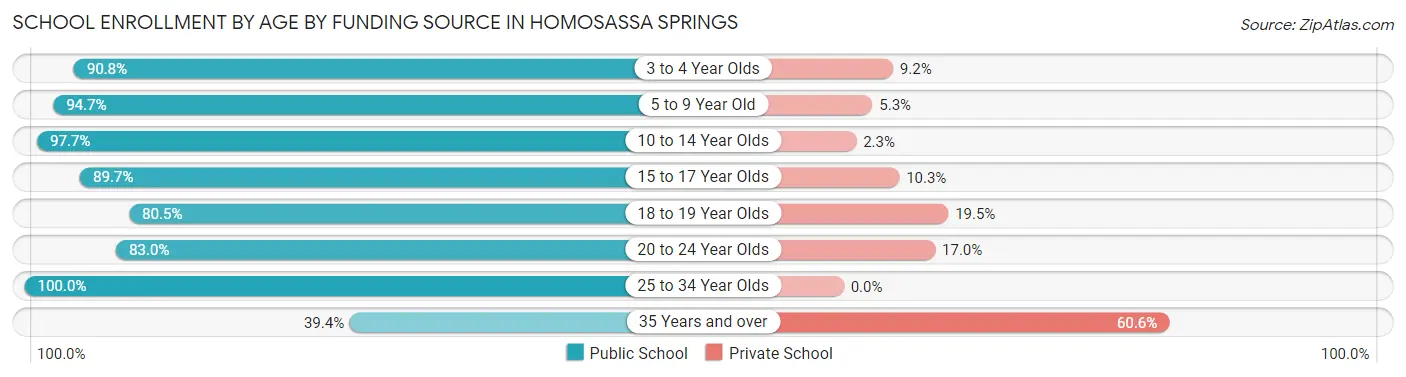
| Age Bracket | Public School | Private School |
| 3 to 4 Year Olds | 99 (90.8%) | 10 (9.2%) |
| 5 to 9 Year Old | 408 (94.7%) | 23 (5.3%) |
| 10 to 14 Year Olds | 795 (97.7%) | 19 (2.3%) |
| 15 to 17 Year Olds | 321 (89.7%) | 37 (10.3%) |
| 18 to 19 Year Olds | 211 (80.5%) | 51 (19.5%) |
| 20 to 24 Year Olds | 190 (83.0%) | 39 (17.0%) |
| 25 to 34 Year Olds | 10 (100.0%) | 0 (0.0%) |
| 35 Years and over | 39 (39.4%) | 60 (60.6%) |
| Total | 2,074 (89.7%) | 238 (10.3%) |
Educational Attainment by Field of Study in Homosassa Springs
Business (287 | 26.2%), arts & humanities (188 | 17.2%), education (156 | 14.2%), science & technology (149 | 13.6%), and physical & health sciences (80 | 7.3%) are the most common fields of study among 1,095 individuals in Homosassa Springs who have obtained a bachelor's degree or higher.
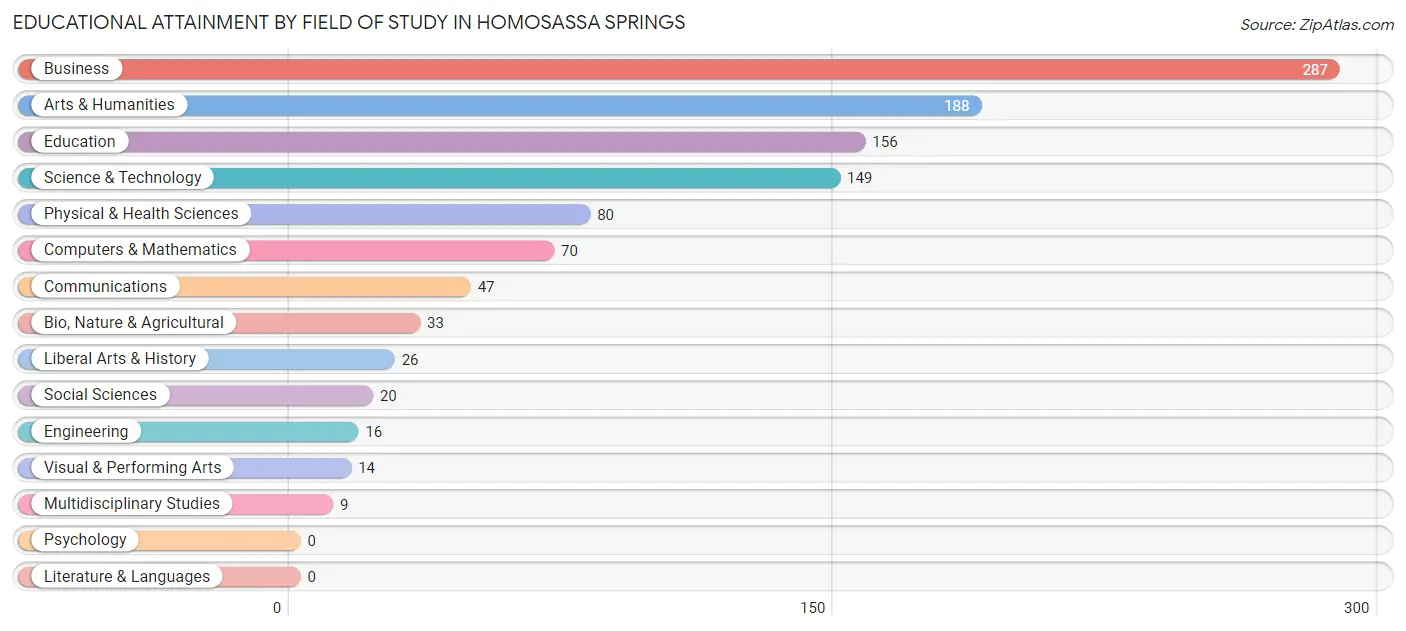
| Field of Study | # Graduates | % Graduates |
| Computers & Mathematics | 70 | 6.4% |
| Bio, Nature & Agricultural | 33 | 3.0% |
| Physical & Health Sciences | 80 | 7.3% |
| Psychology | 0 | 0.0% |
| Social Sciences | 20 | 1.8% |
| Engineering | 16 | 1.5% |
| Multidisciplinary Studies | 9 | 0.8% |
| Science & Technology | 149 | 13.6% |
| Business | 287 | 26.2% |
| Education | 156 | 14.2% |
| Literature & Languages | 0 | 0.0% |
| Liberal Arts & History | 26 | 2.4% |
| Visual & Performing Arts | 14 | 1.3% |
| Communications | 47 | 4.3% |
| Arts & Humanities | 188 | 17.2% |
| Total | 1,095 | 100.0% |
Transportation & Commute in Homosassa Springs
Vehicle Availability by Sex in Homosassa Springs
The most prevalent vehicle ownership categories in Homosassa Springs are males with 3 vehicles (920, accounting for 34.9%) and females with 3 vehicles (825, making up 41.0%).
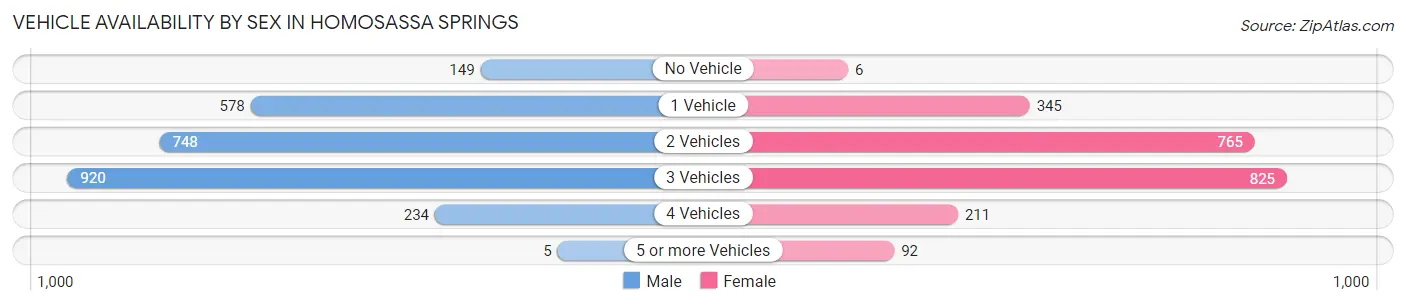
| Vehicles Available | Male | Female |
| No Vehicle | 149 (5.7%) | 6 (0.3%) |
| 1 Vehicle | 578 (21.9%) | 345 (15.4%) |
| 2 Vehicles | 748 (28.4%) | 765 (34.1%) |
| 3 Vehicles | 920 (34.9%) | 825 (36.8%) |
| 4 Vehicles | 234 (8.9%) | 211 (9.4%) |
| 5 or more Vehicles | 5 (0.2%) | 92 (4.1%) |
| Total | 2,634 (100.0%) | 2,244 (100.0%) |
Commute Time in Homosassa Springs
The most frequently occuring commute durations in Homosassa Springs are 15 to 19 minutes (1,141 commuters, 24.9%), 20 to 24 minutes (829 commuters, 18.1%), and 10 to 14 minutes (654 commuters, 14.3%).
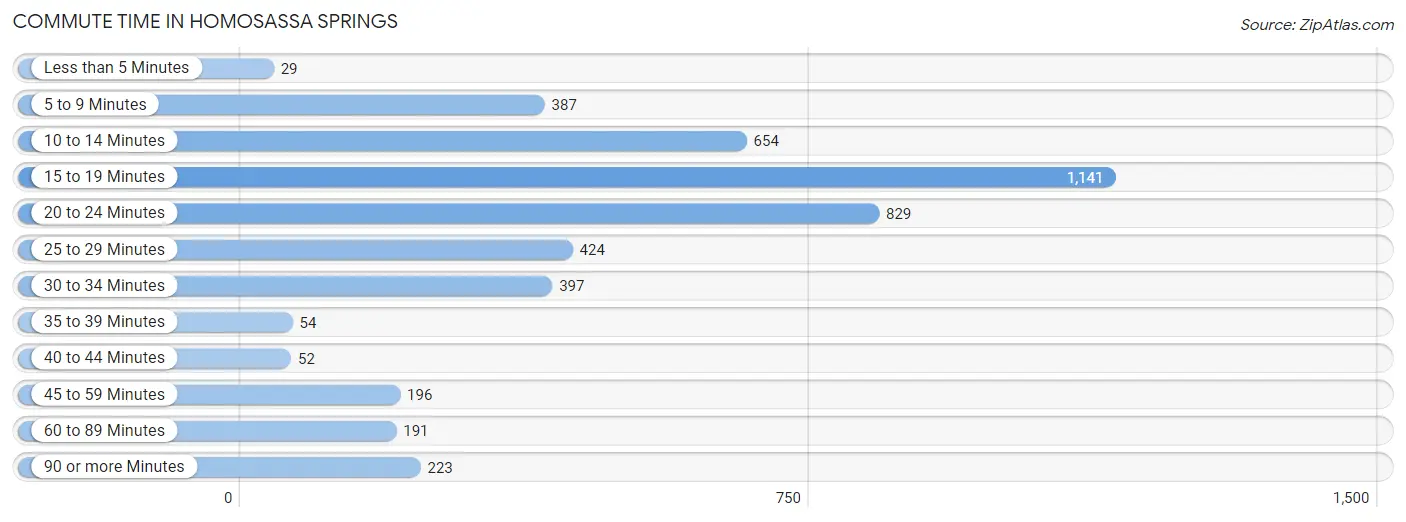
| Commute Time | # Commuters | % Commuters |
| Less than 5 Minutes | 29 | 0.6% |
| 5 to 9 Minutes | 387 | 8.5% |
| 10 to 14 Minutes | 654 | 14.3% |
| 15 to 19 Minutes | 1,141 | 24.9% |
| 20 to 24 Minutes | 829 | 18.1% |
| 25 to 29 Minutes | 424 | 9.3% |
| 30 to 34 Minutes | 397 | 8.7% |
| 35 to 39 Minutes | 54 | 1.2% |
| 40 to 44 Minutes | 52 | 1.1% |
| 45 to 59 Minutes | 196 | 4.3% |
| 60 to 89 Minutes | 191 | 4.2% |
| 90 or more Minutes | 223 | 4.9% |
Commute Time by Sex in Homosassa Springs
The most common commute times in Homosassa Springs are 15 to 19 minutes (696 commuters, 27.6%) for males and 20 to 24 minutes (470 commuters, 22.9%) for females.
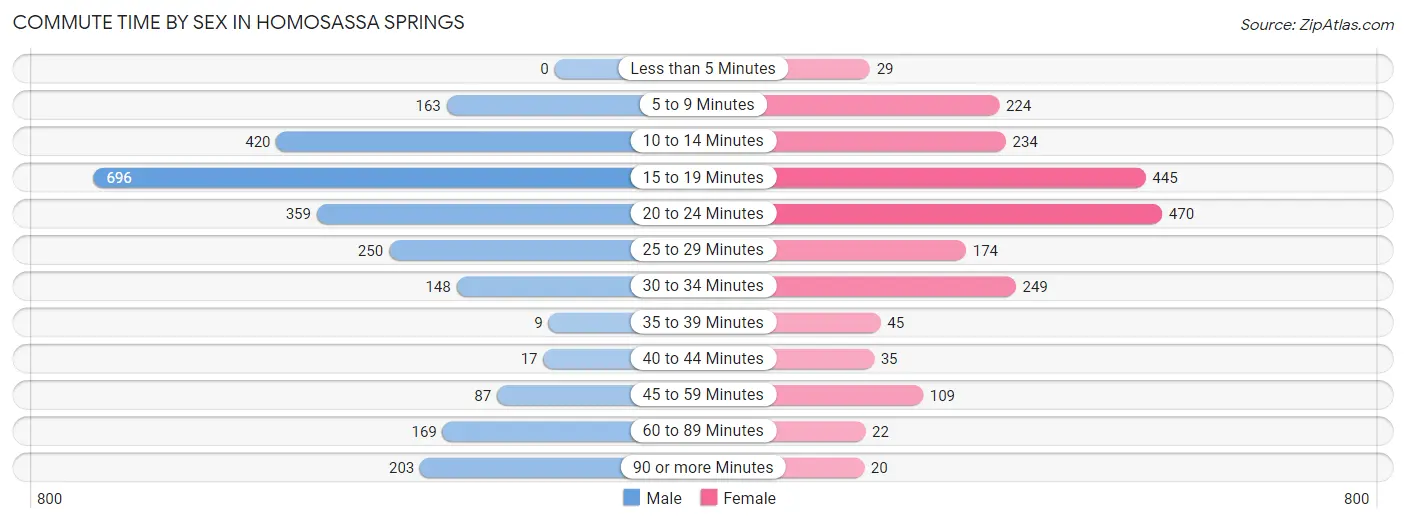
| Commute Time | Male | Female |
| Less than 5 Minutes | 0 (0.0%) | 29 (1.4%) |
| 5 to 9 Minutes | 163 (6.5%) | 224 (10.9%) |
| 10 to 14 Minutes | 420 (16.7%) | 234 (11.4%) |
| 15 to 19 Minutes | 696 (27.6%) | 445 (21.6%) |
| 20 to 24 Minutes | 359 (14.2%) | 470 (22.9%) |
| 25 to 29 Minutes | 250 (9.9%) | 174 (8.5%) |
| 30 to 34 Minutes | 148 (5.9%) | 249 (12.1%) |
| 35 to 39 Minutes | 9 (0.4%) | 45 (2.2%) |
| 40 to 44 Minutes | 17 (0.7%) | 35 (1.7%) |
| 45 to 59 Minutes | 87 (3.5%) | 109 (5.3%) |
| 60 to 89 Minutes | 169 (6.7%) | 22 (1.1%) |
| 90 or more Minutes | 203 (8.1%) | 20 (1.0%) |
Time of Departure to Work by Sex in Homosassa Springs
The most frequent times of departure to work in Homosassa Springs are 8:00 AM to 8:29 AM (430, 17.1%) for males and 6:00 AM to 6:29 AM (281, 13.7%) for females.
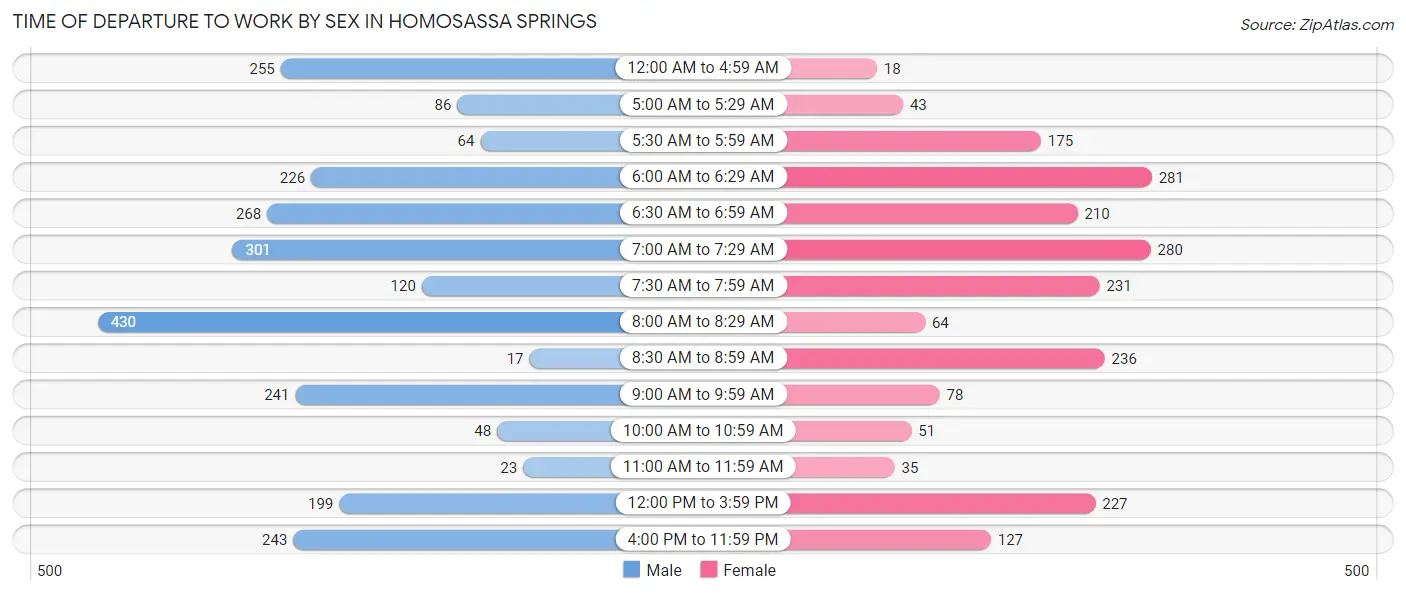
| Time of Departure | Male | Female |
| 12:00 AM to 4:59 AM | 255 (10.1%) | 18 (0.9%) |
| 5:00 AM to 5:29 AM | 86 (3.4%) | 43 (2.1%) |
| 5:30 AM to 5:59 AM | 64 (2.5%) | 175 (8.5%) |
| 6:00 AM to 6:29 AM | 226 (9.0%) | 281 (13.7%) |
| 6:30 AM to 6:59 AM | 268 (10.6%) | 210 (10.2%) |
| 7:00 AM to 7:29 AM | 301 (11.9%) | 280 (13.6%) |
| 7:30 AM to 7:59 AM | 120 (4.8%) | 231 (11.2%) |
| 8:00 AM to 8:29 AM | 430 (17.1%) | 64 (3.1%) |
| 8:30 AM to 8:59 AM | 17 (0.7%) | 236 (11.5%) |
| 9:00 AM to 9:59 AM | 241 (9.6%) | 78 (3.8%) |
| 10:00 AM to 10:59 AM | 48 (1.9%) | 51 (2.5%) |
| 11:00 AM to 11:59 AM | 23 (0.9%) | 35 (1.7%) |
| 12:00 PM to 3:59 PM | 199 (7.9%) | 227 (11.0%) |
| 4:00 PM to 11:59 PM | 243 (9.6%) | 127 (6.2%) |
| Total | 2,521 (100.0%) | 2,056 (100.0%) |
Housing Occupancy in Homosassa Springs
Occupancy by Ownership in Homosassa Springs
Of the total 5,981 dwellings in Homosassa Springs, owner-occupied units account for 5,170 (86.4%), while renter-occupied units make up 811 (13.6%).
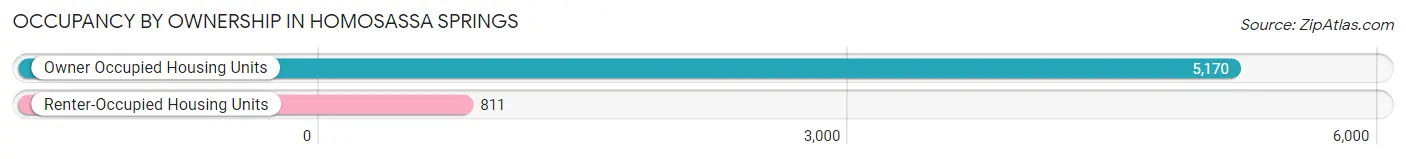
| Occupancy | # Housing Units | % Housing Units |
| Owner Occupied Housing Units | 5,170 | 86.4% |
| Renter-Occupied Housing Units | 811 | 13.6% |
| Total Occupied Housing Units | 5,981 | 100.0% |
Occupancy by Household Size in Homosassa Springs
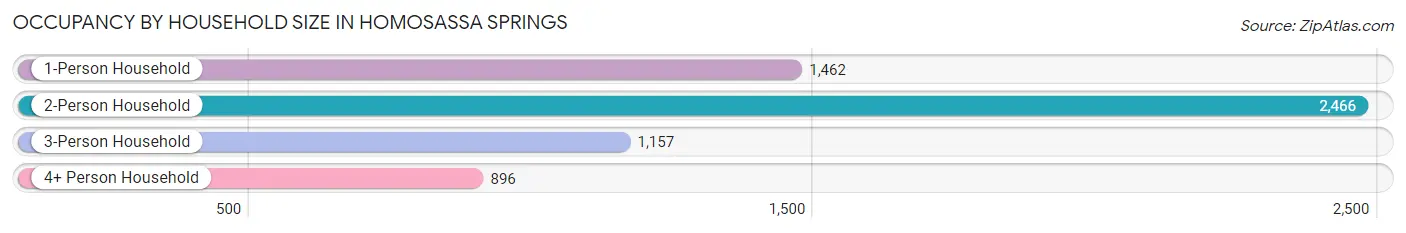
| Household Size | # Housing Units | % Housing Units |
| 1-Person Household | 1,462 | 24.4% |
| 2-Person Household | 2,466 | 41.2% |
| 3-Person Household | 1,157 | 19.3% |
| 4+ Person Household | 896 | 15.0% |
| Total Housing Units | 5,981 | 100.0% |
Occupancy by Ownership by Household Size in Homosassa Springs
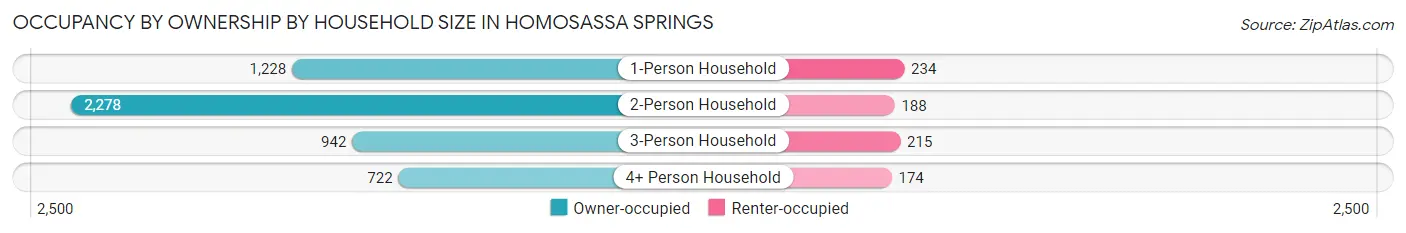
| Household Size | Owner-occupied | Renter-occupied |
| 1-Person Household | 1,228 (84.0%) | 234 (16.0%) |
| 2-Person Household | 2,278 (92.4%) | 188 (7.6%) |
| 3-Person Household | 942 (81.4%) | 215 (18.6%) |
| 4+ Person Household | 722 (80.6%) | 174 (19.4%) |
| Total Housing Units | 5,170 (86.4%) | 811 (13.6%) |
Occupancy by Educational Attainment in Homosassa Springs
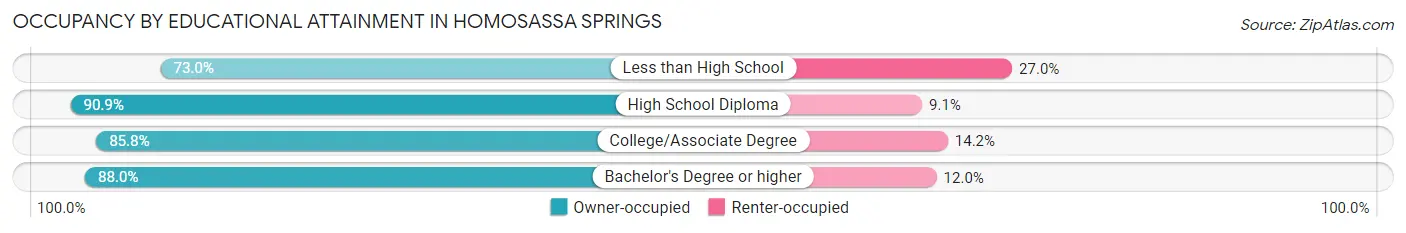
| Household Size | Owner-occupied | Renter-occupied |
| Less than High School | 539 (73.0%) | 199 (27.0%) |
| High School Diploma | 2,126 (90.9%) | 213 (9.1%) |
| College/Associate Degree | 1,962 (85.8%) | 325 (14.2%) |
| Bachelor's Degree or higher | 543 (88.0%) | 74 (12.0%) |
Occupancy by Age of Householder in Homosassa Springs
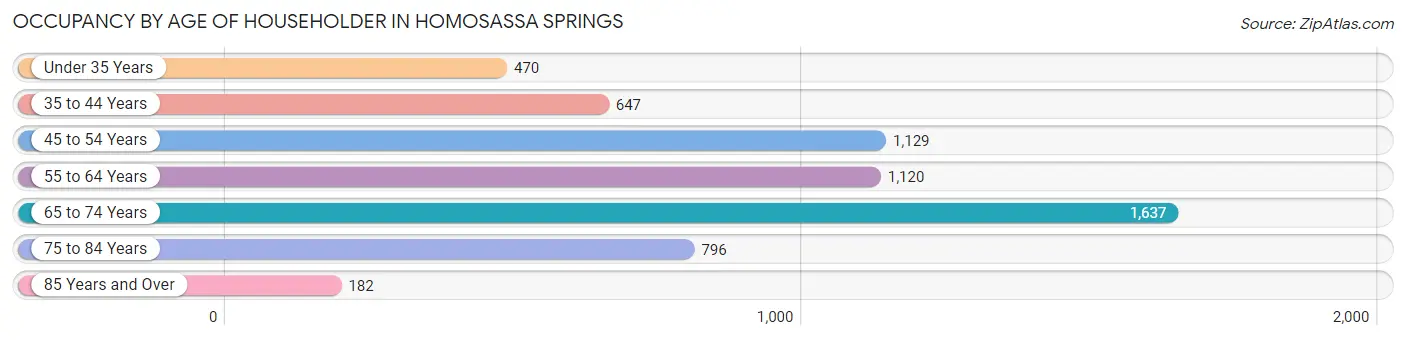
| Age Bracket | # Households | % Households |
| Under 35 Years | 470 | 7.9% |
| 35 to 44 Years | 647 | 10.8% |
| 45 to 54 Years | 1,129 | 18.9% |
| 55 to 64 Years | 1,120 | 18.7% |
| 65 to 74 Years | 1,637 | 27.4% |
| 75 to 84 Years | 796 | 13.3% |
| 85 Years and Over | 182 | 3.0% |
| Total | 5,981 | 100.0% |
Housing Finances in Homosassa Springs
Median Income by Occupancy in Homosassa Springs
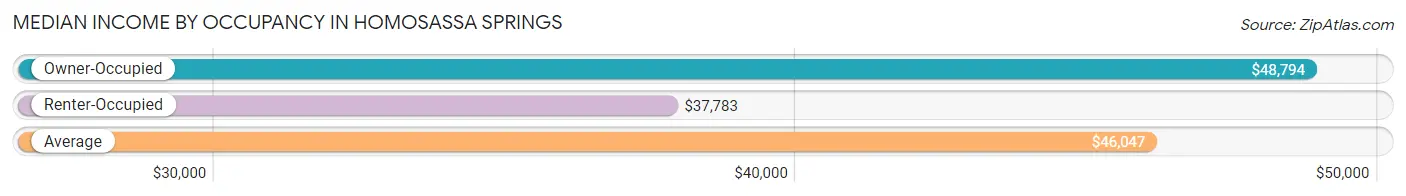
| Occupancy Type | # Households | Median Income |
| Owner-Occupied | 5,170 (86.4%) | $48,794 |
| Renter-Occupied | 811 (13.6%) | $37,783 |
| Average | 5,981 (100.0%) | $46,047 |
Occupancy by Householder Income Bracket in Homosassa Springs
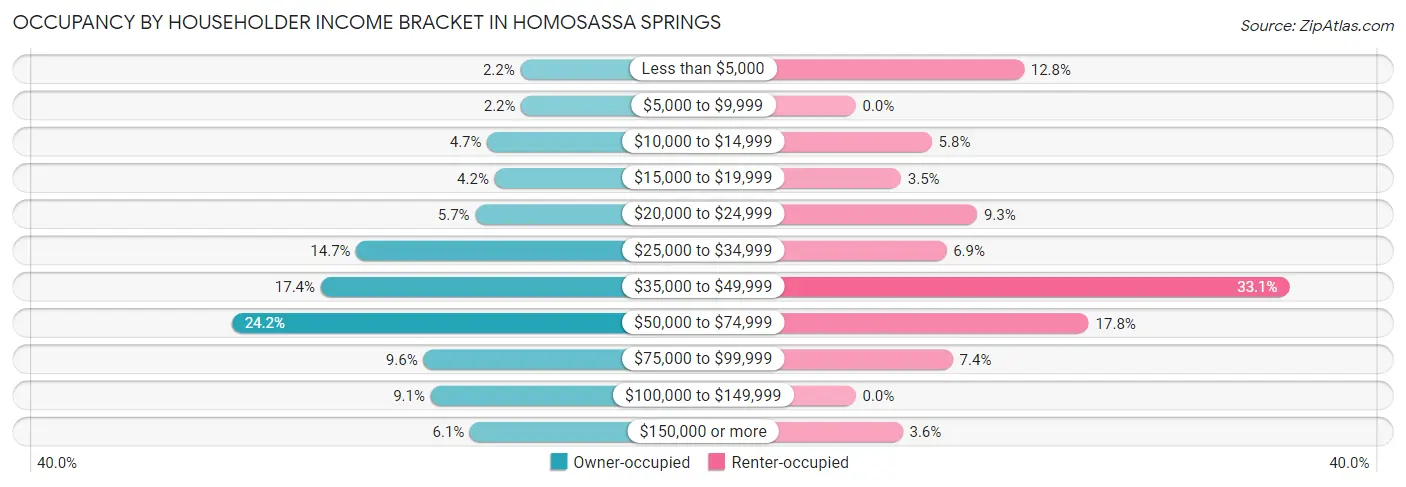
| Income Bracket | Owner-occupied | Renter-occupied |
| Less than $5,000 | 114 (2.2%) | 104 (12.8%) |
| $5,000 to $9,999 | 111 (2.1%) | 0 (0.0%) |
| $10,000 to $14,999 | 245 (4.7%) | 47 (5.8%) |
| $15,000 to $19,999 | 216 (4.2%) | 28 (3.5%) |
| $20,000 to $24,999 | 292 (5.7%) | 75 (9.2%) |
| $25,000 to $34,999 | 761 (14.7%) | 56 (6.9%) |
| $35,000 to $49,999 | 901 (17.4%) | 268 (33.1%) |
| $50,000 to $74,999 | 1,252 (24.2%) | 144 (17.8%) |
| $75,000 to $99,999 | 497 (9.6%) | 60 (7.4%) |
| $100,000 to $149,999 | 468 (9.0%) | 0 (0.0%) |
| $150,000 or more | 313 (6.0%) | 29 (3.6%) |
| Total | 5,170 (100.0%) | 811 (100.0%) |
Monthly Housing Cost Tiers in Homosassa Springs
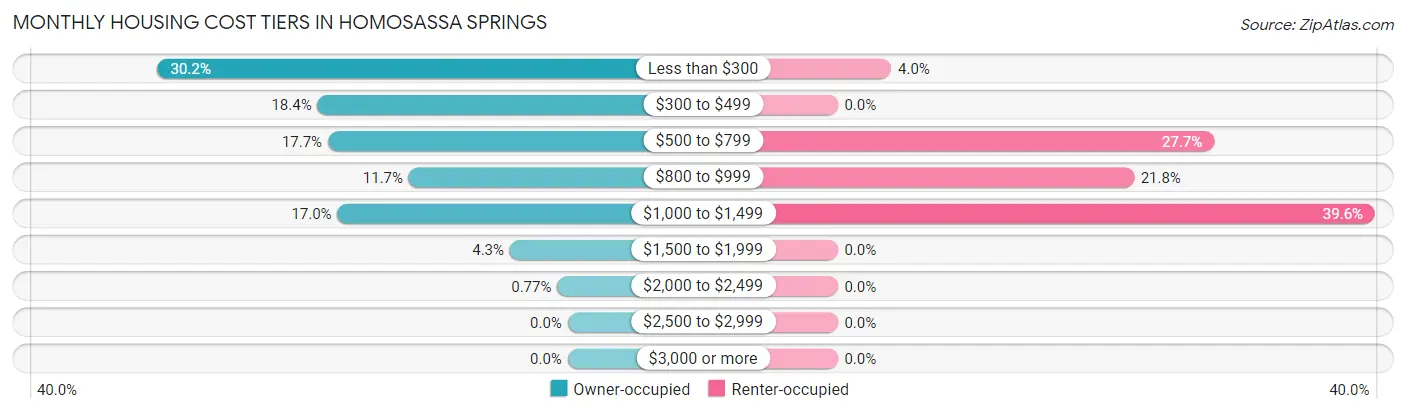
| Monthly Cost | Owner-occupied | Renter-occupied |
| Less than $300 | 1,562 (30.2%) | 32 (4.0%) |
| $300 to $499 | 953 (18.4%) | 0 (0.0%) |
| $500 to $799 | 913 (17.7%) | 225 (27.7%) |
| $800 to $999 | 605 (11.7%) | 177 (21.8%) |
| $1,000 to $1,499 | 877 (17.0%) | 321 (39.6%) |
| $1,500 to $1,999 | 220 (4.3%) | 0 (0.0%) |
| $2,000 to $2,499 | 40 (0.8%) | 0 (0.0%) |
| $2,500 to $2,999 | 0 (0.0%) | 0 (0.0%) |
| $3,000 or more | 0 (0.0%) | 0 (0.0%) |
| Total | 5,170 (100.0%) | 811 (100.0%) |
Physical Housing Characteristics in Homosassa Springs
Housing Structures in Homosassa Springs
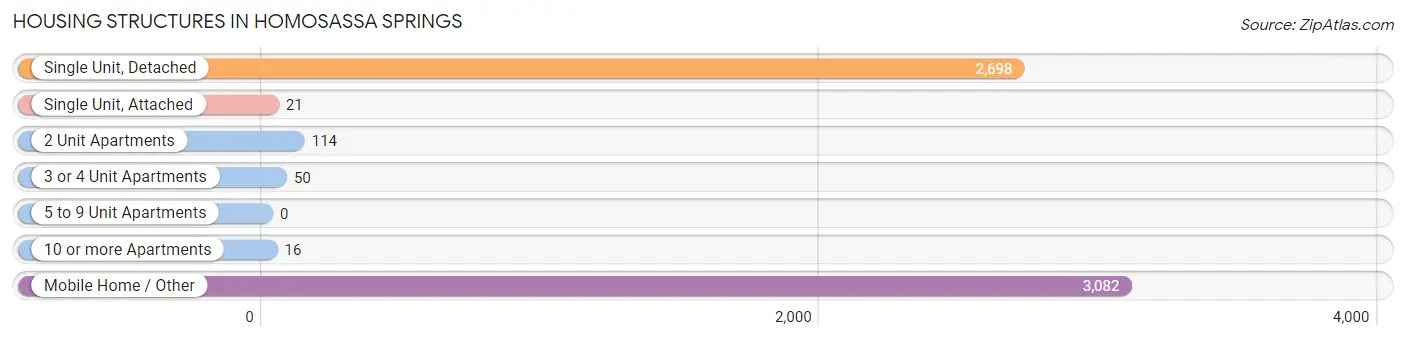
| Structure Type | # Housing Units | % Housing Units |
| Single Unit, Detached | 2,698 | 45.1% |
| Single Unit, Attached | 21 | 0.4% |
| 2 Unit Apartments | 114 | 1.9% |
| 3 or 4 Unit Apartments | 50 | 0.8% |
| 5 to 9 Unit Apartments | 0 | 0.0% |
| 10 or more Apartments | 16 | 0.3% |
| Mobile Home / Other | 3,082 | 51.5% |
| Total | 5,981 | 100.0% |
Housing Structures by Occupancy in Homosassa Springs
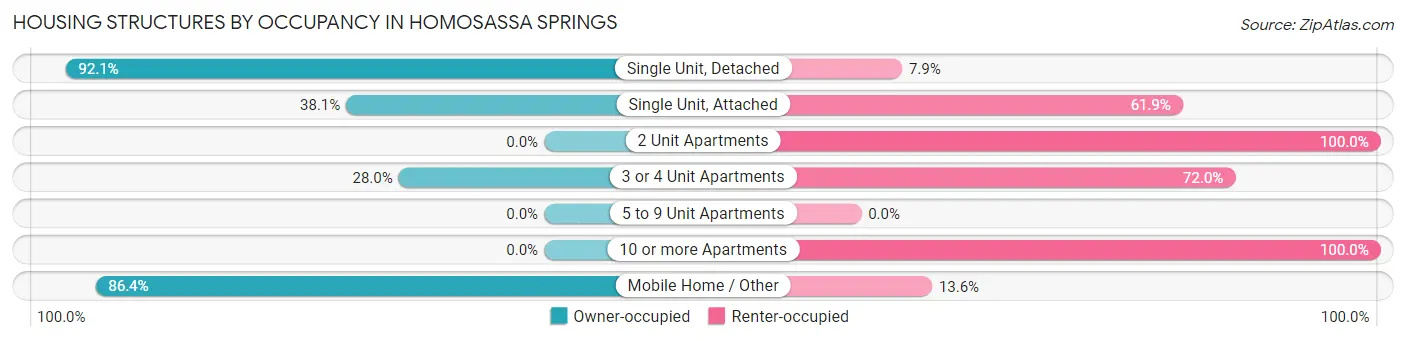
| Structure Type | Owner-occupied | Renter-occupied |
| Single Unit, Detached | 2,486 (92.1%) | 212 (7.9%) |
| Single Unit, Attached | 8 (38.1%) | 13 (61.9%) |
| 2 Unit Apartments | 0 (0.0%) | 114 (100.0%) |
| 3 or 4 Unit Apartments | 14 (28.0%) | 36 (72.0%) |
| 5 to 9 Unit Apartments | 0 (0.0%) | 0 (0.0%) |
| 10 or more Apartments | 0 (0.0%) | 16 (100.0%) |
| Mobile Home / Other | 2,662 (86.4%) | 420 (13.6%) |
| Total | 5,170 (86.4%) | 811 (13.6%) |
Housing Structures by Number of Rooms in Homosassa Springs
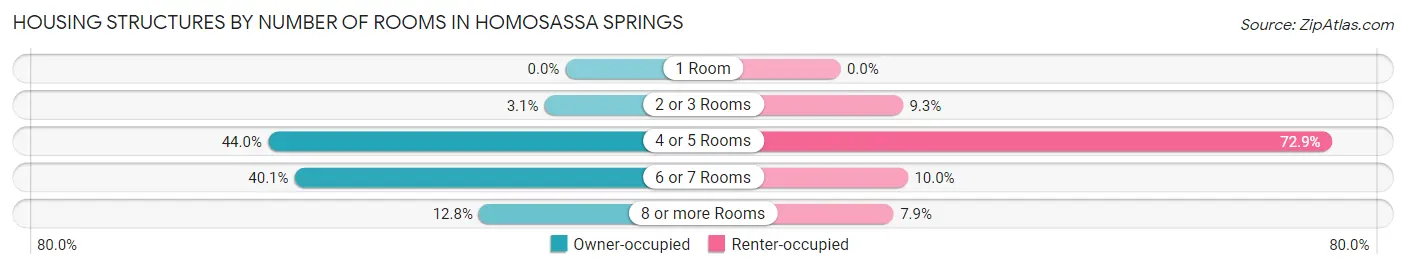
| Number of Rooms | Owner-occupied | Renter-occupied |
| 1 Room | 0 (0.0%) | 0 (0.0%) |
| 2 or 3 Rooms | 160 (3.1%) | 75 (9.2%) |
| 4 or 5 Rooms | 2,276 (44.0%) | 591 (72.9%) |
| 6 or 7 Rooms | 2,072 (40.1%) | 81 (10.0%) |
| 8 or more Rooms | 662 (12.8%) | 64 (7.9%) |
| Total | 5,170 (100.0%) | 811 (100.0%) |
Housing Structure by Heating Type in Homosassa Springs
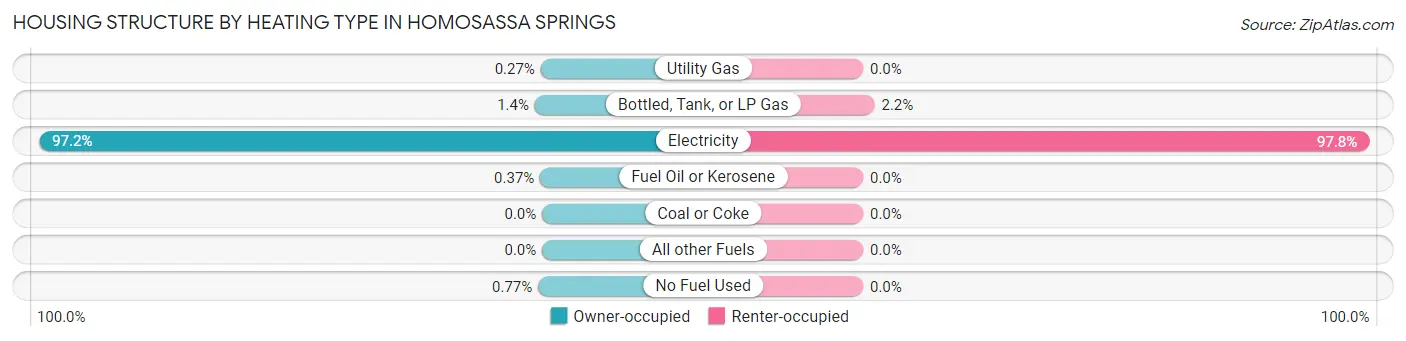
| Heating Type | Owner-occupied | Renter-occupied |
| Utility Gas | 14 (0.3%) | 0 (0.0%) |
| Bottled, Tank, or LP Gas | 73 (1.4%) | 18 (2.2%) |
| Electricity | 5,024 (97.2%) | 793 (97.8%) |
| Fuel Oil or Kerosene | 19 (0.4%) | 0 (0.0%) |
| Coal or Coke | 0 (0.0%) | 0 (0.0%) |
| All other Fuels | 0 (0.0%) | 0 (0.0%) |
| No Fuel Used | 40 (0.8%) | 0 (0.0%) |
| Total | 5,170 (100.0%) | 811 (100.0%) |
Household Vehicle Usage in Homosassa Springs
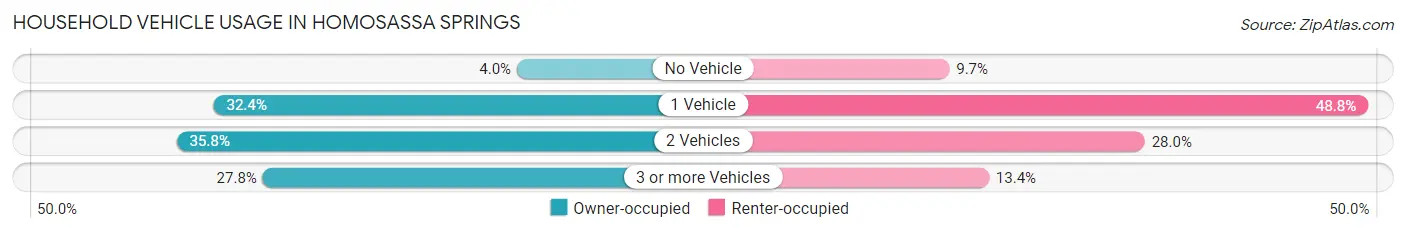
| Vehicles per Household | Owner-occupied | Renter-occupied |
| No Vehicle | 209 (4.0%) | 79 (9.7%) |
| 1 Vehicle | 1,673 (32.4%) | 396 (48.8%) |
| 2 Vehicles | 1,852 (35.8%) | 227 (28.0%) |
| 3 or more Vehicles | 1,436 (27.8%) | 109 (13.4%) |
| Total | 5,170 (100.0%) | 811 (100.0%) |
Real Estate & Mortgages in Homosassa Springs
Real Estate and Mortgage Overview in Homosassa Springs
| Characteristic | Without Mortgage | With Mortgage |
| Housing Units | 3,041 | 2,129 |
| Median Property Value | $104,100 | $139,700 |
| Median Household Income | $41,368 | $267 |
| Monthly Housing Costs | $294 | $0 |
| Real Estate Taxes | $558 | $135 |
Property Value by Mortgage Status in Homosassa Springs
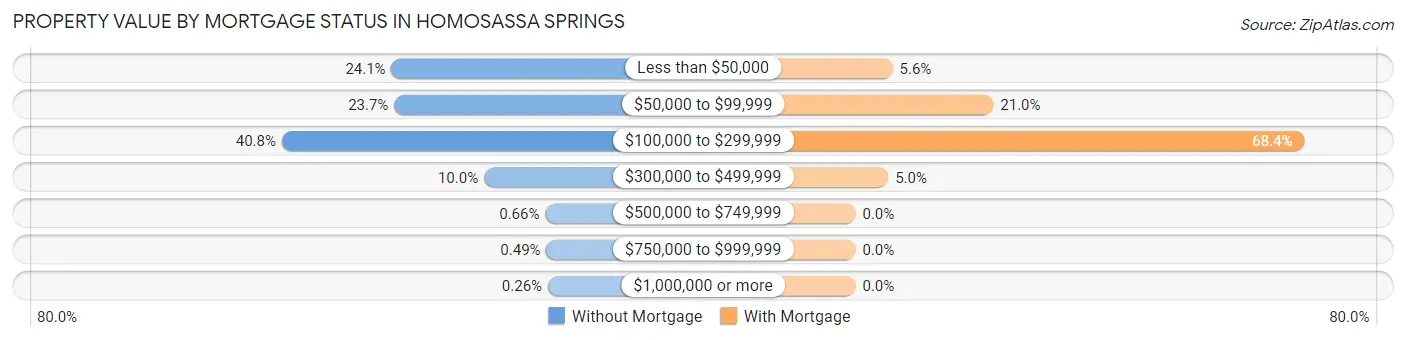
| Property Value | Without Mortgage | With Mortgage |
| Less than $50,000 | 733 (24.1%) | 120 (5.6%) |
| $50,000 to $99,999 | 720 (23.7%) | 447 (21.0%) |
| $100,000 to $299,999 | 1,241 (40.8%) | 1,456 (68.4%) |
| $300,000 to $499,999 | 304 (10.0%) | 106 (5.0%) |
| $500,000 to $749,999 | 20 (0.7%) | 0 (0.0%) |
| $750,000 to $999,999 | 15 (0.5%) | 0 (0.0%) |
| $1,000,000 or more | 8 (0.3%) | 0 (0.0%) |
| Total | 3,041 (100.0%) | 2,129 (100.0%) |
Household Income by Mortgage Status in Homosassa Springs
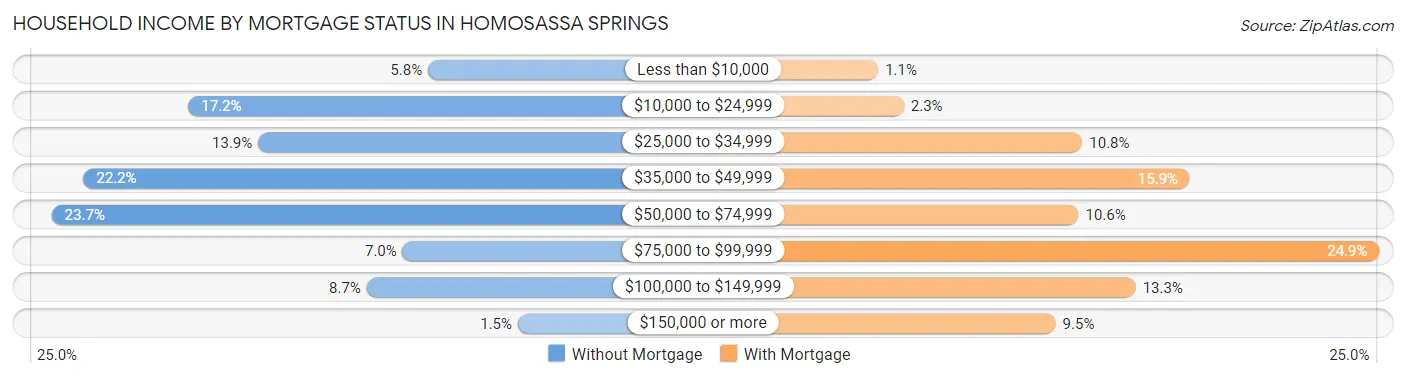
| Household Income | Without Mortgage | With Mortgage |
| Less than $10,000 | 176 (5.8%) | 23 (1.1%) |
| $10,000 to $24,999 | 523 (17.2%) | 49 (2.3%) |
| $25,000 to $34,999 | 422 (13.9%) | 230 (10.8%) |
| $35,000 to $49,999 | 675 (22.2%) | 339 (15.9%) |
| $50,000 to $74,999 | 721 (23.7%) | 226 (10.6%) |
| $75,000 to $99,999 | 213 (7.0%) | 531 (24.9%) |
| $100,000 to $149,999 | 265 (8.7%) | 284 (13.3%) |
| $150,000 or more | 46 (1.5%) | 203 (9.5%) |
| Total | 3,041 (100.0%) | 2,129 (100.0%) |
Property Value to Household Income Ratio in Homosassa Springs
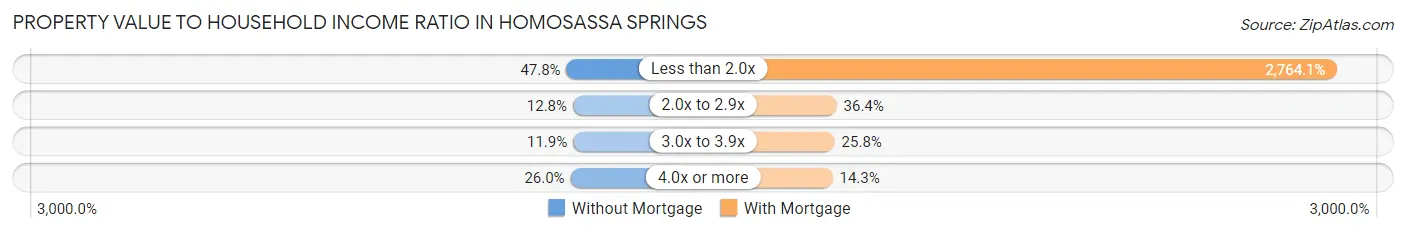
| Value-to-Income Ratio | Without Mortgage | With Mortgage |
| Less than 2.0x | 1,453 (47.8%) | 58,847 (2,764.1%) |
| 2.0x to 2.9x | 390 (12.8%) | 775 (36.4%) |
| 3.0x to 3.9x | 362 (11.9%) | 549 (25.8%) |
| 4.0x or more | 791 (26.0%) | 305 (14.3%) |
| Total | 3,041 (100.0%) | 2,129 (100.0%) |
Real Estate Taxes by Mortgage Status in Homosassa Springs
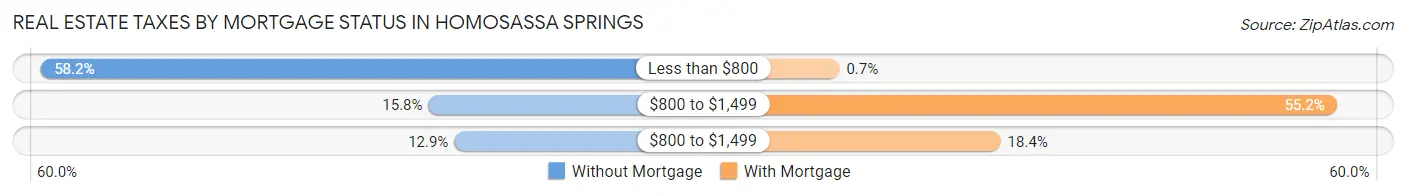
| Property Taxes | Without Mortgage | With Mortgage |
| Less than $800 | 1,769 (58.2%) | 15 (0.7%) |
| $800 to $1,499 | 479 (15.8%) | 1,175 (55.2%) |
| $800 to $1,499 | 393 (12.9%) | 391 (18.4%) |
| Total | 3,041 (100.0%) | 2,129 (100.0%) |
Health & Disability in Homosassa Springs
Health Insurance Coverage by Age in Homosassa Springs
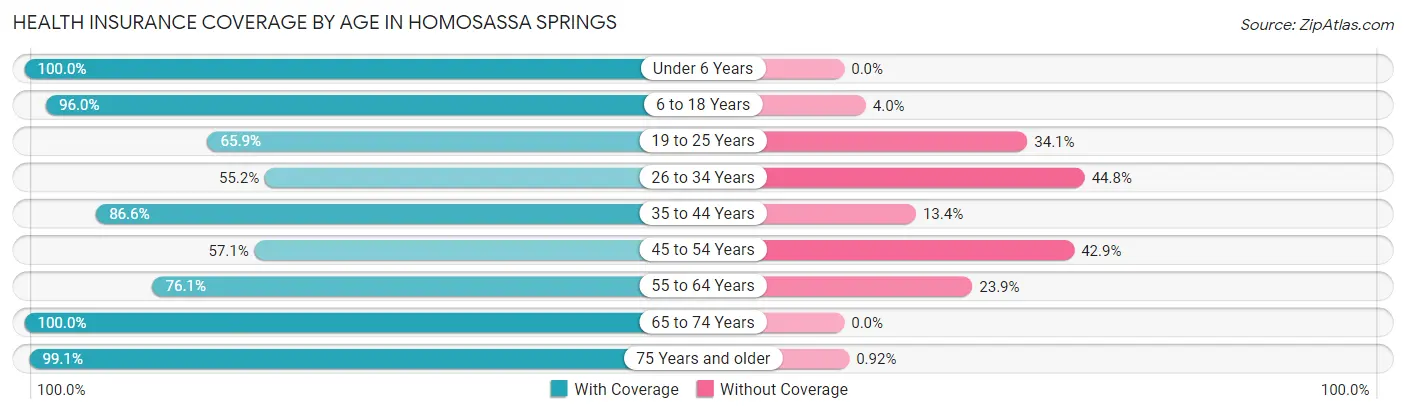
| Age Bracket | With Coverage | Without Coverage |
| Under 6 Years | 879 (100.0%) | 0 (0.0%) |
| 6 to 18 Years | 1,744 (96.0%) | 73 (4.0%) |
| 19 to 25 Years | 654 (65.9%) | 339 (34.1%) |
| 26 to 34 Years | 786 (55.2%) | 639 (44.8%) |
| 35 to 44 Years | 907 (86.6%) | 140 (13.4%) |
| 45 to 54 Years | 1,424 (57.1%) | 1,069 (42.9%) |
| 55 to 64 Years | 1,865 (76.1%) | 585 (23.9%) |
| 65 to 74 Years | 2,595 (100.0%) | 0 (0.0%) |
| 75 Years and older | 1,621 (99.1%) | 15 (0.9%) |
| Total | 12,475 (81.4%) | 2,860 (18.6%) |
Health Insurance Coverage by Citizenship Status in Homosassa Springs
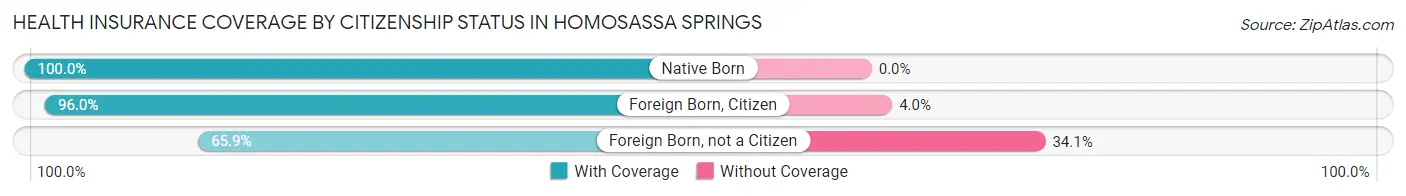
| Citizenship Status | With Coverage | Without Coverage |
| Native Born | 879 (100.0%) | 0 (0.0%) |
| Foreign Born, Citizen | 1,744 (96.0%) | 73 (4.0%) |
| Foreign Born, not a Citizen | 654 (65.9%) | 339 (34.1%) |
Health Insurance Coverage by Household Income in Homosassa Springs
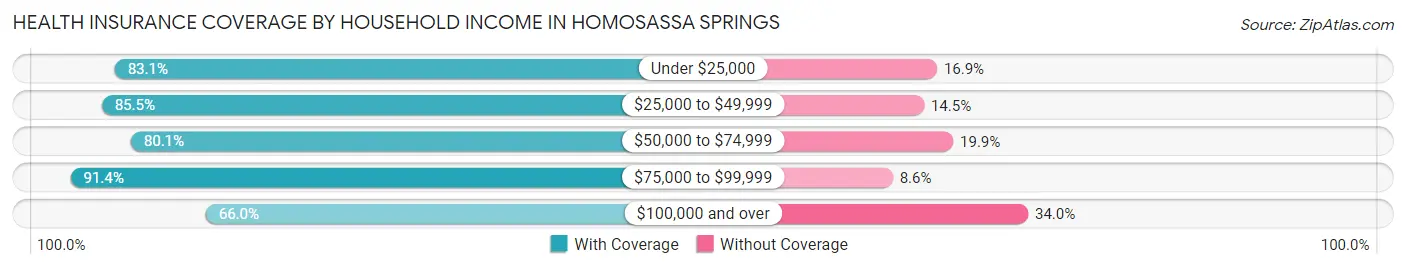
| Household Income | With Coverage | Without Coverage |
| Under $25,000 | 1,954 (83.1%) | 397 (16.9%) |
| $25,000 to $49,999 | 3,927 (85.5%) | 664 (14.5%) |
| $50,000 to $74,999 | 2,887 (80.1%) | 718 (19.9%) |
| $75,000 to $99,999 | 1,953 (91.4%) | 184 (8.6%) |
| $100,000 and over | 1,735 (66.0%) | 892 (34.0%) |
Public vs Private Health Insurance Coverage by Age in Homosassa Springs
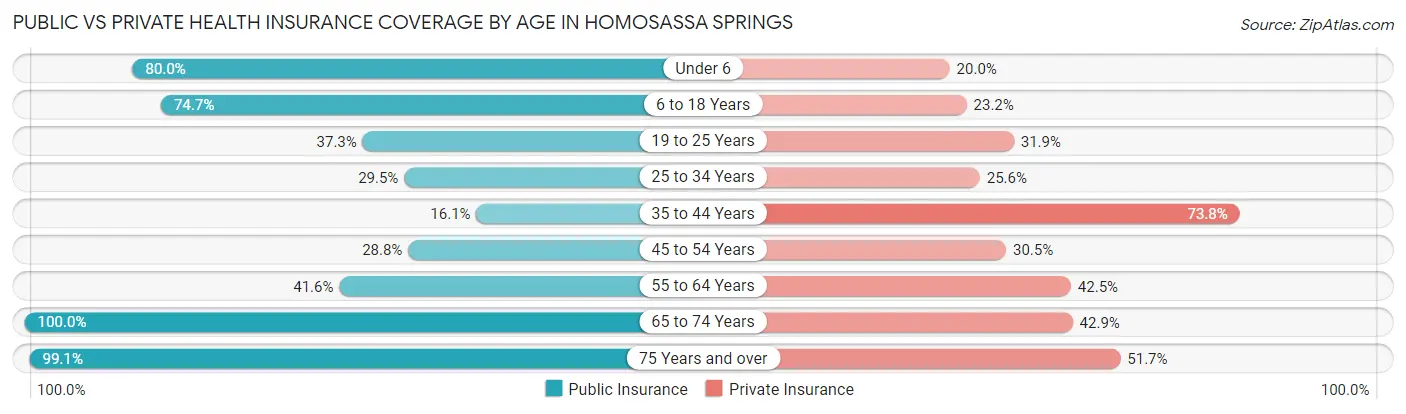
| Age Bracket | Public Insurance | Private Insurance |
| Under 6 | 703 (80.0%) | 176 (20.0%) |
| 6 to 18 Years | 1,357 (74.7%) | 421 (23.2%) |
| 19 to 25 Years | 370 (37.3%) | 317 (31.9%) |
| 25 to 34 Years | 421 (29.5%) | 365 (25.6%) |
| 35 to 44 Years | 169 (16.1%) | 773 (73.8%) |
| 45 to 54 Years | 718 (28.8%) | 760 (30.5%) |
| 55 to 64 Years | 1,019 (41.6%) | 1,042 (42.5%) |
| 65 to 74 Years | 2,595 (100.0%) | 1,112 (42.8%) |
| 75 Years and over | 1,621 (99.1%) | 846 (51.7%) |
| Total | 8,973 (58.5%) | 5,812 (37.9%) |
Disability Status by Sex by Age in Homosassa Springs
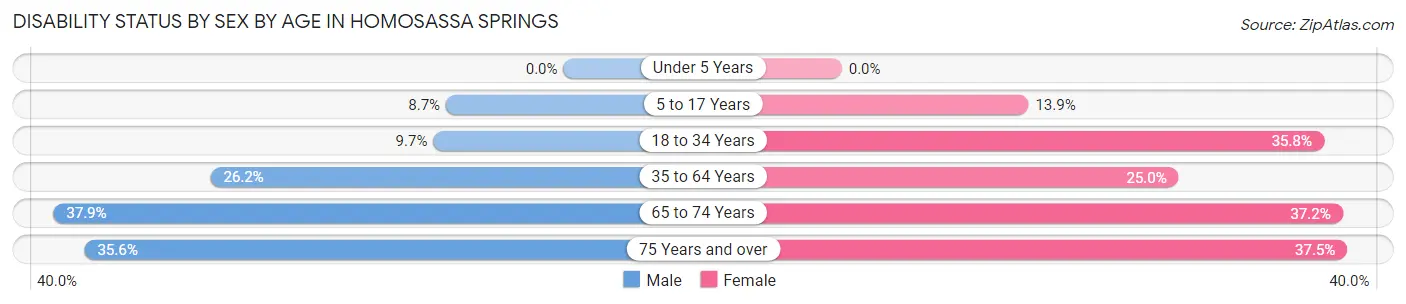
| Age Bracket | Male | Female |
| Under 5 Years | 0 (0.0%) | 0 (0.0%) |
| 5 to 17 Years | 94 (8.7%) | 93 (13.9%) |
| 18 to 34 Years | 115 (9.7%) | 493 (35.8%) |
| 35 to 64 Years | 798 (26.2%) | 736 (25.0%) |
| 65 to 74 Years | 413 (37.9%) | 559 (37.2%) |
| 75 Years and over | 321 (35.5%) | 275 (37.5%) |
Disability Class by Sex by Age in Homosassa Springs
Disability Class: Hearing Difficulty
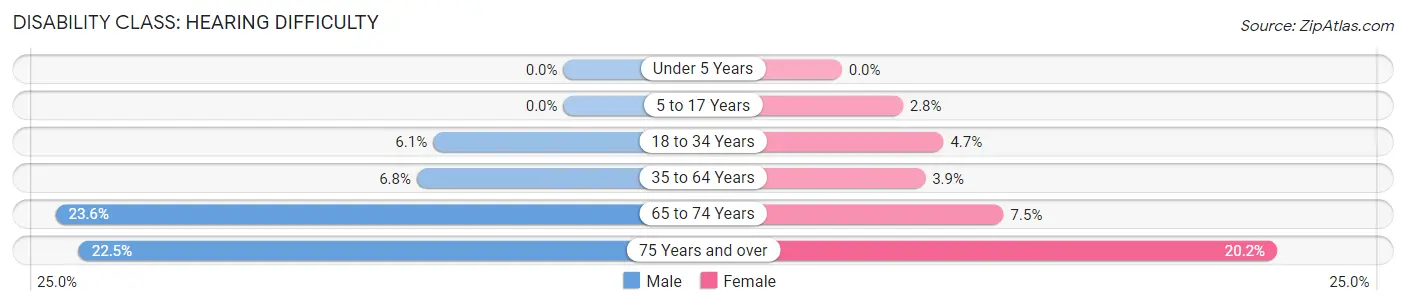
| Age Bracket | Male | Female |
| Under 5 Years | 0 (0.0%) | 0 (0.0%) |
| 5 to 17 Years | 0 (0.0%) | 19 (2.8%) |
| 18 to 34 Years | 72 (6.0%) | 65 (4.7%) |
| 35 to 64 Years | 207 (6.8%) | 114 (3.9%) |
| 65 to 74 Years | 257 (23.6%) | 113 (7.5%) |
| 75 Years and over | 203 (22.5%) | 148 (20.2%) |
Disability Class: Vision Difficulty
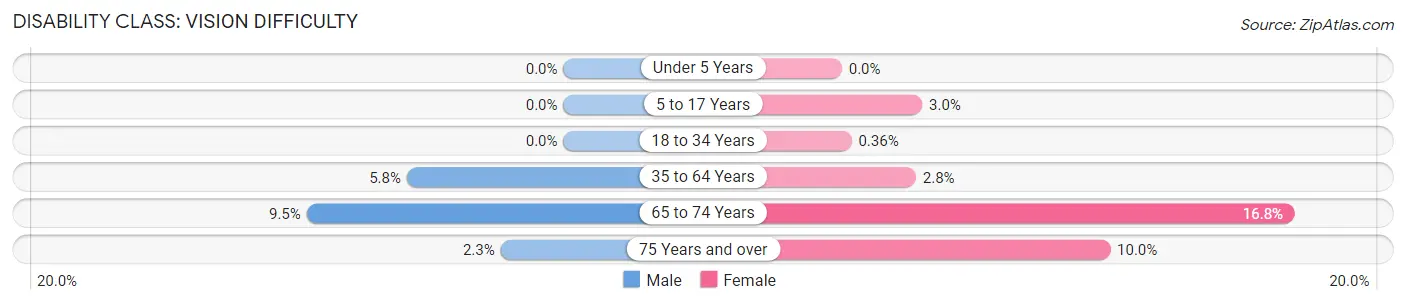
| Age Bracket | Male | Female |
| Under 5 Years | 0 (0.0%) | 0 (0.0%) |
| 5 to 17 Years | 0 (0.0%) | 20 (3.0%) |
| 18 to 34 Years | 0 (0.0%) | 5 (0.4%) |
| 35 to 64 Years | 177 (5.8%) | 81 (2.8%) |
| 65 to 74 Years | 104 (9.5%) | 253 (16.8%) |
| 75 Years and over | 21 (2.3%) | 73 (10.0%) |
Disability Class: Cognitive Difficulty
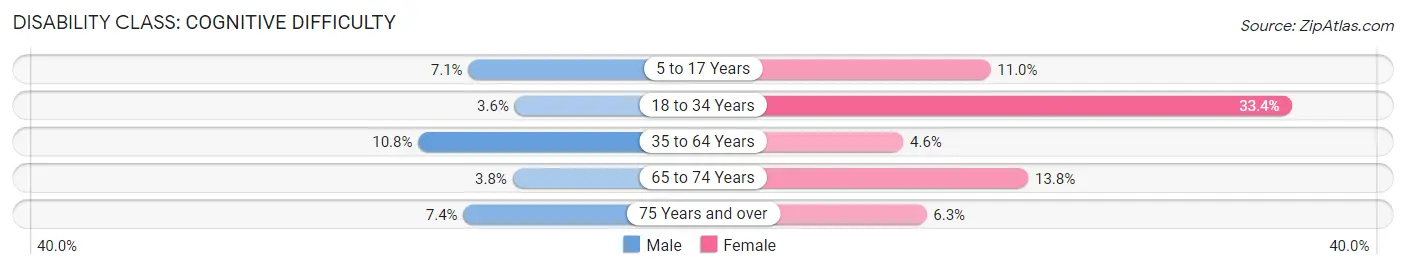
| Age Bracket | Male | Female |
| 5 to 17 Years | 76 (7.0%) | 74 (11.0%) |
| 18 to 34 Years | 43 (3.6%) | 460 (33.4%) |
| 35 to 64 Years | 328 (10.8%) | 134 (4.5%) |
| 65 to 74 Years | 41 (3.8%) | 208 (13.8%) |
| 75 Years and over | 67 (7.4%) | 46 (6.3%) |
Disability Class: Ambulatory Difficulty
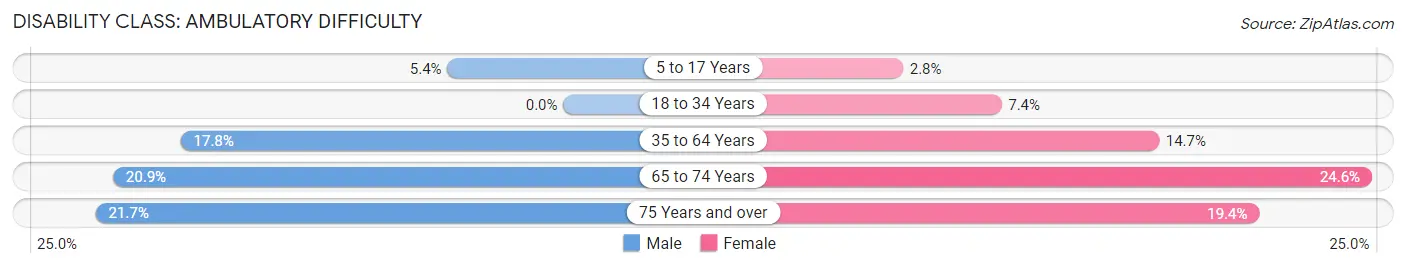
| Age Bracket | Male | Female |
| 5 to 17 Years | 58 (5.4%) | 19 (2.8%) |
| 18 to 34 Years | 0 (0.0%) | 102 (7.4%) |
| 35 to 64 Years | 541 (17.8%) | 433 (14.7%) |
| 65 to 74 Years | 228 (20.9%) | 370 (24.6%) |
| 75 Years and over | 196 (21.7%) | 142 (19.4%) |
Disability Class: Self-Care Difficulty
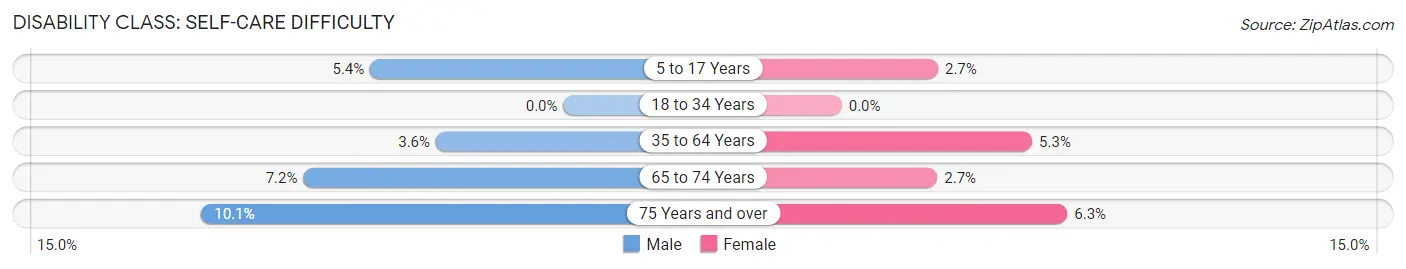
| Age Bracket | Male | Female |
| 5 to 17 Years | 58 (5.4%) | 18 (2.7%) |
| 18 to 34 Years | 0 (0.0%) | 0 (0.0%) |
| 35 to 64 Years | 108 (3.5%) | 156 (5.3%) |
| 65 to 74 Years | 79 (7.2%) | 40 (2.7%) |
| 75 Years and over | 91 (10.1%) | 46 (6.3%) |
Technology Access in Homosassa Springs
Computing Device Access in Homosassa Springs
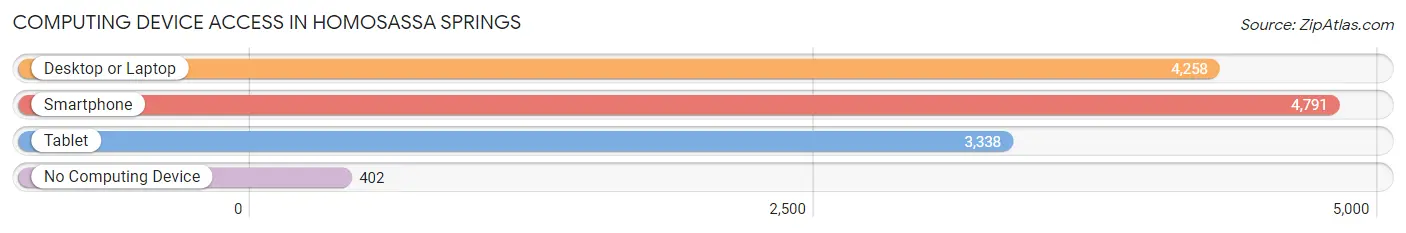
| Device Type | # Households | % Households |
| Desktop or Laptop | 4,258 | 71.2% |
| Smartphone | 4,791 | 80.1% |
| Tablet | 3,338 | 55.8% |
| No Computing Device | 402 | 6.7% |
| Total | 5,981 | 100.0% |
Internet Access in Homosassa Springs
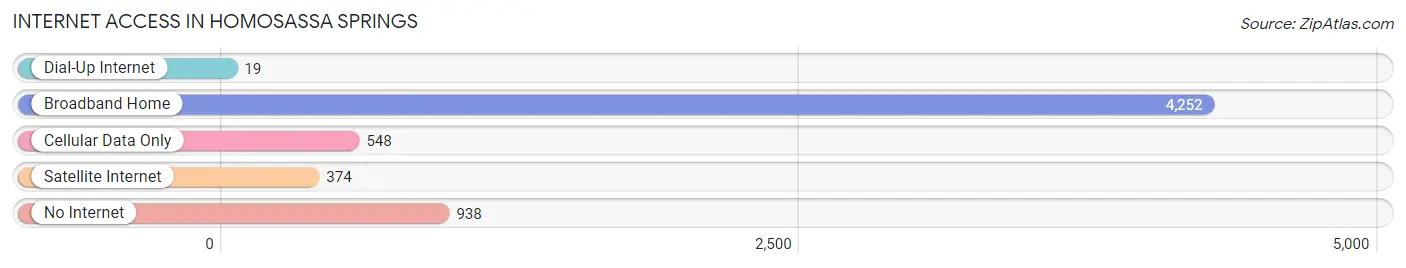
| Internet Type | # Households | % Households |
| Dial-Up Internet | 19 | 0.3% |
| Broadband Home | 4,252 | 71.1% |
| Cellular Data Only | 548 | 9.2% |
| Satellite Internet | 374 | 6.2% |
| No Internet | 938 | 15.7% |
| Total | 5,981 | 100.0% |
Homosassa Springs Summary
Homosassa Springs is a small city located in Citrus County, Florida. It is situated on the Homosassa River, which is part of the Gulf of Mexico. The city is known for its natural springs, which attract tourists and locals alike. The city has a population of approximately 3,000 people and is part of the Nature Coast region of Florida.
Geography
Homosassa Springs is located in the Nature Coast region of Florida, which is known for its natural beauty and abundant wildlife. The city is situated on the Homosassa River, which is part of the Gulf of Mexico. The city is surrounded by the Chassahowitzka National Wildlife Refuge, which is home to a variety of wildlife, including manatees, alligators, and birds. The city is also close to the Homosassa Springs Wildlife State Park, which is home to a variety of native and exotic animals.
The city has a humid subtropical climate, with hot and humid summers and mild winters. The average temperature in the summer is around 90 degrees Fahrenheit, and the average temperature in the winter is around 60 degrees Fahrenheit. The city receives an average of 54 inches of rain per year.
History
Homosassa Springs was first settled in the late 19th century by settlers from the nearby town of Homosassa. The settlers were attracted to the area by the natural springs, which were believed to have healing properties. The city was incorporated in 1887 and was named after the nearby Homosassa River.
The city grew slowly over the years, and by the early 20th century, it had become a popular tourist destination. The city was home to a variety of attractions, including a zoo, a casino, and a hotel. The city also had a thriving fishing industry, which attracted many visitors.
In the late 20th century, the city began to decline as tourism decreased and the fishing industry declined. The city was also affected by the Great Recession of 2008, which caused many businesses to close.
Economy
The economy of Homosassa Springs is largely based on tourism and fishing. The city is home to a variety of attractions, including the Homosassa Springs Wildlife State Park, which attracts visitors from all over the world. The city is also home to a variety of fishing charters, which offer visitors the chance to catch a variety of fish, including redfish, snook, and tarpon.
The city is also home to a variety of businesses, including restaurants, shops, and hotels. The city is also home to a variety of manufacturing companies, which produce a variety of products, including furniture, clothing, and electronics.
Demographics
As of the 2010 census, the population of Homosassa Springs was 3,006. The population is predominantly white, with a small percentage of African Americans and Hispanics. The median household income is $37,000, and the median age is 44.
Conclusion
Homosassa Springs is a small city located in Citrus County, Florida. It is situated on the Homosassa River, which is part of the Gulf of Mexico. The city is known for its natural springs, which attract tourists and locals alike. The city has a population of approximately 3,000 people and is part of the Nature Coast region of Florida. The economy of the city is largely based on tourism and fishing, and the city is home to a variety of attractions, businesses, and manufacturing companies. The population is predominantly white, with a small percentage of African Americans and Hispanics.
Common Questions
What is Per Capita Income in Homosassa Springs?
Per Capita income in Homosassa Springs is $24,897.
What is the Median Family Income in Homosassa Springs?
Median Family Income in Homosassa Springs is $51,915.
What is the Median Household income in Homosassa Springs?
Median Household Income in Homosassa Springs is $46,047.
What is Income or Wage Gap in Homosassa Springs?
Income or Wage Gap in Homosassa Springs is 0.5%.
Women in Homosassa Springs earn 99.5 cents for every dollar earned by a man.
What is Family Income Deficit in Homosassa Springs?
Family Income Deficit in Homosassa Springs is $7,886.
Families that are below poverty line in Homosassa Springs earn $7,886 less on average than the poverty threshold level.
What is Inequality or Gini Index in Homosassa Springs?
Inequality or Gini Index in Homosassa Springs is 0.43.
What is the Total Population of Homosassa Springs?
Total Population of Homosassa Springs is 15,365.
What is the Total Male Population of Homosassa Springs?
Total Male Population of Homosassa Springs is 7,846.
What is the Total Female Population of Homosassa Springs?
Total Female Population of Homosassa Springs is 7,519.
What is the Ratio of Males per 100 Females in Homosassa Springs?
There are 104.35 Males per 100 Females in Homosassa Springs.
What is the Ratio of Females per 100 Males in Homosassa Springs?
There are 95.83 Females per 100 Males in Homosassa Springs.
What is the Median Population Age in Homosassa Springs?
Median Population Age in Homosassa Springs is 51.0 Years.
What is the Average Family Size in Homosassa Springs
Average Family Size in Homosassa Springs is 3.0 People.
What is the Average Household Size in Homosassa Springs
Average Household Size in Homosassa Springs is 2.6 People.
How Large is the Labor Force in Homosassa Springs?
There are 5,360 People in the Labor Forcein in Homosassa Springs.
What is the Percentage of People in the Labor Force in Homosassa Springs?
40.7% of People are in the Labor Force in Homosassa Springs.
What is the Unemployment Rate in Homosassa Springs?
Unemployment Rate in Homosassa Springs is 8.8%.