St Lucie Village, FL Map & Demographics
St Lucie Village Map
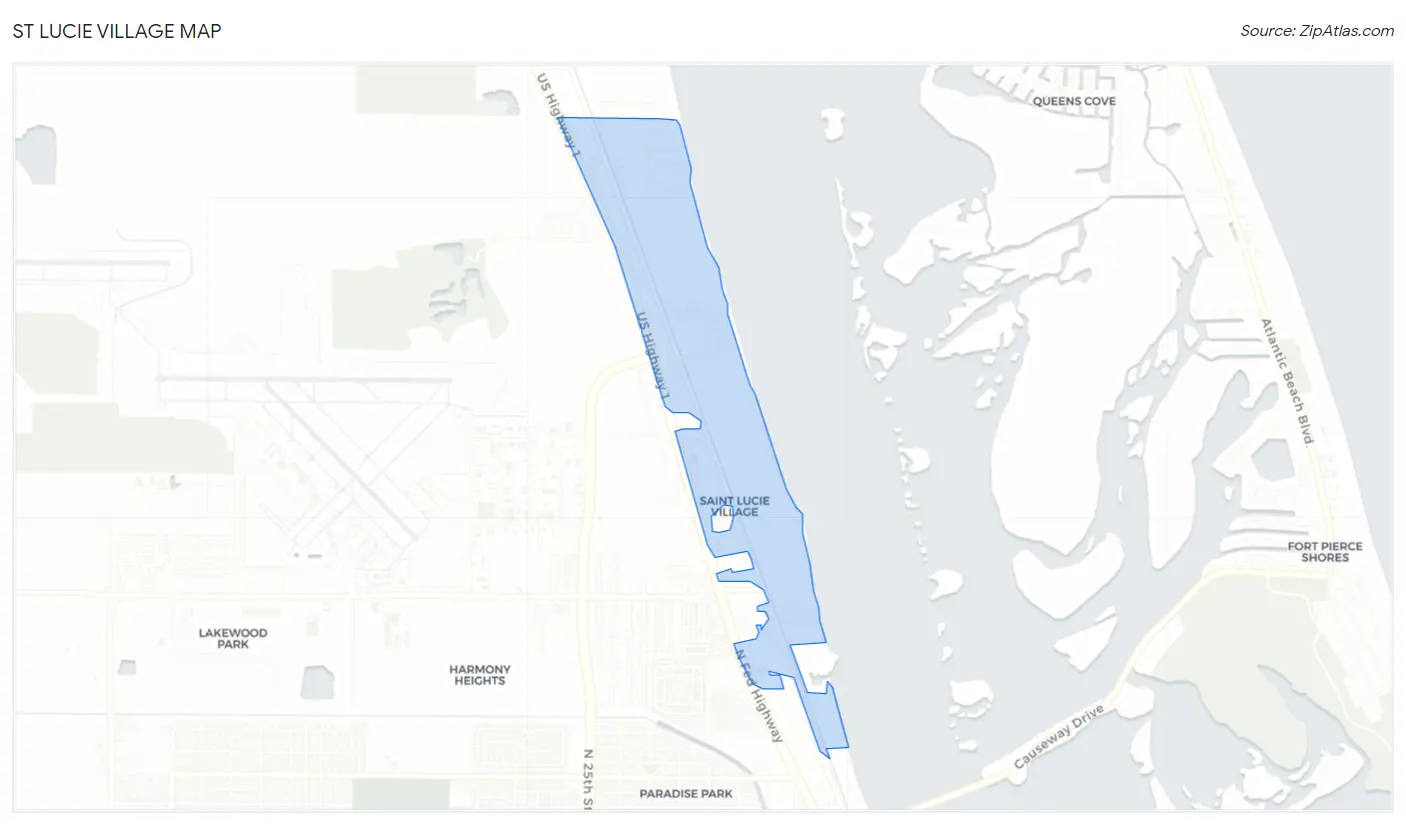
St Lucie Village Overview
$44,324
PER CAPITA INCOME
$90,000
AVG FAMILY INCOME
$74,167
AVG HOUSEHOLD INCOME
28.3%
WAGE / INCOME GAP [ % ]
71.7¢/ $1
WAGE / INCOME GAP [ $ ]
0.52
INEQUALITY / GINI INDEX
838
TOTAL POPULATION
432
MALE POPULATION
406
FEMALE POPULATION
106.40
MALES / 100 FEMALES
93.98
FEMALES / 100 MALES
48.7
MEDIAN AGE
3.1
AVG FAMILY SIZE
2.8
AVG HOUSEHOLD SIZE
366
LABOR FORCE [ PEOPLE ]
54.5%
PERCENT IN LABOR FORCE
3.0%
UNEMPLOYMENT RATE
St Lucie Village Area Codes
Income in St Lucie Village
Income Overview in St Lucie Village
Per Capita Income in St Lucie Village is $44,324, while median incomes of families and households are $90,000 and $74,167 respectively.
| Characteristic | Number | Measure |
| Per Capita Income | 838 | $44,324 |
| Median Family Income | 216 | $90,000 |
| Mean Family Income | 216 | $142,980 |
| Median Household Income | 300 | $74,167 |
| Mean Household Income | 300 | $123,342 |
| Income Deficit | 216 | $0 |
| Wage / Income Gap (%) | 838 | 28.32% |
| Wage / Income Gap ($) | 838 | 71.68¢ per $1 |
| Gini / Inequality Index | 838 | 0.52 |
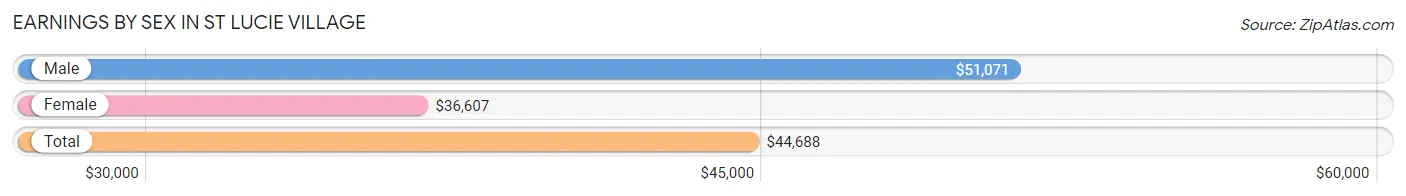
Earnings by Sex in St Lucie Village
Average Earnings in St Lucie Village are $44,688, $51,071 for men and $36,607 for women, a difference of 28.3%.
| Sex | Number | Average Earnings |
| Male | 196 (51.3%) | $51,071 |
| Female | 186 (48.7%) | $36,607 |
| Total | 382 (100.0%) | $44,688 |
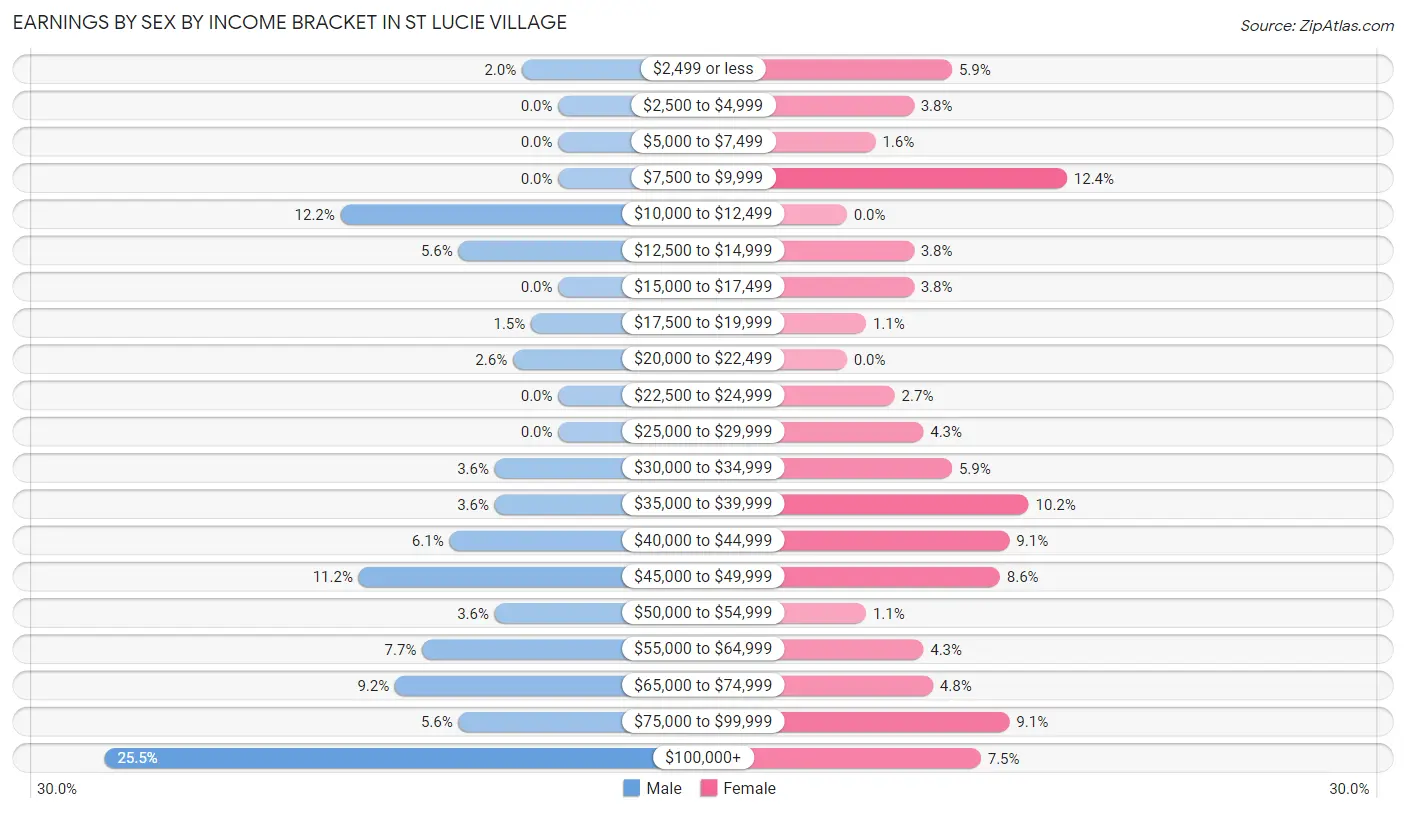
Earnings by Sex by Income Bracket in St Lucie Village
The most common earnings brackets in St Lucie Village are $100,000+ for men (50 | 25.5%) and $7,500 to $9,999 for women (23 | 12.4%).
| Income | Male | Female |
| $2,499 or less | 4 (2.0%) | 11 (5.9%) |
| $2,500 to $4,999 | 0 (0.0%) | 7 (3.8%) |
| $5,000 to $7,499 | 0 (0.0%) | 3 (1.6%) |
| $7,500 to $9,999 | 0 (0.0%) | 23 (12.4%) |
| $10,000 to $12,499 | 24 (12.2%) | 0 (0.0%) |
| $12,500 to $14,999 | 11 (5.6%) | 7 (3.8%) |
| $15,000 to $17,499 | 0 (0.0%) | 7 (3.8%) |
| $17,500 to $19,999 | 3 (1.5%) | 2 (1.1%) |
| $20,000 to $22,499 | 5 (2.5%) | 0 (0.0%) |
| $22,500 to $24,999 | 0 (0.0%) | 5 (2.7%) |
| $25,000 to $29,999 | 0 (0.0%) | 8 (4.3%) |
| $30,000 to $34,999 | 7 (3.6%) | 11 (5.9%) |
| $35,000 to $39,999 | 7 (3.6%) | 19 (10.2%) |
| $40,000 to $44,999 | 12 (6.1%) | 17 (9.1%) |
| $45,000 to $49,999 | 22 (11.2%) | 16 (8.6%) |
| $50,000 to $54,999 | 7 (3.6%) | 2 (1.1%) |
| $55,000 to $64,999 | 15 (7.6%) | 8 (4.3%) |
| $65,000 to $74,999 | 18 (9.2%) | 9 (4.8%) |
| $75,000 to $99,999 | 11 (5.6%) | 17 (9.1%) |
| $100,000+ | 50 (25.5%) | 14 (7.5%) |
| Total | 196 (100.0%) | 186 (100.0%) |
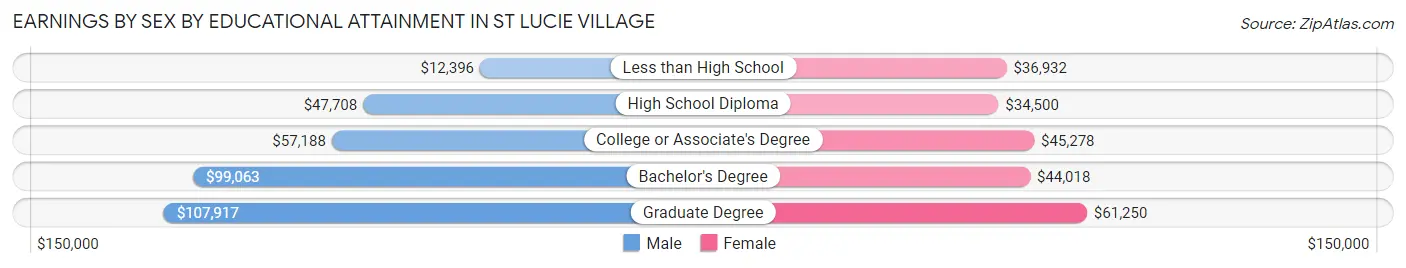
Earnings by Sex by Educational Attainment in St Lucie Village
Average earnings in St Lucie Village are $51,964 for men and $43,571 for women, a difference of 16.2%. Men with an educational attainment of graduate degree enjoy the highest average annual earnings of $107,917, while those with less than high school education earn the least with $12,396. Women with an educational attainment of graduate degree earn the most with the average annual earnings of $61,250, while those with high school diploma education have the smallest earnings of $34,500.
| Educational Attainment | Male Income | Female Income |
| Less than High School | $12,396 | $36,932 |
| High School Diploma | $47,708 | $34,500 |
| College or Associate's Degree | $57,188 | $45,278 |
| Bachelor's Degree | $99,063 | $44,018 |
| Graduate Degree | $107,917 | $61,250 |
| Total | $51,964 | $43,571 |
Family Income in St Lucie Village
Family Income Brackets in St Lucie Village
According to the St Lucie Village family income data, there are 39 families falling into the $50,000 to $74,999 income range, which is the most common income bracket and makes up 18.1% of all families. Conversely, the $10,000 to $14,999 income bracket is the least frequent group with only 3 families (1.4%) belonging to this category.
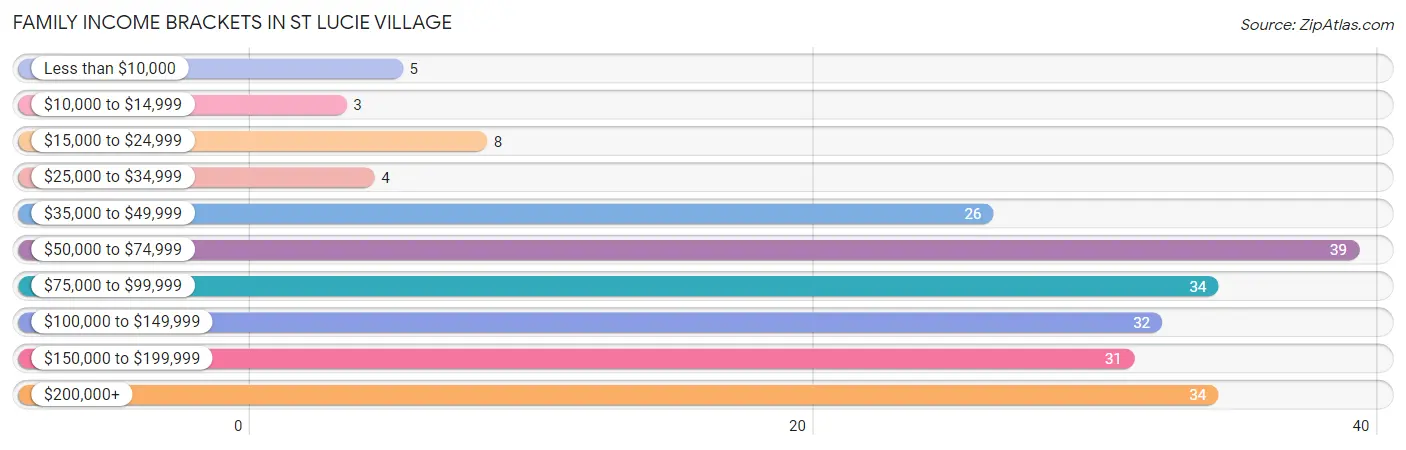
| Income Bracket | # Families | % Families |
| Less than $10,000 | 5 | 2.3% |
| $10,000 to $14,999 | 3 | 1.4% |
| $15,000 to $24,999 | 8 | 3.7% |
| $25,000 to $34,999 | 4 | 1.9% |
| $35,000 to $49,999 | 26 | 12.0% |
| $50,000 to $74,999 | 39 | 18.1% |
| $75,000 to $99,999 | 34 | 15.7% |
| $100,000 to $149,999 | 32 | 14.8% |
| $150,000 to $199,999 | 31 | 14.4% |
| $200,000+ | 34 | 15.7% |
Family Income by Famaliy Size in St Lucie Village
3-person families (23 | 10.6%) account for the highest median family income in St Lucie Village with $123,438 per family, while 2-person families (133 | 61.6%) have the highest median income of $46,406 per family member.
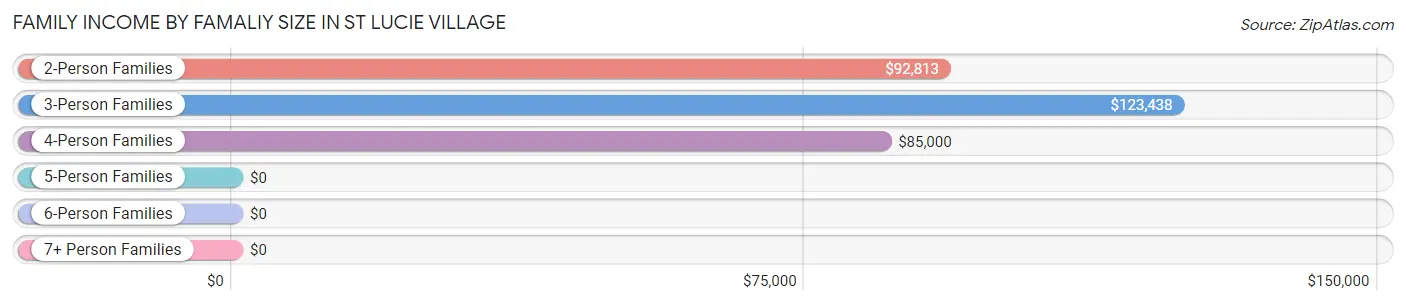
| Income Bracket | # Families | Median Income |
| 2-Person Families | 133 (61.6%) | $92,813 |
| 3-Person Families | 23 (10.6%) | $123,438 |
| 4-Person Families | 36 (16.7%) | $85,000 |
| 5-Person Families | 8 (3.7%) | $0 |
| 6-Person Families | 11 (5.1%) | $0 |
| 7+ Person Families | 5 (2.3%) | $0 |
| Total | 216 (100.0%) | $90,000 |
Family Income by Number of Earners in St Lucie Village
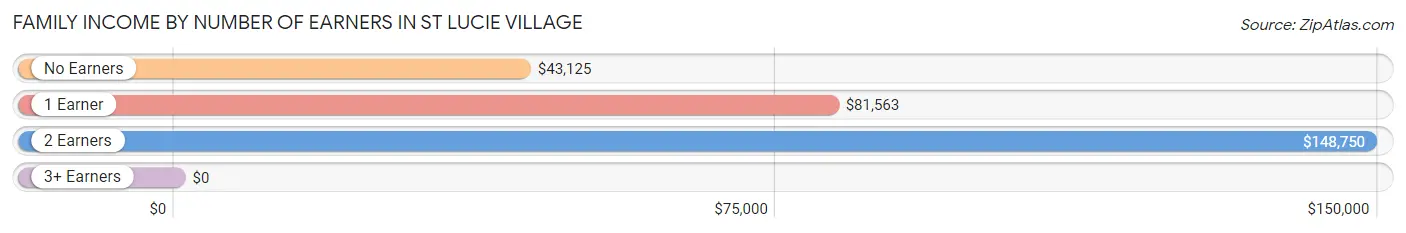
| Number of Earners | # Families | Median Income |
| No Earners | 58 (26.9%) | $43,125 |
| 1 Earner | 53 (24.5%) | $81,563 |
| 2 Earners | 88 (40.7%) | $148,750 |
| 3+ Earners | 17 (7.9%) | $0 |
| Total | 216 (100.0%) | $90,000 |
Household Income in St Lucie Village
Household Income Brackets in St Lucie Village
With 55 households falling in the category, the $35,000 to $49,999 income range is the most frequent in St Lucie Village, accounting for 18.3% of all households.
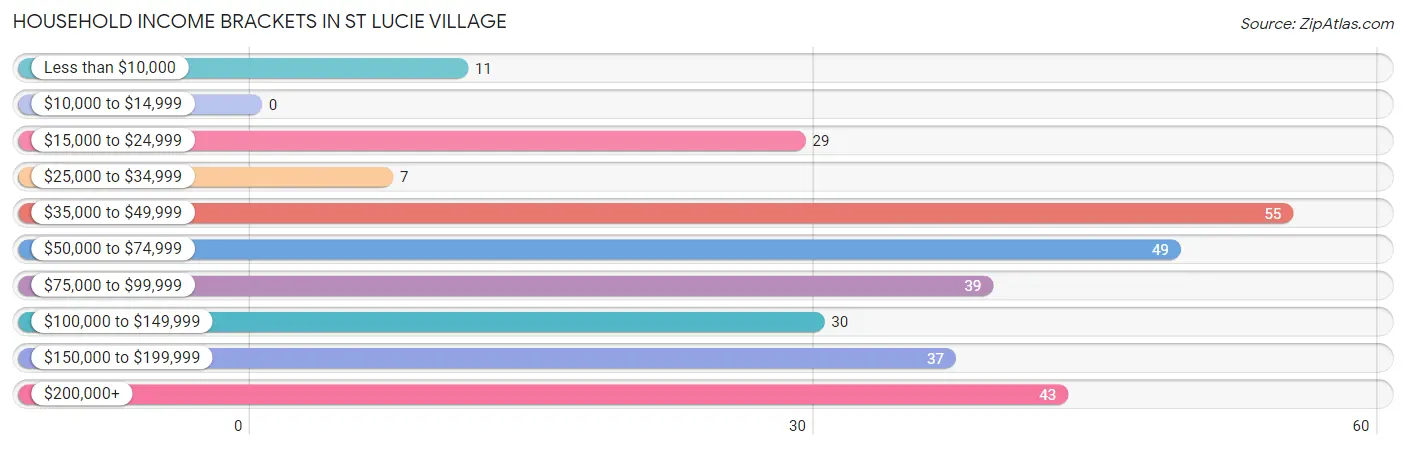
| Income Bracket | # Households | % Households |
| Less than $10,000 | 11 | 3.7% |
| $10,000 to $14,999 | 0 | 0.0% |
| $15,000 to $24,999 | 29 | 9.7% |
| $25,000 to $34,999 | 7 | 2.3% |
| $35,000 to $49,999 | 55 | 18.3% |
| $50,000 to $74,999 | 49 | 16.3% |
| $75,000 to $99,999 | 39 | 13.0% |
| $100,000 to $149,999 | 30 | 10.0% |
| $150,000 to $199,999 | 37 | 12.3% |
| $200,000+ | 43 | 14.3% |
Household Income by Householder Age in St Lucie Village
The median household income in St Lucie Village is $74,167, with the highest median household income of $87,500 found in the 45 to 64 years age bracket for the primary householder. A total of 150 households (50.0%) fall into this category. Meanwhile, the 15 to 24 years age bracket for the primary householder has the lowest median household income of $0, with 2 households (0.7%) in this group.
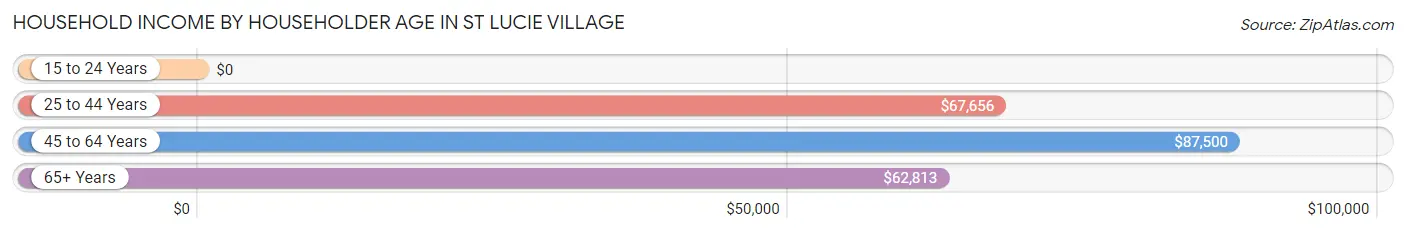
| Income Bracket | # Households | Median Income |
| 15 to 24 Years | 2 (0.7%) | $0 |
| 25 to 44 Years | 55 (18.3%) | $67,656 |
| 45 to 64 Years | 150 (50.0%) | $87,500 |
| 65+ Years | 93 (31.0%) | $62,813 |
| Total | 300 (100.0%) | $74,167 |
Poverty in St Lucie Village
Income Below Poverty by Sex and Age in St Lucie Village
With 8.7% poverty level for males and 9.4% for females among the residents of St Lucie Village, 75 year old and over males and 35 to 44 year old females are the most vulnerable to poverty, with 8 males (30.8%) and 14 females (28.6%) in their respective age groups living below the poverty level.
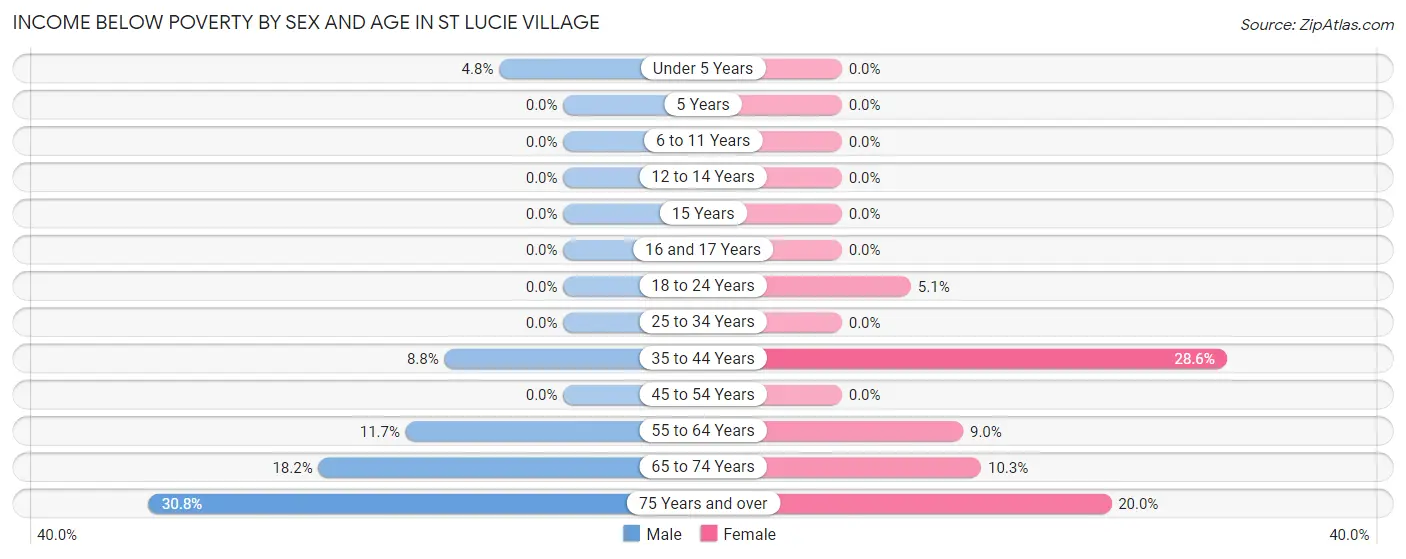
| Age Bracket | Male | Female |
| Under 5 Years | 1 (4.8%) | 0 (0.0%) |
| 5 Years | 0 (0.0%) | 0 (0.0%) |
| 6 to 11 Years | 0 (0.0%) | 0 (0.0%) |
| 12 to 14 Years | 0 (0.0%) | 0 (0.0%) |
| 15 Years | 0 (0.0%) | 0 (0.0%) |
| 16 and 17 Years | 0 (0.0%) | 0 (0.0%) |
| 18 to 24 Years | 0 (0.0%) | 2 (5.1%) |
| 25 to 34 Years | 0 (0.0%) | 0 (0.0%) |
| 35 to 44 Years | 3 (8.8%) | 14 (28.6%) |
| 45 to 54 Years | 0 (0.0%) | 0 (0.0%) |
| 55 to 64 Years | 11 (11.7%) | 9 (9.0%) |
| 65 to 74 Years | 14 (18.2%) | 6 (10.3%) |
| 75 Years and over | 8 (30.8%) | 7 (20.0%) |
| Total | 37 (8.7%) | 38 (9.4%) |
Income Above Poverty by Sex and Age in St Lucie Village
According to the poverty statistics in St Lucie Village, males aged 5 years and females aged under 5 years are the age groups that are most secure financially, with 100.0% of males and 100.0% of females in these age groups living above the poverty line.
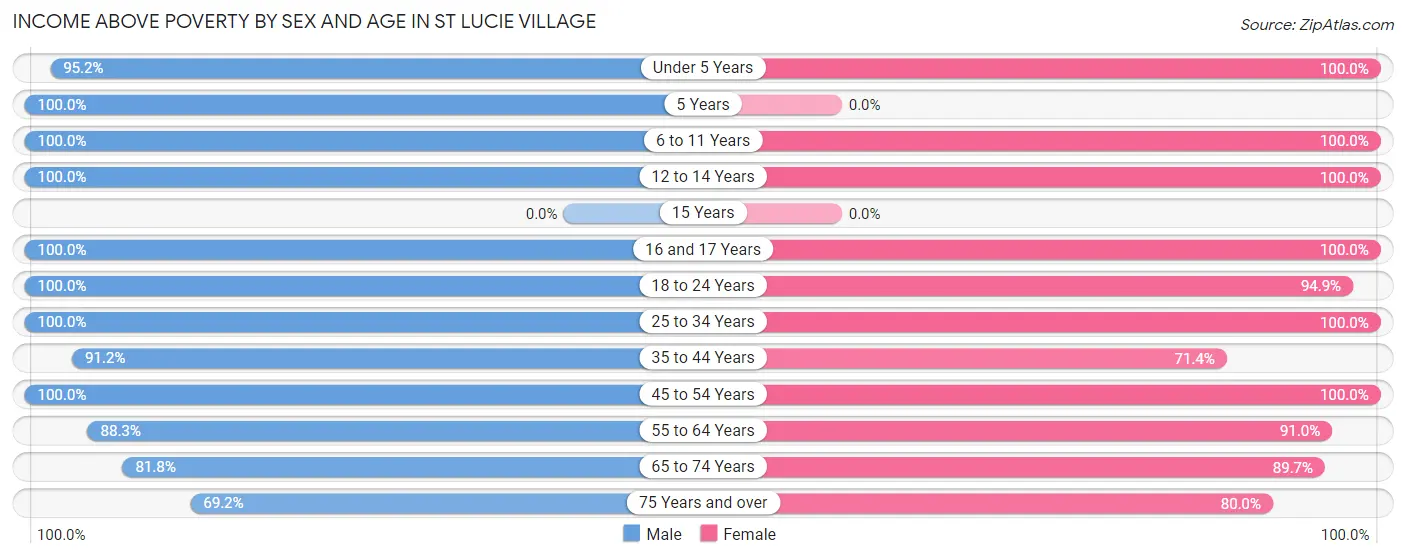
| Age Bracket | Male | Female |
| Under 5 Years | 20 (95.2%) | 20 (100.0%) |
| 5 Years | 10 (100.0%) | 0 (0.0%) |
| 6 to 11 Years | 51 (100.0%) | 16 (100.0%) |
| 12 to 14 Years | 19 (100.0%) | 24 (100.0%) |
| 15 Years | 0 (0.0%) | 0 (0.0%) |
| 16 and 17 Years | 11 (100.0%) | 7 (100.0%) |
| 18 to 24 Years | 5 (100.0%) | 37 (94.9%) |
| 25 to 34 Years | 56 (100.0%) | 19 (100.0%) |
| 35 to 44 Years | 31 (91.2%) | 35 (71.4%) |
| 45 to 54 Years | 23 (100.0%) | 39 (100.0%) |
| 55 to 64 Years | 83 (88.3%) | 91 (91.0%) |
| 65 to 74 Years | 63 (81.8%) | 52 (89.7%) |
| 75 Years and over | 18 (69.2%) | 28 (80.0%) |
| Total | 390 (91.3%) | 368 (90.6%) |
Income Below Poverty Among Married-Couple Families in St Lucie Village
The poverty statistics for married-couple families in St Lucie Village show that 5.1% or 9 of the total 178 families live below the poverty line. Families with no children have the highest poverty rate of 7.3%, comprising of 9 families. On the other hand, families with 1 or 2 children have the lowest poverty rate of 0.0%, which includes 0 families.
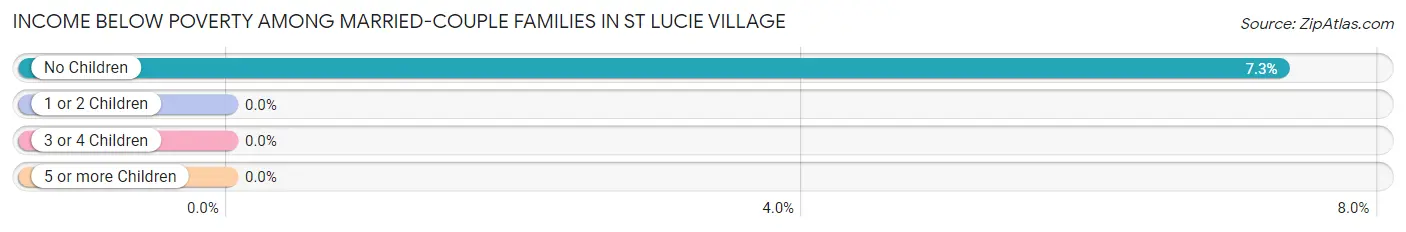
| Children | Above Poverty | Below Poverty |
| No Children | 114 (92.7%) | 9 (7.3%) |
| 1 or 2 Children | 40 (100.0%) | 0 (0.0%) |
| 3 or 4 Children | 10 (100.0%) | 0 (0.0%) |
| 5 or more Children | 5 (100.0%) | 0 (0.0%) |
| Total | 169 (94.9%) | 9 (5.1%) |
Income Below Poverty Among Single-Parent Households in St Lucie Village
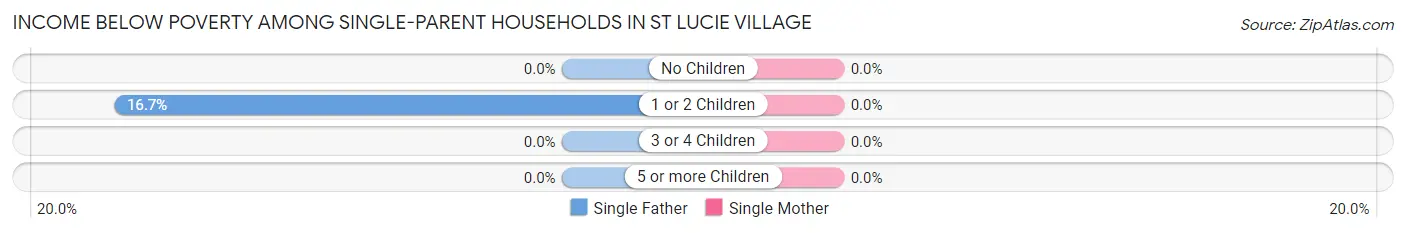
| Children | Single Father | Single Mother |
| No Children | 0 (0.0%) | 0 (0.0%) |
| 1 or 2 Children | 2 (16.7%) | 0 (0.0%) |
| 3 or 4 Children | 0 (0.0%) | 0 (0.0%) |
| 5 or more Children | 0 (0.0%) | 0 (0.0%) |
| Total | 2 (10.0%) | 0 (0.0%) |
Income Below Poverty Among Married-Couple vs Single-Parent Households in St Lucie Village
The poverty data for St Lucie Village shows that 9 of the married-couple family households (5.1%) and 2 of the single-parent households (5.3%) are living below the poverty level. Within the married-couple family households, those with no children have the highest poverty rate, with 9 households (7.3%) falling below the poverty line. Among the single-parent households, those with 1 or 2 children have the highest poverty rate, with 2 household (14.3%) living below poverty.
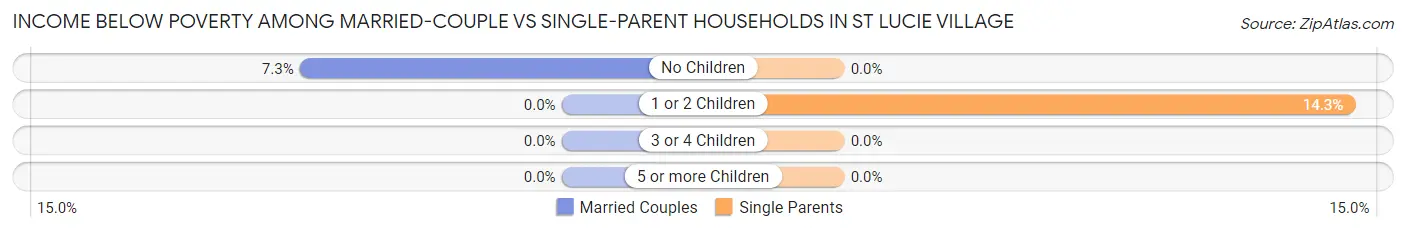
| Children | Married-Couple Families | Single-Parent Households |
| No Children | 9 (7.3%) | 0 (0.0%) |
| 1 or 2 Children | 0 (0.0%) | 2 (14.3%) |
| 3 or 4 Children | 0 (0.0%) | 0 (0.0%) |
| 5 or more Children | 0 (0.0%) | 0 (0.0%) |
| Total | 9 (5.1%) | 2 (5.3%) |
Race in St Lucie Village
The most populous races in St Lucie Village are White / Caucasian (718 | 85.7%), Two or more Races (80 | 9.6%), and Hispanic or Latino (49 | 5.9%).
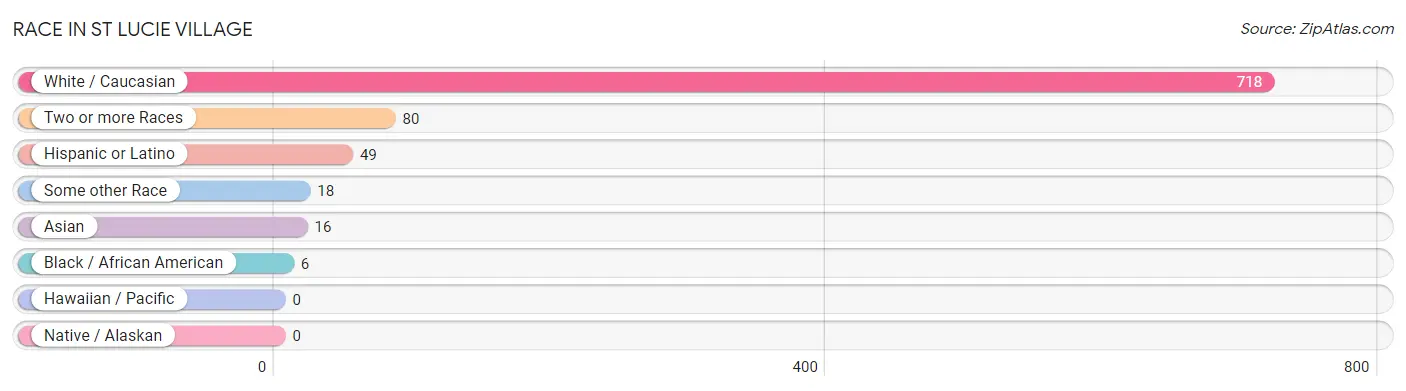
| Race | # Population | % Population |
| Asian | 16 | 1.9% |
| Black / African American | 6 | 0.7% |
| Hawaiian / Pacific | 0 | 0.0% |
| Hispanic or Latino | 49 | 5.9% |
| Native / Alaskan | 0 | 0.0% |
| White / Caucasian | 718 | 85.7% |
| Two or more Races | 80 | 9.6% |
| Some other Race | 18 | 2.1% |
| Total | 838 | 100.0% |
Ancestry in St Lucie Village
The most populous ancestries reported in St Lucie Village are German (145 | 17.3%), American (127 | 15.2%), Irish (113 | 13.5%), English (102 | 12.2%), and European (53 | 6.3%), together accounting for 64.4% of all St Lucie Village residents.
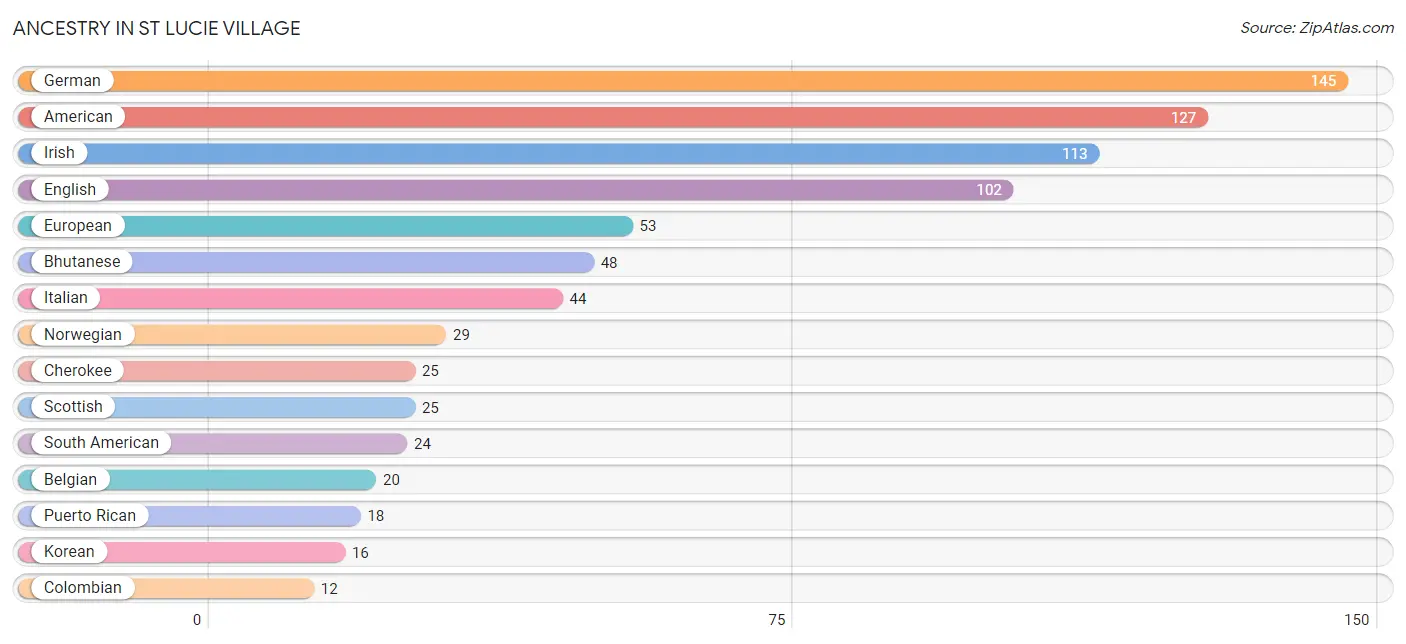
| Ancestry | # Population | % Population |
| American | 127 | 15.2% |
| Belgian | 20 | 2.4% |
| Bhutanese | 48 | 5.7% |
| Burmese | 6 | 0.7% |
| Cherokee | 25 | 3.0% |
| Colombian | 12 | 1.4% |
| Czech | 9 | 1.1% |
| Dutch | 6 | 0.7% |
| Eastern European | 9 | 1.1% |
| Ecuadorian | 2 | 0.2% |
| English | 102 | 12.2% |
| European | 53 | 6.3% |
| Finnish | 2 | 0.2% |
| French | 11 | 1.3% |
| French Canadian | 8 | 0.9% |
| German | 145 | 17.3% |
| Irish | 113 | 13.5% |
| Italian | 44 | 5.2% |
| Korean | 16 | 1.9% |
| Mexican | 7 | 0.8% |
| Northern European | 8 | 0.9% |
| Norwegian | 29 | 3.5% |
| Peruvian | 10 | 1.2% |
| Polish | 10 | 1.2% |
| Puerto Rican | 18 | 2.1% |
| Scandinavian | 3 | 0.4% |
| Scotch-Irish | 2 | 0.2% |
| Scottish | 25 | 3.0% |
| South American | 24 | 2.9% |
| Subsaharan African | 6 | 0.7% |
| Swedish | 6 | 0.7% |
| Ukrainian | 5 | 0.6% | View All 32 Rows |
Immigrants in St Lucie Village
The most numerous immigrant groups reported in St Lucie Village came from Latin America (9 | 1.1%), Asia (7 | 0.8%), Central America (7 | 0.8%), Mexico (7 | 0.8%), and Philippines (4 | 0.5%), together accounting for 4.1% of all St Lucie Village residents.
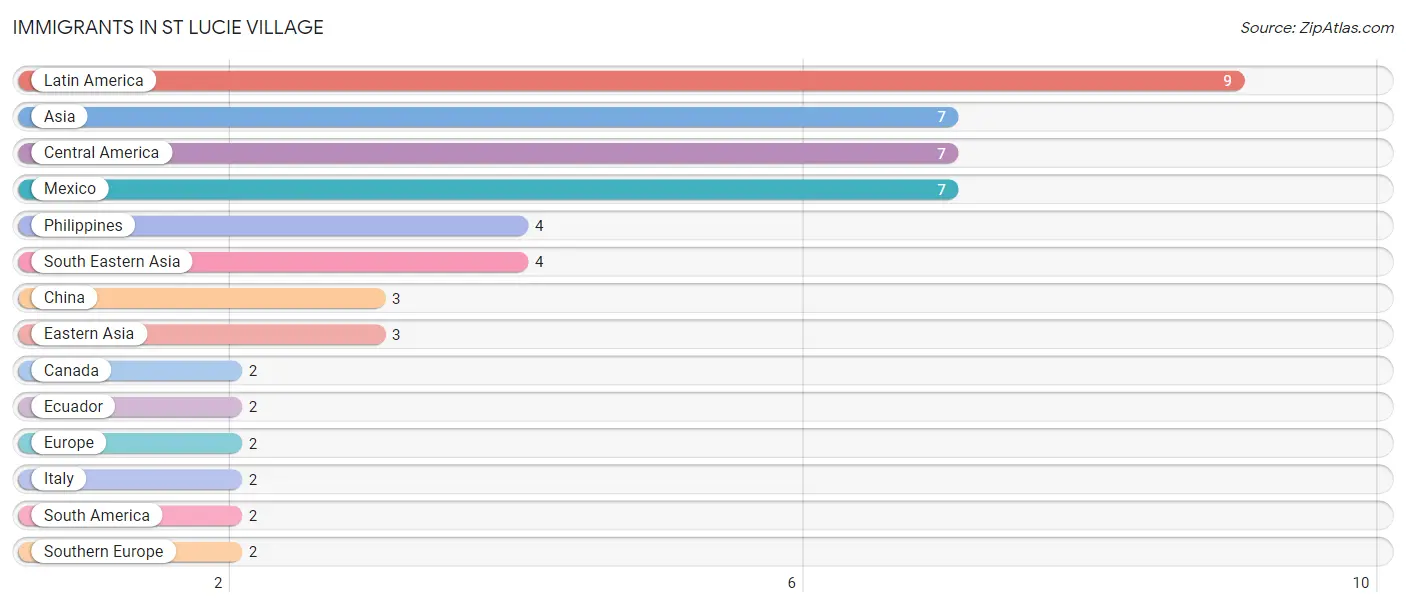
| Immigration Origin | # Population | % Population |
| Asia | 7 | 0.8% |
| Canada | 2 | 0.2% |
| Central America | 7 | 0.8% |
| China | 3 | 0.4% |
| Eastern Asia | 3 | 0.4% |
| Ecuador | 2 | 0.2% |
| Europe | 2 | 0.2% |
| Italy | 2 | 0.2% |
| Latin America | 9 | 1.1% |
| Mexico | 7 | 0.8% |
| Philippines | 4 | 0.5% |
| South America | 2 | 0.2% |
| South Eastern Asia | 4 | 0.5% |
| Southern Europe | 2 | 0.2% | View All 14 Rows |
Sex and Age in St Lucie Village
Sex and Age in St Lucie Village
The most populous age groups in St Lucie Village are 55 to 59 Years (51 | 11.8%) for men and 60 to 64 Years (63 | 15.5%) for women.
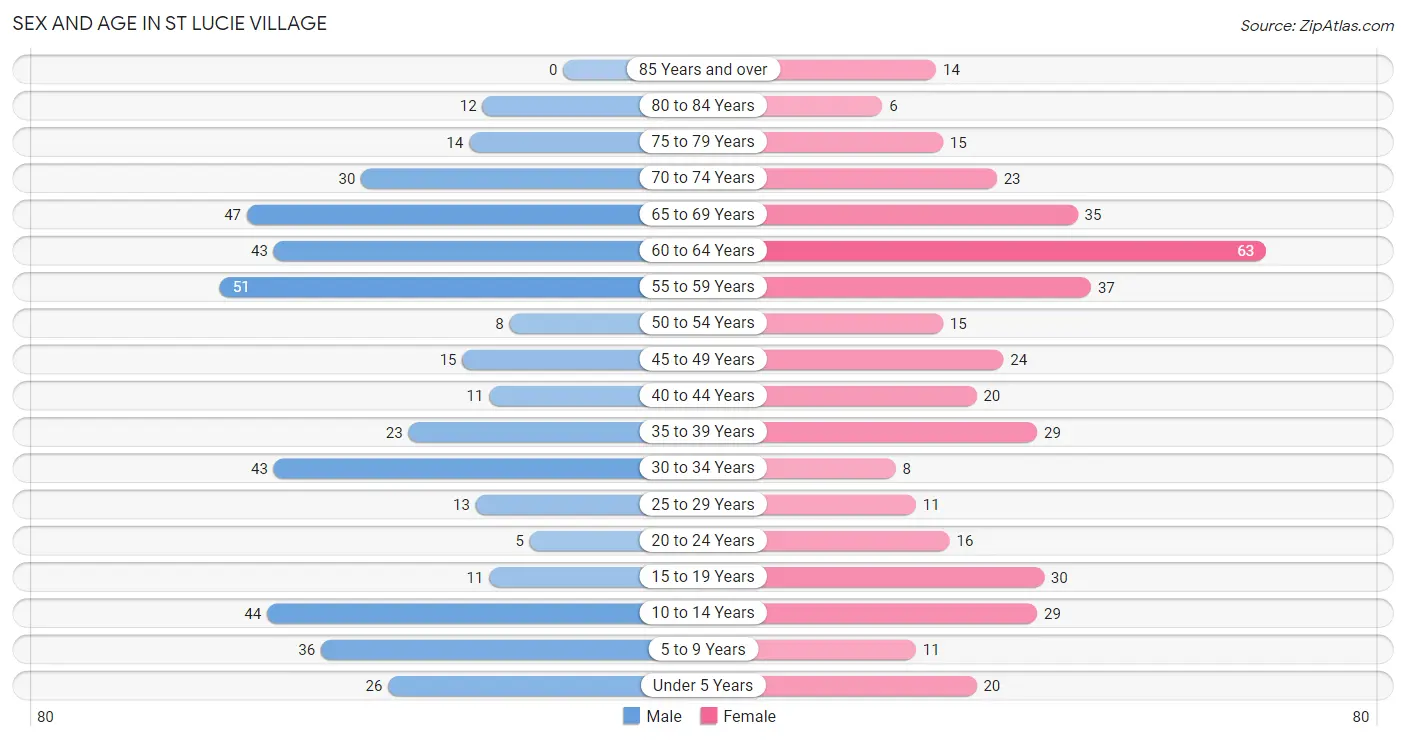
| Age Bracket | Male | Female |
| Under 5 Years | 26 (6.0%) | 20 (4.9%) |
| 5 to 9 Years | 36 (8.3%) | 11 (2.7%) |
| 10 to 14 Years | 44 (10.2%) | 29 (7.1%) |
| 15 to 19 Years | 11 (2.5%) | 30 (7.4%) |
| 20 to 24 Years | 5 (1.2%) | 16 (3.9%) |
| 25 to 29 Years | 13 (3.0%) | 11 (2.7%) |
| 30 to 34 Years | 43 (10.0%) | 8 (2.0%) |
| 35 to 39 Years | 23 (5.3%) | 29 (7.1%) |
| 40 to 44 Years | 11 (2.5%) | 20 (4.9%) |
| 45 to 49 Years | 15 (3.5%) | 24 (5.9%) |
| 50 to 54 Years | 8 (1.8%) | 15 (3.7%) |
| 55 to 59 Years | 51 (11.8%) | 37 (9.1%) |
| 60 to 64 Years | 43 (10.0%) | 63 (15.5%) |
| 65 to 69 Years | 47 (10.9%) | 35 (8.6%) |
| 70 to 74 Years | 30 (6.9%) | 23 (5.7%) |
| 75 to 79 Years | 14 (3.2%) | 15 (3.7%) |
| 80 to 84 Years | 12 (2.8%) | 6 (1.5%) |
| 85 Years and over | 0 (0.0%) | 14 (3.5%) |
| Total | 432 (100.0%) | 406 (100.0%) |
Families and Households in St Lucie Village
Median Family Size in St Lucie Village
The median family size in St Lucie Village is 3.15 persons per family, with single female/mother families (18 | 8.3%) accounting for the largest median family size of 4 persons per family. On the other hand, single male/father families (20 | 9.3%) represent the smallest median family size with 2.45 persons per family.
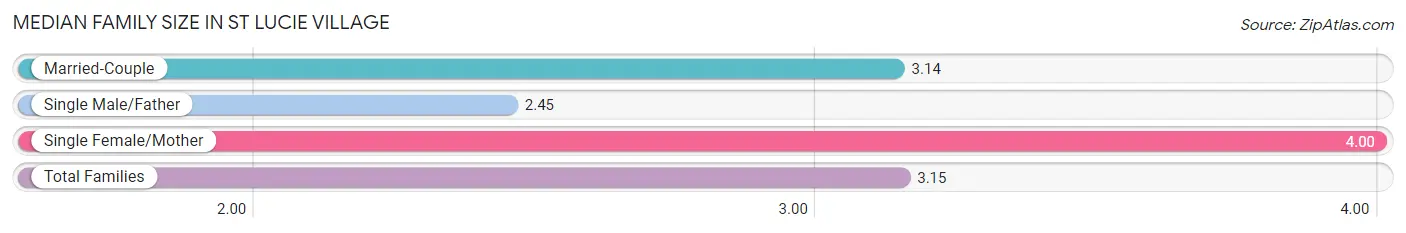
| Family Type | # Families | Family Size |
| Married-Couple | 178 (82.4%) | 3.14 |
| Single Male/Father | 20 (9.3%) | 2.45 |
| Single Female/Mother | 18 (8.3%) | 4.00 |
| Total Families | 216 (100.0%) | 3.15 |
Median Household Size in St Lucie Village
The median household size in St Lucie Village is 2.79 persons per household, with single female/mother households (18 | 6.0%) accounting for the largest median household size of 4.44 persons per household. non-family households (84 | 28.0%) represent the smallest median household size with 1.32 persons per household.
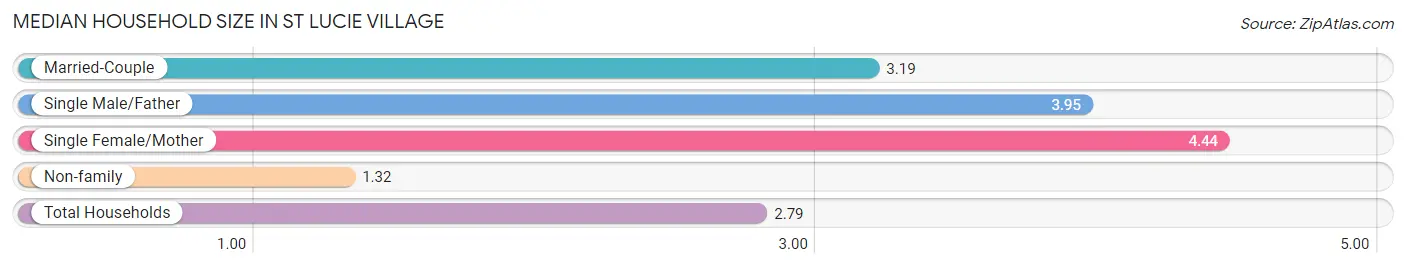
| Household Type | # Households | Household Size |
| Married-Couple | 178 (59.3%) | 3.19 |
| Single Male/Father | 20 (6.7%) | 3.95 |
| Single Female/Mother | 18 (6.0%) | 4.44 |
| Non-family | 84 (28.0%) | 1.32 |
| Total Households | 300 (100.0%) | 2.79 |
Household Size by Marriage Status in St Lucie Village
Out of a total of 300 households in St Lucie Village, 216 (72.0%) are family households, while 84 (28.0%) are nonfamily households. The most numerous type of family households are 2-person households, comprising 104, and the most common type of nonfamily households are 1-person households, comprising 64.
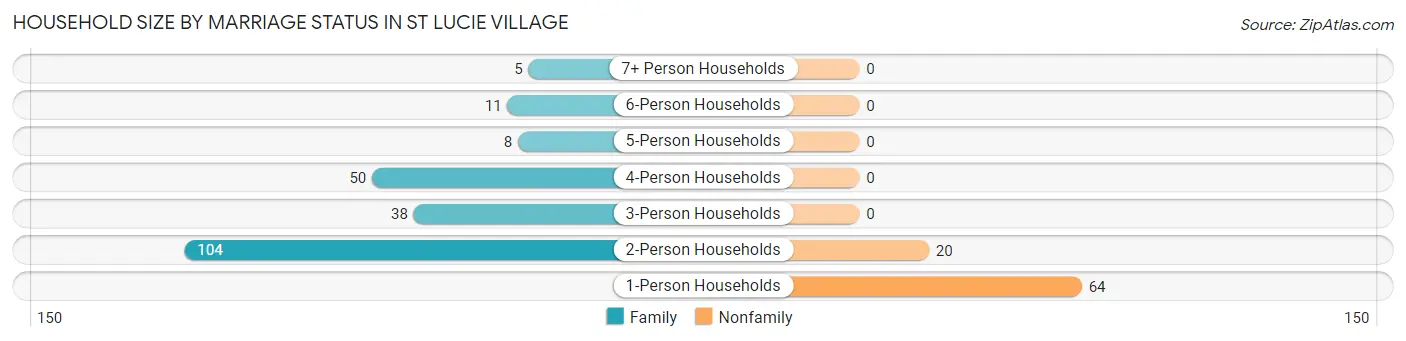
| Household Size | Family Households | Nonfamily Households |
| 1-Person Households | - | 64 (21.3%) |
| 2-Person Households | 104 (34.7%) | 20 (6.7%) |
| 3-Person Households | 38 (12.7%) | 0 (0.0%) |
| 4-Person Households | 50 (16.7%) | 0 (0.0%) |
| 5-Person Households | 8 (2.7%) | 0 (0.0%) |
| 6-Person Households | 11 (3.7%) | 0 (0.0%) |
| 7+ Person Households | 5 (1.7%) | 0 (0.0%) |
| Total | 216 (72.0%) | 84 (28.0%) |
Female Fertility in St Lucie Village
Fertility by Age in St Lucie Village
Average fertility rate in St Lucie Village is 35.0 births per 1,000 women. Women in the age bracket of 20 to 34 years have the highest fertility rate with 143.0 births per 1,000 women. Women in the age bracket of 20 to 34 years acount for 100.0% of all women with births.
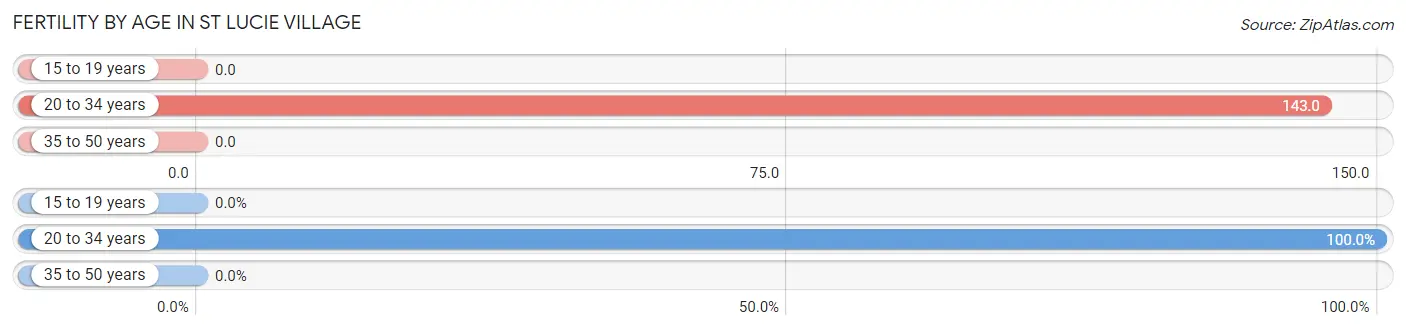
| Age Bracket | Women with Births | Births / 1,000 Women |
| 15 to 19 years | 0 (0.0%) | 0.0 |
| 20 to 34 years | 5 (100.0%) | 143.0 |
| 35 to 50 years | 0 (0.0%) | 0.0 |
| Total | 5 (100.0%) | 35.0 |
Fertility by Age by Marriage Status in St Lucie Village
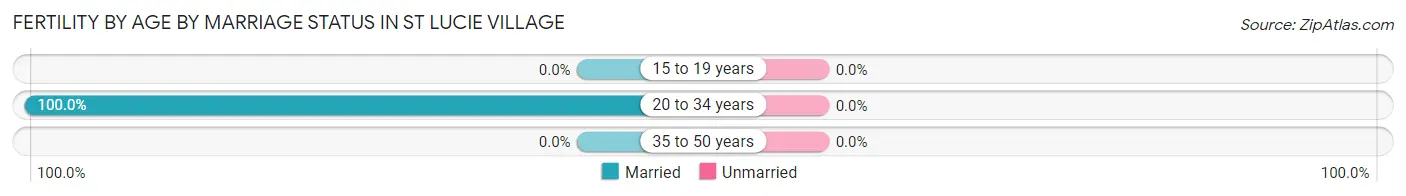
| Age Bracket | Married | Unmarried |
| 15 to 19 years | 0 (0.0%) | 0 (0.0%) |
| 20 to 34 years | 5 (100.0%) | 0 (0.0%) |
| 35 to 50 years | 0 (0.0%) | 0 (0.0%) |
| Total | 5 (100.0%) | 0 (0.0%) |
Fertility by Education in St Lucie Village
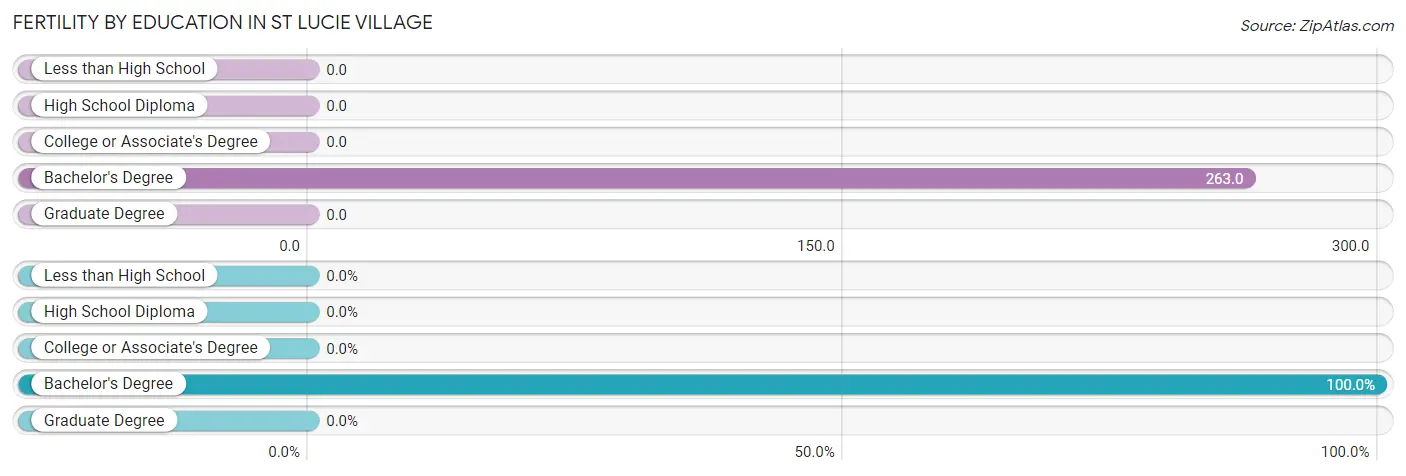
| Educational Attainment | Women with Births | Births / 1,000 Women |
| Less than High School | 0 (0.0%) | 0.0 |
| High School Diploma | 0 (0.0%) | 0.0 |
| College or Associate's Degree | 0 (0.0%) | 0.0 |
| Bachelor's Degree | 5 (100.0%) | 263.0 |
| Graduate Degree | 0 (0.0%) | 0.0 |
| Total | 5 (100.0%) | 35.0 |
Fertility by Education by Marriage Status in St Lucie Village
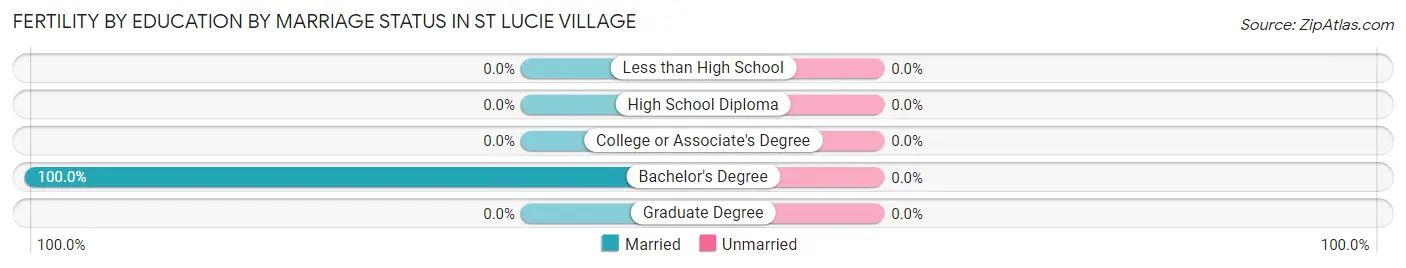
| Educational Attainment | Married | Unmarried |
| Less than High School | 0 (0.0%) | 0 (0.0%) |
| High School Diploma | 0 (0.0%) | 0 (0.0%) |
| College or Associate's Degree | 0 (0.0%) | 0 (0.0%) |
| Bachelor's Degree | 5 (100.0%) | 0 (0.0%) |
| Graduate Degree | 0 (0.0%) | 0 (0.0%) |
| Total | 5 (100.0%) | 0 (0.0%) |
Employment Characteristics in St Lucie Village
Employment by Class of Employer in St Lucie Village
Among the 355 employed individuals in St Lucie Village, private company employees (214 | 60.3%), self-employed (incorporated) (66 | 18.6%), and self-employed (not incorporated) (27 | 7.6%) make up the most common classes of employment.
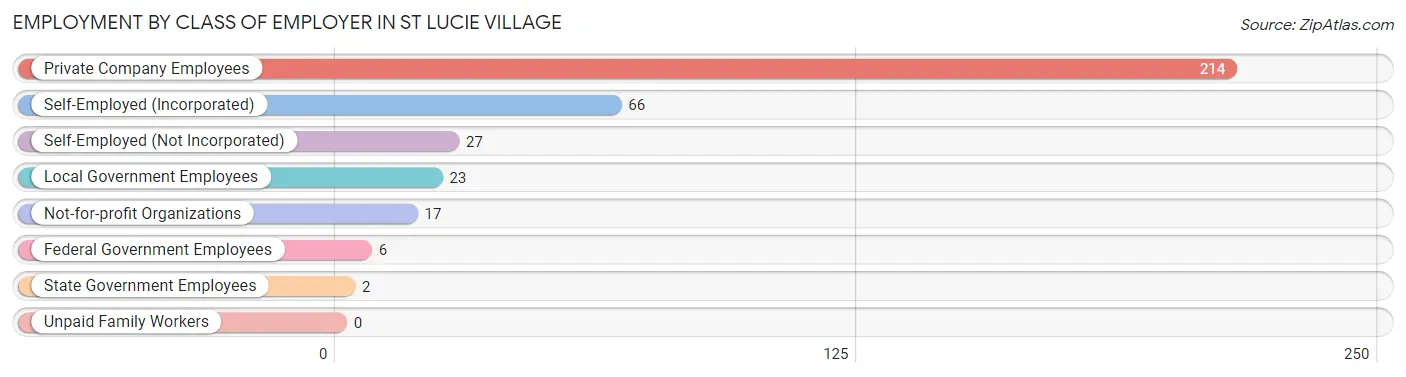
| Employer Class | # Employees | % Employees |
| Private Company Employees | 214 | 60.3% |
| Self-Employed (Incorporated) | 66 | 18.6% |
| Self-Employed (Not Incorporated) | 27 | 7.6% |
| Not-for-profit Organizations | 17 | 4.8% |
| Local Government Employees | 23 | 6.5% |
| State Government Employees | 2 | 0.6% |
| Federal Government Employees | 6 | 1.7% |
| Unpaid Family Workers | 0 | 0.0% |
| Total | 355 | 100.0% |
Employment Status by Age in St Lucie Village
According to the labor force statistics for St Lucie Village, out of the total population over 16 years of age (672), 54.5% or 366 individuals are in the labor force, with 3.0% or 11 of them unemployed. The age group with the highest labor force participation rate is 30 to 34 years, with 100.0% or 51 individuals in the labor force. Within the labor force, the 20 to 24 years age range has the highest percentage of unemployed individuals, with 25.0% or 4 of them being unemployed.
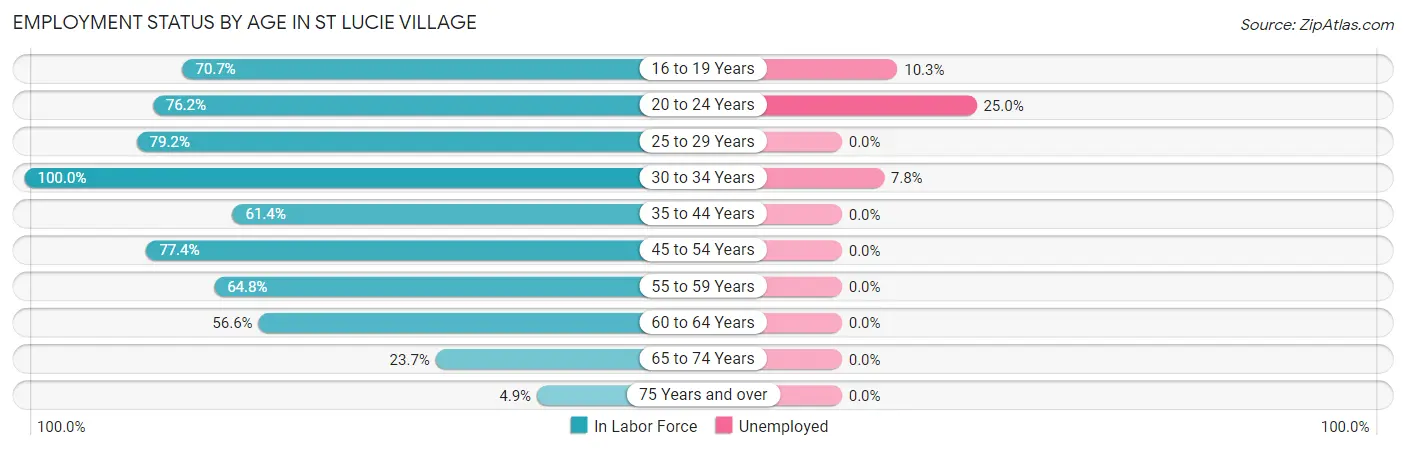
| Age Bracket | In Labor Force | Unemployed |
| 16 to 19 Years | 29 (70.7%) | 3 (10.3%) |
| 20 to 24 Years | 16 (76.2%) | 4 (25.0%) |
| 25 to 29 Years | 19 (79.2%) | 0 (0.0%) |
| 30 to 34 Years | 51 (100.0%) | 4 (7.8%) |
| 35 to 44 Years | 51 (61.4%) | 0 (0.0%) |
| 45 to 54 Years | 48 (77.4%) | 0 (0.0%) |
| 55 to 59 Years | 57 (64.8%) | 0 (0.0%) |
| 60 to 64 Years | 60 (56.6%) | 0 (0.0%) |
| 65 to 74 Years | 32 (23.7%) | 0 (0.0%) |
| 75 Years and over | 3 (4.9%) | 0 (0.0%) |
| Total | 366 (54.5%) | 11 (3.0%) |
Employment Status by Educational Attainment in St Lucie Village
According to labor force statistics for St Lucie Village, 69.1% of individuals (286) out of the total population between 25 and 64 years of age (414) are in the labor force, with 1.4% or 4 of them being unemployed. The group with the highest labor force participation rate are those with the educational attainment of bachelor's degree or higher, with 78.5% or 106 individuals in the labor force. Within the labor force, individuals with college / associate degree education have the highest percentage of unemployment, with 4.1% or 4 of them being unemployed.
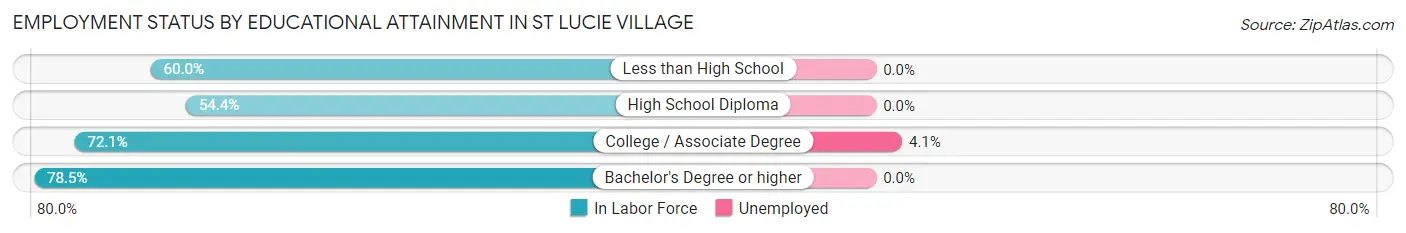
| Educational Attainment | In Labor Force | Unemployed |
| Less than High School | 36 (60.0%) | 0 (0.0%) |
| High School Diploma | 43 (54.4%) | 0 (0.0%) |
| College / Associate Degree | 101 (72.1%) | 6 (4.1%) |
| Bachelor's Degree or higher | 106 (78.5%) | 0 (0.0%) |
| Total | 286 (69.1%) | 6 (1.4%) |
Employment Occupations by Sex in St Lucie Village
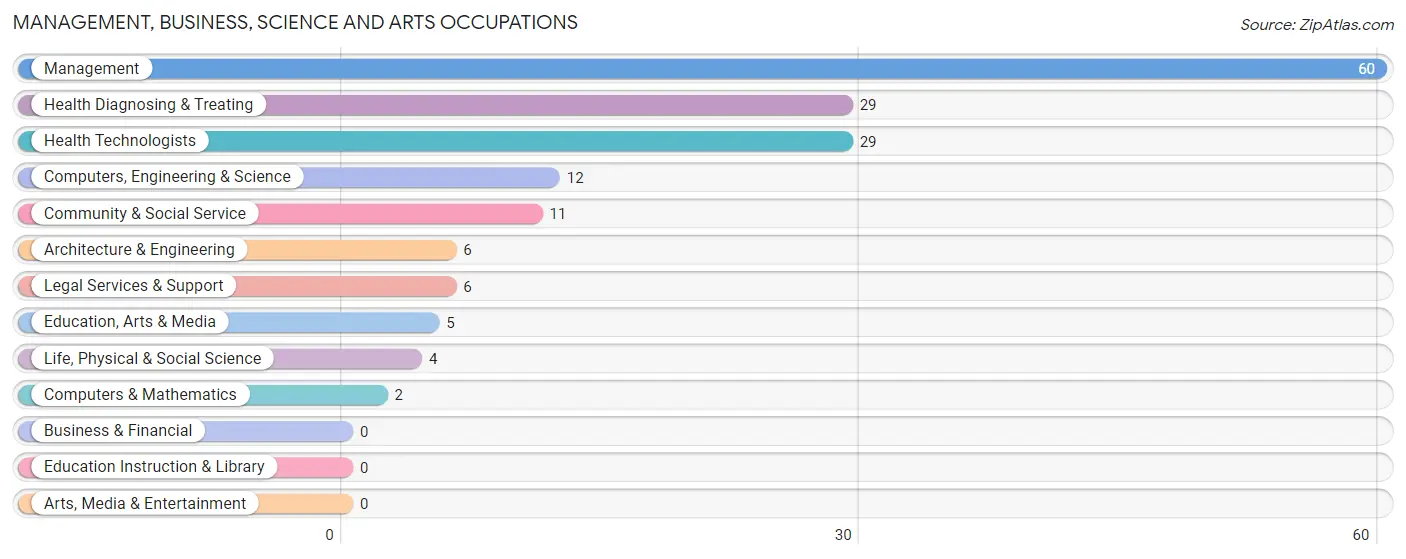
Management, Business, Science and Arts Occupations
The most common Management, Business, Science and Arts occupations in St Lucie Village are Management (60 | 17.1%), Health Diagnosing & Treating (29 | 8.2%), Health Technologists (29 | 8.2%), Computers, Engineering & Science (12 | 3.4%), and Community & Social Service (11 | 3.1%).
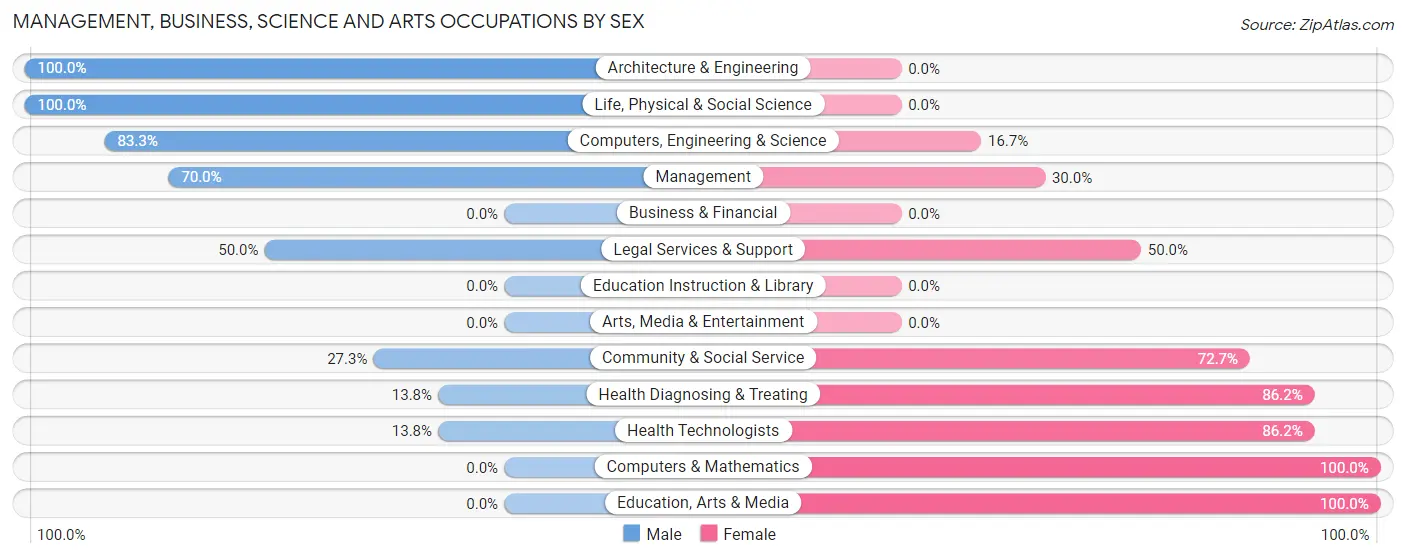
Management, Business, Science and Arts Occupations by Sex
Within the Management, Business, Science and Arts occupations in St Lucie Village, the most male-oriented occupations are Architecture & Engineering (100.0%), Life, Physical & Social Science (100.0%), and Computers, Engineering & Science (83.3%), while the most female-oriented occupations are Computers & Mathematics (100.0%), Education, Arts & Media (100.0%), and Health Diagnosing & Treating (86.2%).
| Occupation | Male | Female |
| Management | 42 (70.0%) | 18 (30.0%) |
| Business & Financial | 0 (0.0%) | 0 (0.0%) |
| Computers, Engineering & Science | 10 (83.3%) | 2 (16.7%) |
| Computers & Mathematics | 0 (0.0%) | 2 (100.0%) |
| Architecture & Engineering | 6 (100.0%) | 0 (0.0%) |
| Life, Physical & Social Science | 4 (100.0%) | 0 (0.0%) |
| Community & Social Service | 3 (27.3%) | 8 (72.7%) |
| Education, Arts & Media | 0 (0.0%) | 5 (100.0%) |
| Legal Services & Support | 3 (50.0%) | 3 (50.0%) |
| Education Instruction & Library | 0 (0.0%) | 0 (0.0%) |
| Arts, Media & Entertainment | 0 (0.0%) | 0 (0.0%) |
| Health Diagnosing & Treating | 4 (13.8%) | 25 (86.2%) |
| Health Technologists | 4 (13.8%) | 25 (86.2%) |
| Total (Category) | 59 (52.7%) | 53 (47.3%) |
| Total (Overall) | 187 (53.1%) | 165 (46.9%) |
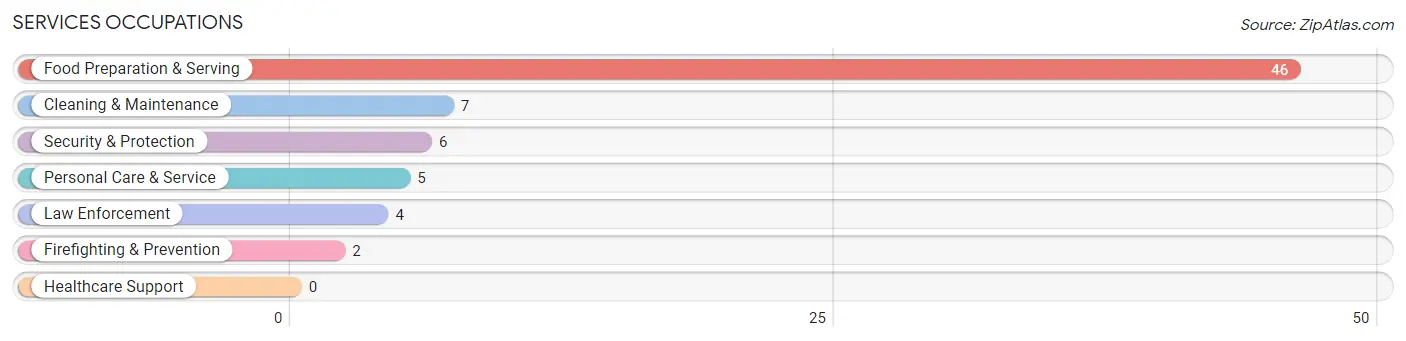
Services Occupations
The most common Services occupations in St Lucie Village are Food Preparation & Serving (46 | 13.1%), Cleaning & Maintenance (7 | 2.0%), Security & Protection (6 | 1.7%), Personal Care & Service (5 | 1.4%), and Law Enforcement (4 | 1.1%).
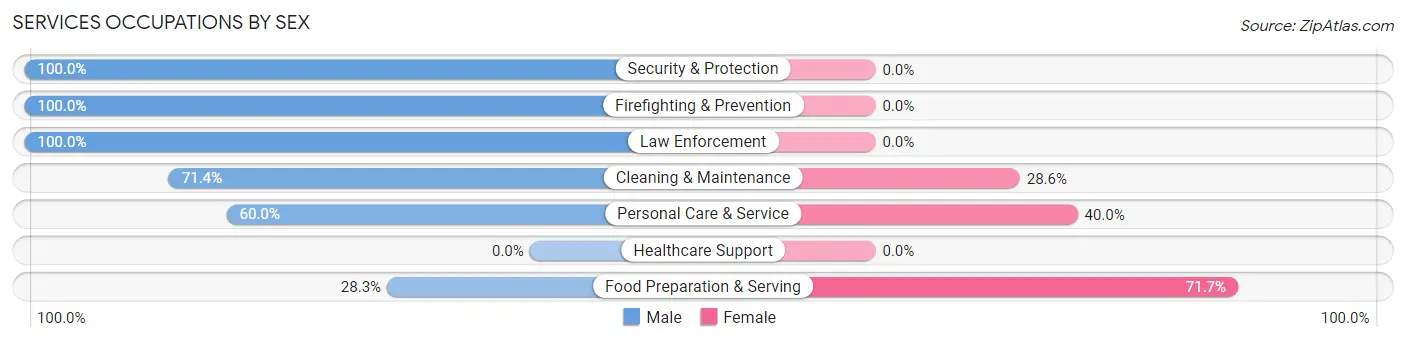
Services Occupations by Sex
Within the Services occupations in St Lucie Village, the most male-oriented occupations are Security & Protection (100.0%), Firefighting & Prevention (100.0%), and Law Enforcement (100.0%), while the most female-oriented occupations are Food Preparation & Serving (71.7%), Personal Care & Service (40.0%), and Cleaning & Maintenance (28.6%).
| Occupation | Male | Female |
| Healthcare Support | 0 (0.0%) | 0 (0.0%) |
| Security & Protection | 6 (100.0%) | 0 (0.0%) |
| Firefighting & Prevention | 2 (100.0%) | 0 (0.0%) |
| Law Enforcement | 4 (100.0%) | 0 (0.0%) |
| Food Preparation & Serving | 13 (28.3%) | 33 (71.7%) |
| Cleaning & Maintenance | 5 (71.4%) | 2 (28.6%) |
| Personal Care & Service | 3 (60.0%) | 2 (40.0%) |
| Total (Category) | 27 (42.2%) | 37 (57.8%) |
| Total (Overall) | 187 (53.1%) | 165 (46.9%) |
Sales and Office Occupations
The most common Sales and Office occupations in St Lucie Village are Office & Administration (53 | 15.1%), and Sales & Related (48 | 13.6%).

Sales and Office Occupations by Sex
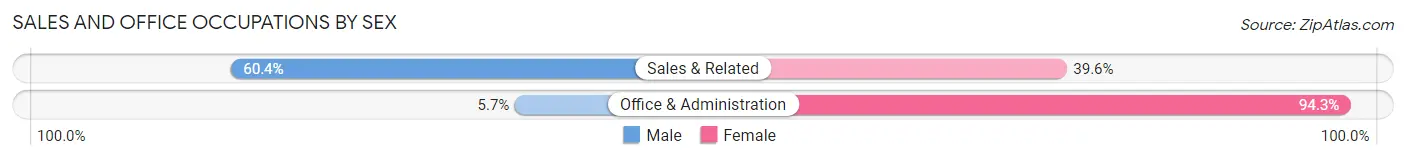
| Occupation | Male | Female |
| Sales & Related | 29 (60.4%) | 19 (39.6%) |
| Office & Administration | 3 (5.7%) | 50 (94.3%) |
| Total (Category) | 32 (31.7%) | 69 (68.3%) |
| Total (Overall) | 187 (53.1%) | 165 (46.9%) |
Natural Resources, Construction and Maintenance Occupations
The most common Natural Resources, Construction and Maintenance occupations in St Lucie Village are Construction & Extraction (16 | 4.5%), Installation, Maintenance & Repair (11 | 3.1%), and Farming, Fishing & Forestry (9 | 2.6%).

Natural Resources, Construction and Maintenance Occupations by Sex
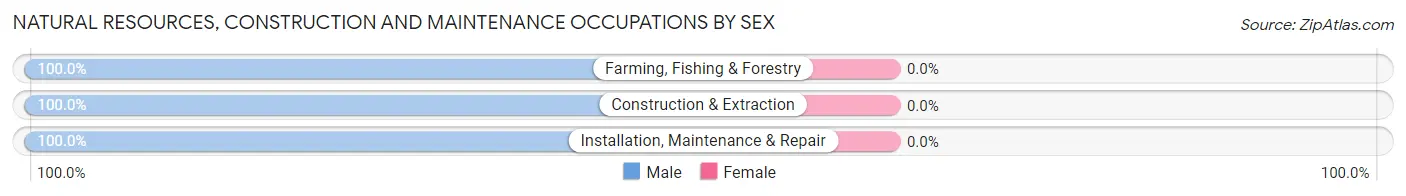
| Occupation | Male | Female |
| Farming, Fishing & Forestry | 9 (100.0%) | 0 (0.0%) |
| Construction & Extraction | 16 (100.0%) | 0 (0.0%) |
| Installation, Maintenance & Repair | 11 (100.0%) | 0 (0.0%) |
| Total (Category) | 36 (100.0%) | 0 (0.0%) |
| Total (Overall) | 187 (53.1%) | 165 (46.9%) |
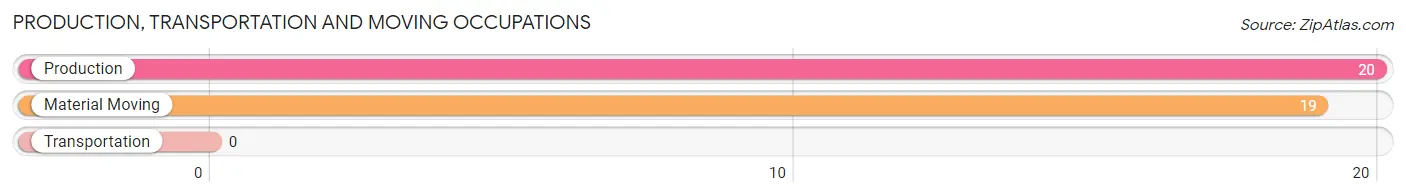
Production, Transportation and Moving Occupations
The most common Production, Transportation and Moving occupations in St Lucie Village are Production (20 | 5.7%), and Material Moving (19 | 5.4%).
Production, Transportation and Moving Occupations by Sex
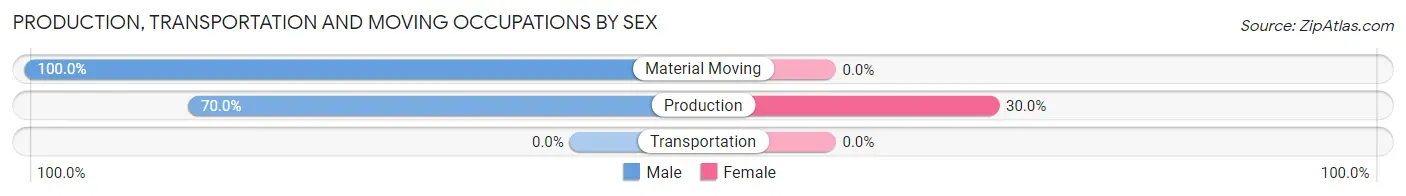
| Occupation | Male | Female |
| Production | 14 (70.0%) | 6 (30.0%) |
| Transportation | 0 (0.0%) | 0 (0.0%) |
| Material Moving | 19 (100.0%) | 0 (0.0%) |
| Total (Category) | 33 (84.6%) | 6 (15.4%) |
| Total (Overall) | 187 (53.1%) | 165 (46.9%) |
Employment Industries by Sex in St Lucie Village
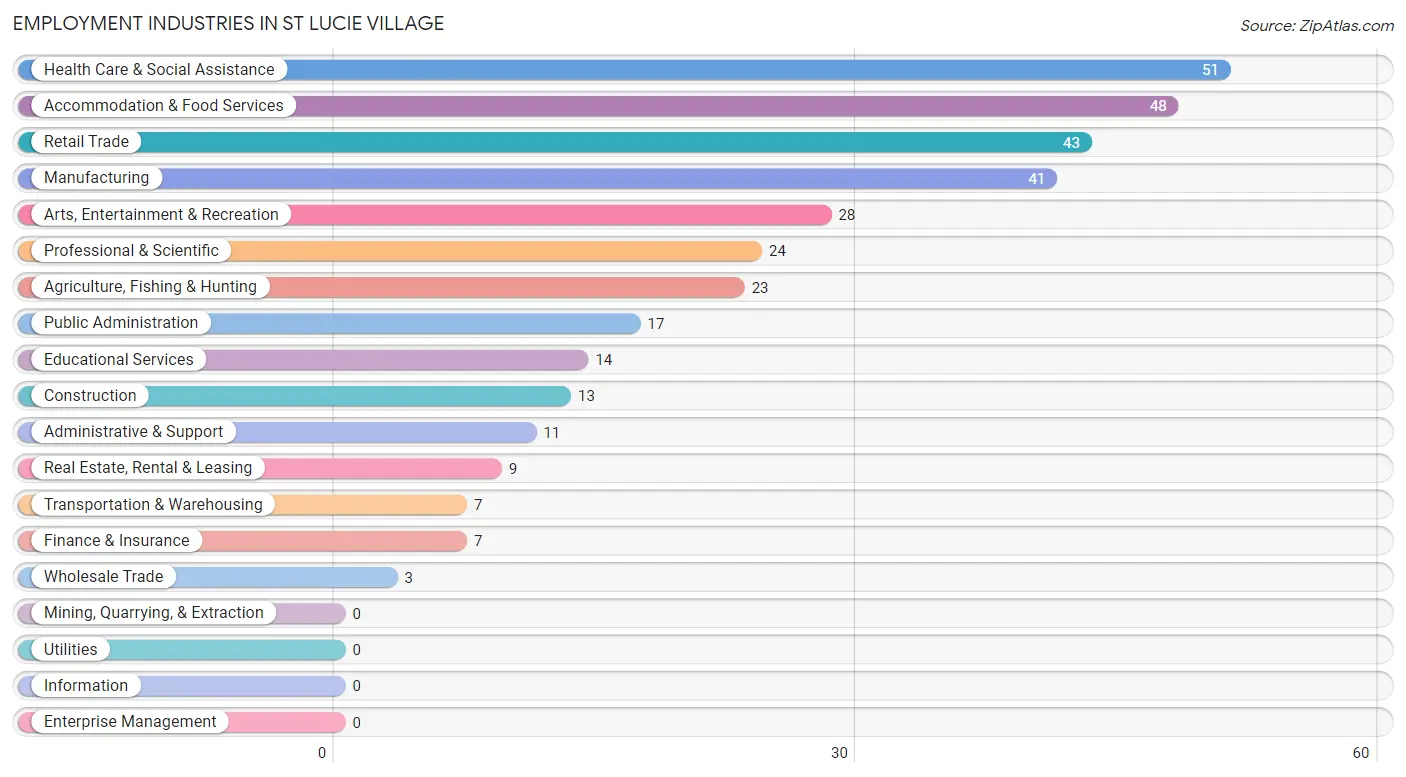
Employment Industries in St Lucie Village
The major employment industries in St Lucie Village include Health Care & Social Assistance (51 | 14.5%), Accommodation & Food Services (48 | 13.6%), Retail Trade (43 | 12.2%), Manufacturing (41 | 11.7%), and Arts, Entertainment & Recreation (28 | 8.0%).
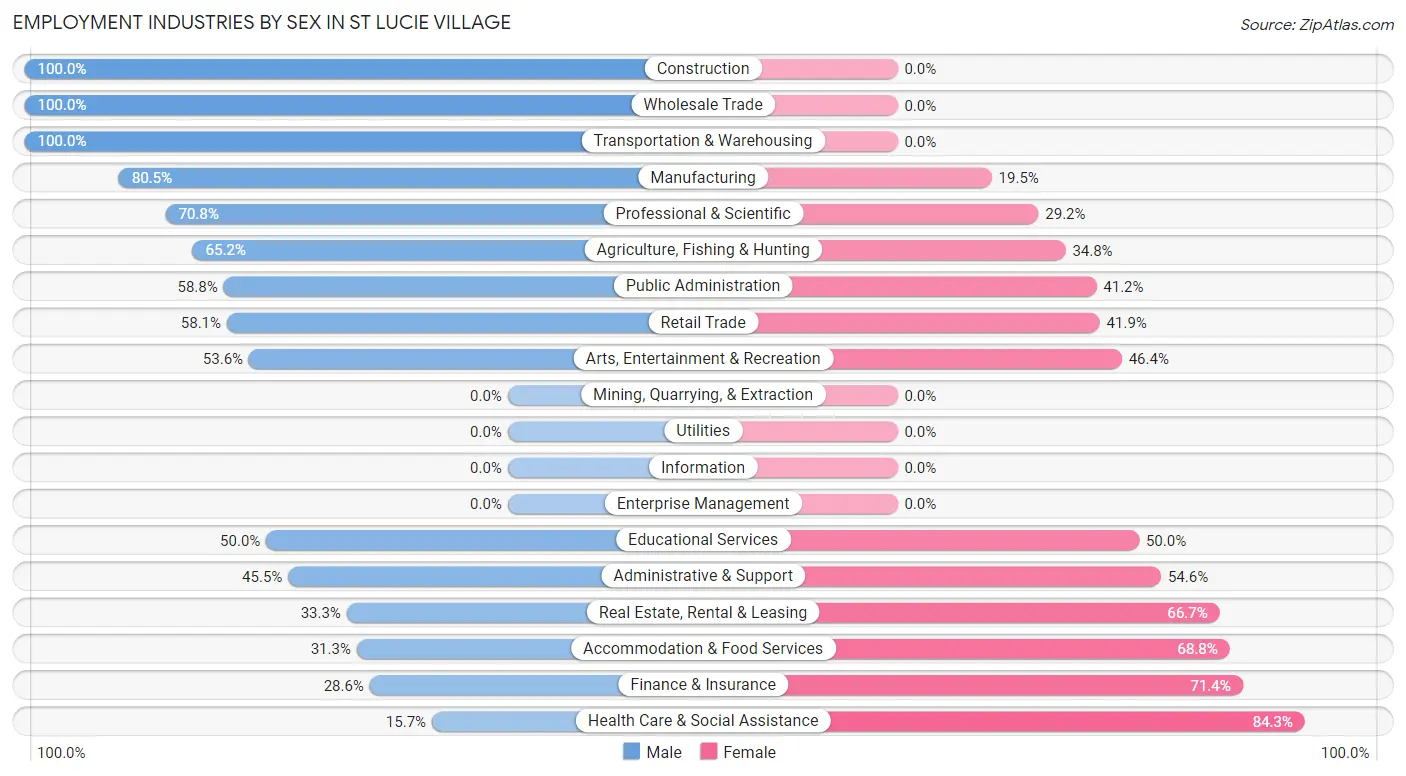
Employment Industries by Sex in St Lucie Village
The St Lucie Village industries that see more men than women are Construction (100.0%), Wholesale Trade (100.0%), and Transportation & Warehousing (100.0%), whereas the industries that tend to have a higher number of women are Health Care & Social Assistance (84.3%), Finance & Insurance (71.4%), and Accommodation & Food Services (68.8%).
| Industry | Male | Female |
| Agriculture, Fishing & Hunting | 15 (65.2%) | 8 (34.8%) |
| Mining, Quarrying, & Extraction | 0 (0.0%) | 0 (0.0%) |
| Construction | 13 (100.0%) | 0 (0.0%) |
| Manufacturing | 33 (80.5%) | 8 (19.5%) |
| Wholesale Trade | 3 (100.0%) | 0 (0.0%) |
| Retail Trade | 25 (58.1%) | 18 (41.9%) |
| Transportation & Warehousing | 7 (100.0%) | 0 (0.0%) |
| Utilities | 0 (0.0%) | 0 (0.0%) |
| Information | 0 (0.0%) | 0 (0.0%) |
| Finance & Insurance | 2 (28.6%) | 5 (71.4%) |
| Real Estate, Rental & Leasing | 3 (33.3%) | 6 (66.7%) |
| Professional & Scientific | 17 (70.8%) | 7 (29.2%) |
| Enterprise Management | 0 (0.0%) | 0 (0.0%) |
| Administrative & Support | 5 (45.5%) | 6 (54.5%) |
| Educational Services | 7 (50.0%) | 7 (50.0%) |
| Health Care & Social Assistance | 8 (15.7%) | 43 (84.3%) |
| Arts, Entertainment & Recreation | 15 (53.6%) | 13 (46.4%) |
| Accommodation & Food Services | 15 (31.2%) | 33 (68.8%) |
| Public Administration | 10 (58.8%) | 7 (41.2%) |
| Total | 187 (53.1%) | 165 (46.9%) |
Education in St Lucie Village
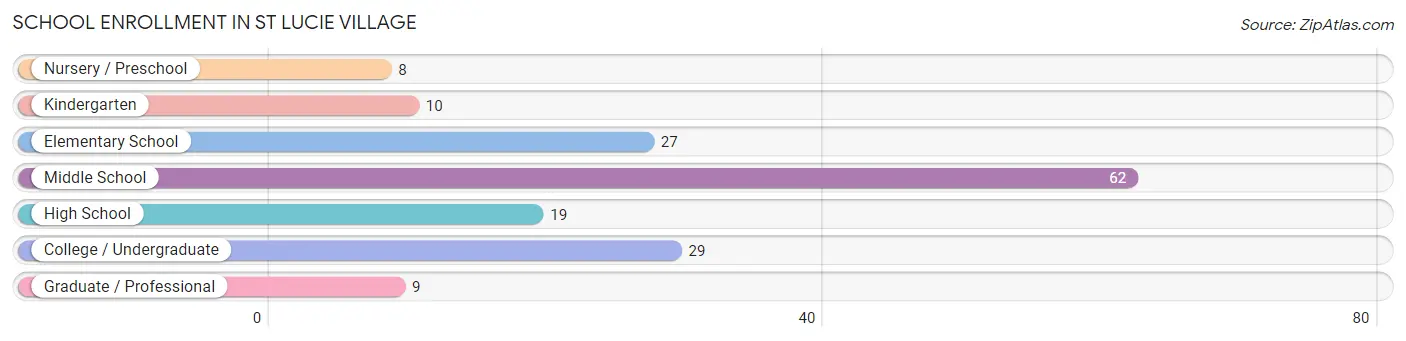
School Enrollment in St Lucie Village
The most common levels of schooling among the 164 students in St Lucie Village are middle school (62 | 37.8%), college / undergraduate (29 | 17.7%), and elementary school (27 | 16.5%).
| School Level | # Students | % Students |
| Nursery / Preschool | 8 | 4.9% |
| Kindergarten | 10 | 6.1% |
| Elementary School | 27 | 16.5% |
| Middle School | 62 | 37.8% |
| High School | 19 | 11.6% |
| College / Undergraduate | 29 | 17.7% |
| Graduate / Professional | 9 | 5.5% |
| Total | 164 | 100.0% |
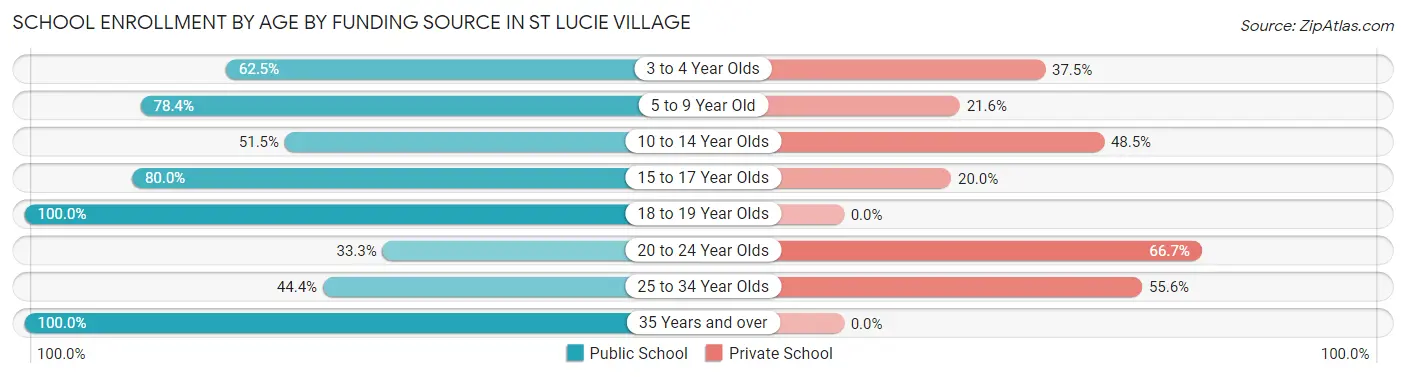
School Enrollment by Age by Funding Source in St Lucie Village
Out of a total of 164 students who are enrolled in schools in St Lucie Village, 55 (33.5%) attend a private institution, while the remaining 109 (66.5%) are enrolled in public schools. The age group of 20 to 24 year olds has the highest likelihood of being enrolled in private schools, with 4 (66.7% in the age bracket) enrolled. Conversely, the age group of 18 to 19 year olds has the lowest likelihood of being enrolled in a private school, with 19 (100.0% in the age bracket) attending a public institution.
| Age Bracket | Public School | Private School |
| 3 to 4 Year Olds | 5 (62.5%) | 3 (37.5%) |
| 5 to 9 Year Old | 29 (78.4%) | 8 (21.6%) |
| 10 to 14 Year Olds | 34 (51.5%) | 32 (48.5%) |
| 15 to 17 Year Olds | 12 (80.0%) | 3 (20.0%) |
| 18 to 19 Year Olds | 19 (100.0%) | 0 (0.0%) |
| 20 to 24 Year Olds | 2 (33.3%) | 4 (66.7%) |
| 25 to 34 Year Olds | 4 (44.4%) | 5 (55.6%) |
| 35 Years and over | 4 (100.0%) | 0 (0.0%) |
| Total | 109 (66.5%) | 55 (33.5%) |
Educational Attainment by Field of Study in St Lucie Village
Science & technology (43 | 21.0%), business (41 | 20.0%), education (31 | 15.1%), psychology (14 | 6.8%), and bio, nature & agricultural (13 | 6.3%) are the most common fields of study among 205 individuals in St Lucie Village who have obtained a bachelor's degree or higher.
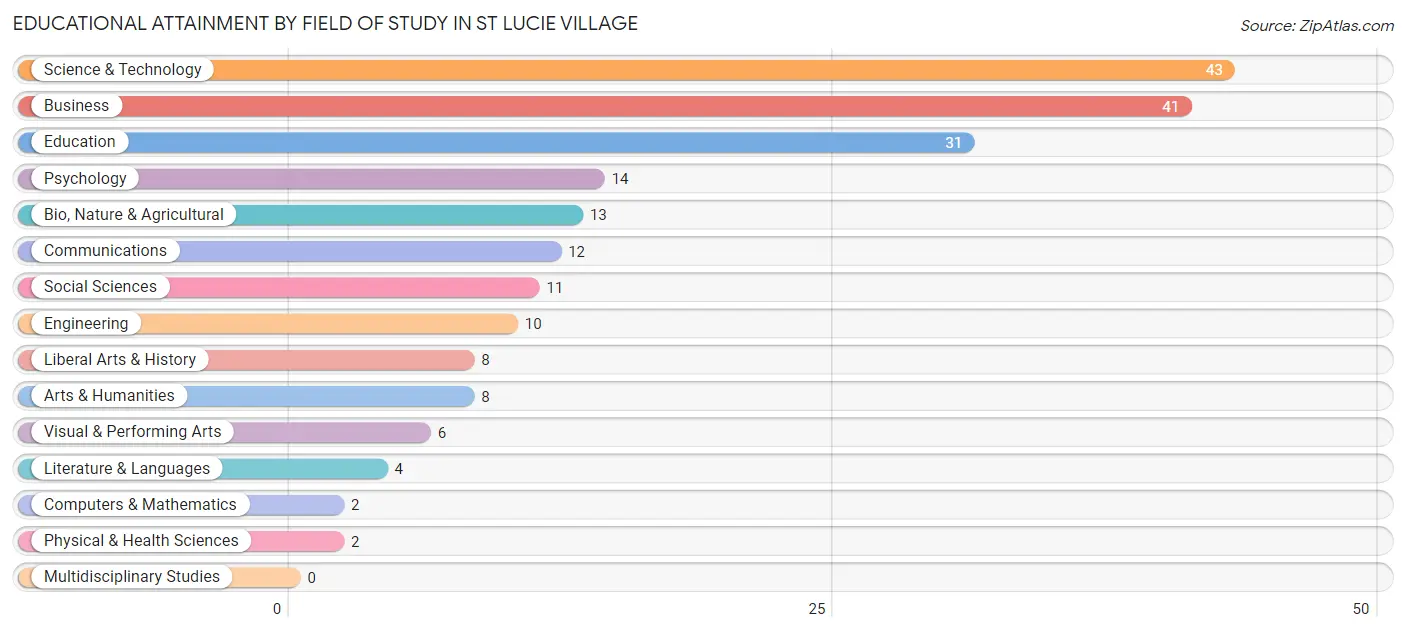
| Field of Study | # Graduates | % Graduates |
| Computers & Mathematics | 2 | 1.0% |
| Bio, Nature & Agricultural | 13 | 6.3% |
| Physical & Health Sciences | 2 | 1.0% |
| Psychology | 14 | 6.8% |
| Social Sciences | 11 | 5.4% |
| Engineering | 10 | 4.9% |
| Multidisciplinary Studies | 0 | 0.0% |
| Science & Technology | 43 | 21.0% |
| Business | 41 | 20.0% |
| Education | 31 | 15.1% |
| Literature & Languages | 4 | 1.9% |
| Liberal Arts & History | 8 | 3.9% |
| Visual & Performing Arts | 6 | 2.9% |
| Communications | 12 | 5.9% |
| Arts & Humanities | 8 | 3.9% |
| Total | 205 | 100.0% |
Transportation & Commute in St Lucie Village
Vehicle Availability by Sex in St Lucie Village
The most prevalent vehicle ownership categories in St Lucie Village are males with 2 vehicles (102, accounting for 53.7%) and females with 2 vehicles (48, making up 61.8%).
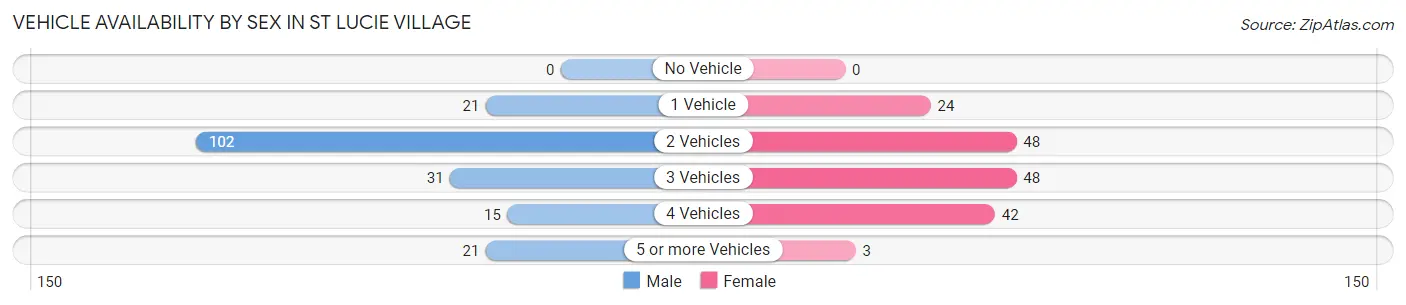
| Vehicles Available | Male | Female |
| No Vehicle | 0 (0.0%) | 0 (0.0%) |
| 1 Vehicle | 21 (11.1%) | 24 (14.5%) |
| 2 Vehicles | 102 (53.7%) | 48 (29.1%) |
| 3 Vehicles | 31 (16.3%) | 48 (29.1%) |
| 4 Vehicles | 15 (7.9%) | 42 (25.5%) |
| 5 or more Vehicles | 21 (11.1%) | 3 (1.8%) |
| Total | 190 (100.0%) | 165 (100.0%) |
Commute Time in St Lucie Village
The most frequently occuring commute durations in St Lucie Village are 10 to 14 minutes (91 commuters, 27.3%), 20 to 24 minutes (78 commuters, 23.4%), and 15 to 19 minutes (51 commuters, 15.3%).
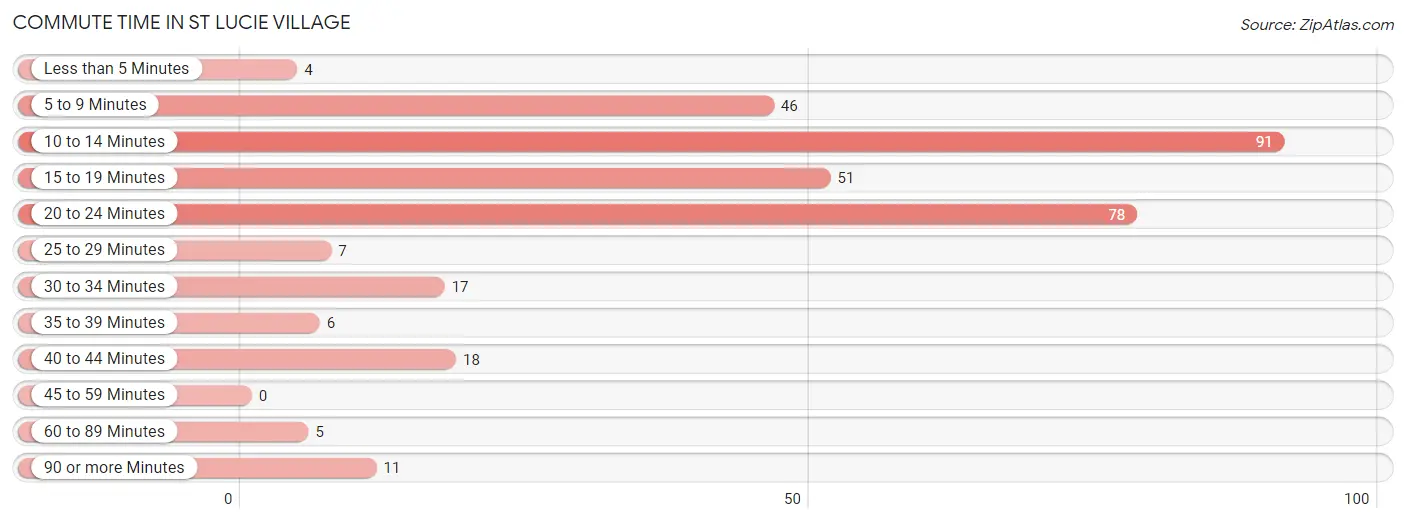
| Commute Time | # Commuters | % Commuters |
| Less than 5 Minutes | 4 | 1.2% |
| 5 to 9 Minutes | 46 | 13.8% |
| 10 to 14 Minutes | 91 | 27.3% |
| 15 to 19 Minutes | 51 | 15.3% |
| 20 to 24 Minutes | 78 | 23.4% |
| 25 to 29 Minutes | 7 | 2.1% |
| 30 to 34 Minutes | 17 | 5.1% |
| 35 to 39 Minutes | 6 | 1.8% |
| 40 to 44 Minutes | 18 | 5.4% |
| 45 to 59 Minutes | 0 | 0.0% |
| 60 to 89 Minutes | 5 | 1.5% |
| 90 or more Minutes | 11 | 3.3% |
Commute Time by Sex in St Lucie Village
The most common commute times in St Lucie Village are 10 to 14 minutes (53 commuters, 29.6%) for males and 10 to 14 minutes (38 commuters, 24.5%) for females.
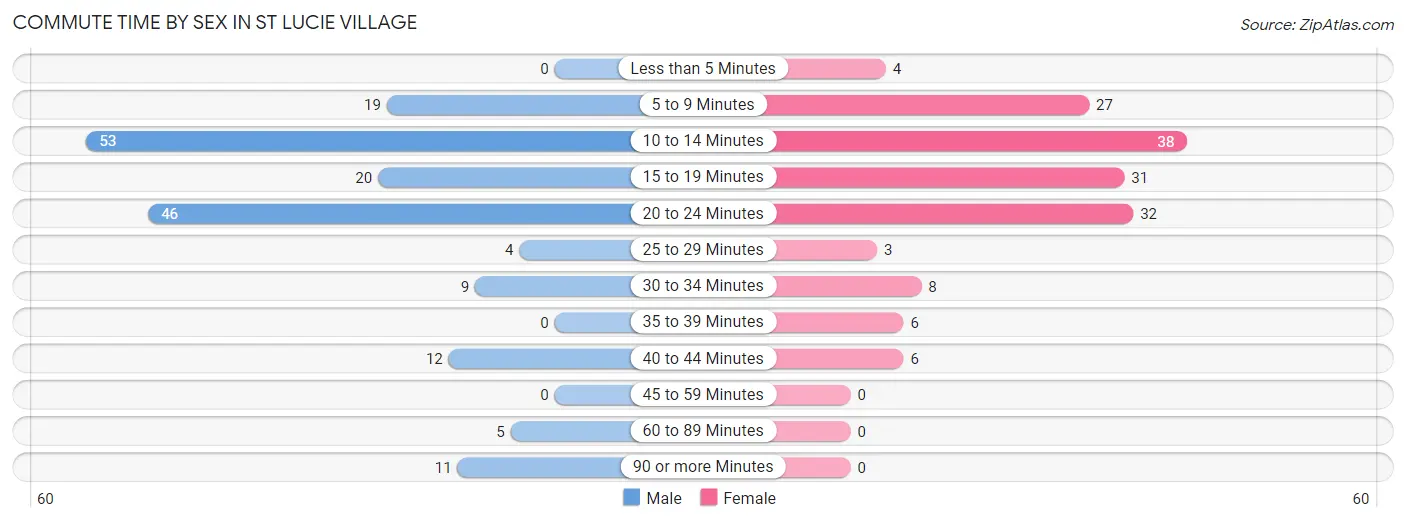
| Commute Time | Male | Female |
| Less than 5 Minutes | 0 (0.0%) | 4 (2.6%) |
| 5 to 9 Minutes | 19 (10.6%) | 27 (17.4%) |
| 10 to 14 Minutes | 53 (29.6%) | 38 (24.5%) |
| 15 to 19 Minutes | 20 (11.2%) | 31 (20.0%) |
| 20 to 24 Minutes | 46 (25.7%) | 32 (20.6%) |
| 25 to 29 Minutes | 4 (2.2%) | 3 (1.9%) |
| 30 to 34 Minutes | 9 (5.0%) | 8 (5.2%) |
| 35 to 39 Minutes | 0 (0.0%) | 6 (3.9%) |
| 40 to 44 Minutes | 12 (6.7%) | 6 (3.9%) |
| 45 to 59 Minutes | 0 (0.0%) | 0 (0.0%) |
| 60 to 89 Minutes | 5 (2.8%) | 0 (0.0%) |
| 90 or more Minutes | 11 (6.1%) | 0 (0.0%) |
Time of Departure to Work by Sex in St Lucie Village
The most frequent times of departure to work in St Lucie Village are 7:00 AM to 7:29 AM (49, 27.4%) for males and 7:00 AM to 7:29 AM (23, 14.8%) for females.
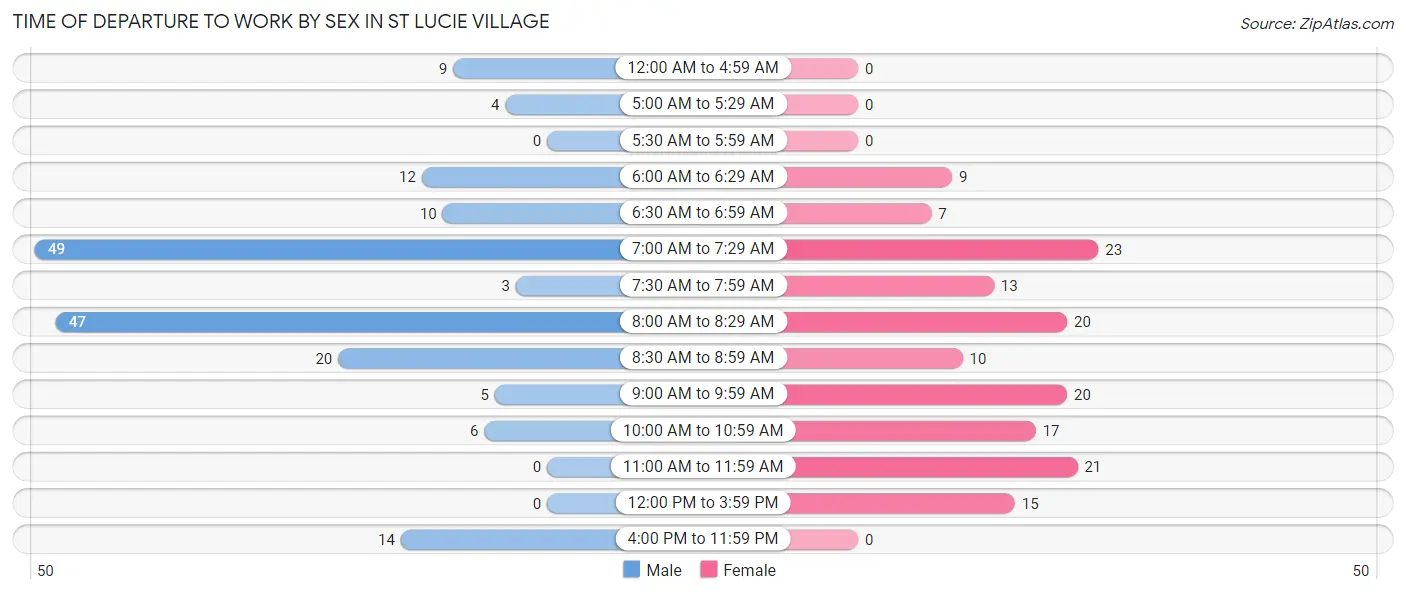
| Time of Departure | Male | Female |
| 12:00 AM to 4:59 AM | 9 (5.0%) | 0 (0.0%) |
| 5:00 AM to 5:29 AM | 4 (2.2%) | 0 (0.0%) |
| 5:30 AM to 5:59 AM | 0 (0.0%) | 0 (0.0%) |
| 6:00 AM to 6:29 AM | 12 (6.7%) | 9 (5.8%) |
| 6:30 AM to 6:59 AM | 10 (5.6%) | 7 (4.5%) |
| 7:00 AM to 7:29 AM | 49 (27.4%) | 23 (14.8%) |
| 7:30 AM to 7:59 AM | 3 (1.7%) | 13 (8.4%) |
| 8:00 AM to 8:29 AM | 47 (26.3%) | 20 (12.9%) |
| 8:30 AM to 8:59 AM | 20 (11.2%) | 10 (6.5%) |
| 9:00 AM to 9:59 AM | 5 (2.8%) | 20 (12.9%) |
| 10:00 AM to 10:59 AM | 6 (3.4%) | 17 (11.0%) |
| 11:00 AM to 11:59 AM | 0 (0.0%) | 21 (13.6%) |
| 12:00 PM to 3:59 PM | 0 (0.0%) | 15 (9.7%) |
| 4:00 PM to 11:59 PM | 14 (7.8%) | 0 (0.0%) |
| Total | 179 (100.0%) | 155 (100.0%) |
Housing Occupancy in St Lucie Village
Occupancy by Ownership in St Lucie Village
Of the total 300 dwellings in St Lucie Village, owner-occupied units account for 244 (81.3%), while renter-occupied units make up 56 (18.7%).
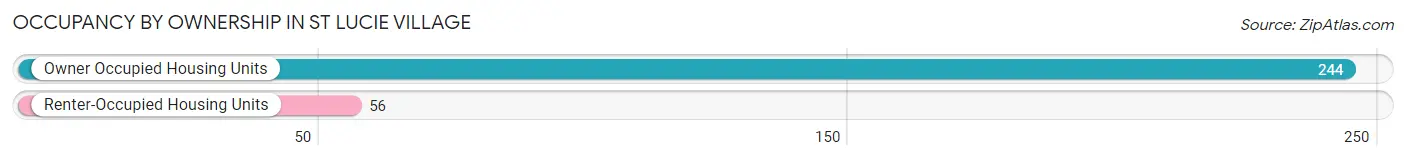
| Occupancy | # Housing Units | % Housing Units |
| Owner Occupied Housing Units | 244 | 81.3% |
| Renter-Occupied Housing Units | 56 | 18.7% |
| Total Occupied Housing Units | 300 | 100.0% |
Occupancy by Household Size in St Lucie Village
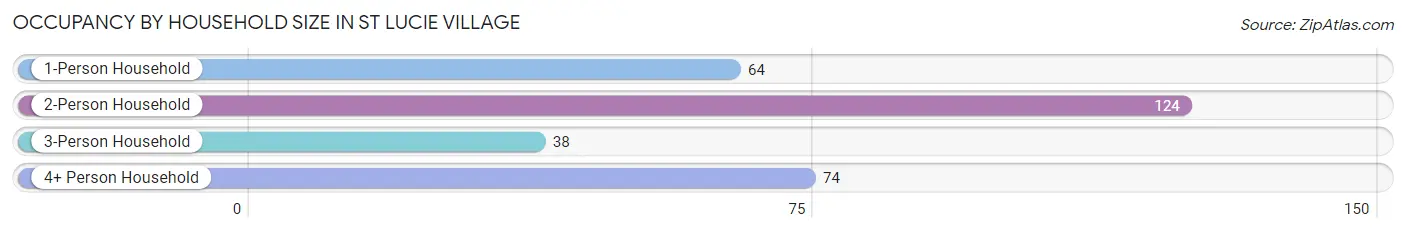
| Household Size | # Housing Units | % Housing Units |
| 1-Person Household | 64 | 21.3% |
| 2-Person Household | 124 | 41.3% |
| 3-Person Household | 38 | 12.7% |
| 4+ Person Household | 74 | 24.7% |
| Total Housing Units | 300 | 100.0% |
Occupancy by Ownership by Household Size in St Lucie Village
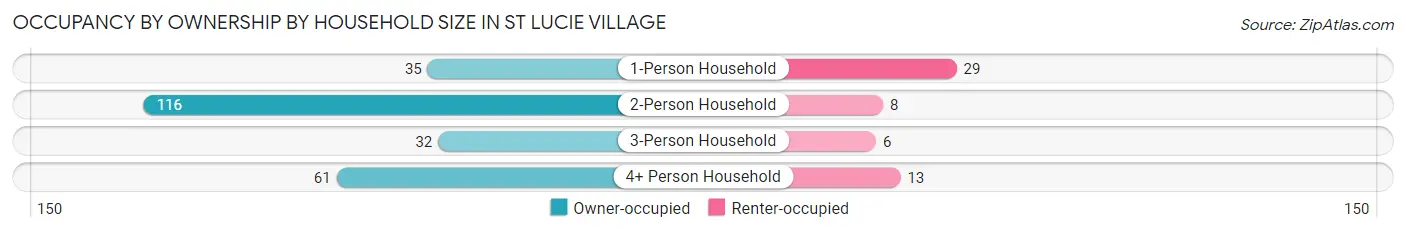
| Household Size | Owner-occupied | Renter-occupied |
| 1-Person Household | 35 (54.7%) | 29 (45.3%) |
| 2-Person Household | 116 (93.5%) | 8 (6.5%) |
| 3-Person Household | 32 (84.2%) | 6 (15.8%) |
| 4+ Person Household | 61 (82.4%) | 13 (17.6%) |
| Total Housing Units | 244 (81.3%) | 56 (18.7%) |
Occupancy by Educational Attainment in St Lucie Village
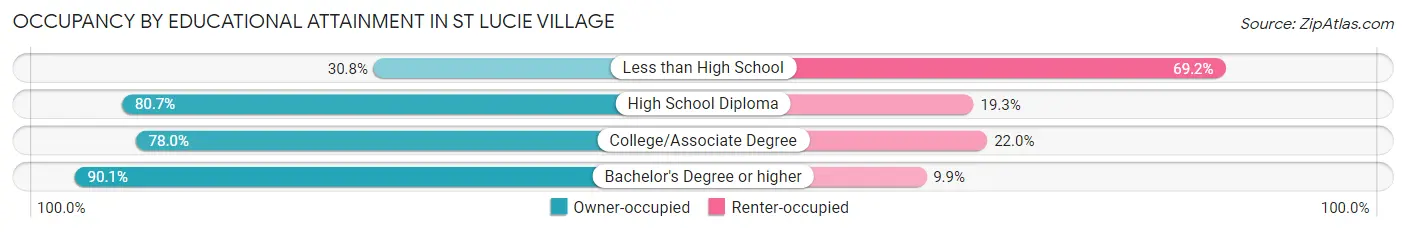
| Household Size | Owner-occupied | Renter-occupied |
| Less than High School | 4 (30.8%) | 9 (69.2%) |
| High School Diploma | 46 (80.7%) | 11 (19.3%) |
| College/Associate Degree | 85 (78.0%) | 24 (22.0%) |
| Bachelor's Degree or higher | 109 (90.1%) | 12 (9.9%) |
Occupancy by Age of Householder in St Lucie Village
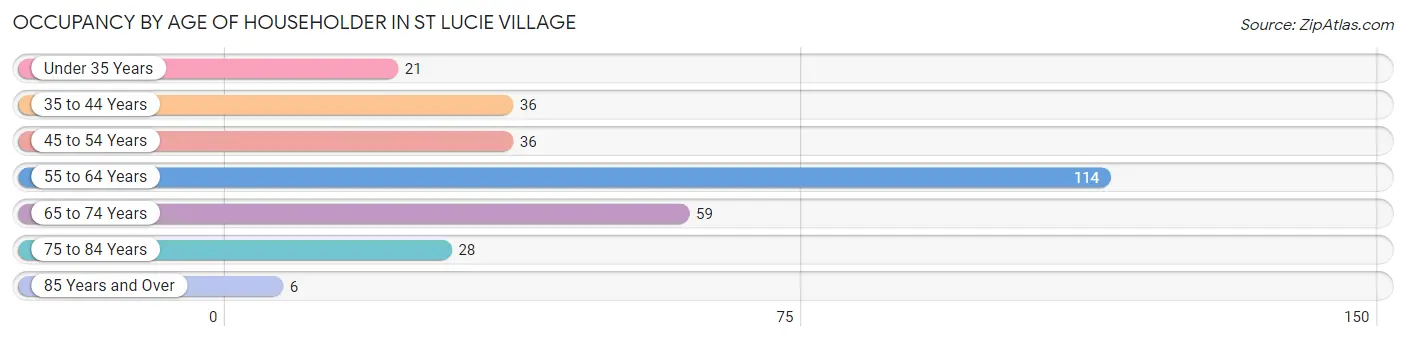
| Age Bracket | # Households | % Households |
| Under 35 Years | 21 | 7.0% |
| 35 to 44 Years | 36 | 12.0% |
| 45 to 54 Years | 36 | 12.0% |
| 55 to 64 Years | 114 | 38.0% |
| 65 to 74 Years | 59 | 19.7% |
| 75 to 84 Years | 28 | 9.3% |
| 85 Years and Over | 6 | 2.0% |
| Total | 300 | 100.0% |
Housing Finances in St Lucie Village
Median Income by Occupancy in St Lucie Village
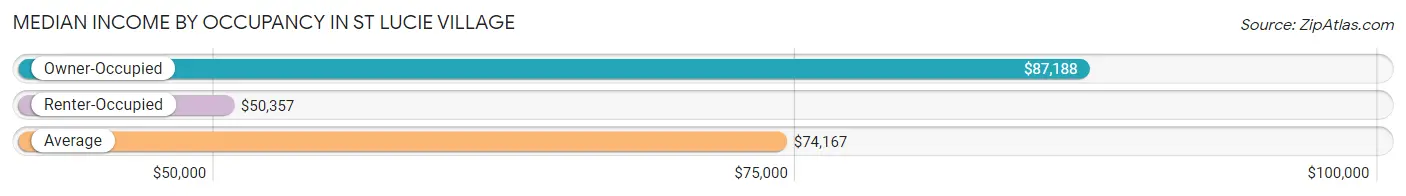
| Occupancy Type | # Households | Median Income |
| Owner-Occupied | 244 (81.3%) | $87,188 |
| Renter-Occupied | 56 (18.7%) | $50,357 |
| Average | 300 (100.0%) | $74,167 |
Occupancy by Householder Income Bracket in St Lucie Village
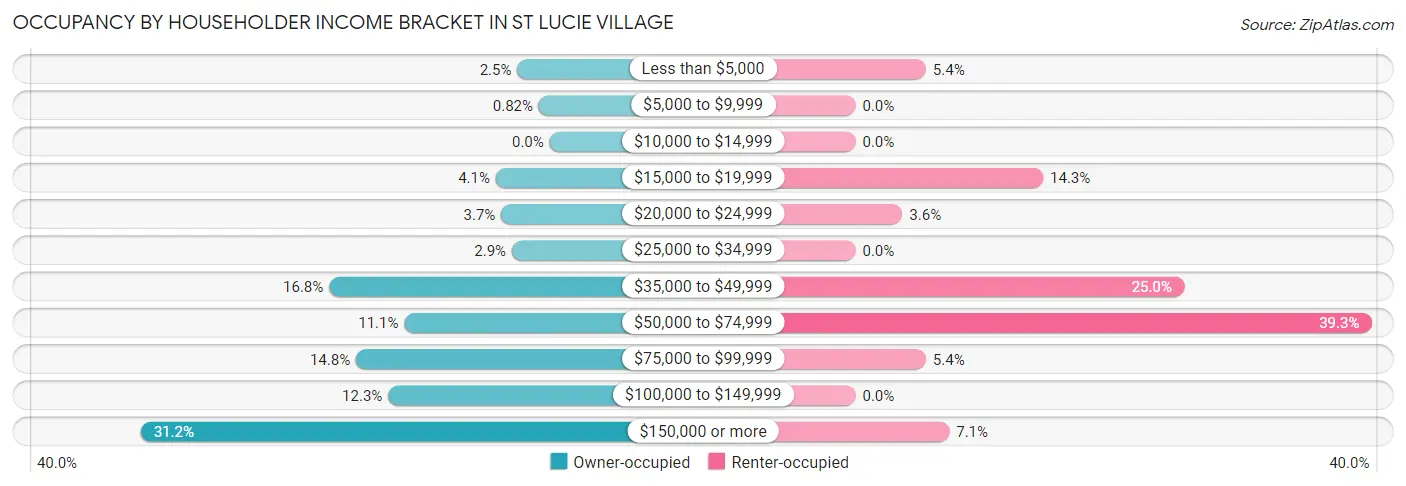
| Income Bracket | Owner-occupied | Renter-occupied |
| Less than $5,000 | 6 (2.5%) | 3 (5.4%) |
| $5,000 to $9,999 | 2 (0.8%) | 0 (0.0%) |
| $10,000 to $14,999 | 0 (0.0%) | 0 (0.0%) |
| $15,000 to $19,999 | 10 (4.1%) | 8 (14.3%) |
| $20,000 to $24,999 | 9 (3.7%) | 2 (3.6%) |
| $25,000 to $34,999 | 7 (2.9%) | 0 (0.0%) |
| $35,000 to $49,999 | 41 (16.8%) | 14 (25.0%) |
| $50,000 to $74,999 | 27 (11.1%) | 22 (39.3%) |
| $75,000 to $99,999 | 36 (14.7%) | 3 (5.4%) |
| $100,000 to $149,999 | 30 (12.3%) | 0 (0.0%) |
| $150,000 or more | 76 (31.1%) | 4 (7.1%) |
| Total | 244 (100.0%) | 56 (100.0%) |
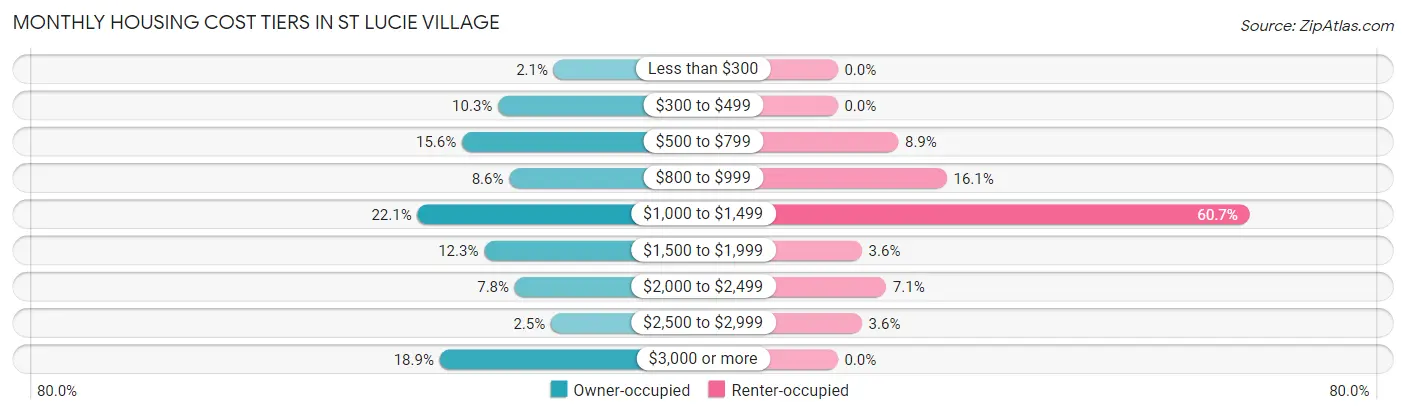
Monthly Housing Cost Tiers in St Lucie Village
| Monthly Cost | Owner-occupied | Renter-occupied |
| Less than $300 | 5 (2.1%) | 0 (0.0%) |
| $300 to $499 | 25 (10.2%) | 0 (0.0%) |
| $500 to $799 | 38 (15.6%) | 5 (8.9%) |
| $800 to $999 | 21 (8.6%) | 9 (16.1%) |
| $1,000 to $1,499 | 54 (22.1%) | 34 (60.7%) |
| $1,500 to $1,999 | 30 (12.3%) | 2 (3.6%) |
| $2,000 to $2,499 | 19 (7.8%) | 4 (7.1%) |
| $2,500 to $2,999 | 6 (2.5%) | 2 (3.6%) |
| $3,000 or more | 46 (18.9%) | 0 (0.0%) |
| Total | 244 (100.0%) | 56 (100.0%) |
Physical Housing Characteristics in St Lucie Village
Housing Structures in St Lucie Village
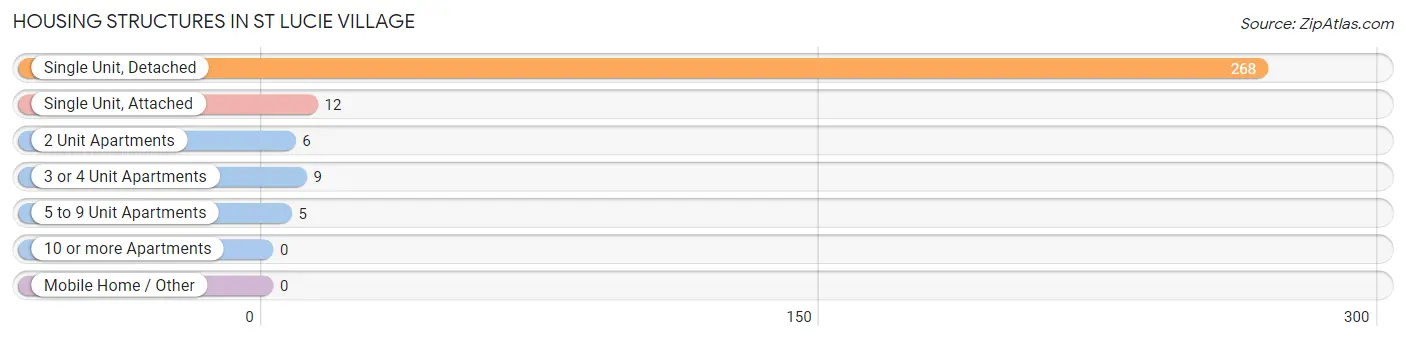
| Structure Type | # Housing Units | % Housing Units |
| Single Unit, Detached | 268 | 89.3% |
| Single Unit, Attached | 12 | 4.0% |
| 2 Unit Apartments | 6 | 2.0% |
| 3 or 4 Unit Apartments | 9 | 3.0% |
| 5 to 9 Unit Apartments | 5 | 1.7% |
| 10 or more Apartments | 0 | 0.0% |
| Mobile Home / Other | 0 | 0.0% |
| Total | 300 | 100.0% |
Housing Structures by Occupancy in St Lucie Village
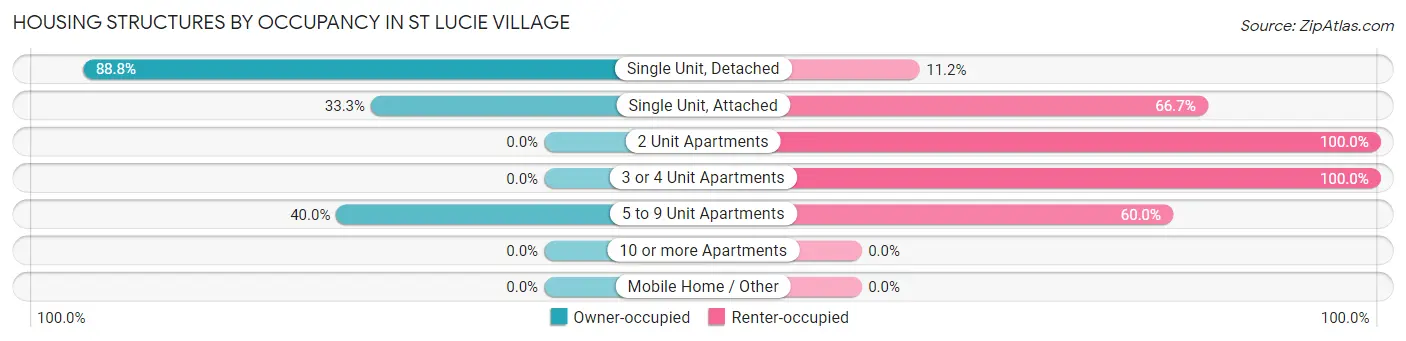
| Structure Type | Owner-occupied | Renter-occupied |
| Single Unit, Detached | 238 (88.8%) | 30 (11.2%) |
| Single Unit, Attached | 4 (33.3%) | 8 (66.7%) |
| 2 Unit Apartments | 0 (0.0%) | 6 (100.0%) |
| 3 or 4 Unit Apartments | 0 (0.0%) | 9 (100.0%) |
| 5 to 9 Unit Apartments | 2 (40.0%) | 3 (60.0%) |
| 10 or more Apartments | 0 (0.0%) | 0 (0.0%) |
| Mobile Home / Other | 0 (0.0%) | 0 (0.0%) |
| Total | 244 (81.3%) | 56 (18.7%) |
Housing Structures by Number of Rooms in St Lucie Village
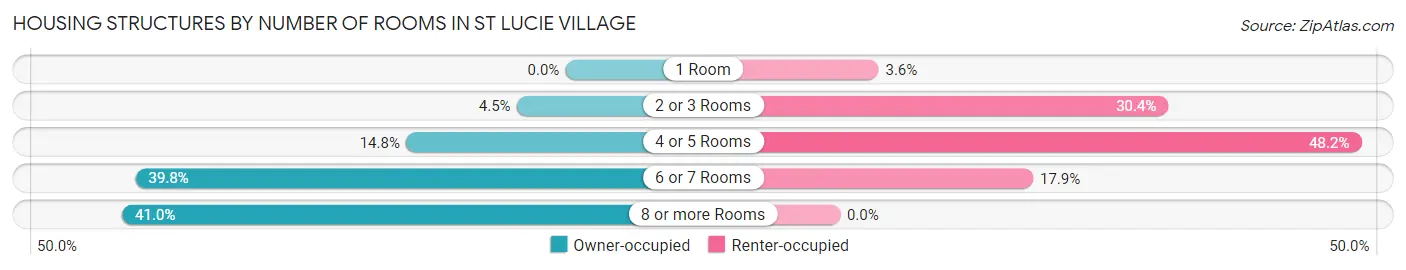
| Number of Rooms | Owner-occupied | Renter-occupied |
| 1 Room | 0 (0.0%) | 2 (3.6%) |
| 2 or 3 Rooms | 11 (4.5%) | 17 (30.4%) |
| 4 or 5 Rooms | 36 (14.7%) | 27 (48.2%) |
| 6 or 7 Rooms | 97 (39.8%) | 10 (17.9%) |
| 8 or more Rooms | 100 (41.0%) | 0 (0.0%) |
| Total | 244 (100.0%) | 56 (100.0%) |
Housing Structure by Heating Type in St Lucie Village
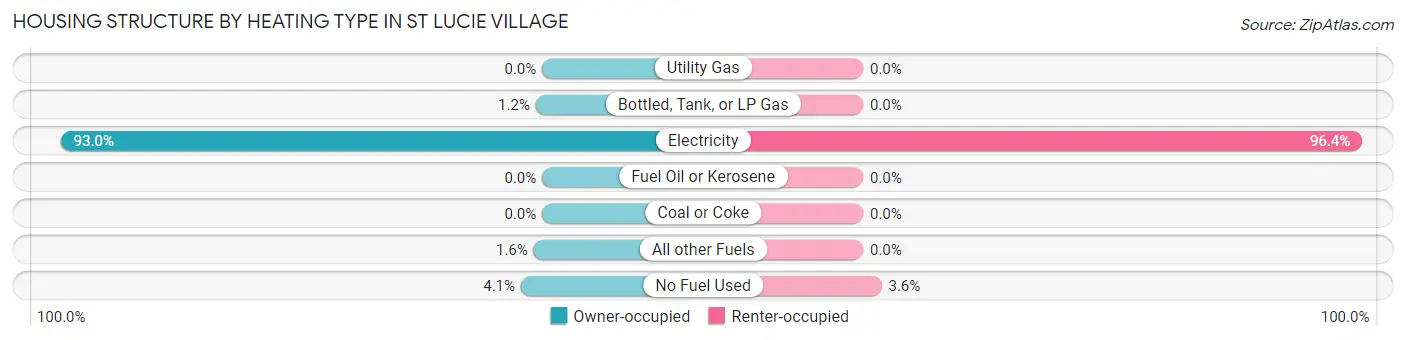
| Heating Type | Owner-occupied | Renter-occupied |
| Utility Gas | 0 (0.0%) | 0 (0.0%) |
| Bottled, Tank, or LP Gas | 3 (1.2%) | 0 (0.0%) |
| Electricity | 227 (93.0%) | 54 (96.4%) |
| Fuel Oil or Kerosene | 0 (0.0%) | 0 (0.0%) |
| Coal or Coke | 0 (0.0%) | 0 (0.0%) |
| All other Fuels | 4 (1.6%) | 0 (0.0%) |
| No Fuel Used | 10 (4.1%) | 2 (3.6%) |
| Total | 244 (100.0%) | 56 (100.0%) |
Household Vehicle Usage in St Lucie Village
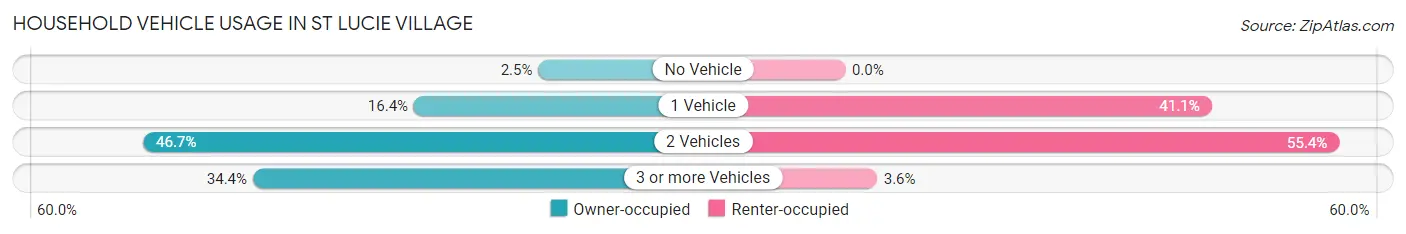
| Vehicles per Household | Owner-occupied | Renter-occupied |
| No Vehicle | 6 (2.5%) | 0 (0.0%) |
| 1 Vehicle | 40 (16.4%) | 23 (41.1%) |
| 2 Vehicles | 114 (46.7%) | 31 (55.4%) |
| 3 or more Vehicles | 84 (34.4%) | 2 (3.6%) |
| Total | 244 (100.0%) | 56 (100.0%) |
Real Estate & Mortgages in St Lucie Village
Real Estate and Mortgage Overview in St Lucie Village
| Characteristic | Without Mortgage | With Mortgage |
| Housing Units | 123 | 121 |
| Median Property Value | $432,500 | $395,000 |
| Median Household Income | $83,125 | $41 |
| Monthly Housing Costs | $746 | $44 |
| Real Estate Taxes | $3,080 | $10 |
Property Value by Mortgage Status in St Lucie Village
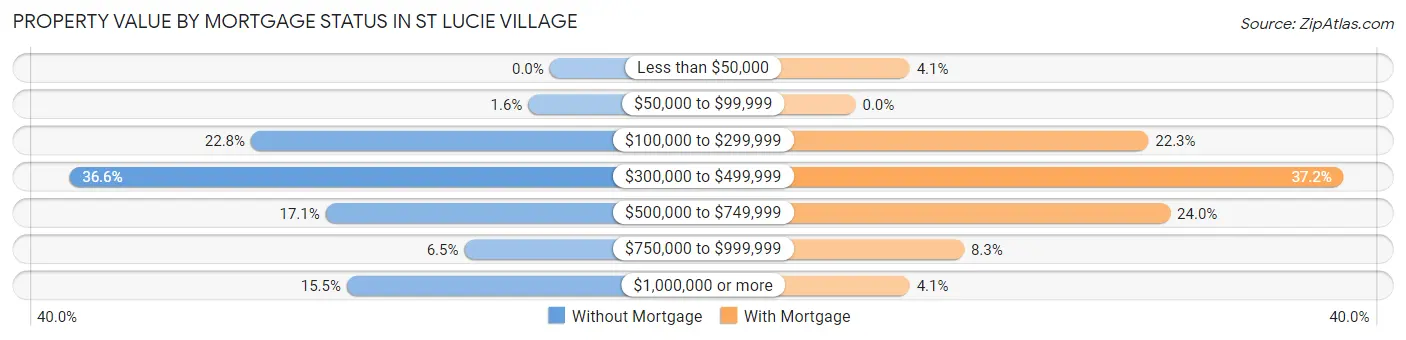
| Property Value | Without Mortgage | With Mortgage |
| Less than $50,000 | 0 (0.0%) | 5 (4.1%) |
| $50,000 to $99,999 | 2 (1.6%) | 0 (0.0%) |
| $100,000 to $299,999 | 28 (22.8%) | 27 (22.3%) |
| $300,000 to $499,999 | 45 (36.6%) | 45 (37.2%) |
| $500,000 to $749,999 | 21 (17.1%) | 29 (24.0%) |
| $750,000 to $999,999 | 8 (6.5%) | 10 (8.3%) |
| $1,000,000 or more | 19 (15.4%) | 5 (4.1%) |
| Total | 123 (100.0%) | 121 (100.0%) |
Household Income by Mortgage Status in St Lucie Village
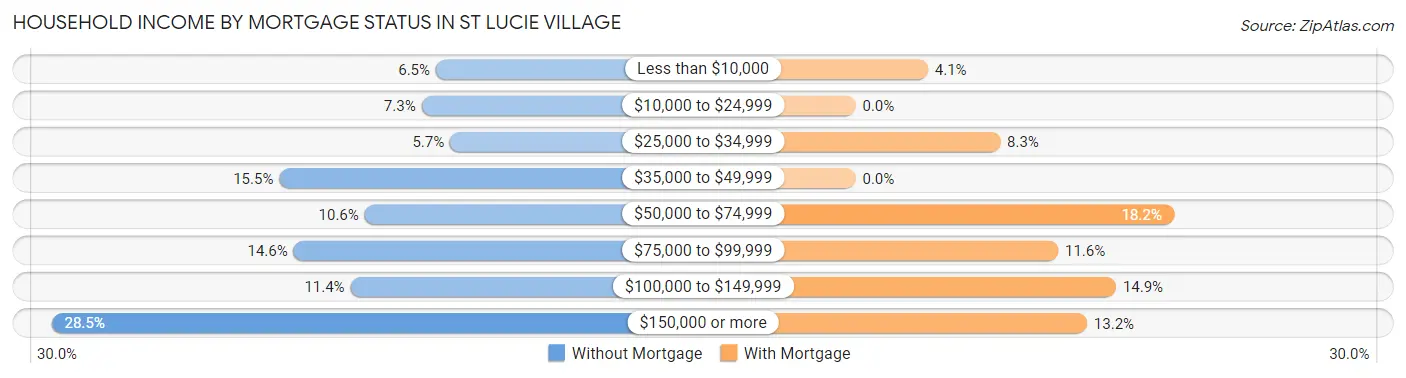
| Household Income | Without Mortgage | With Mortgage |
| Less than $10,000 | 8 (6.5%) | 5 (4.1%) |
| $10,000 to $24,999 | 9 (7.3%) | 0 (0.0%) |
| $25,000 to $34,999 | 7 (5.7%) | 10 (8.3%) |
| $35,000 to $49,999 | 19 (15.4%) | 0 (0.0%) |
| $50,000 to $74,999 | 13 (10.6%) | 22 (18.2%) |
| $75,000 to $99,999 | 18 (14.6%) | 14 (11.6%) |
| $100,000 to $149,999 | 14 (11.4%) | 18 (14.9%) |
| $150,000 or more | 35 (28.5%) | 16 (13.2%) |
| Total | 123 (100.0%) | 121 (100.0%) |
Property Value to Household Income Ratio in St Lucie Village
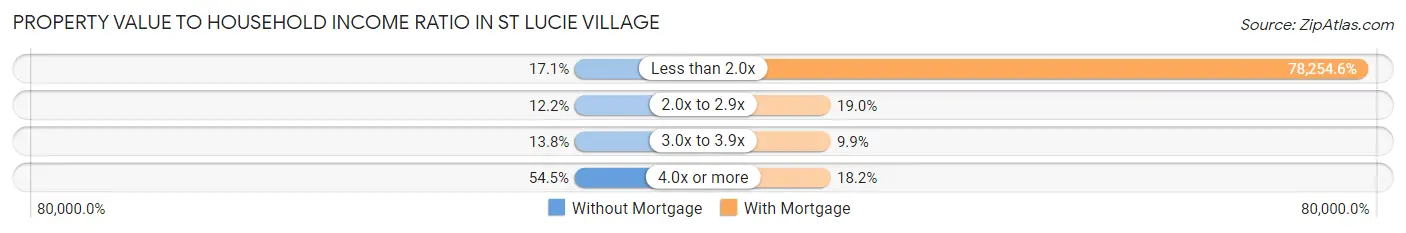
| Value-to-Income Ratio | Without Mortgage | With Mortgage |
| Less than 2.0x | 21 (17.1%) | 94,688 (78,254.5%) |
| 2.0x to 2.9x | 15 (12.2%) | 23 (19.0%) |
| 3.0x to 3.9x | 17 (13.8%) | 12 (9.9%) |
| 4.0x or more | 67 (54.5%) | 22 (18.2%) |
| Total | 123 (100.0%) | 121 (100.0%) |
Real Estate Taxes by Mortgage Status in St Lucie Village
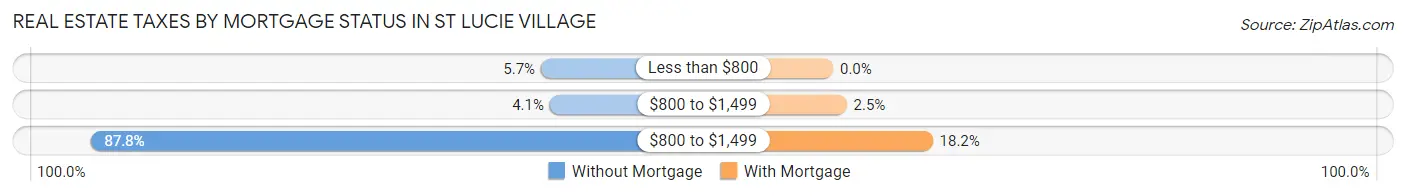
| Property Taxes | Without Mortgage | With Mortgage |
| Less than $800 | 7 (5.7%) | 0 (0.0%) |
| $800 to $1,499 | 5 (4.1%) | 3 (2.5%) |
| $800 to $1,499 | 108 (87.8%) | 22 (18.2%) |
| Total | 123 (100.0%) | 121 (100.0%) |
Health & Disability in St Lucie Village
Health Insurance Coverage by Age in St Lucie Village
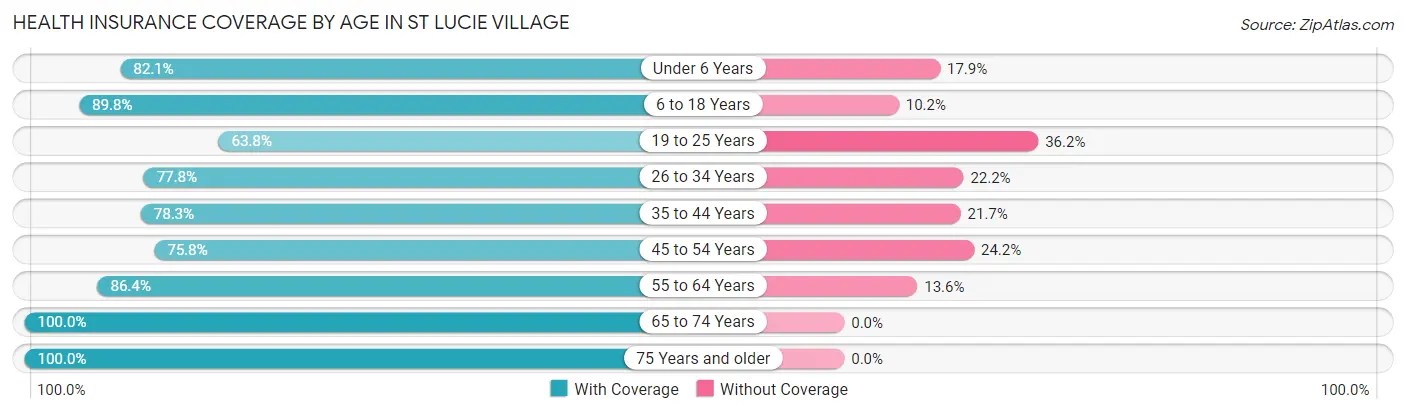
| Age Bracket | With Coverage | Without Coverage |
| Under 6 Years | 46 (82.1%) | 10 (17.9%) |
| 6 to 18 Years | 115 (89.8%) | 13 (10.2%) |
| 19 to 25 Years | 30 (63.8%) | 17 (36.2%) |
| 26 to 34 Years | 56 (77.8%) | 16 (22.2%) |
| 35 to 44 Years | 65 (78.3%) | 18 (21.7%) |
| 45 to 54 Years | 47 (75.8%) | 15 (24.2%) |
| 55 to 64 Years | 165 (86.4%) | 26 (13.6%) |
| 65 to 74 Years | 135 (100.0%) | 0 (0.0%) |
| 75 Years and older | 61 (100.0%) | 0 (0.0%) |
| Total | 720 (86.2%) | 115 (13.8%) |
Health Insurance Coverage by Citizenship Status in St Lucie Village
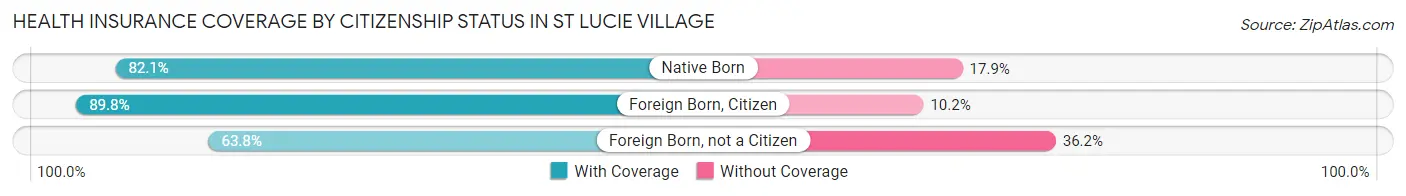
| Citizenship Status | With Coverage | Without Coverage |
| Native Born | 46 (82.1%) | 10 (17.9%) |
| Foreign Born, Citizen | 115 (89.8%) | 13 (10.2%) |
| Foreign Born, not a Citizen | 30 (63.8%) | 17 (36.2%) |
Health Insurance Coverage by Household Income in St Lucie Village
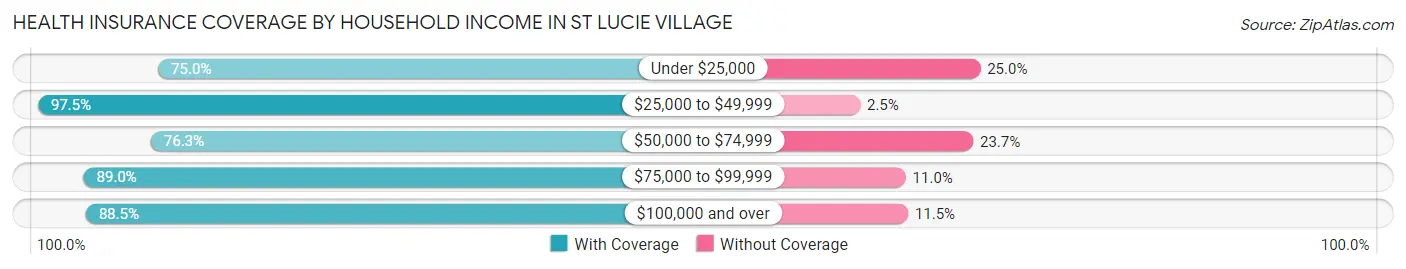
| Household Income | With Coverage | Without Coverage |
| Under $25,000 | 45 (75.0%) | 15 (25.0%) |
| $25,000 to $49,999 | 118 (97.5%) | 3 (2.5%) |
| $50,000 to $74,999 | 142 (76.3%) | 44 (23.7%) |
| $75,000 to $99,999 | 129 (89.0%) | 16 (11.0%) |
| $100,000 and over | 286 (88.5%) | 37 (11.5%) |
Public vs Private Health Insurance Coverage by Age in St Lucie Village
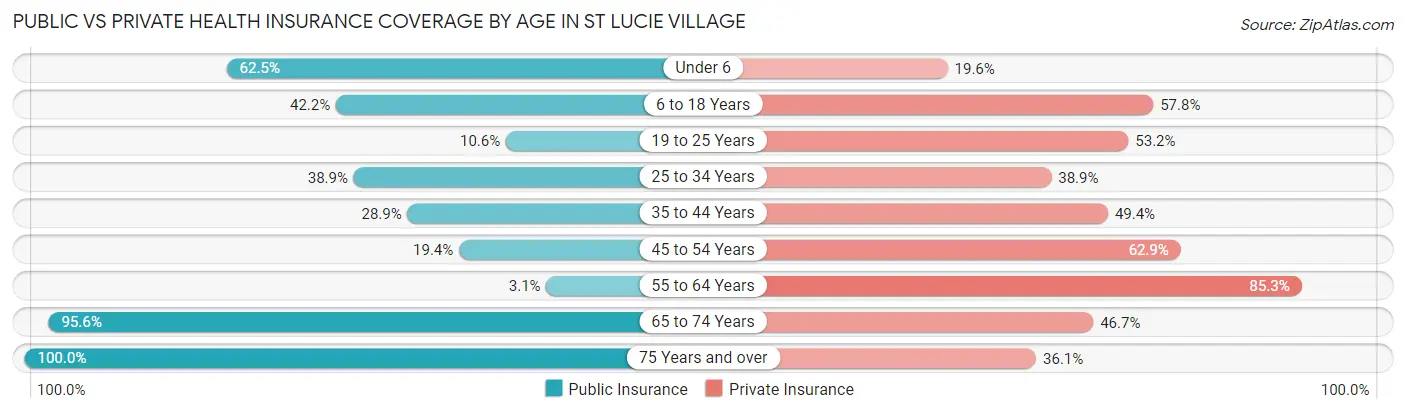
| Age Bracket | Public Insurance | Private Insurance |
| Under 6 | 35 (62.5%) | 11 (19.6%) |
| 6 to 18 Years | 54 (42.2%) | 74 (57.8%) |
| 19 to 25 Years | 5 (10.6%) | 25 (53.2%) |
| 25 to 34 Years | 28 (38.9%) | 28 (38.9%) |
| 35 to 44 Years | 24 (28.9%) | 41 (49.4%) |
| 45 to 54 Years | 12 (19.4%) | 39 (62.9%) |
| 55 to 64 Years | 6 (3.1%) | 163 (85.3%) |
| 65 to 74 Years | 129 (95.6%) | 63 (46.7%) |
| 75 Years and over | 61 (100.0%) | 22 (36.1%) |
| Total | 354 (42.4%) | 466 (55.8%) |
Disability Status by Sex by Age in St Lucie Village
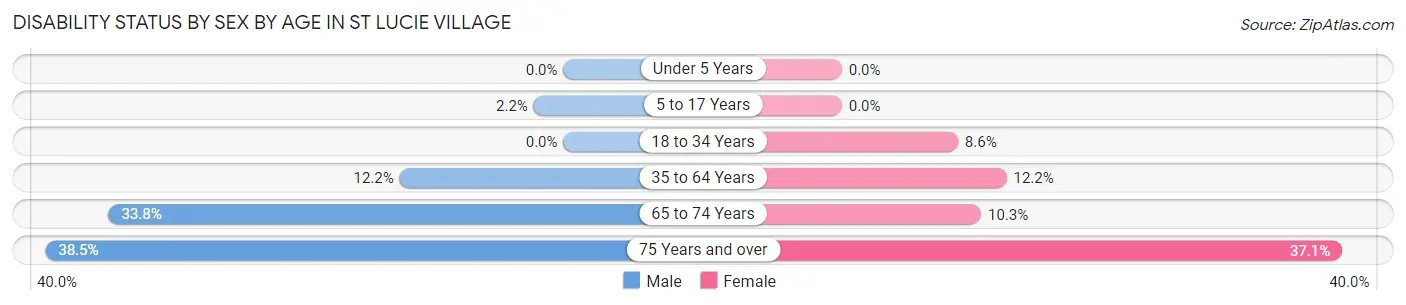
| Age Bracket | Male | Female |
| Under 5 Years | 0 (0.0%) | 0 (0.0%) |
| 5 to 17 Years | 2 (2.2%) | 0 (0.0%) |
| 18 to 34 Years | 0 (0.0%) | 5 (8.6%) |
| 35 to 64 Years | 18 (12.2%) | 23 (12.2%) |
| 65 to 74 Years | 26 (33.8%) | 6 (10.3%) |
| 75 Years and over | 10 (38.5%) | 13 (37.1%) |
Disability Class by Sex by Age in St Lucie Village
Disability Class: Hearing Difficulty
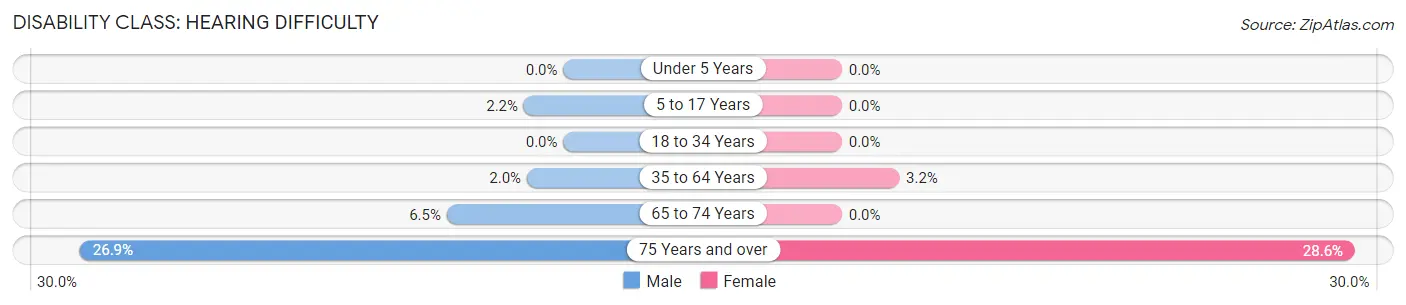
| Age Bracket | Male | Female |
| Under 5 Years | 0 (0.0%) | 0 (0.0%) |
| 5 to 17 Years | 2 (2.2%) | 0 (0.0%) |
| 18 to 34 Years | 0 (0.0%) | 0 (0.0%) |
| 35 to 64 Years | 3 (2.0%) | 6 (3.2%) |
| 65 to 74 Years | 5 (6.5%) | 0 (0.0%) |
| 75 Years and over | 7 (26.9%) | 10 (28.6%) |
Disability Class: Vision Difficulty
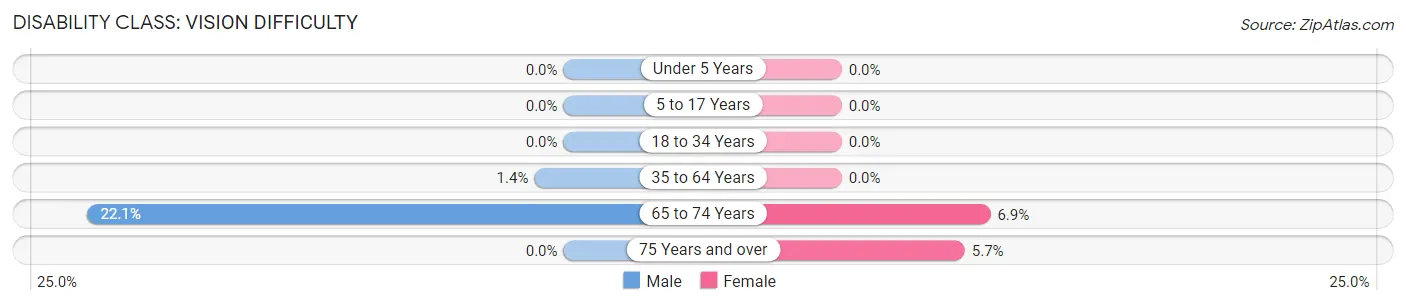
| Age Bracket | Male | Female |
| Under 5 Years | 0 (0.0%) | 0 (0.0%) |
| 5 to 17 Years | 0 (0.0%) | 0 (0.0%) |
| 18 to 34 Years | 0 (0.0%) | 0 (0.0%) |
| 35 to 64 Years | 2 (1.3%) | 0 (0.0%) |
| 65 to 74 Years | 17 (22.1%) | 4 (6.9%) |
| 75 Years and over | 0 (0.0%) | 2 (5.7%) |
Disability Class: Cognitive Difficulty
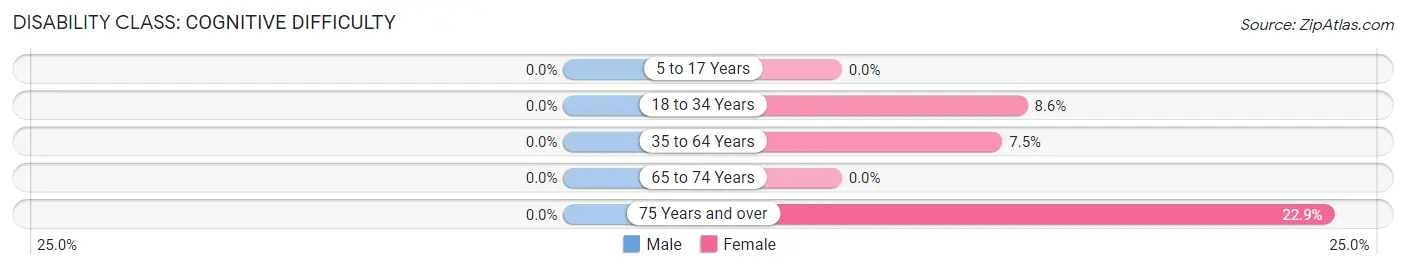
| Age Bracket | Male | Female |
| 5 to 17 Years | 0 (0.0%) | 0 (0.0%) |
| 18 to 34 Years | 0 (0.0%) | 5 (8.6%) |
| 35 to 64 Years | 0 (0.0%) | 14 (7.4%) |
| 65 to 74 Years | 0 (0.0%) | 0 (0.0%) |
| 75 Years and over | 0 (0.0%) | 8 (22.9%) |
Disability Class: Ambulatory Difficulty
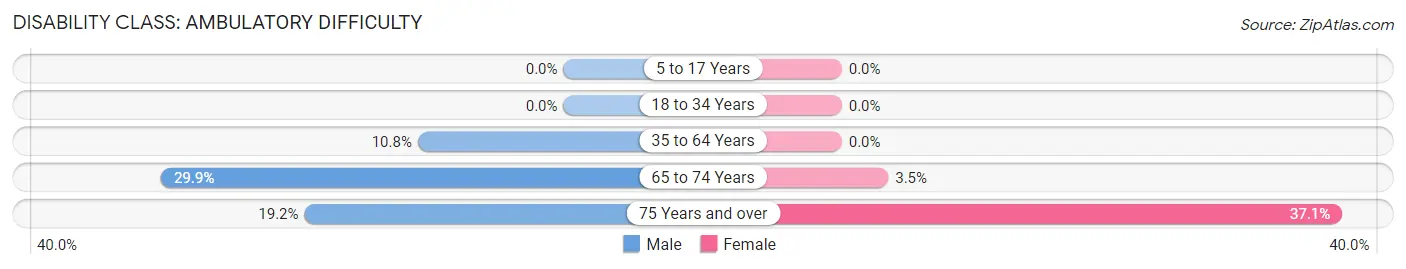
| Age Bracket | Male | Female |
| 5 to 17 Years | 0 (0.0%) | 0 (0.0%) |
| 18 to 34 Years | 0 (0.0%) | 0 (0.0%) |
| 35 to 64 Years | 16 (10.8%) | 0 (0.0%) |
| 65 to 74 Years | 23 (29.9%) | 2 (3.5%) |
| 75 Years and over | 5 (19.2%) | 13 (37.1%) |
Disability Class: Self-Care Difficulty
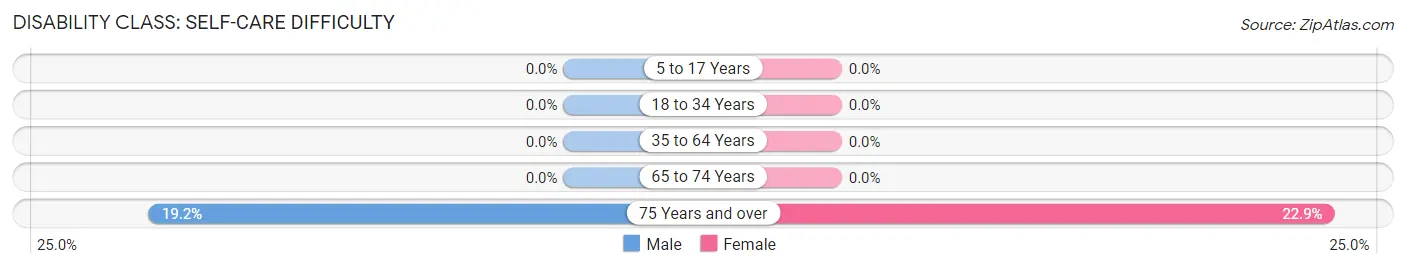
| Age Bracket | Male | Female |
| 5 to 17 Years | 0 (0.0%) | 0 (0.0%) |
| 18 to 34 Years | 0 (0.0%) | 0 (0.0%) |
| 35 to 64 Years | 0 (0.0%) | 0 (0.0%) |
| 65 to 74 Years | 0 (0.0%) | 0 (0.0%) |
| 75 Years and over | 5 (19.2%) | 8 (22.9%) |
Technology Access in St Lucie Village
Computing Device Access in St Lucie Village
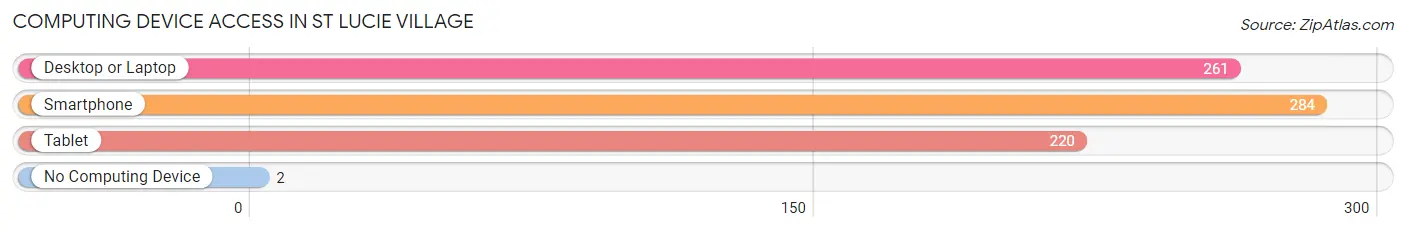
| Device Type | # Households | % Households |
| Desktop or Laptop | 261 | 87.0% |
| Smartphone | 284 | 94.7% |
| Tablet | 220 | 73.3% |
| No Computing Device | 2 | 0.7% |
| Total | 300 | 100.0% |
Internet Access in St Lucie Village
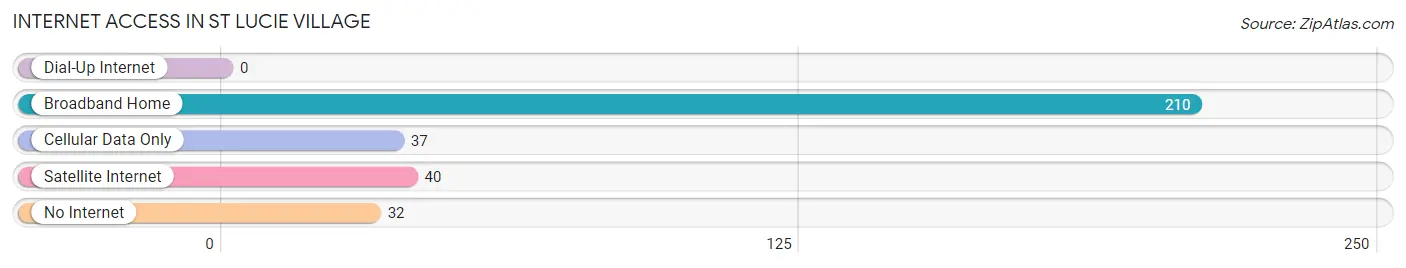
| Internet Type | # Households | % Households |
| Dial-Up Internet | 0 | 0.0% |
| Broadband Home | 210 | 70.0% |
| Cellular Data Only | 37 | 12.3% |
| Satellite Internet | 40 | 13.3% |
| No Internet | 32 | 10.7% |
| Total | 300 | 100.0% |
St Lucie Village Summary
St Lucie Village is a small village located in St Lucie County, Florida. It is situated on the Indian River Lagoon, just south of Fort Pierce. The village is home to a population of just over 1,000 people, and is a popular destination for tourists and locals alike.
History
St Lucie Village was first settled in the late 1800s by a group of settlers from the Bahamas. The settlers were attracted to the area due to its abundance of fish and wildlife, and the fact that it was close to the Indian River Lagoon. The village was originally known as “St Lucie Point”, and was named after the nearby St Lucie River.
In the early 1900s, the village began to grow and develop. The first post office was established in 1910, and the first school was built in 1912. The village was incorporated in 1925, and the first mayor was elected in 1926.
In the 1950s, the village began to experience a period of growth and development. The population increased from just over 500 in 1950 to over 1,000 in 1960. This growth was largely due to the influx of tourists and retirees who were attracted to the area’s natural beauty and recreational opportunities.
Geography
St Lucie Village is located in St Lucie County, Florida. It is situated on the Indian River Lagoon, just south of Fort Pierce. The village is bordered by the Indian River Lagoon to the east, the St Lucie River to the west, and the Atlantic Ocean to the south.
The village is located in a subtropical climate, with hot, humid summers and mild winters. The average temperature in the summer is around 90°F, and the average temperature in the winter is around 70°F.
Economy
The economy of St Lucie Village is largely based on tourism and fishing. The village is a popular destination for tourists, who come to enjoy the area’s natural beauty and recreational opportunities. The village is also home to several marinas, which provide fishing charters and boat rentals.
In addition to tourism and fishing, the village is also home to several small businesses, including restaurants, shops, and other services. The village is also home to a number of art galleries, which showcase the work of local artists.
Demographics
As of the 2010 census, the population of St Lucie Village was 1,072. The population is largely white (90.2%), with a small percentage of African Americans (4.2%), Hispanics (2.7%), and other races (2.9%). The median household income is $41,250, and the median age is 44.
Conclusion
St Lucie Village is a small village located in St Lucie County, Florida. It is situated on the Indian River Lagoon, just south of Fort Pierce. The village is home to a population of just over 1,000 people, and is a popular destination for tourists and locals alike. The economy of the village is largely based on tourism and fishing, and the village is home to several small businesses, art galleries, and marinas. The population is largely white, with a small percentage of African Americans, Hispanics, and other races.
Common Questions
What is Per Capita Income in St Lucie Village?
Per Capita income in St Lucie Village is $44,324.
What is the Median Family Income in St Lucie Village?
Median Family Income in St Lucie Village is $90,000.
What is the Median Household income in St Lucie Village?
Median Household Income in St Lucie Village is $74,167.
What is Income or Wage Gap in St Lucie Village?
Income or Wage Gap in St Lucie Village is 28.3%.
Women in St Lucie Village earn 71.7 cents for every dollar earned by a man.
What is Inequality or Gini Index in St Lucie Village?
Inequality or Gini Index in St Lucie Village is 0.52.
What is the Total Population of St Lucie Village?
Total Population of St Lucie Village is 838.
What is the Total Male Population of St Lucie Village?
Total Male Population of St Lucie Village is 432.
What is the Total Female Population of St Lucie Village?
Total Female Population of St Lucie Village is 406.
What is the Ratio of Males per 100 Females in St Lucie Village?
There are 106.40 Males per 100 Females in St Lucie Village.
What is the Ratio of Females per 100 Males in St Lucie Village?
There are 93.98 Females per 100 Males in St Lucie Village.
What is the Median Population Age in St Lucie Village?
Median Population Age in St Lucie Village is 48.7 Years.
What is the Average Family Size in St Lucie Village
Average Family Size in St Lucie Village is 3.1 People.
What is the Average Household Size in St Lucie Village
Average Household Size in St Lucie Village is 2.8 People.
How Large is the Labor Force in St Lucie Village?
There are 366 People in the Labor Forcein in St Lucie Village.
What is the Percentage of People in the Labor Force in St Lucie Village?
54.5% of People are in the Labor Force in St Lucie Village.
What is the Unemployment Rate in St Lucie Village?
Unemployment Rate in St Lucie Village is 3.0%.