Zip Codes with the Highest Percentage of Population Employed in Food Preparation & Serving in Florida
RELATED REPORTS & OPTIONS
Food Preparation & Serving
Florida
Compare Zip Codes
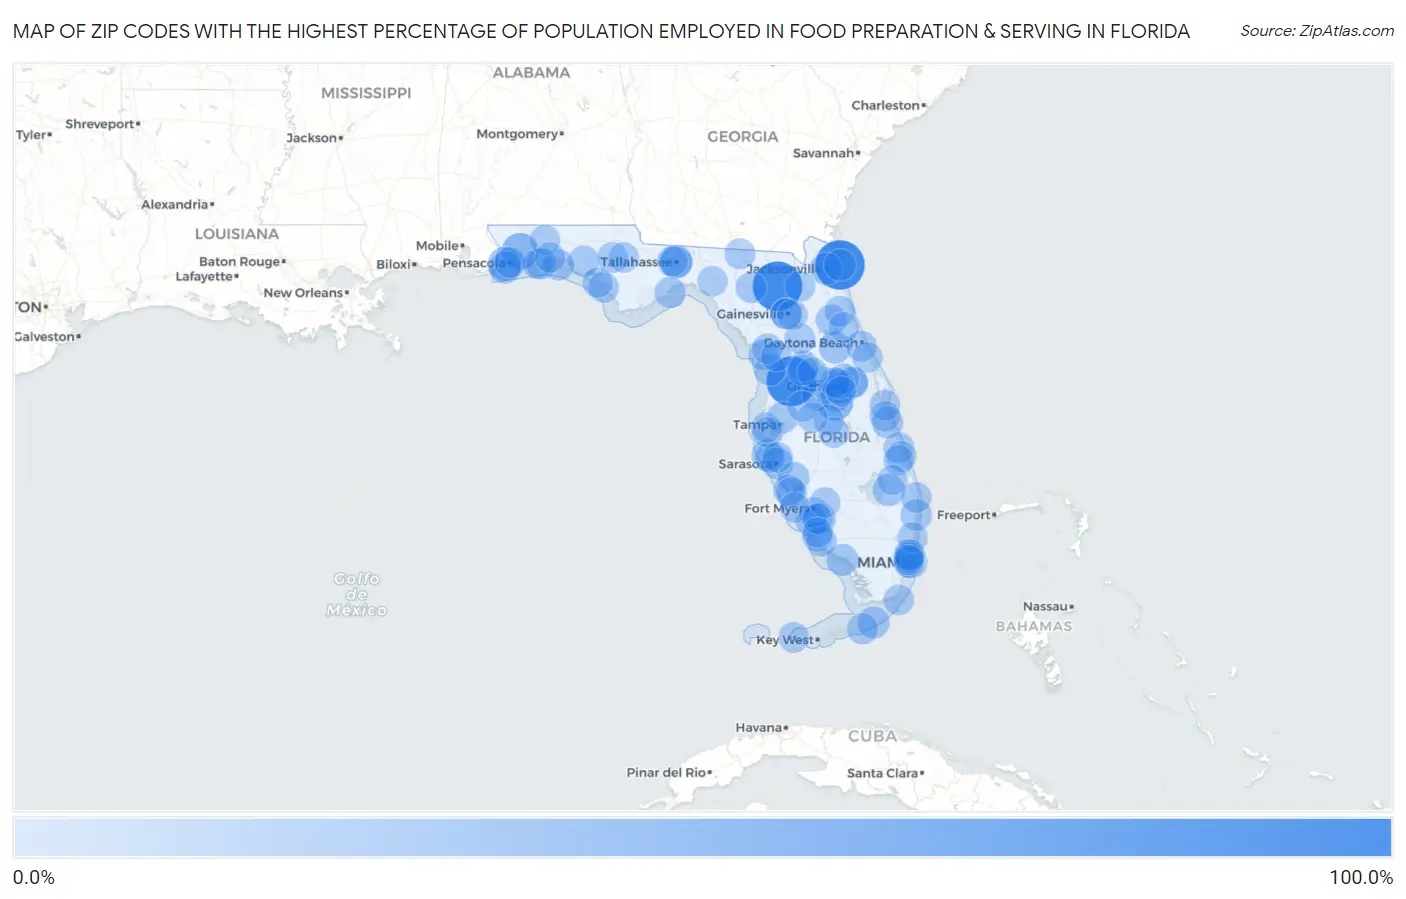
Map of Zip Codes with the Highest Percentage of Population Employed in Food Preparation & Serving in Florida
0.0%
100.0%
Zip Codes with the Highest Percentage of Population Employed in Food Preparation & Serving in Florida
| Zip Code | % Employed | vs State | vs National | |
| 1. | 34661 | 100.0% | 6.1%(+93.9)#1 | 5.3%(+94.7)#2 |
| 2. | 32228 | 100.0% | 6.1%(+93.9)#2 | 5.3%(+94.7)#4 |
| 3. | 32061 | 100.0% | 6.1%(+93.9)#3 | 5.3%(+94.7)#9 |
| 4. | 32530 | 38.1% | 6.1%(+32.0)#4 | 5.3%(+32.8)#113 |
| 5. | 33848 | 37.3% | 6.1%(+31.2)#5 | 5.3%(+32.0)#125 |
| 6. | 32511 | 26.2% | 6.1%(+20.1)#6 | 5.3%(+20.9)#282 |
| 7. | 32306 | 21.1% | 6.1%(+15.0)#7 | 5.3%(+15.8)#458 |
| 8. | 32202 | 19.1% | 6.1%(+13.0)#8 | 5.3%(+13.8)#559 |
| 9. | 33438 | 18.8% | 6.1%(+12.7)#9 | 5.3%(+13.5)#580 |
| 10. | 32102 | 18.7% | 6.1%(+12.6)#10 | 5.3%(+13.4)#599 |
| 11. | 32508 | 17.6% | 6.1%(+11.5)#11 | 5.3%(+12.3)#690 |
| 12. | 34138 | 17.4% | 6.1%(+11.3)#12 | 5.3%(+12.1)#711 |
| 13. | 33001 | 17.1% | 6.1%(+11.0)#13 | 5.3%(+11.8)#735 |
| 14. | 32307 | 16.8% | 6.1%(+10.7)#14 | 5.3%(+11.5)#767 |
| 15. | 33965 | 16.4% | 6.1%(+10.3)#15 | 5.3%(+11.1)#812 |
| 16. | 32227 | 16.4% | 6.1%(+10.3)#16 | 5.3%(+11.1)#814 |
| 17. | 33139 | 16.2% | 6.1%(+10.1)#17 | 5.3%(+10.9)#831 |
| 18. | 32816 | 16.1% | 6.1%(+10.0)#18 | 5.3%(+10.8)#849 |
| 19. | 34215 | 16.0% | 6.1%(+9.93)#19 | 5.3%(+10.7)#862 |
| 20. | 34237 | 15.5% | 6.1%(+9.41)#20 | 5.3%(+10.2)#916 |
| 21. | 34448 | 14.8% | 6.1%(+8.67)#21 | 5.3%(+9.47)#1,015 |
| 22. | 33435 | 14.7% | 6.1%(+8.61)#22 | 5.3%(+9.41)#1,031 |
| 23. | 32950 | 14.7% | 6.1%(+8.60)#23 | 5.3%(+9.40)#1,034 |
| 24. | 33620 | 14.7% | 6.1%(+8.58)#24 | 5.3%(+9.38)#1,037 |
| 25. | 32603 | 14.1% | 6.1%(+8.05)#25 | 5.3%(+8.86)#1,137 |
| 26. | 34756 | 13.7% | 6.1%(+7.59)#26 | 5.3%(+8.39)#1,236 |
| 27. | 32437 | 13.6% | 6.1%(+7.55)#27 | 5.3%(+8.35)#1,244 |
| 28. | 33931 | 13.5% | 6.1%(+7.40)#28 | 5.3%(+8.20)#1,281 |
| 29. | 34291 | 13.3% | 6.1%(+7.23)#29 | 5.3%(+8.04)#1,315 |
| 30. | 32346 | 13.3% | 6.1%(+7.20)#30 | 5.3%(+8.01)#1,319 |
| 31. | 33051 | 13.2% | 6.1%(+7.07)#31 | 5.3%(+7.87)#1,352 |
| 32. | 34714 | 13.0% | 6.1%(+6.93)#32 | 5.3%(+7.73)#1,389 |
| 33. | 32501 | 13.0% | 6.1%(+6.92)#33 | 5.3%(+7.73)#1,390 |
| 34. | 32187 | 12.9% | 6.1%(+6.81)#34 | 5.3%(+7.62)#1,416 |
| 35. | 34498 | 12.8% | 6.1%(+6.73)#35 | 5.3%(+7.53)#1,435 |
| 36. | 32821 | 12.8% | 6.1%(+6.69)#36 | 5.3%(+7.50)#1,446 |
| 37. | 32071 | 12.8% | 6.1%(+6.68)#37 | 5.3%(+7.48)#1,447 |
| 38. | 32550 | 12.7% | 6.1%(+6.61)#38 | 5.3%(+7.42)#1,466 |
| 39. | 34785 | 12.7% | 6.1%(+6.56)#39 | 5.3%(+7.37)#1,481 |
| 40. | 34224 | 12.6% | 6.1%(+6.55)#40 | 5.3%(+7.36)#1,483 |
| 41. | 32548 | 12.6% | 6.1%(+6.49)#41 | 5.3%(+7.29)#1,499 |
| 42. | 32119 | 12.3% | 6.1%(+6.24)#42 | 5.3%(+7.05)#1,560 |
| 43. | 33521 | 12.1% | 6.1%(+5.98)#43 | 5.3%(+6.79)#1,637 |
| 44. | 32925 | 11.9% | 6.1%(+5.80)#44 | 5.3%(+6.60)#1,708 |
| 45. | 34479 | 11.8% | 6.1%(+5.75)#45 | 5.3%(+6.55)#1,723 |
| 46. | 33040 | 11.8% | 6.1%(+5.67)#46 | 5.3%(+6.48)#1,745 |
| 47. | 32145 | 11.8% | 6.1%(+5.67)#47 | 5.3%(+6.47)#1,758 |
| 48. | 32053 | 11.7% | 6.1%(+5.61)#48 | 5.3%(+6.41)#1,777 |
| 49. | 32839 | 11.6% | 6.1%(+5.55)#49 | 5.3%(+6.35)#1,800 |
| 50. | 33849 | 11.6% | 6.1%(+5.53)#50 | 5.3%(+6.33)#1,811 |
| 51. | 33136 | 11.6% | 6.1%(+5.48)#51 | 5.3%(+6.28)#1,822 |
| 52. | 32612 | 11.4% | 6.1%(+5.35)#52 | 5.3%(+6.15)#1,861 |
| 53. | 33168 | 11.4% | 6.1%(+5.32)#53 | 5.3%(+6.12)#1,873 |
| 54. | 34103 | 11.4% | 6.1%(+5.27)#54 | 5.3%(+6.07)#1,896 |
| 55. | 34449 | 11.3% | 6.1%(+5.23)#55 | 5.3%(+6.03)#1,910 |
| 56. | 32826 | 11.2% | 6.1%(+5.09)#56 | 5.3%(+5.89)#1,970 |
| 57. | 34112 | 11.1% | 6.1%(+5.02)#57 | 5.3%(+5.83)#1,993 |
| 58. | 33947 | 11.0% | 6.1%(+4.96)#58 | 5.3%(+5.76)#2,036 |
| 59. | 33403 | 11.0% | 6.1%(+4.93)#59 | 5.3%(+5.73)#2,051 |
| 60. | 33037 | 11.0% | 6.1%(+4.88)#60 | 5.3%(+5.68)#2,068 |
| 61. | 32403 | 10.9% | 6.1%(+4.78)#61 | 5.3%(+5.58)#2,123 |
| 62. | 32569 | 10.9% | 6.1%(+4.77)#62 | 5.3%(+5.58)#2,129 |
| 63. | 32962 | 10.8% | 6.1%(+4.67)#63 | 5.3%(+5.48)#2,171 |
| 64. | 32901 | 10.7% | 6.1%(+4.66)#64 | 5.3%(+5.46)#2,181 |
| 65. | 32438 | 10.7% | 6.1%(+4.63)#65 | 5.3%(+5.43)#2,198 |
| 66. | 33922 | 10.7% | 6.1%(+4.60)#66 | 5.3%(+5.41)#2,211 |
| 67. | 32304 | 10.7% | 6.1%(+4.56)#67 | 5.3%(+5.37)#2,230 |
| 68. | 34433 | 10.6% | 6.1%(+4.53)#68 | 5.3%(+5.33)#2,254 |
| 69. | 34210 | 10.6% | 6.1%(+4.49)#69 | 5.3%(+5.30)#2,277 |
| 70. | 32641 | 10.6% | 6.1%(+4.49)#70 | 5.3%(+5.29)#2,285 |
| 71. | 33907 | 10.6% | 6.1%(+4.47)#71 | 5.3%(+5.27)#2,299 |
| 72. | 33920 | 10.5% | 6.1%(+4.45)#72 | 5.3%(+5.25)#2,307 |
| 73. | 33838 | 10.5% | 6.1%(+4.43)#73 | 5.3%(+5.24)#2,320 |
| 74. | 33161 | 10.5% | 6.1%(+4.38)#74 | 5.3%(+5.19)#2,337 |
| 75. | 34950 | 10.5% | 6.1%(+4.37)#75 | 5.3%(+5.17)#2,348 |
| 76. | 33714 | 10.4% | 6.1%(+4.36)#76 | 5.3%(+5.16)#2,352 |
| 77. | 33827 | 10.4% | 6.1%(+4.32)#77 | 5.3%(+5.12)#2,371 |
| 78. | 32110 | 10.4% | 6.1%(+4.30)#78 | 5.3%(+5.10)#2,380 |
| 79. | 33150 | 10.4% | 6.1%(+4.26)#79 | 5.3%(+5.07)#2,398 |
| 80. | 32132 | 10.3% | 6.1%(+4.22)#80 | 5.3%(+5.03)#2,416 |
| 81. | 34203 | 10.2% | 6.1%(+4.14)#81 | 5.3%(+4.94)#2,464 |
| 82. | 32730 | 10.2% | 6.1%(+4.12)#82 | 5.3%(+4.93)#2,472 |
| 83. | 33967 | 10.2% | 6.1%(+4.11)#83 | 5.3%(+4.92)#2,478 |
| 84. | 32058 | 10.1% | 6.1%(+4.06)#84 | 5.3%(+4.86)#2,524 |
| 85. | 32808 | 10.1% | 6.1%(+3.97)#85 | 5.3%(+4.78)#2,587 |
| 86. | 32536 | 10.0% | 6.1%(+3.93)#86 | 5.3%(+4.74)#2,613 |
| 87. | 32421 | 10.0% | 6.1%(+3.92)#87 | 5.3%(+4.72)#2,624 |
| 88. | 33334 | 10.0% | 6.1%(+3.87)#88 | 5.3%(+4.68)#2,660 |
| 89. | 32401 | 10.0% | 6.1%(+3.87)#89 | 5.3%(+4.68)#2,663 |
| 90. | 34981 | 9.9% | 6.1%(+3.85)#90 | 5.3%(+4.65)#2,678 |
| 91. | 32818 | 9.9% | 6.1%(+3.84)#91 | 5.3%(+4.64)#2,687 |
| 92. | 32347 | 9.9% | 6.1%(+3.76)#92 | 5.3%(+4.57)#2,749 |
| 93. | 33760 | 9.8% | 6.1%(+3.76)#93 | 5.3%(+4.56)#2,755 |
| 94. | 32580 | 9.8% | 6.1%(+3.74)#94 | 5.3%(+4.55)#2,772 |
| 95. | 33801 | 9.8% | 6.1%(+3.72)#95 | 5.3%(+4.53)#2,787 |
| 96. | 34956 | 9.8% | 6.1%(+3.69)#96 | 5.3%(+4.49)#2,811 |
| 97. | 34108 | 9.8% | 6.1%(+3.68)#97 | 5.3%(+4.49)#2,818 |
| 98. | 34748 | 9.8% | 6.1%(+3.68)#98 | 5.3%(+4.48)#2,830 |
| 99. | 33127 | 9.7% | 6.1%(+3.64)#99 | 5.3%(+4.45)#2,854 |
| 100. | 32809 | 9.7% | 6.1%(+3.64)#100 | 5.3%(+4.44)#2,858 |
Common Questions
What are the Top 10 Zip Codes with the Highest Percentage of Population Employed in Food Preparation & Serving in Florida?
Top 10 Zip Codes with the Highest Percentage of Population Employed in Food Preparation & Serving in Florida are:
What zip code has the Highest Percentage of Population Employed in Food Preparation & Serving in Florida?
34661 has the Highest Percentage of Population Employed in Food Preparation & Serving in Florida with 100.0%.
What is the Percentage of Population Employed in Food Preparation & Serving in the State of Florida?
Percentage of Population Employed in Food Preparation & Serving in Florida is 6.1%.
What is the Percentage of Population Employed in Food Preparation & Serving in the United States?
Percentage of Population Employed in Food Preparation & Serving in the United States is 5.3%.