Zip Codes with the Highest Percentage of Population Employed in Food Preparation & Serving in Kissimmee, FL
RELATED REPORTS & OPTIONS
Food Preparation & Serving
Kissimmee
Compare Zip Codes
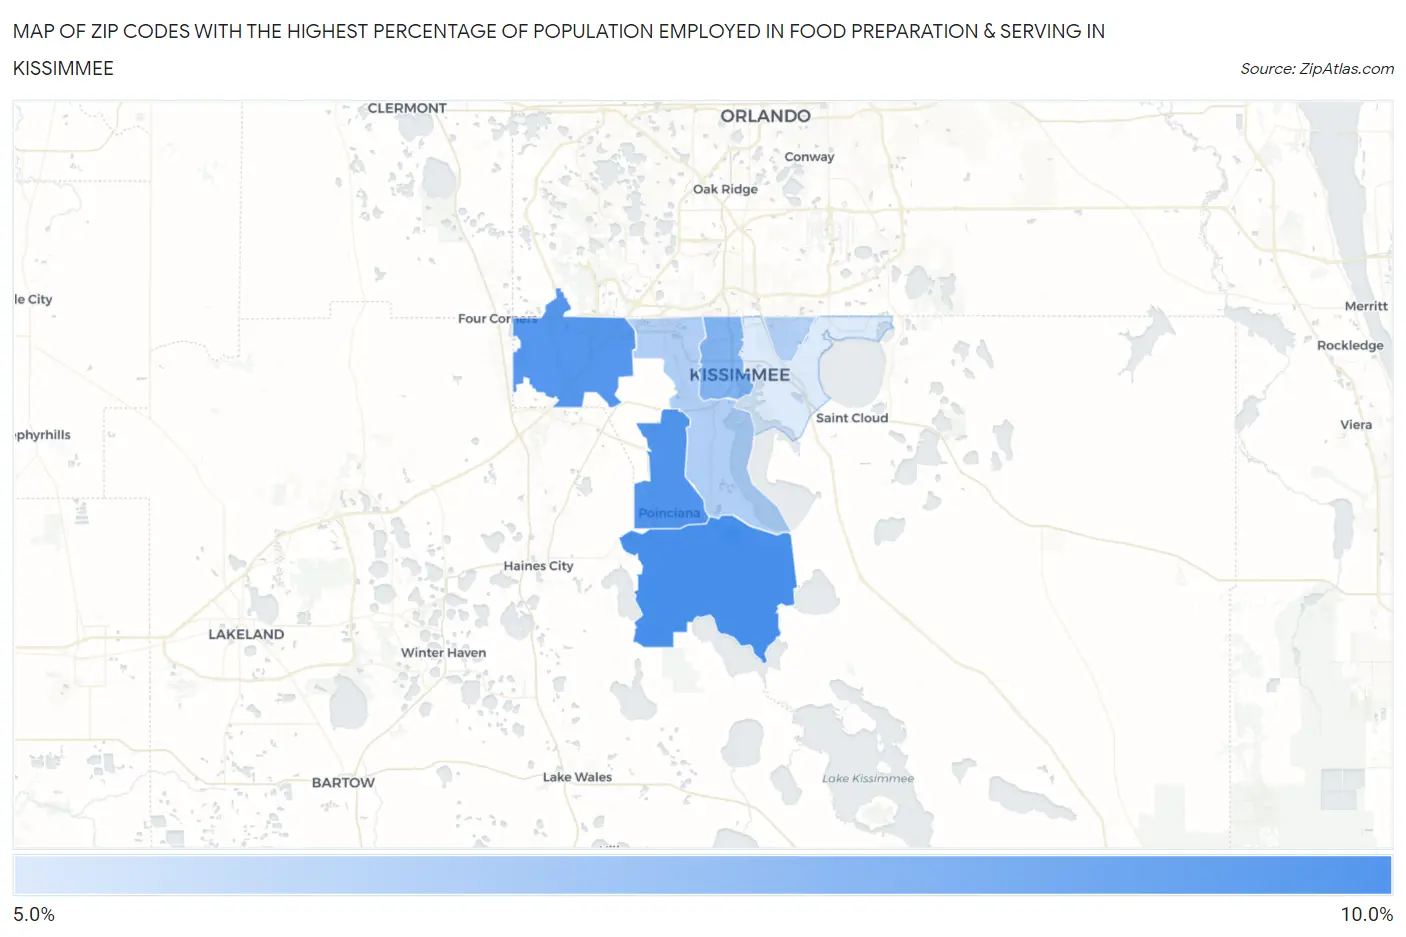
Map of Zip Codes with the Highest Percentage of Population Employed in Food Preparation & Serving in Kissimmee
5.2%
9.2%
Zip Codes with the Highest Percentage of Population Employed in Food Preparation & Serving in Kissimmee, FL
| Zip Code | % Employed | vs State | vs National | |
| 1. | 34759 | 9.2% | 6.1%(+3.12)#131 | 5.3%(+3.92)#3,314 |
| 2. | 34758 | 9.0% | 6.1%(+2.90)#138 | 5.3%(+3.71)#3,538 |
| 3. | 34747 | 8.8% | 6.1%(+2.74)#144 | 5.3%(+3.54)#3,682 |
| 4. | 34741 | 7.6% | 6.1%(+1.56)#236 | 5.3%(+2.36)#5,303 |
| 5. | 34746 | 6.4% | 6.1%(+0.271)#403 | 5.3%(+1.08)#8,242 |
| 6. | 34743 | 6.3% | 6.1%(+0.166)#418 | 5.3%(+0.970)#8,559 |
| 7. | 34744 | 5.2% | 6.1%(-0.920)#575 | 5.3%(-0.115)#12,277 |
1
Common Questions
What are the Top 5 Zip Codes with the Highest Percentage of Population Employed in Food Preparation & Serving in Kissimmee, FL?
Top 5 Zip Codes with the Highest Percentage of Population Employed in Food Preparation & Serving in Kissimmee, FL are:
What zip code has the Highest Percentage of Population Employed in Food Preparation & Serving in Kissimmee, FL?
34759 has the Highest Percentage of Population Employed in Food Preparation & Serving in Kissimmee, FL with 9.2%.
What is the Percentage of Population Employed in Food Preparation & Serving in Kissimmee, FL?
Percentage of Population Employed in Food Preparation & Serving in Kissimmee is 6.9%.
What is the Percentage of Population Employed in Food Preparation & Serving in Florida?
Percentage of Population Employed in Food Preparation & Serving in Florida is 6.1%.
What is the Percentage of Population Employed in Food Preparation & Serving in the United States?
Percentage of Population Employed in Food Preparation & Serving in the United States is 5.3%.