Zip Codes with the Highest Percentage of Population Employed in Food Preparation & Serving in Arcadia, FL
RELATED REPORTS & OPTIONS
Food Preparation & Serving
Arcadia
Compare Zip Codes
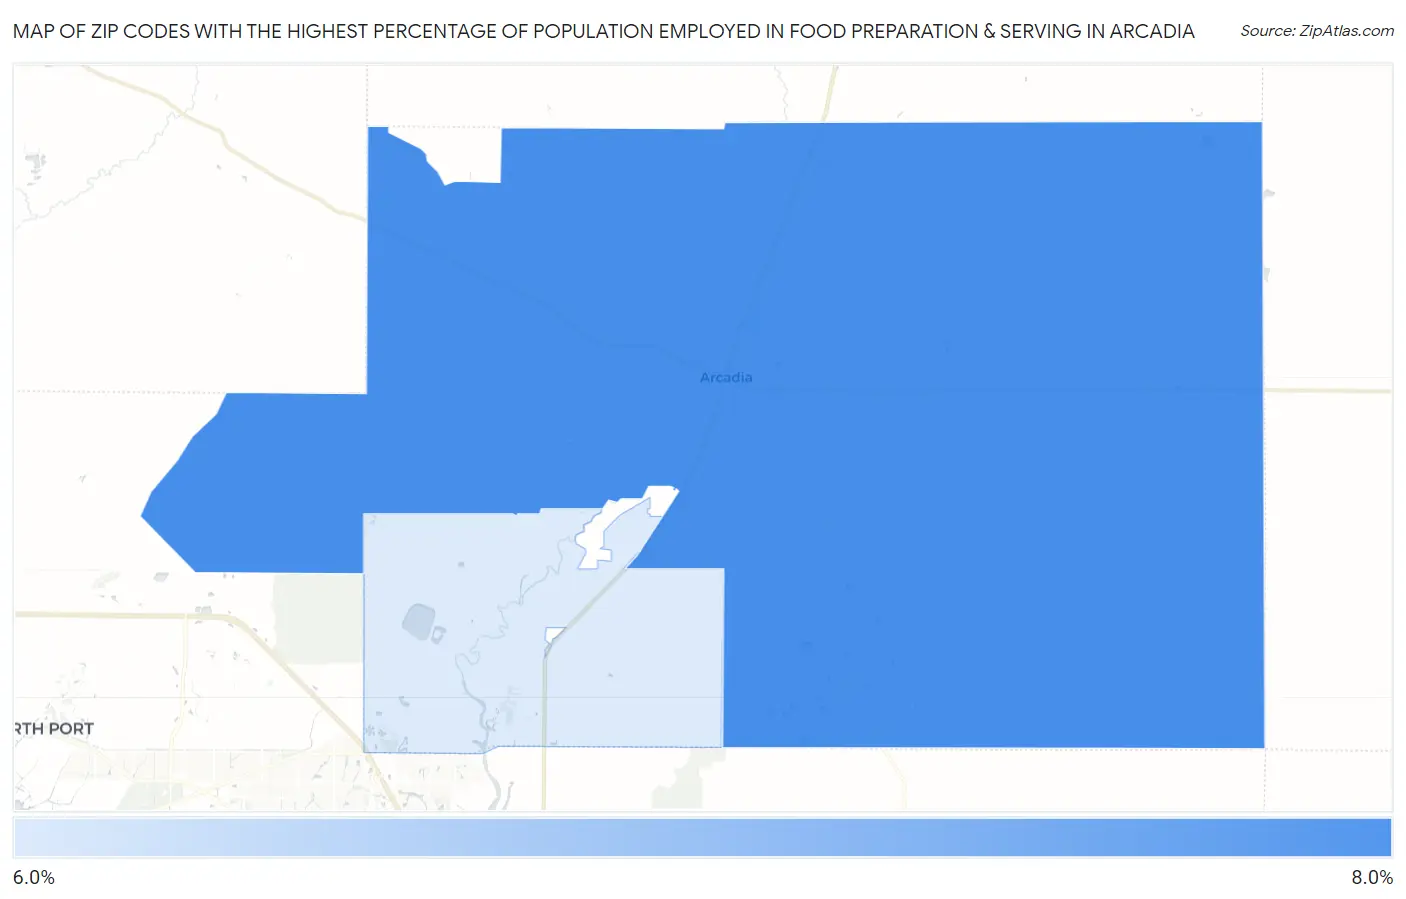
Map of Zip Codes with the Highest Percentage of Population Employed in Food Preparation & Serving in Arcadia
6.8%
6.8%
Zip Codes with the Highest Percentage of Population Employed in Food Preparation & Serving in Arcadia, FL
| Zip Code | % Employed | vs State | vs National | |
| 1. | 34266 | 6.8% | 6.1%(+0.747)#338 | 5.3%(+1.55)#6,968 |
| 2. | 34269 | 6.8% | 6.1%(+0.698)#348 | 5.3%(+1.50)#7,092 |
1
Common Questions
What are the Top Zip Codes with the Highest Percentage of Population Employed in Food Preparation & Serving in Arcadia, FL?
Top Zip Codes with the Highest Percentage of Population Employed in Food Preparation & Serving in Arcadia, FL are:
What zip code has the Highest Percentage of Population Employed in Food Preparation & Serving in Arcadia, FL?
34266 has the Highest Percentage of Population Employed in Food Preparation & Serving in Arcadia, FL with 6.8%.
What is the Percentage of Population Employed in Food Preparation & Serving in Arcadia, FL?
Percentage of Population Employed in Food Preparation & Serving in Arcadia is 12.7%.
What is the Percentage of Population Employed in Food Preparation & Serving in Florida?
Percentage of Population Employed in Food Preparation & Serving in Florida is 6.1%.
What is the Percentage of Population Employed in Food Preparation & Serving in the United States?
Percentage of Population Employed in Food Preparation & Serving in the United States is 5.3%.