Zip Codes with the Highest Percentage of Population Employed in Food Preparation & Serving in Perry, FL
RELATED REPORTS & OPTIONS
Food Preparation & Serving
Perry
Compare Zip Codes
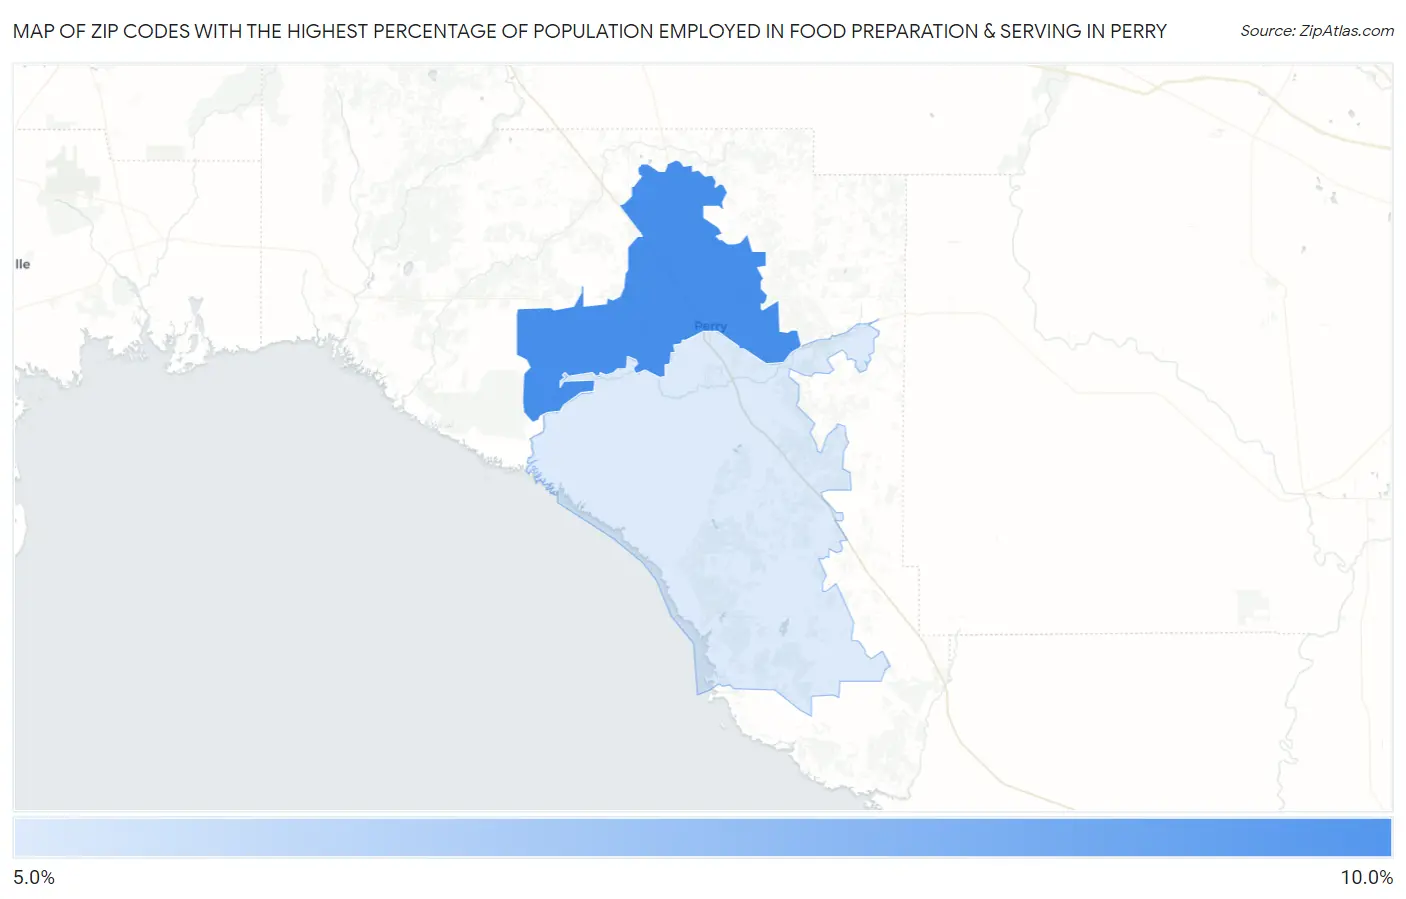
Map of Zip Codes with the Highest Percentage of Population Employed in Food Preparation & Serving in Perry
6.0%
9.9%
Zip Codes with the Highest Percentage of Population Employed in Food Preparation & Serving in Perry, FL
| Zip Code | % Employed | vs State | vs National | |
| 1. | 32347 | 9.9% | 6.1%(+3.76)#92 | 5.3%(+4.57)#2,749 |
| 2. | 32348 | 6.0% | 6.1%(-0.118)#463 | 5.3%(+0.686)#9,435 |
1
Common Questions
What are the Top Zip Codes with the Highest Percentage of Population Employed in Food Preparation & Serving in Perry, FL?
Top Zip Codes with the Highest Percentage of Population Employed in Food Preparation & Serving in Perry, FL are:
What zip code has the Highest Percentage of Population Employed in Food Preparation & Serving in Perry, FL?
32347 has the Highest Percentage of Population Employed in Food Preparation & Serving in Perry, FL with 9.9%.
What is the Percentage of Population Employed in Food Preparation & Serving in Perry, FL?
Percentage of Population Employed in Food Preparation & Serving in Perry is 9.1%.
What is the Percentage of Population Employed in Food Preparation & Serving in Florida?
Percentage of Population Employed in Food Preparation & Serving in Florida is 6.1%.
What is the Percentage of Population Employed in Food Preparation & Serving in the United States?
Percentage of Population Employed in Food Preparation & Serving in the United States is 5.3%.