Lemon Grove, FL Map & Demographics
Lemon Grove Map
Lemon Grove Overview
$27,566
PER CAPITA INCOME
$97,794
AVG FAMILY INCOME
31.5%
WAGE / INCOME GAP [ % ]
68.5¢/ $1
WAGE / INCOME GAP [ $ ]
0.47
INEQUALITY / GINI INDEX
610
TOTAL POPULATION
265
MALE POPULATION
345
FEMALE POPULATION
76.81
MALES / 100 FEMALES
130.19
FEMALES / 100 MALES
39.5
MEDIAN AGE
2.9
AVG FAMILY SIZE
2.2
AVG HOUSEHOLD SIZE
322
LABOR FORCE [ PEOPLE ]
63.4%
PERCENT IN LABOR FORCE
4.7%
UNEMPLOYMENT RATE
Income in Lemon Grove
Income Overview in Lemon Grove
| Characteristic | Number | Measure |
| Per Capita Income | 610 | $27,566 |
| Median Family Income | 176 | $97,794 |
| Mean Family Income | 176 | $78,247 |
| Median Household Income | 279 | $0 |
| Mean Household Income | 279 | $60,704 |
| Income Deficit | 176 | $0 |
| Wage / Income Gap (%) | 610 | 31.54% |
| Wage / Income Gap ($) | 610 | 68.46¢ per $1 |
| Gini / Inequality Index | 610 | 0.47 |
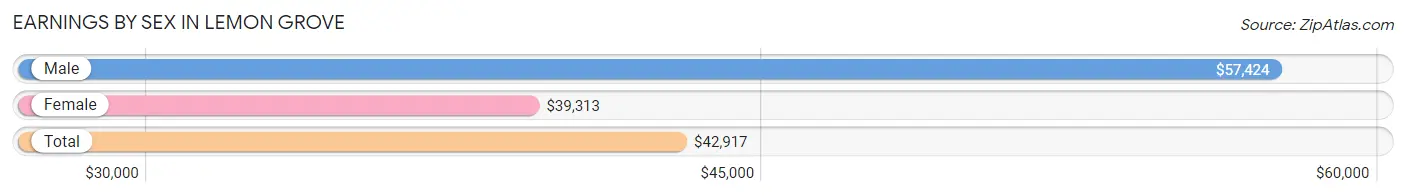
Earnings by Sex in Lemon Grove
Average Earnings in Lemon Grove are $42,917, $57,424 for men and $39,313 for women, a difference of 31.5%.
| Sex | Number | Average Earnings |
| Male | 138 (43.5%) | $57,424 |
| Female | 179 (56.5%) | $39,313 |
| Total | 317 (100.0%) | $42,917 |
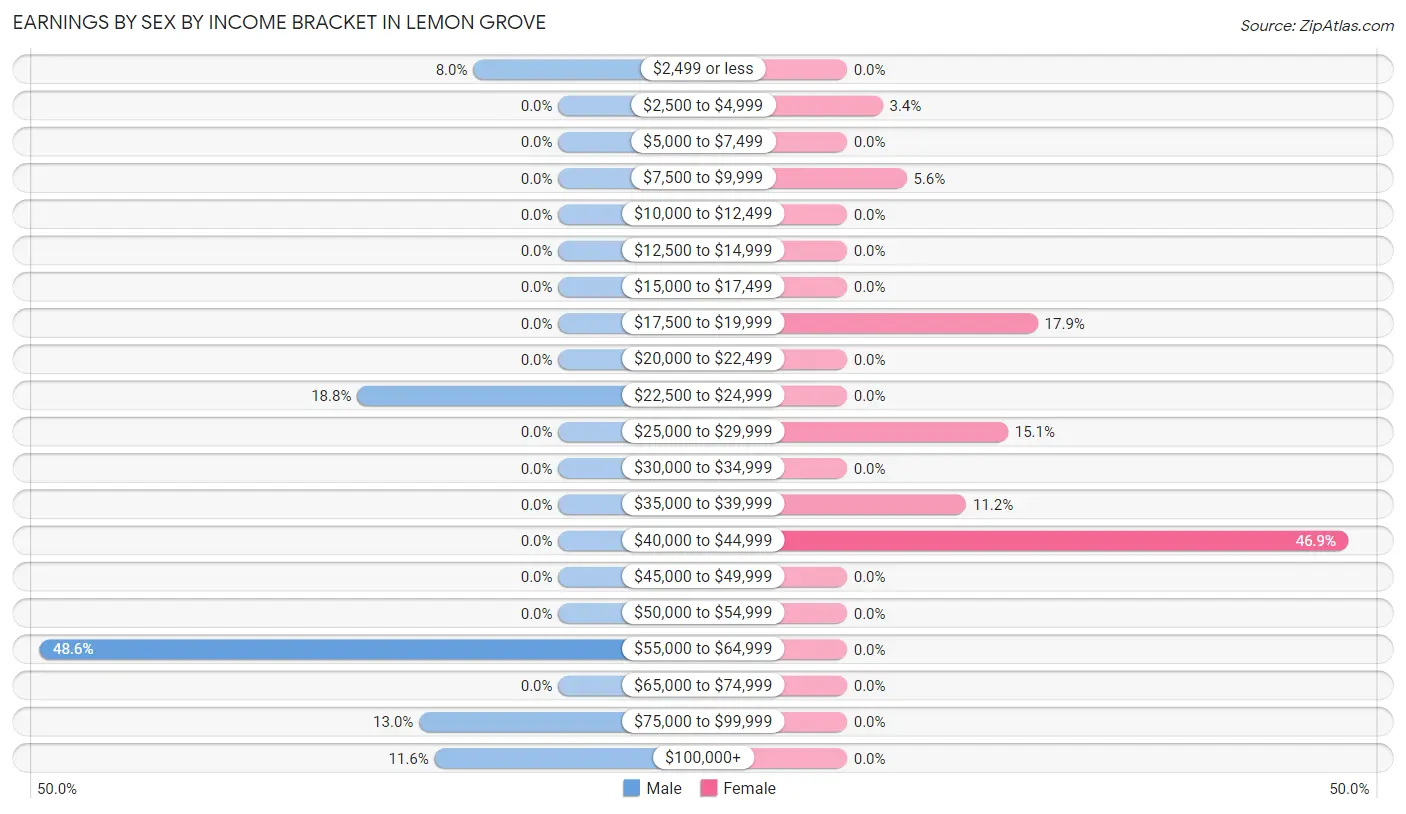
Earnings by Sex by Income Bracket in Lemon Grove
The most common earnings brackets in Lemon Grove are $55,000 to $64,999 for men (67 | 48.5%) and $40,000 to $44,999 for women (84 | 46.9%).
| Income | Male | Female |
| $2,499 or less | 11 (8.0%) | 0 (0.0%) |
| $2,500 to $4,999 | 0 (0.0%) | 6 (3.4%) |
| $5,000 to $7,499 | 0 (0.0%) | 0 (0.0%) |
| $7,500 to $9,999 | 0 (0.0%) | 10 (5.6%) |
| $10,000 to $12,499 | 0 (0.0%) | 0 (0.0%) |
| $12,500 to $14,999 | 0 (0.0%) | 0 (0.0%) |
| $15,000 to $17,499 | 0 (0.0%) | 0 (0.0%) |
| $17,500 to $19,999 | 0 (0.0%) | 32 (17.9%) |
| $20,000 to $22,499 | 0 (0.0%) | 0 (0.0%) |
| $22,500 to $24,999 | 26 (18.8%) | 0 (0.0%) |
| $25,000 to $29,999 | 0 (0.0%) | 27 (15.1%) |
| $30,000 to $34,999 | 0 (0.0%) | 0 (0.0%) |
| $35,000 to $39,999 | 0 (0.0%) | 20 (11.2%) |
| $40,000 to $44,999 | 0 (0.0%) | 84 (46.9%) |
| $45,000 to $49,999 | 0 (0.0%) | 0 (0.0%) |
| $50,000 to $54,999 | 0 (0.0%) | 0 (0.0%) |
| $55,000 to $64,999 | 67 (48.5%) | 0 (0.0%) |
| $65,000 to $74,999 | 0 (0.0%) | 0 (0.0%) |
| $75,000 to $99,999 | 18 (13.0%) | 0 (0.0%) |
| $100,000+ | 16 (11.6%) | 0 (0.0%) |
| Total | 138 (100.0%) | 179 (100.0%) |
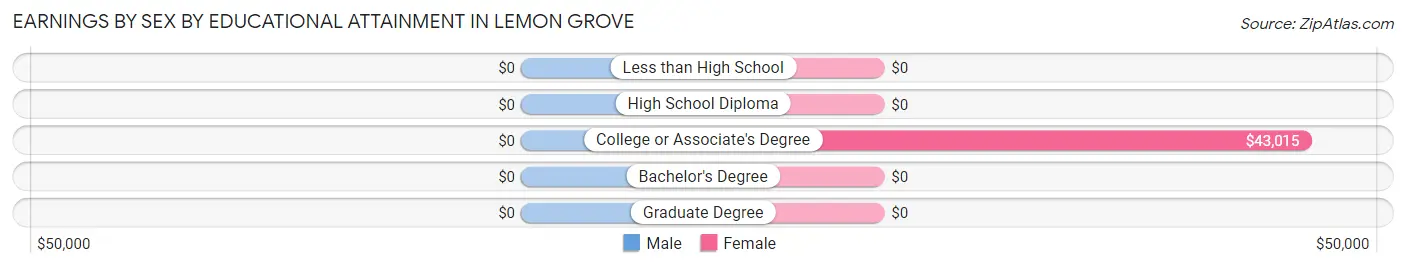
Earnings by Sex by Educational Attainment in Lemon Grove
| Educational Attainment | Male Income | Female Income |
| Less than High School | - | - |
| High School Diploma | - | - |
| College or Associate's Degree | - | - |
| Bachelor's Degree | - | - |
| Graduate Degree | - | - |
| Total | $58,346 | $42,609 |
Family Income in Lemon Grove
Family Income Brackets in Lemon Grove
According to the Lemon Grove family income data, there are 48 families falling into the $75,000 to $99,999 income range, which is the most common income bracket and makes up 27.3% of all families.
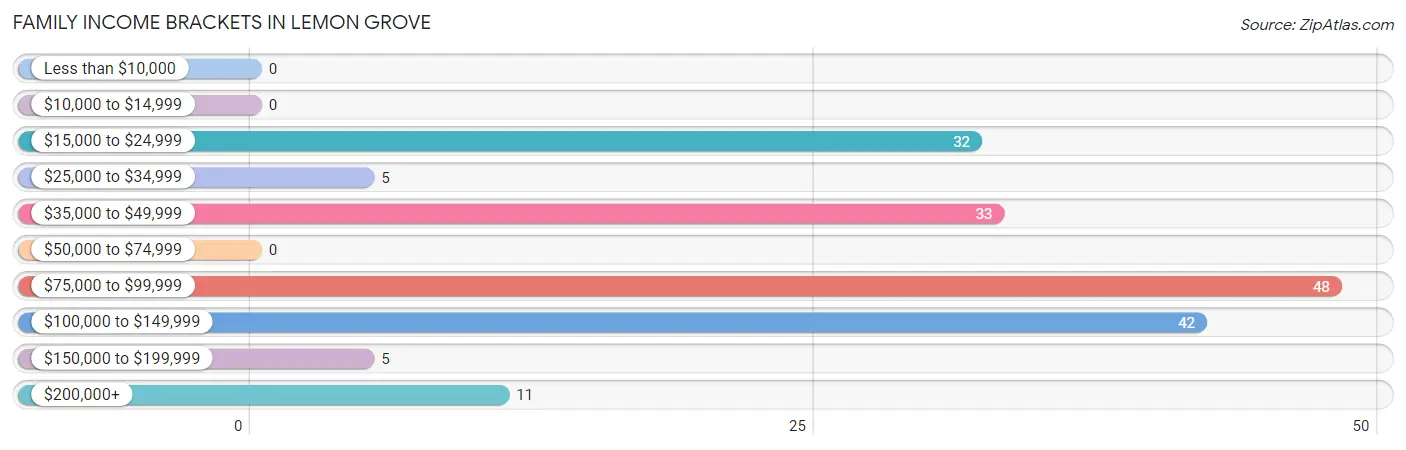
| Income Bracket | # Families | % Families |
| Less than $10,000 | 0 | 0.0% |
| $10,000 to $14,999 | 0 | 0.0% |
| $15,000 to $24,999 | 32 | 18.2% |
| $25,000 to $34,999 | 5 | 2.8% |
| $35,000 to $49,999 | 33 | 18.8% |
| $50,000 to $74,999 | 0 | 0.0% |
| $75,000 to $99,999 | 48 | 27.3% |
| $100,000 to $149,999 | 42 | 23.9% |
| $150,000 to $199,999 | 5 | 2.8% |
| $200,000+ | 11 | 6.3% |
Family Income by Famaliy Size in Lemon Grove
4-person families (112 | 63.6%) account for the highest median family income in Lemon Grove with $99,265 per family, while 4-person families (112 | 63.6%) have the highest median income of $24,816 per family member.
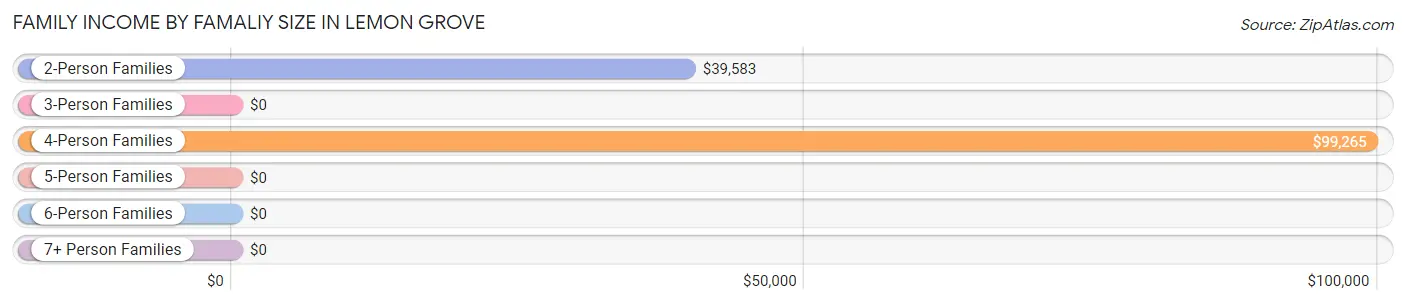
| Income Bracket | # Families | Median Income |
| 2-Person Families | 50 (28.4%) | $39,583 |
| 3-Person Families | 14 (8.0%) | $0 |
| 4-Person Families | 112 (63.6%) | $99,265 |
| 5-Person Families | 0 (0.0%) | $0 |
| 6-Person Families | 0 (0.0%) | $0 |
| 7+ Person Families | 0 (0.0%) | $0 |
| Total | 176 (100.0%) | $97,794 |
Family Income by Number of Earners in Lemon Grove
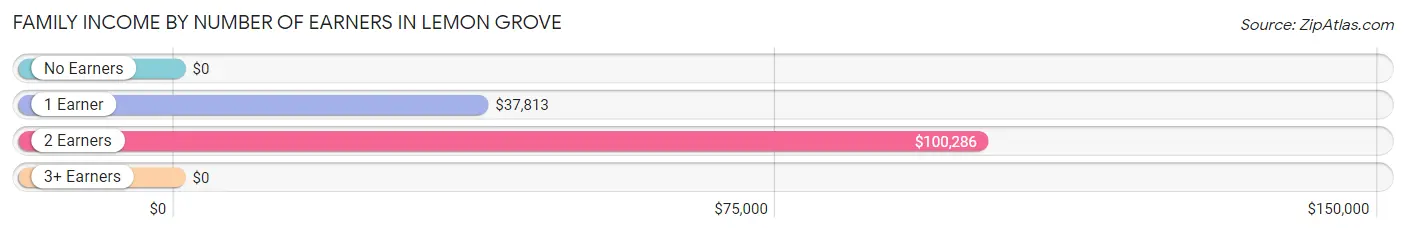
| Number of Earners | # Families | Median Income |
| No Earners | 5 (2.8%) | $0 |
| 1 Earner | 70 (39.8%) | $37,813 |
| 2 Earners | 76 (43.2%) | $100,286 |
| 3+ Earners | 25 (14.2%) | $0 |
| Total | 176 (100.0%) | $97,794 |
Household Income in Lemon Grove
Household Income Brackets in Lemon Grove
With 59 households falling in the category, the $100,000 to $149,999 income range is the most frequent in Lemon Grove, accounting for 21.1% of all households.
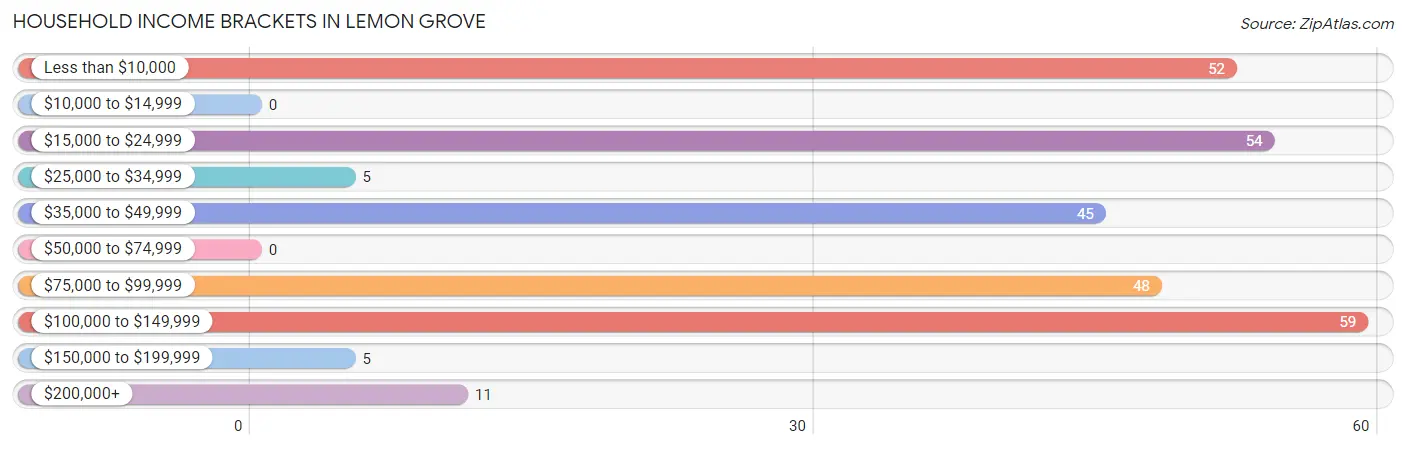
| Income Bracket | # Households | % Households |
| Less than $10,000 | 52 | 18.6% |
| $10,000 to $14,999 | 0 | 0.0% |
| $15,000 to $24,999 | 54 | 19.4% |
| $25,000 to $34,999 | 5 | 1.8% |
| $35,000 to $49,999 | 45 | 16.1% |
| $50,000 to $74,999 | 0 | 0.0% |
| $75,000 to $99,999 | 48 | 17.2% |
| $100,000 to $149,999 | 59 | 21.1% |
| $150,000 to $199,999 | 5 | 1.8% |
| $200,000+ | 11 | 3.9% |
Household Income by Householder Age in Lemon Grove
The median household income in Lemon Grove is $0, with the highest median household income of $99,485 found in the 25 to 44 years age bracket for the primary householder. A total of 84 households (30.1%) fall into this category. Meanwhile, the 15 to 24 years age bracket for the primary householder has the lowest median household income of $0, with 46 households (16.5%) in this group.
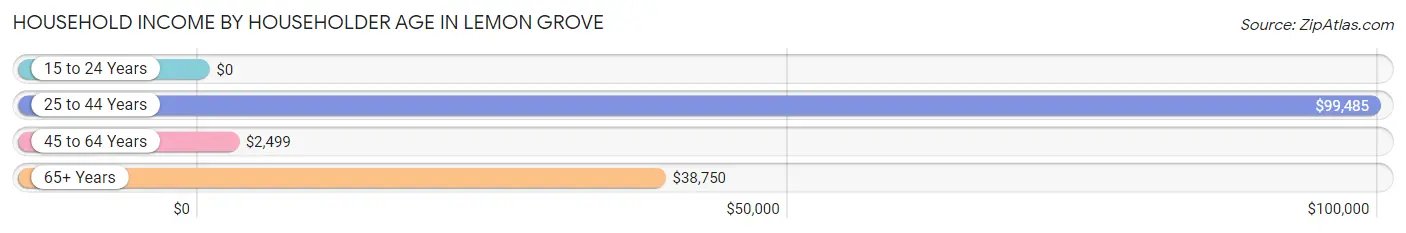
| Income Bracket | # Households | Median Income |
| 15 to 24 Years | 46 (16.5%) | $0 |
| 25 to 44 Years | 84 (30.1%) | $99,485 |
| 45 to 64 Years | 47 (16.9%) | $2,499 |
| 65+ Years | 102 (36.6%) | $38,750 |
| Total | 279 (100.0%) | $0 |
Poverty in Lemon Grove
Income Below Poverty by Sex and Age in Lemon Grove
With 2.3% poverty level for males and 37.1% for females among the residents of Lemon Grove, 65 to 74 year old males and under 5 year old females are the most vulnerable to poverty, with 6 males (9.4%) and 27 females (100.0%) in their respective age groups living below the poverty level.
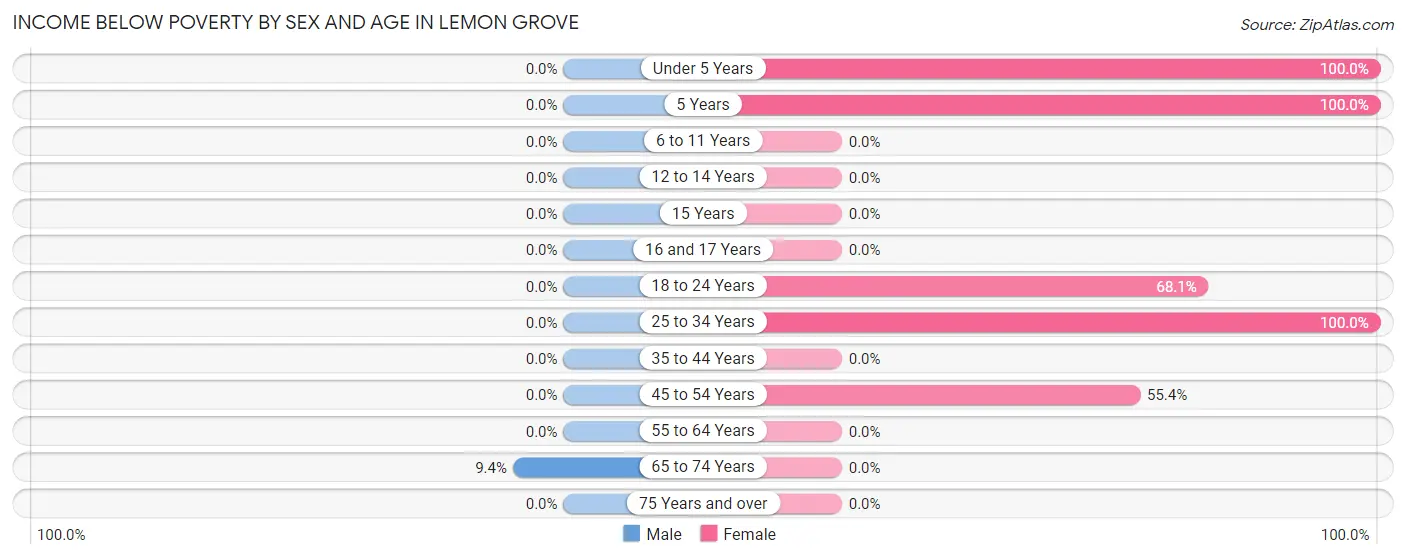
| Age Bracket | Male | Female |
| Under 5 Years | 0 (0.0%) | 27 (100.0%) |
| 5 Years | 0 (0.0%) | 23 (100.0%) |
| 6 to 11 Years | 0 (0.0%) | 0 (0.0%) |
| 12 to 14 Years | 0 (0.0%) | 0 (0.0%) |
| 15 Years | 0 (0.0%) | 0 (0.0%) |
| 16 and 17 Years | 0 (0.0%) | 0 (0.0%) |
| 18 to 24 Years | 0 (0.0%) | 32 (68.1%) |
| 25 to 34 Years | 0 (0.0%) | 15 (100.0%) |
| 35 to 44 Years | 0 (0.0%) | 0 (0.0%) |
| 45 to 54 Years | 0 (0.0%) | 31 (55.4%) |
| 55 to 64 Years | 0 (0.0%) | 0 (0.0%) |
| 65 to 74 Years | 6 (9.4%) | 0 (0.0%) |
| 75 Years and over | 0 (0.0%) | 0 (0.0%) |
| Total | 6 (2.3%) | 128 (37.1%) |
Income Above Poverty by Sex and Age in Lemon Grove
According to the poverty statistics in Lemon Grove, males aged 12 to 14 years and females aged 12 to 14 years are the age groups that are most secure financially, with 100.0% of males and 100.0% of females in these age groups living above the poverty line.
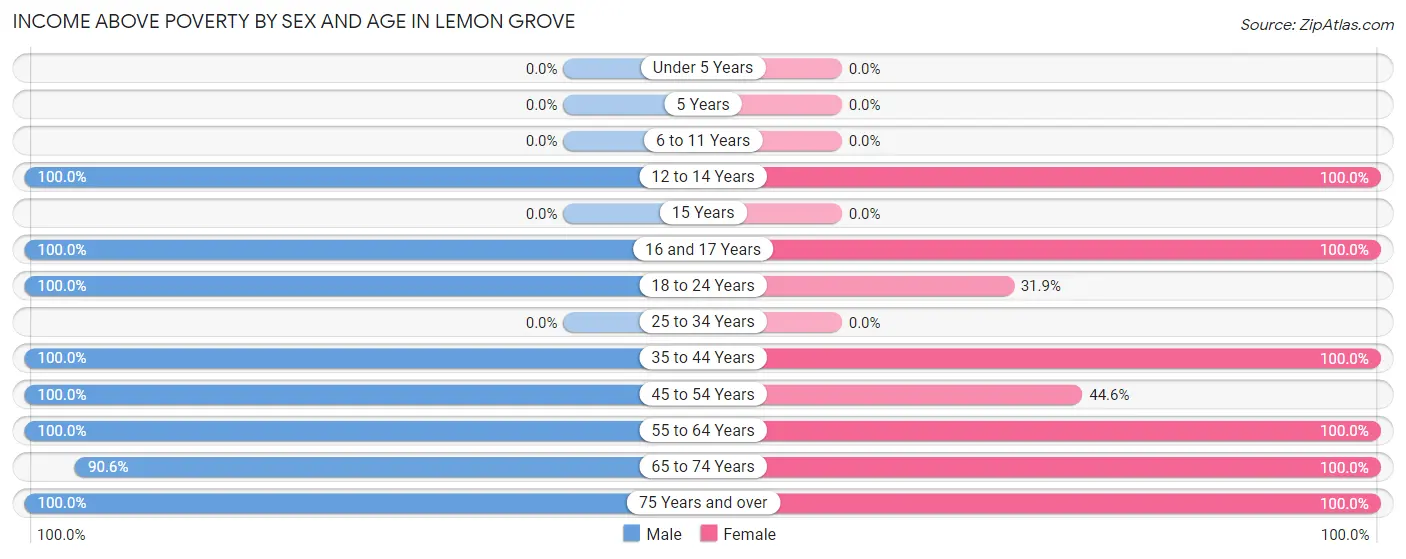
| Age Bracket | Male | Female |
| Under 5 Years | 0 (0.0%) | 0 (0.0%) |
| 5 Years | 0 (0.0%) | 0 (0.0%) |
| 6 to 11 Years | 0 (0.0%) | 0 (0.0%) |
| 12 to 14 Years | 30 (100.0%) | 22 (100.0%) |
| 15 Years | 0 (0.0%) | 0 (0.0%) |
| 16 and 17 Years | 40 (100.0%) | 20 (100.0%) |
| 18 to 24 Years | 14 (100.0%) | 15 (31.9%) |
| 25 to 34 Years | 0 (0.0%) | 0 (0.0%) |
| 35 to 44 Years | 45 (100.0%) | 92 (100.0%) |
| 45 to 54 Years | 45 (100.0%) | 25 (44.6%) |
| 55 to 64 Years | 5 (100.0%) | 14 (100.0%) |
| 65 to 74 Years | 58 (90.6%) | 23 (100.0%) |
| 75 Years and over | 22 (100.0%) | 6 (100.0%) |
| Total | 259 (97.7%) | 217 (62.9%) |
Income Below Poverty Among Married-Couple Families in Lemon Grove
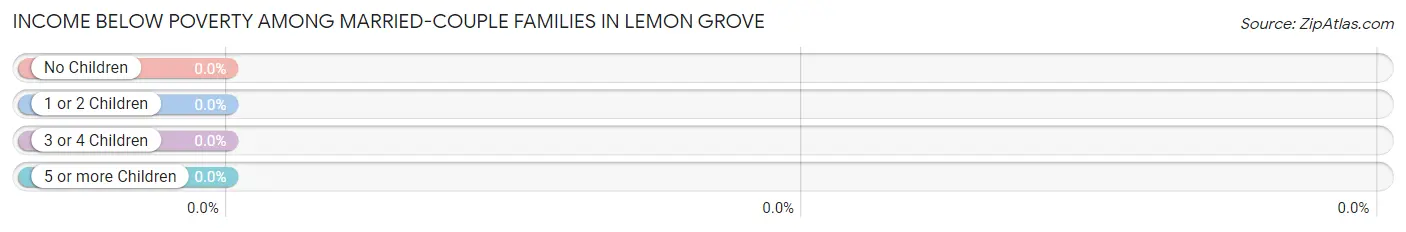
| Children | Above Poverty | Below Poverty |
| No Children | 50 (100.0%) | 0 (0.0%) |
| 1 or 2 Children | 80 (100.0%) | 0 (0.0%) |
| 3 or 4 Children | 0 (0.0%) | 0 (0.0%) |
| 5 or more Children | 0 (0.0%) | 0 (0.0%) |
| Total | 130 (100.0%) | 0 (0.0%) |
Income Below Poverty Among Single-Parent Households in Lemon Grove
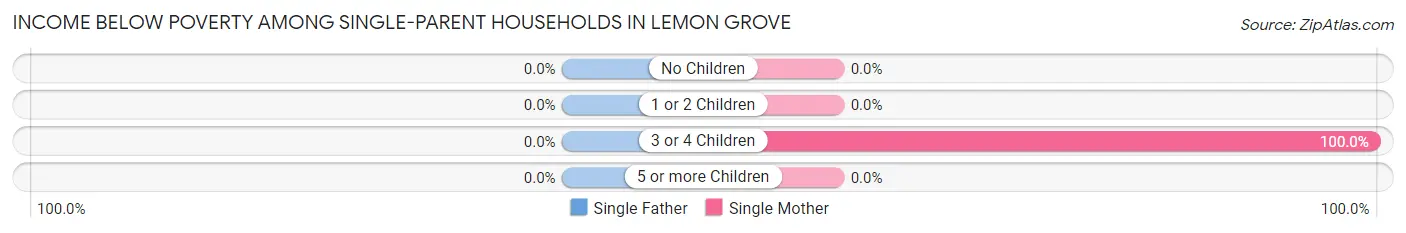
| Children | Single Father | Single Mother |
| No Children | 0 (0.0%) | 0 (0.0%) |
| 1 or 2 Children | 0 (0.0%) | 0 (0.0%) |
| 3 or 4 Children | 0 (0.0%) | 32 (100.0%) |
| 5 or more Children | 0 (0.0%) | 0 (0.0%) |
| Total | 0 (0.0%) | 32 (100.0%) |
Income Below Poverty Among Married-Couple vs Single-Parent Households in Lemon Grove
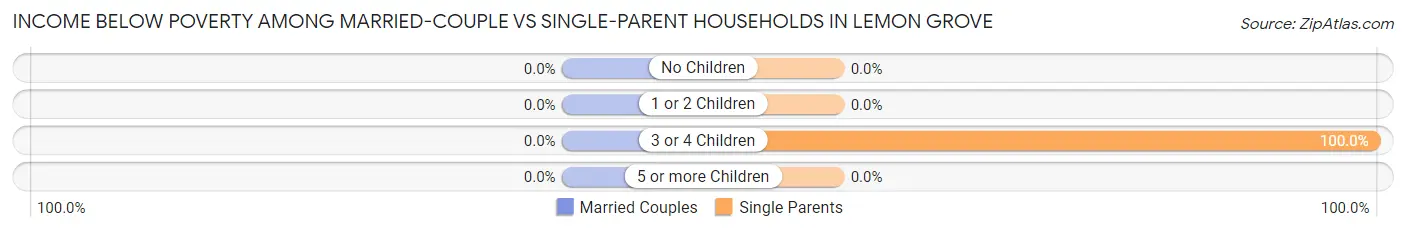
| Children | Married-Couple Families | Single-Parent Households |
| No Children | 0 (0.0%) | 0 (0.0%) |
| 1 or 2 Children | 0 (0.0%) | 0 (0.0%) |
| 3 or 4 Children | 0 (0.0%) | 32 (100.0%) |
| 5 or more Children | 0 (0.0%) | 0 (0.0%) |
| Total | 0 (0.0%) | 32 (69.6%) |
Race in Lemon Grove
The most populous races in Lemon Grove are White / Caucasian (523 | 85.7%), Hispanic or Latino (97 | 15.9%), and Some other Race (82 | 13.4%).
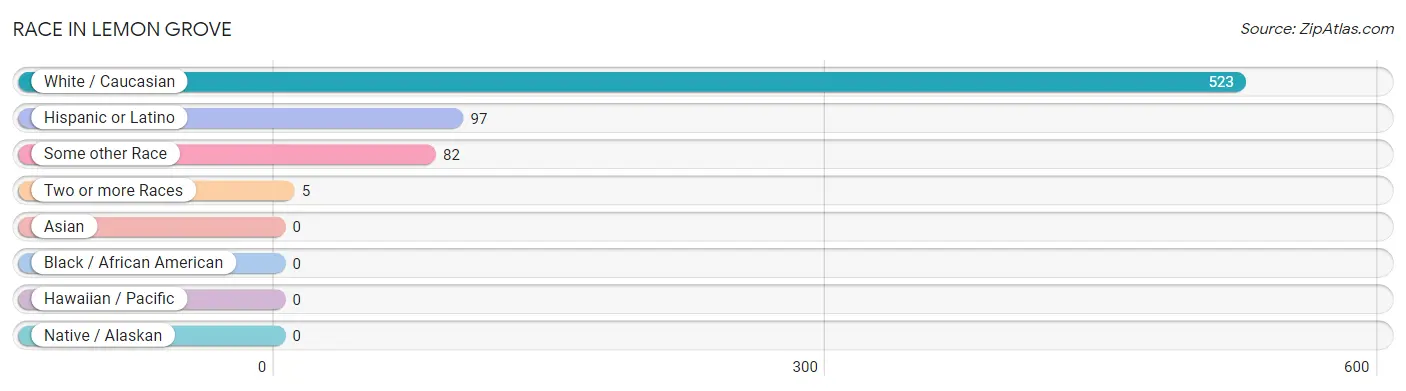
| Race | # Population | % Population |
| Asian | 0 | 0.0% |
| Black / African American | 0 | 0.0% |
| Hawaiian / Pacific | 0 | 0.0% |
| Hispanic or Latino | 97 | 15.9% |
| Native / Alaskan | 0 | 0.0% |
| White / Caucasian | 523 | 85.7% |
| Two or more Races | 5 | 0.8% |
| Some other Race | 82 | 13.4% |
| Total | 610 | 100.0% |
Ancestry in Lemon Grove
The most populous ancestries reported in Lemon Grove are American (101 | 16.6%), Mexican (82 | 13.4%), English (55 | 9.0%), Irish (48 | 7.9%), and Cuban (15 | 2.5%), together accounting for 49.3% of all Lemon Grove residents.

| Ancestry | # Population | % Population |
| Albanian | 10 | 1.6% |
| American | 101 | 16.6% |
| Cherokee | 5 | 0.8% |
| Cuban | 15 | 2.5% |
| English | 55 | 9.0% |
| French | 11 | 1.8% |
| German | 6 | 1.0% |
| Irish | 48 | 7.9% |
| Mexican | 82 | 13.4% |
| Nigerian | 6 | 1.0% |
| Northern European | 7 | 1.1% |
| Scottish | 5 | 0.8% |
| Subsaharan African | 6 | 1.0% | View All 13 Rows |
Immigrants in Lemon Grove
The most numerous immigrant groups reported in Lemon Grove came from Latin America (47 | 7.7%), Central America (32 | 5.2%), Mexico (32 | 5.2%), Caribbean (15 | 2.5%), and Cuba (15 | 2.5%), together accounting for 23.1% of all Lemon Grove residents.
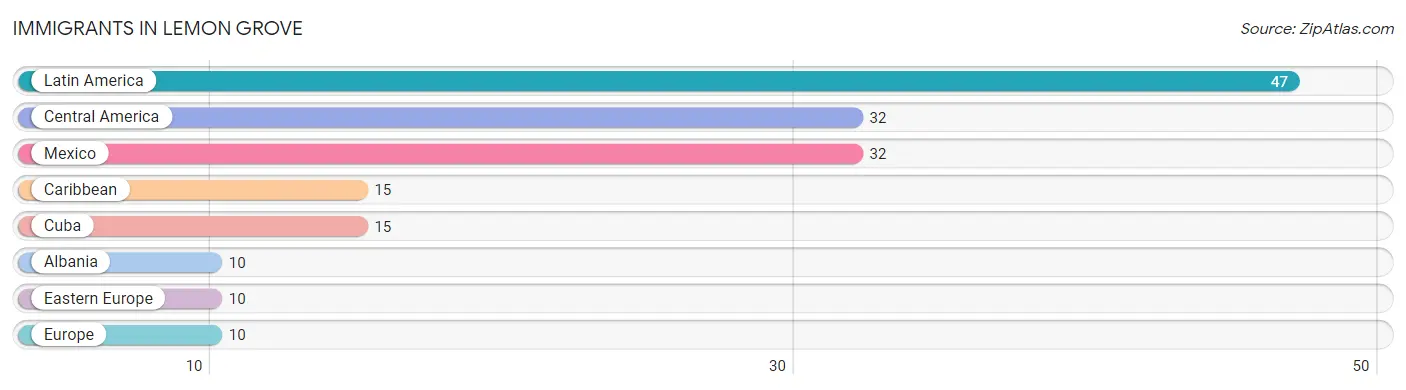
| Immigration Origin | # Population | % Population |
| Albania | 10 | 1.6% |
| Caribbean | 15 | 2.5% |
| Central America | 32 | 5.2% |
| Cuba | 15 | 2.5% |
| Eastern Europe | 10 | 1.6% |
| Europe | 10 | 1.6% |
| Latin America | 47 | 7.7% |
| Mexico | 32 | 5.2% | View All 8 Rows |
Sex and Age in Lemon Grove
Sex and Age in Lemon Grove
The most populous age groups in Lemon Grove are 15 to 19 Years (54 | 20.4%) for men and 40 to 44 Years (58 | 16.8%) for women.
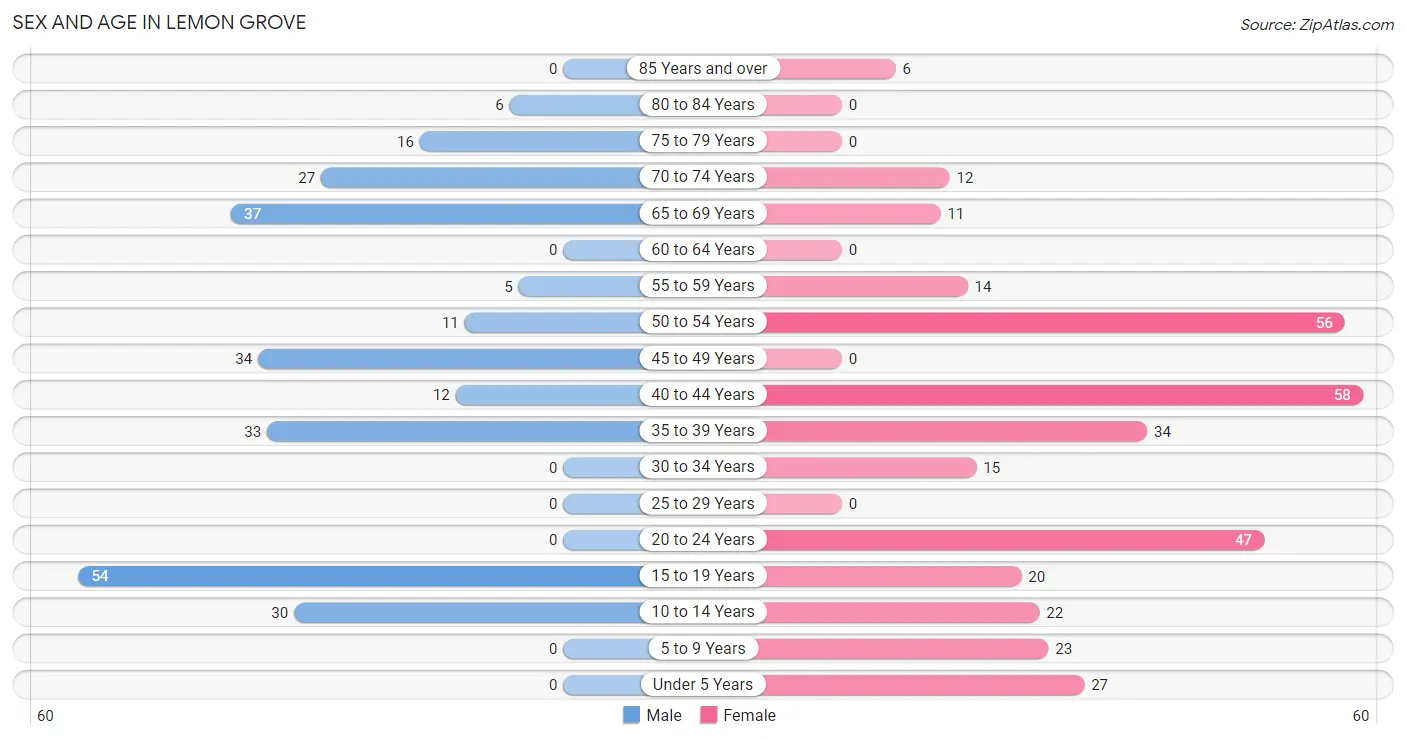
| Age Bracket | Male | Female |
| Under 5 Years | 0 (0.0%) | 27 (7.8%) |
| 5 to 9 Years | 0 (0.0%) | 23 (6.7%) |
| 10 to 14 Years | 30 (11.3%) | 22 (6.4%) |
| 15 to 19 Years | 54 (20.4%) | 20 (5.8%) |
| 20 to 24 Years | 0 (0.0%) | 47 (13.6%) |
| 25 to 29 Years | 0 (0.0%) | 0 (0.0%) |
| 30 to 34 Years | 0 (0.0%) | 15 (4.3%) |
| 35 to 39 Years | 33 (12.4%) | 34 (9.9%) |
| 40 to 44 Years | 12 (4.5%) | 58 (16.8%) |
| 45 to 49 Years | 34 (12.8%) | 0 (0.0%) |
| 50 to 54 Years | 11 (4.2%) | 56 (16.2%) |
| 55 to 59 Years | 5 (1.9%) | 14 (4.1%) |
| 60 to 64 Years | 0 (0.0%) | 0 (0.0%) |
| 65 to 69 Years | 37 (14.0%) | 11 (3.2%) |
| 70 to 74 Years | 27 (10.2%) | 12 (3.5%) |
| 75 to 79 Years | 16 (6.0%) | 0 (0.0%) |
| 80 to 84 Years | 6 (2.3%) | 0 (0.0%) |
| 85 Years and over | 0 (0.0%) | 6 (1.7%) |
| Total | 265 (100.0%) | 345 (100.0%) |
Families and Households in Lemon Grove
Median Family Size in Lemon Grove
The median family size in Lemon Grove is 2.88 persons per family, with married-couple families (130 | 73.9%) accounting for the largest median family size of 2.97 persons per family. On the other hand, single female/mother families (32 | 18.2%) represent the smallest median family size with 2.56 persons per family.
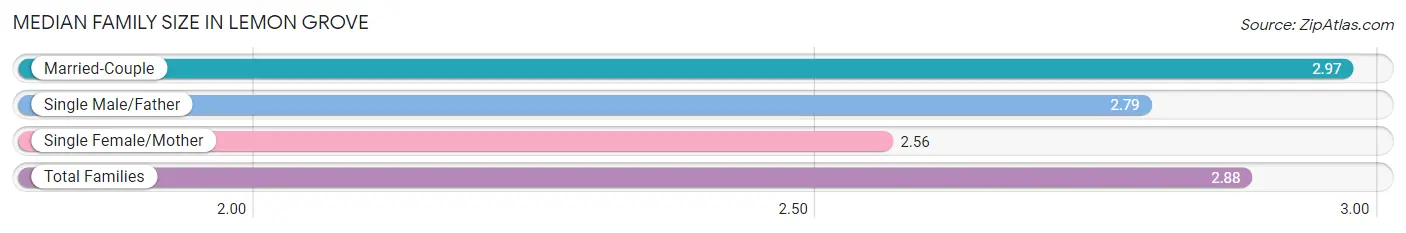
| Family Type | # Families | Family Size |
| Married-Couple | 130 (73.9%) | 2.97 |
| Single Male/Father | 14 (8.0%) | 2.79 |
| Single Female/Mother | 32 (18.2%) | 2.56 |
| Total Families | 176 (100.0%) | 2.88 |
Median Household Size in Lemon Grove
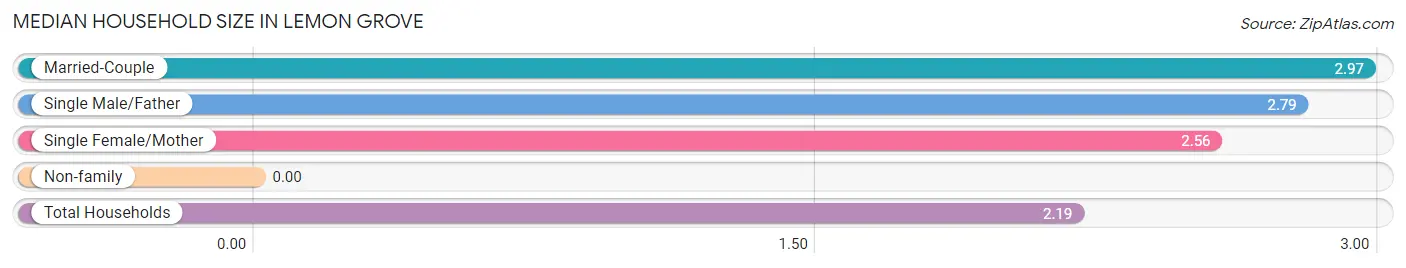
| Household Type | # Households | Household Size |
| Married-Couple | 130 (46.6%) | 2.97 |
| Single Male/Father | 14 (5.0%) | 2.79 |
| Single Female/Mother | 32 (11.5%) | 2.56 |
| Non-family | 103 (36.9%) | - |
| Total Households | 279 (100.0%) | 2.19 |
Household Size by Marriage Status in Lemon Grove
Out of a total of 279 households in Lemon Grove, 176 (63.1%) are family households, while 103 (36.9%) are nonfamily households. The most numerous type of family households are 4-person households, comprising 112, and the most common type of nonfamily households are 1-person households, comprising 103.
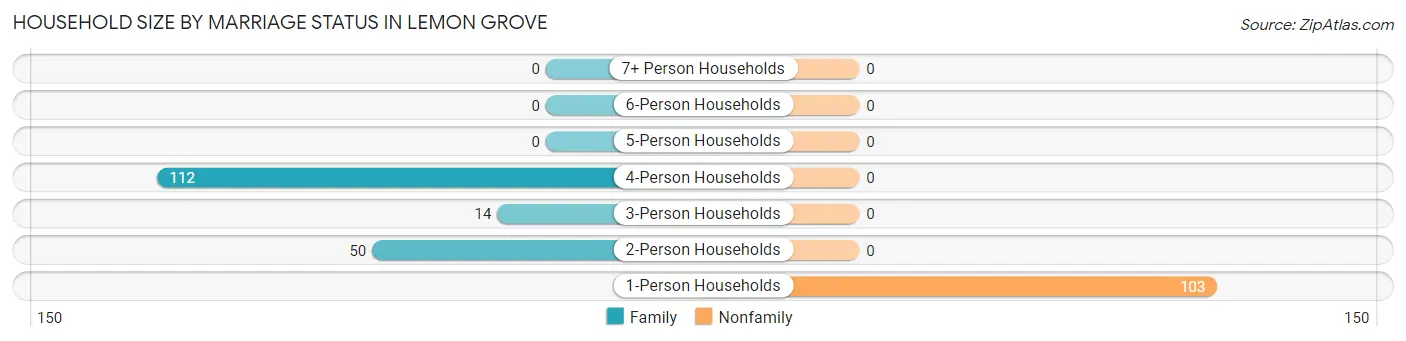
| Household Size | Family Households | Nonfamily Households |
| 1-Person Households | - | 103 (36.9%) |
| 2-Person Households | 50 (17.9%) | 0 (0.0%) |
| 3-Person Households | 14 (5.0%) | 0 (0.0%) |
| 4-Person Households | 112 (40.1%) | 0 (0.0%) |
| 5-Person Households | 0 (0.0%) | 0 (0.0%) |
| 6-Person Households | 0 (0.0%) | 0 (0.0%) |
| 7+ Person Households | 0 (0.0%) | 0 (0.0%) |
| Total | 176 (63.1%) | 103 (36.9%) |
Female Fertility in Lemon Grove
Fertility by Age in Lemon Grove
| Age Bracket | Women with Births | Births / 1,000 Women |
| 15 to 19 years | 0 (0.0%) | 0.0 |
| 20 to 34 years | 0 (0.0%) | 0.0 |
| 35 to 50 years | 0 (0.0%) | 0.0 |
| Total | 0 (0.0%) | 0.0 |
Fertility by Age by Marriage Status in Lemon Grove
| Age Bracket | Married | Unmarried |
| 15 to 19 years | 0 (0.0%) | 0 (0.0%) |
| 20 to 34 years | 0 (0.0%) | 0 (0.0%) |
| 35 to 50 years | 0 (0.0%) | 0 (0.0%) |
| Total | 0 (0.0%) | 0 (0.0%) |
Fertility by Education in Lemon Grove
| Educational Attainment | Women with Births | Births / 1,000 Women |
| Less than High School | 0 (0.0%) | 0.0 |
| High School Diploma | 0 (0.0%) | 0.0 |
| College or Associate's Degree | 0 (0.0%) | 0.0 |
| Bachelor's Degree | 0 (0.0%) | 0.0 |
| Graduate Degree | 0 (0.0%) | 0.0 |
| Total | 0 (0.0%) | 0.0 |
Fertility by Education by Marriage Status in Lemon Grove
| Educational Attainment | Married | Unmarried |
| Less than High School | 0 (0.0%) | 0 (0.0%) |
| High School Diploma | 0 (0.0%) | 0 (0.0%) |
| College or Associate's Degree | 0 (0.0%) | 0 (0.0%) |
| Bachelor's Degree | 0 (0.0%) | 0 (0.0%) |
| Graduate Degree | 0 (0.0%) | 0 (0.0%) |
| Total | 0 (0.0%) | 0 (0.0%) |
Employment Characteristics in Lemon Grove
Employment by Class of Employer in Lemon Grove
Among the 307 employed individuals in Lemon Grove, private company employees (250 | 81.4%), local government employees (35 | 11.4%), and self-employed (not incorporated) (17 | 5.5%) make up the most common classes of employment.
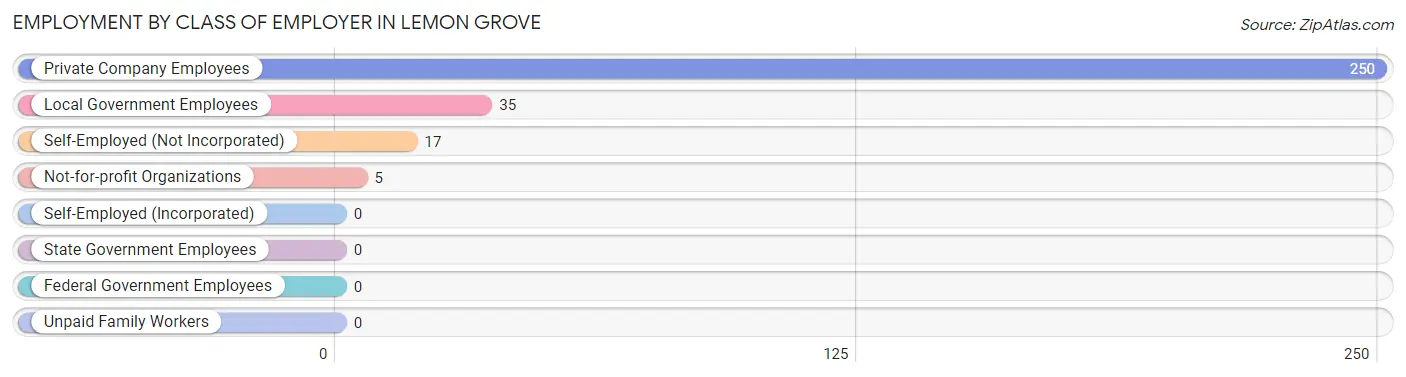
| Employer Class | # Employees | % Employees |
| Private Company Employees | 250 | 81.4% |
| Self-Employed (Incorporated) | 0 | 0.0% |
| Self-Employed (Not Incorporated) | 17 | 5.5% |
| Not-for-profit Organizations | 5 | 1.6% |
| Local Government Employees | 35 | 11.4% |
| State Government Employees | 0 | 0.0% |
| Federal Government Employees | 0 | 0.0% |
| Unpaid Family Workers | 0 | 0.0% |
| Total | 307 | 100.0% |
Employment Status by Age in Lemon Grove
According to the labor force statistics for Lemon Grove, out of the total population over 16 years of age (508), 63.4% or 322 individuals are in the labor force, with 4.7% or 15 of them unemployed. The age group with the highest labor force participation rate is 20 to 24 years, with 100.0% or 47 individuals in the labor force. Within the labor force, the 30 to 34 years age range has the highest percentage of unemployed individuals, with 100.0% or 15 of them being unemployed.
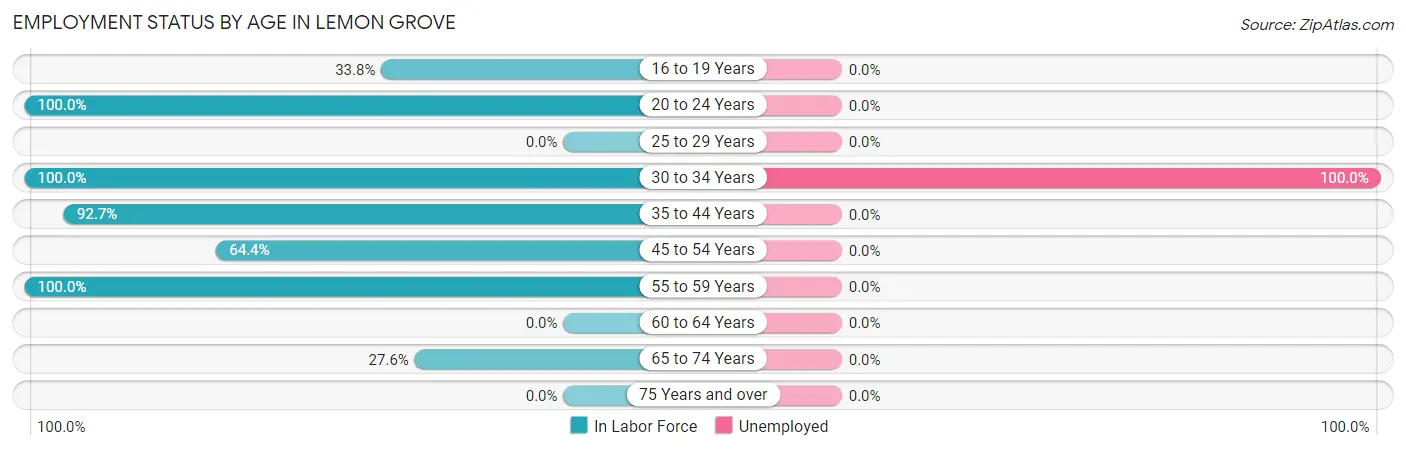
| Age Bracket | In Labor Force | Unemployed |
| 16 to 19 Years | 25 (33.8%) | 0 (0.0%) |
| 20 to 24 Years | 47 (100.0%) | 0 (0.0%) |
| 25 to 29 Years | 0 (0.0%) | 0 (0.0%) |
| 30 to 34 Years | 15 (100.0%) | 15 (100.0%) |
| 35 to 44 Years | 127 (92.7%) | 0 (0.0%) |
| 45 to 54 Years | 65 (64.4%) | 0 (0.0%) |
| 55 to 59 Years | 19 (100.0%) | 0 (0.0%) |
| 60 to 64 Years | 0 (0.0%) | 0 (0.0%) |
| 65 to 74 Years | 24 (27.6%) | 0 (0.0%) |
| 75 Years and over | 0 (0.0%) | 0 (0.0%) |
| Total | 322 (63.4%) | 15 (4.7%) |
Employment Status by Educational Attainment in Lemon Grove
According to labor force statistics for Lemon Grove, 83.1% of individuals (226) out of the total population between 25 and 64 years of age (272) are in the labor force, with 6.6% or 15 of them being unemployed. The group with the highest labor force participation rate are those with the educational attainment of college / associate degree, with 95.8% or 115 individuals in the labor force. Within the labor force, individuals with high school diploma education have the highest percentage of unemployment, with 21.1% or 15 of them being unemployed.
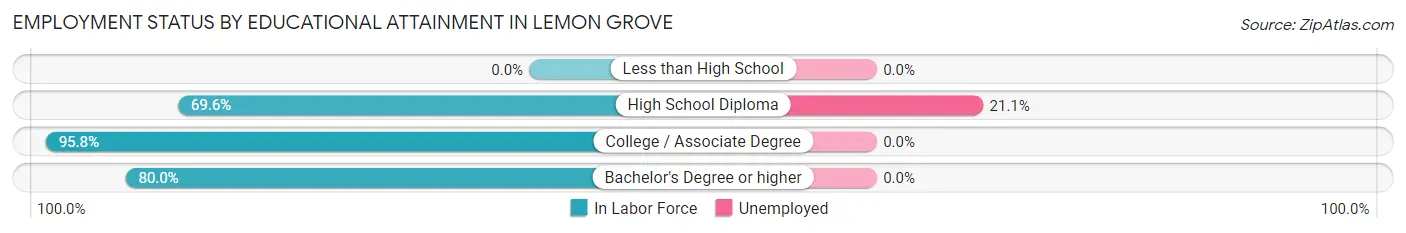
| Educational Attainment | In Labor Force | Unemployed |
| Less than High School | 0 (0.0%) | 0 (0.0%) |
| High School Diploma | 71 (69.6%) | 22 (21.1%) |
| College / Associate Degree | 115 (95.8%) | 0 (0.0%) |
| Bachelor's Degree or higher | 40 (80.0%) | 0 (0.0%) |
| Total | 226 (83.1%) | 18 (6.6%) |
Employment Occupations by Sex in Lemon Grove
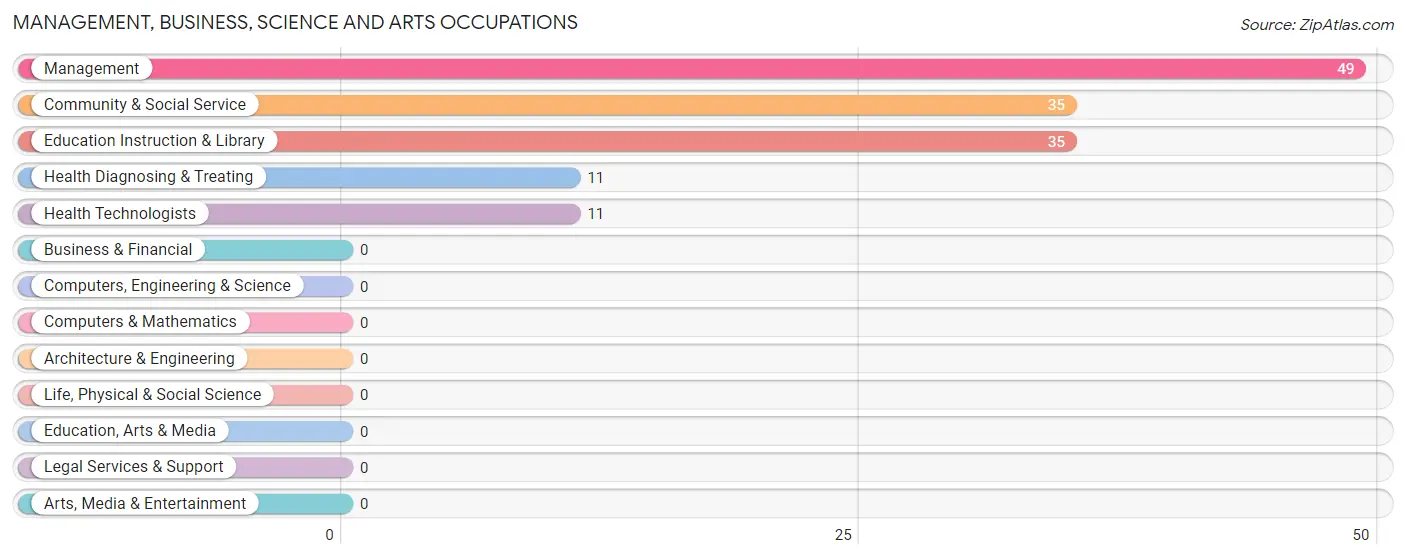
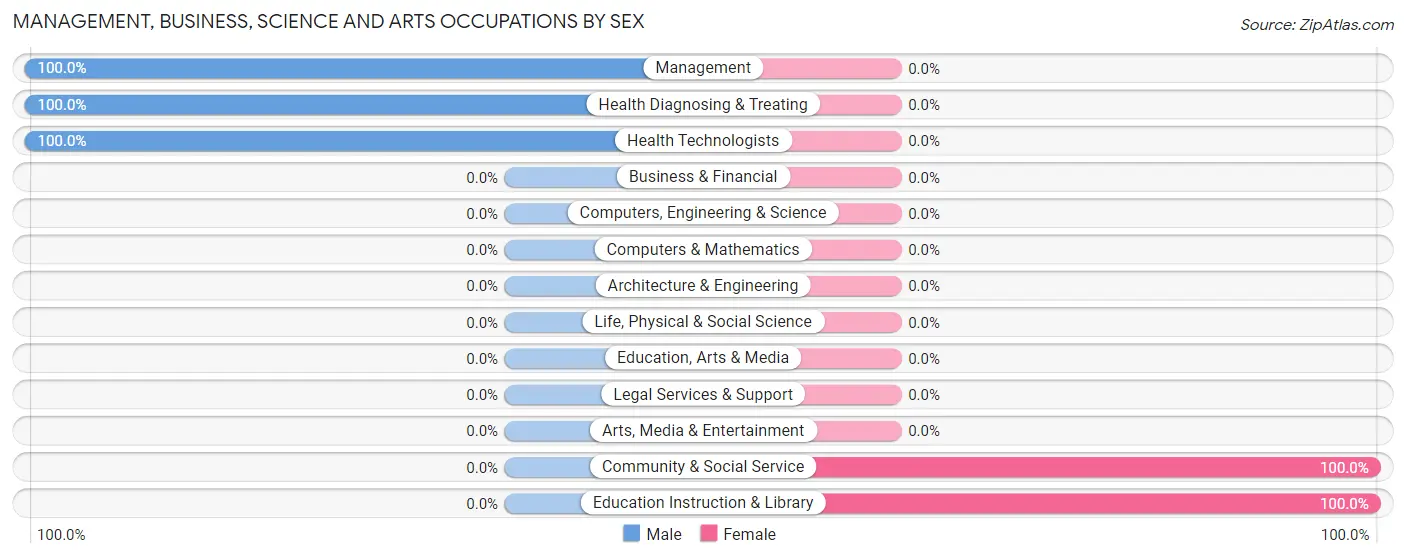
Management, Business, Science and Arts Occupations
The most common Management, Business, Science and Arts occupations in Lemon Grove are Management (49 | 16.0%), Community & Social Service (35 | 11.4%), Education Instruction & Library (35 | 11.4%), Health Diagnosing & Treating (11 | 3.6%), and Health Technologists (11 | 3.6%).
Management, Business, Science and Arts Occupations by Sex
Within the Management, Business, Science and Arts occupations in Lemon Grove, the most male-oriented occupations are Management (100.0%), Health Diagnosing & Treating (100.0%), and Health Technologists (100.0%), while the most female-oriented occupations are Community & Social Service (100.0%), and Education Instruction & Library (100.0%).
| Occupation | Male | Female |
| Management | 49 (100.0%) | 0 (0.0%) |
| Business & Financial | 0 (0.0%) | 0 (0.0%) |
| Computers, Engineering & Science | 0 (0.0%) | 0 (0.0%) |
| Computers & Mathematics | 0 (0.0%) | 0 (0.0%) |
| Architecture & Engineering | 0 (0.0%) | 0 (0.0%) |
| Life, Physical & Social Science | 0 (0.0%) | 0 (0.0%) |
| Community & Social Service | 0 (0.0%) | 35 (100.0%) |
| Education, Arts & Media | 0 (0.0%) | 0 (0.0%) |
| Legal Services & Support | 0 (0.0%) | 0 (0.0%) |
| Education Instruction & Library | 0 (0.0%) | 35 (100.0%) |
| Arts, Media & Entertainment | 0 (0.0%) | 0 (0.0%) |
| Health Diagnosing & Treating | 11 (100.0%) | 0 (0.0%) |
| Health Technologists | 11 (100.0%) | 0 (0.0%) |
| Total (Category) | 60 (63.2%) | 35 (36.8%) |
| Total (Overall) | 138 (45.0%) | 169 (55.0%) |
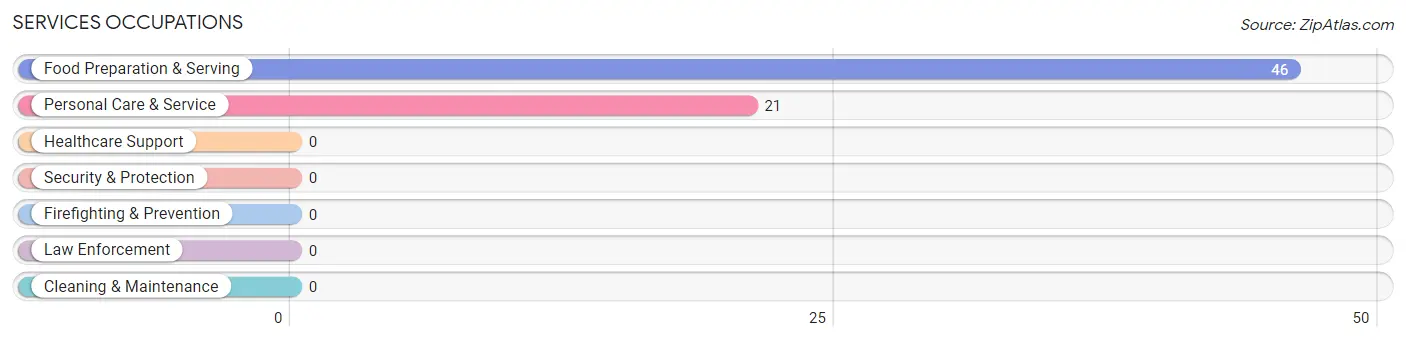
Services Occupations
The most common Services occupations in Lemon Grove are Food Preparation & Serving (46 | 15.0%), and Personal Care & Service (21 | 6.8%).
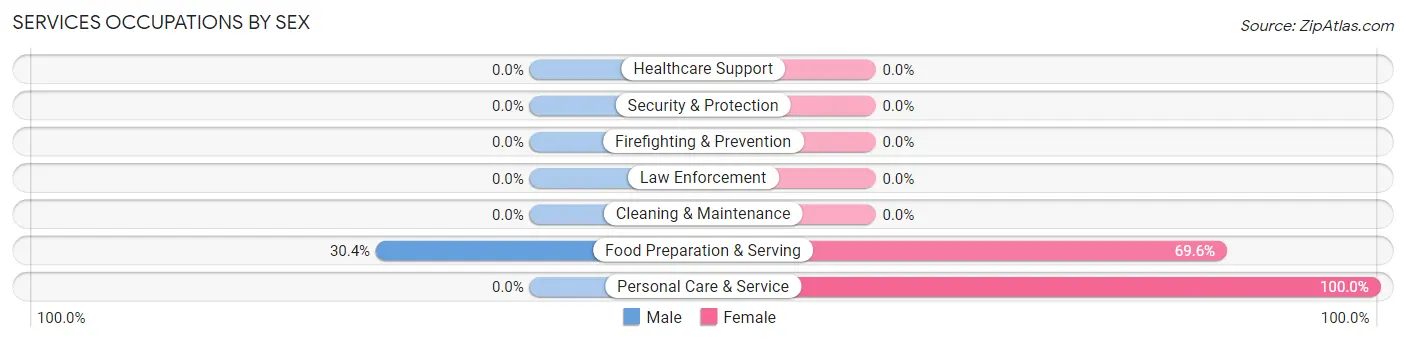
Services Occupations by Sex
| Occupation | Male | Female |
| Healthcare Support | 0 (0.0%) | 0 (0.0%) |
| Security & Protection | 0 (0.0%) | 0 (0.0%) |
| Firefighting & Prevention | 0 (0.0%) | 0 (0.0%) |
| Law Enforcement | 0 (0.0%) | 0 (0.0%) |
| Food Preparation & Serving | 14 (30.4%) | 32 (69.6%) |
| Cleaning & Maintenance | 0 (0.0%) | 0 (0.0%) |
| Personal Care & Service | 0 (0.0%) | 21 (100.0%) |
| Total (Category) | 14 (20.9%) | 53 (79.1%) |
| Total (Overall) | 138 (45.0%) | 169 (55.0%) |
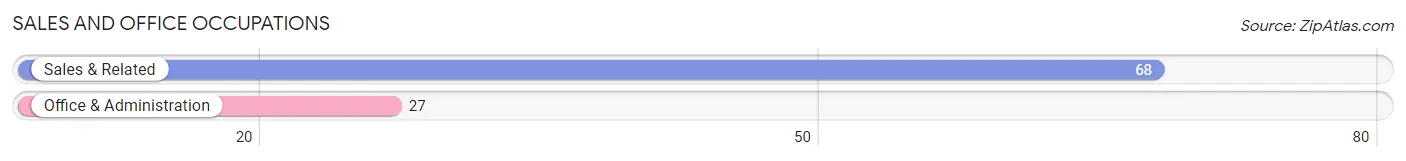
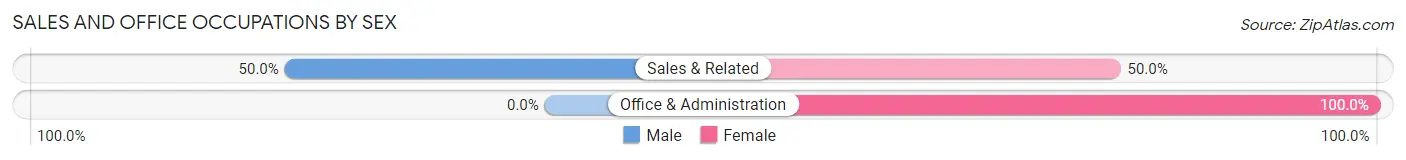
Sales and Office Occupations
The most common Sales and Office occupations in Lemon Grove are Sales & Related (68 | 22.2%), and Office & Administration (27 | 8.8%).
Sales and Office Occupations by Sex
| Occupation | Male | Female |
| Sales & Related | 34 (50.0%) | 34 (50.0%) |
| Office & Administration | 0 (0.0%) | 27 (100.0%) |
| Total (Category) | 34 (35.8%) | 61 (64.2%) |
| Total (Overall) | 138 (45.0%) | 169 (55.0%) |
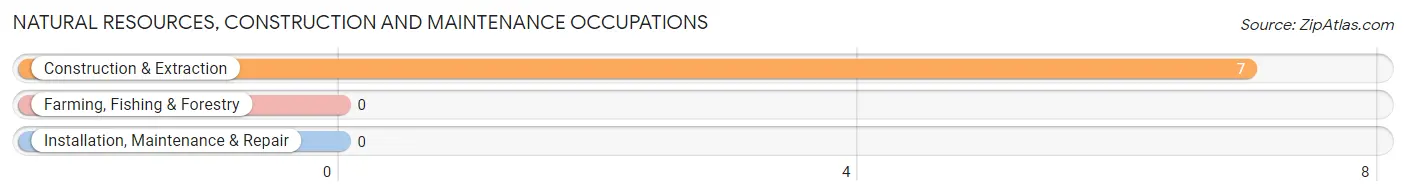
Natural Resources, Construction and Maintenance Occupations
The most common Natural Resources, Construction and Maintenance occupations in Lemon Grove are , and Construction & Extraction (7 | 2.3%).
Natural Resources, Construction and Maintenance Occupations by Sex
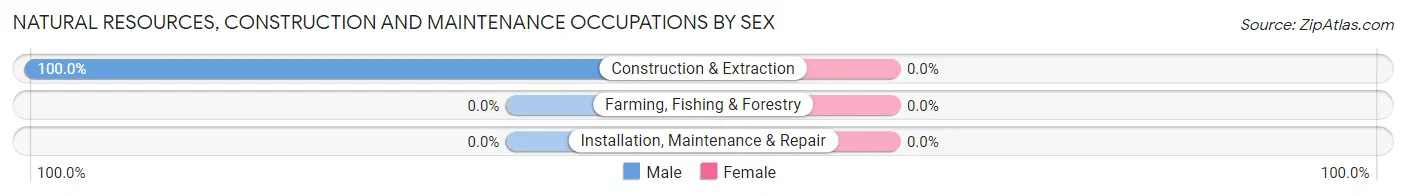
| Occupation | Male | Female |
| Farming, Fishing & Forestry | 0 (0.0%) | 0 (0.0%) |
| Construction & Extraction | 7 (100.0%) | 0 (0.0%) |
| Installation, Maintenance & Repair | 0 (0.0%) | 0 (0.0%) |
| Total (Category) | 7 (100.0%) | 0 (0.0%) |
| Total (Overall) | 138 (45.0%) | 169 (55.0%) |
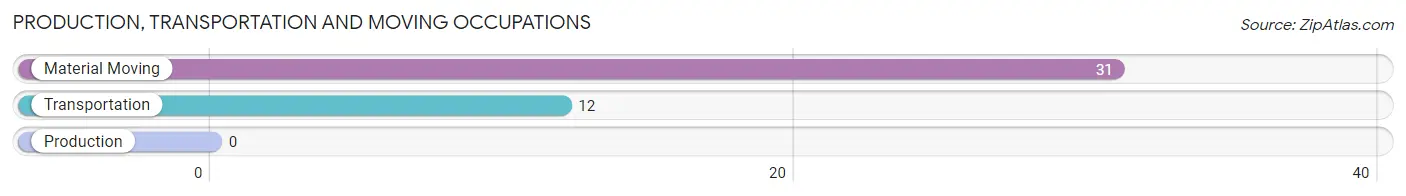
Production, Transportation and Moving Occupations
The most common Production, Transportation and Moving occupations in Lemon Grove are Material Moving (31 | 10.1%), and Transportation (12 | 3.9%).
Production, Transportation and Moving Occupations by Sex
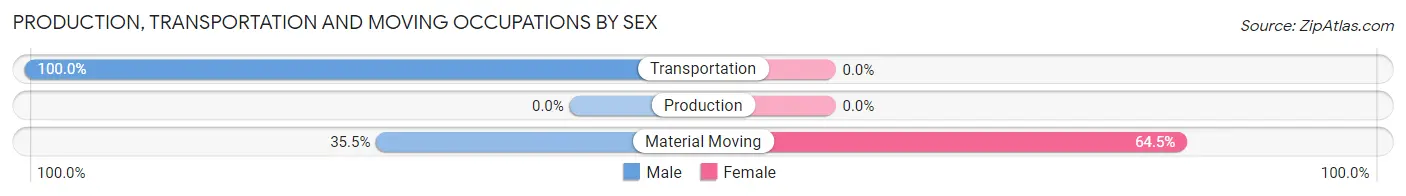
| Occupation | Male | Female |
| Production | 0 (0.0%) | 0 (0.0%) |
| Transportation | 12 (100.0%) | 0 (0.0%) |
| Material Moving | 11 (35.5%) | 20 (64.5%) |
| Total (Category) | 23 (53.5%) | 20 (46.5%) |
| Total (Overall) | 138 (45.0%) | 169 (55.0%) |
Employment Industries by Sex in Lemon Grove
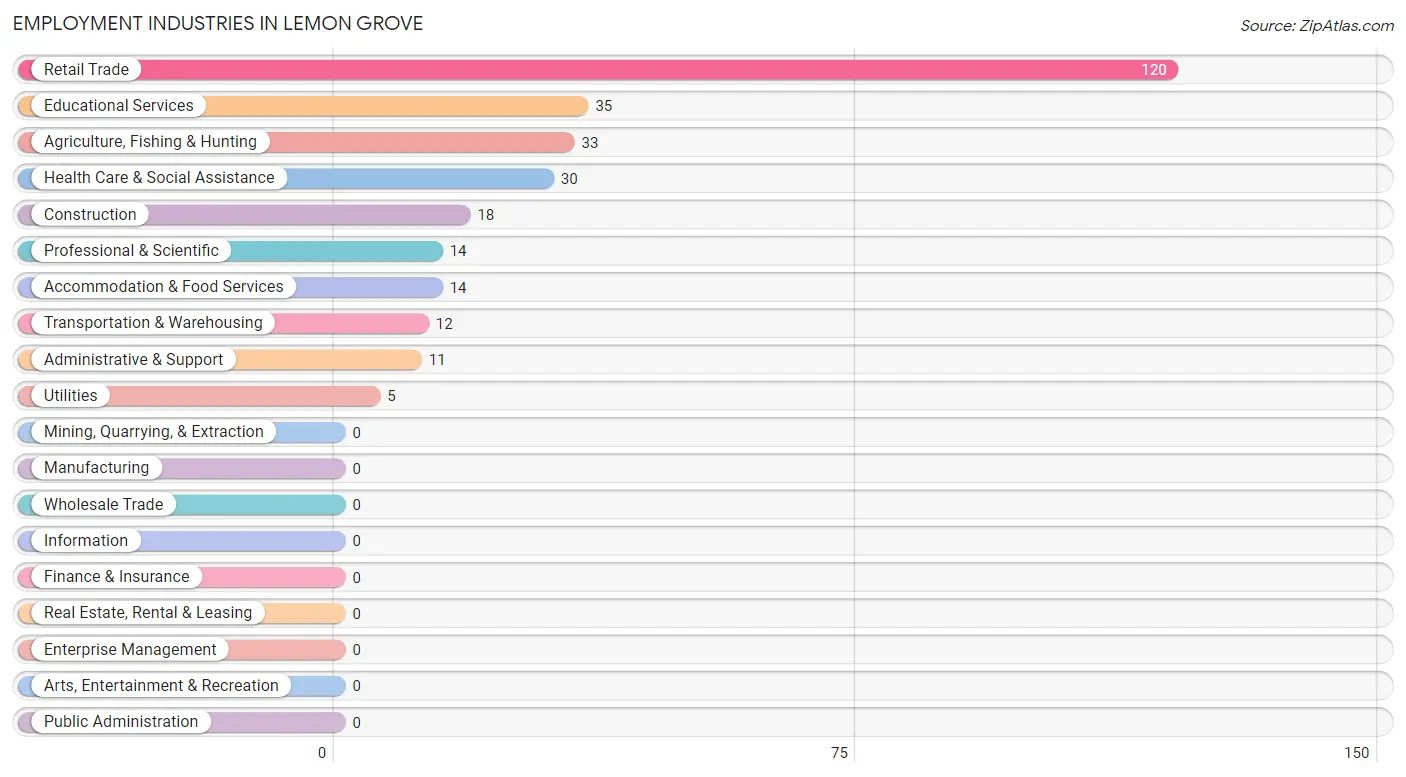
Employment Industries in Lemon Grove
The major employment industries in Lemon Grove include Retail Trade (120 | 39.1%), Educational Services (35 | 11.4%), Agriculture, Fishing & Hunting (33 | 10.7%), Health Care & Social Assistance (30 | 9.8%), and Construction (18 | 5.9%).
Employment Industries by Sex in Lemon Grove
The Lemon Grove industries that see more men than women are Agriculture, Fishing & Hunting (100.0%), Construction (100.0%), and Transportation & Warehousing (100.0%), whereas the industries that tend to have a higher number of women are Professional & Scientific (100.0%), Educational Services (100.0%), and Retail Trade (71.7%).
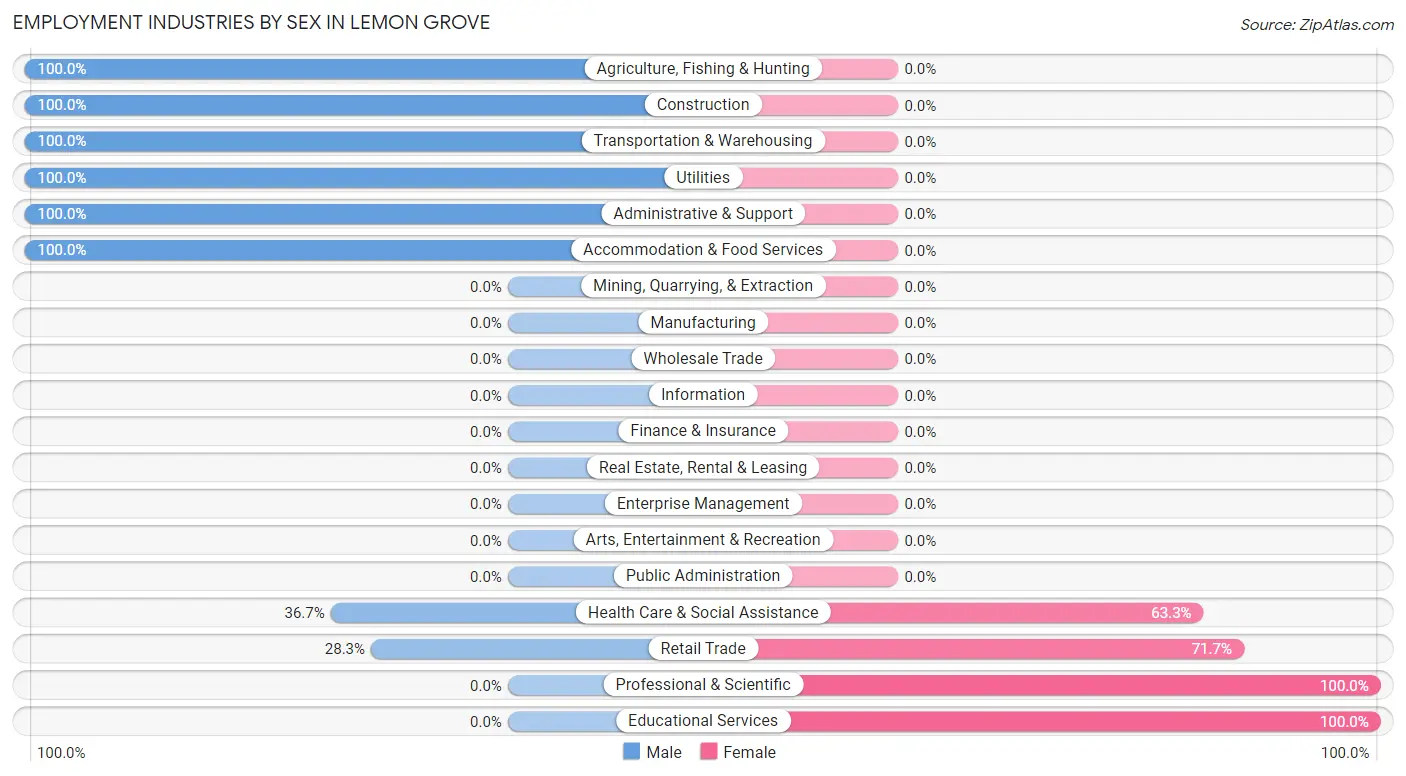
| Industry | Male | Female |
| Agriculture, Fishing & Hunting | 33 (100.0%) | 0 (0.0%) |
| Mining, Quarrying, & Extraction | 0 (0.0%) | 0 (0.0%) |
| Construction | 18 (100.0%) | 0 (0.0%) |
| Manufacturing | 0 (0.0%) | 0 (0.0%) |
| Wholesale Trade | 0 (0.0%) | 0 (0.0%) |
| Retail Trade | 34 (28.3%) | 86 (71.7%) |
| Transportation & Warehousing | 12 (100.0%) | 0 (0.0%) |
| Utilities | 5 (100.0%) | 0 (0.0%) |
| Information | 0 (0.0%) | 0 (0.0%) |
| Finance & Insurance | 0 (0.0%) | 0 (0.0%) |
| Real Estate, Rental & Leasing | 0 (0.0%) | 0 (0.0%) |
| Professional & Scientific | 0 (0.0%) | 14 (100.0%) |
| Enterprise Management | 0 (0.0%) | 0 (0.0%) |
| Administrative & Support | 11 (100.0%) | 0 (0.0%) |
| Educational Services | 0 (0.0%) | 35 (100.0%) |
| Health Care & Social Assistance | 11 (36.7%) | 19 (63.3%) |
| Arts, Entertainment & Recreation | 0 (0.0%) | 0 (0.0%) |
| Accommodation & Food Services | 14 (100.0%) | 0 (0.0%) |
| Public Administration | 0 (0.0%) | 0 (0.0%) |
| Total | 138 (45.0%) | 169 (55.0%) |
Education in Lemon Grove
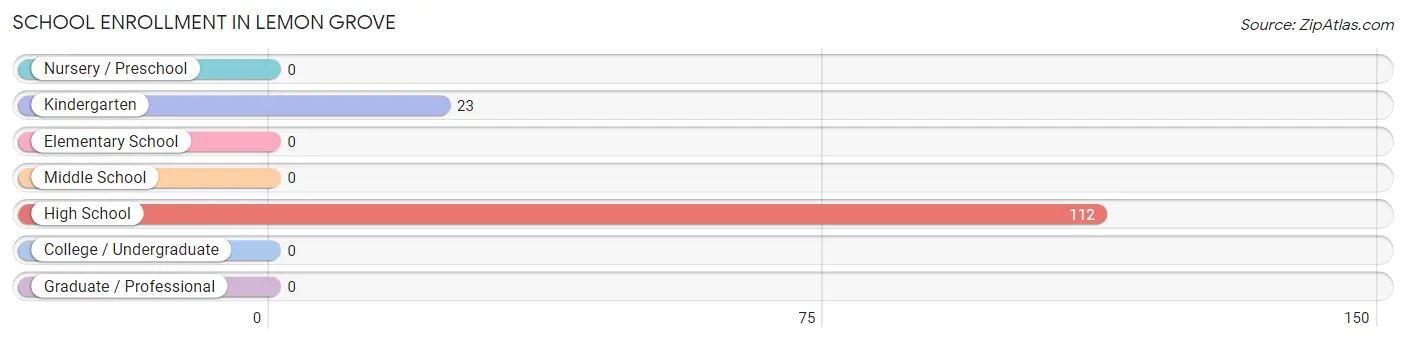
School Enrollment in Lemon Grove
The most common levels of schooling among the 135 students in Lemon Grove are high school (112 | 83.0%), and kindergarten (23 | 17.0%).
| School Level | # Students | % Students |
| Nursery / Preschool | 0 | 0.0% |
| Kindergarten | 23 | 17.0% |
| Elementary School | 0 | 0.0% |
| Middle School | 0 | 0.0% |
| High School | 112 | 83.0% |
| College / Undergraduate | 0 | 0.0% |
| Graduate / Professional | 0 | 0.0% |
| Total | 135 | 100.0% |
School Enrollment by Age by Funding Source in Lemon Grove
Out of a total of 135 students who are enrolled in schools in Lemon Grove, 22 (16.3%) attend a private institution, while the remaining 113 (83.7%) are enrolled in public schools. The age group of 10 to 14 year olds has the highest likelihood of being enrolled in private schools, with 22 (42.3% in the age bracket) enrolled. Conversely, the age group of 5 to 9 year old has the lowest likelihood of being enrolled in a private school, with 23 (100.0% in the age bracket) attending a public institution.
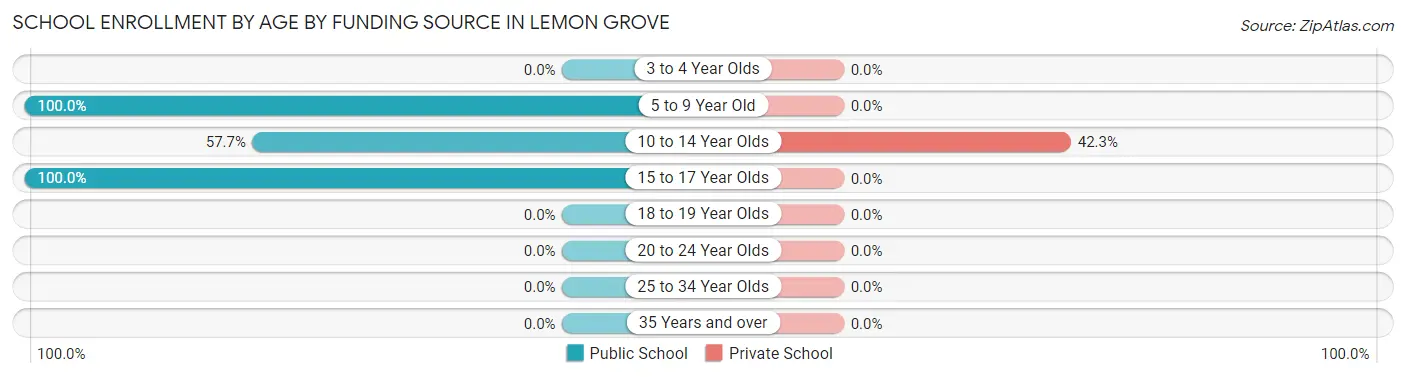
| Age Bracket | Public School | Private School |
| 3 to 4 Year Olds | 0 (0.0%) | 0 (0.0%) |
| 5 to 9 Year Old | 23 (100.0%) | 0 (0.0%) |
| 10 to 14 Year Olds | 30 (57.7%) | 22 (42.3%) |
| 15 to 17 Year Olds | 60 (100.0%) | 0 (0.0%) |
| 18 to 19 Year Olds | 0 (0.0%) | 0 (0.0%) |
| 20 to 24 Year Olds | 0 (0.0%) | 0 (0.0%) |
| 25 to 34 Year Olds | 0 (0.0%) | 0 (0.0%) |
| 35 Years and over | 0 (0.0%) | 0 (0.0%) |
| Total | 113 (83.7%) | 22 (16.3%) |
Educational Attainment by Field of Study in Lemon Grove
Education (35 | 47.9%), bio, nature & agricultural (23 | 31.5%), social sciences (10 | 13.7%), and business (5 | 6.9%) are the most common fields of study among 73 individuals in Lemon Grove who have obtained a bachelor's degree or higher.
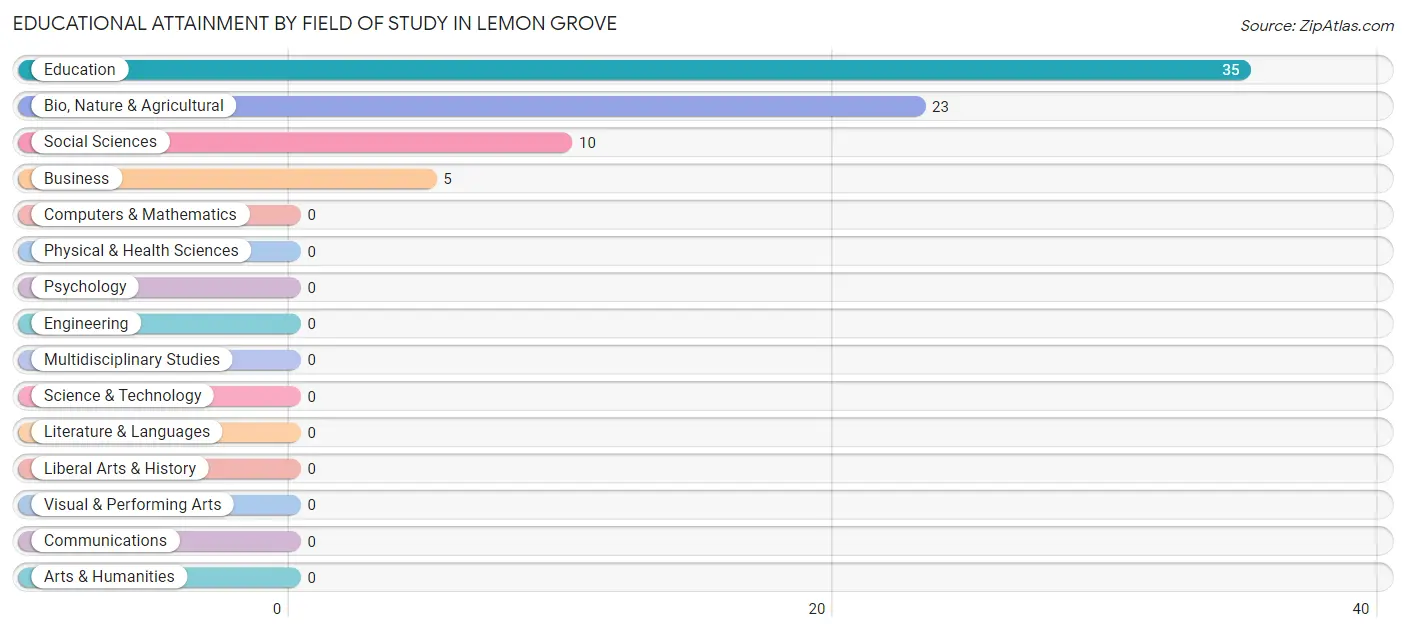
| Field of Study | # Graduates | % Graduates |
| Computers & Mathematics | 0 | 0.0% |
| Bio, Nature & Agricultural | 23 | 31.5% |
| Physical & Health Sciences | 0 | 0.0% |
| Psychology | 0 | 0.0% |
| Social Sciences | 10 | 13.7% |
| Engineering | 0 | 0.0% |
| Multidisciplinary Studies | 0 | 0.0% |
| Science & Technology | 0 | 0.0% |
| Business | 5 | 6.9% |
| Education | 35 | 47.9% |
| Literature & Languages | 0 | 0.0% |
| Liberal Arts & History | 0 | 0.0% |
| Visual & Performing Arts | 0 | 0.0% |
| Communications | 0 | 0.0% |
| Arts & Humanities | 0 | 0.0% |
| Total | 73 | 100.0% |
Transportation & Commute in Lemon Grove
Vehicle Availability by Sex in Lemon Grove
The most prevalent vehicle ownership categories in Lemon Grove are males with 2 vehicles (59, accounting for 42.7%) and females with 2 vehicles (73, making up 34.9%).
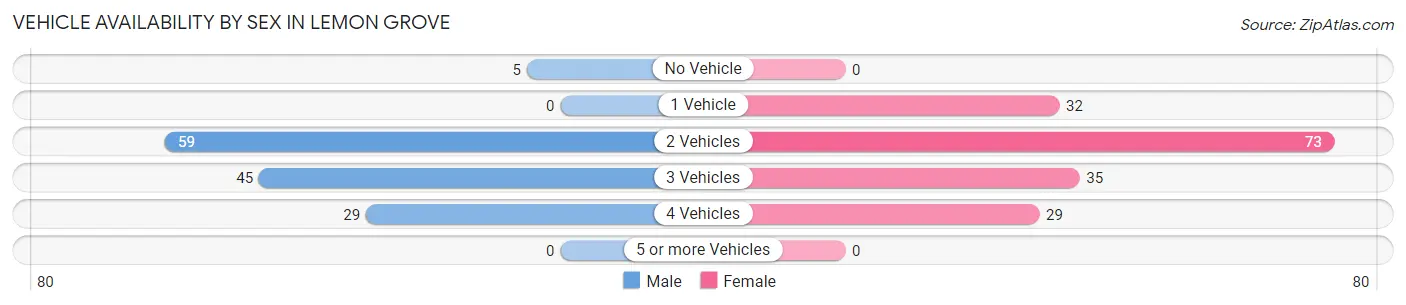
| Vehicles Available | Male | Female |
| No Vehicle | 5 (3.6%) | 0 (0.0%) |
| 1 Vehicle | 0 (0.0%) | 32 (18.9%) |
| 2 Vehicles | 59 (42.7%) | 73 (43.2%) |
| 3 Vehicles | 45 (32.6%) | 35 (20.7%) |
| 4 Vehicles | 29 (21.0%) | 29 (17.2%) |
| 5 or more Vehicles | 0 (0.0%) | 0 (0.0%) |
| Total | 138 (100.0%) | 169 (100.0%) |
Commute Time in Lemon Grove
The most frequently occuring commute durations in Lemon Grove are 15 to 19 minutes (95 commuters, 32.4%), 20 to 24 minutes (91 commuters, 31.1%), and 30 to 34 minutes (67 commuters, 22.9%).
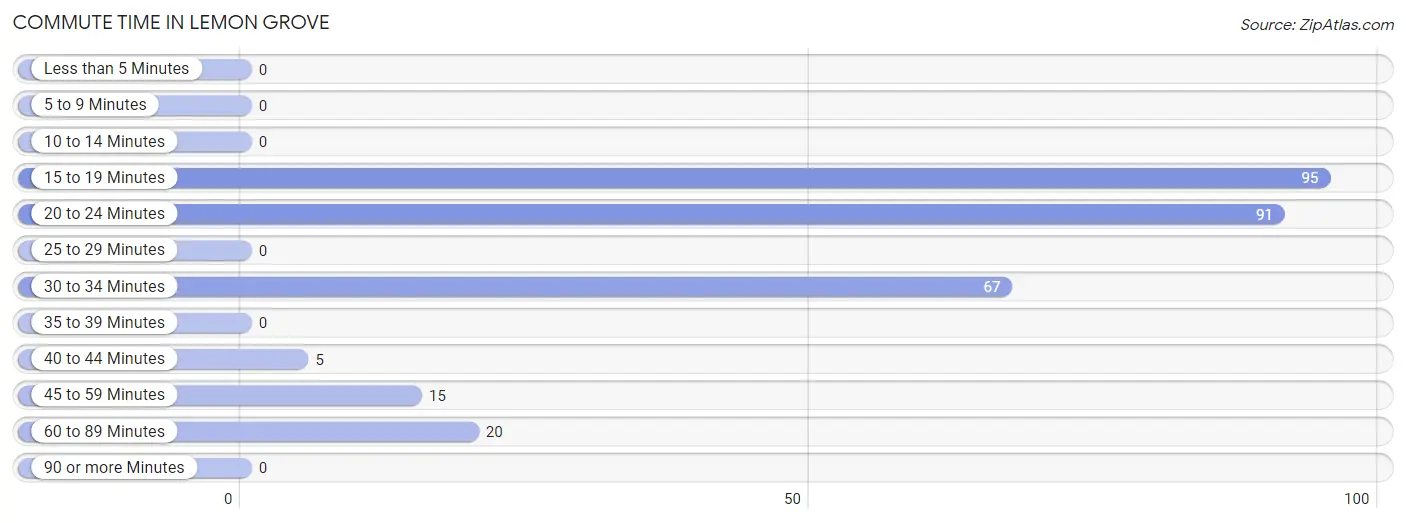
| Commute Time | # Commuters | % Commuters |
| Less than 5 Minutes | 0 | 0.0% |
| 5 to 9 Minutes | 0 | 0.0% |
| 10 to 14 Minutes | 0 | 0.0% |
| 15 to 19 Minutes | 95 | 32.4% |
| 20 to 24 Minutes | 91 | 31.1% |
| 25 to 29 Minutes | 0 | 0.0% |
| 30 to 34 Minutes | 67 | 22.9% |
| 35 to 39 Minutes | 0 | 0.0% |
| 40 to 44 Minutes | 5 | 1.7% |
| 45 to 59 Minutes | 15 | 5.1% |
| 60 to 89 Minutes | 20 | 6.8% |
| 90 or more Minutes | 0 | 0.0% |
Commute Time by Sex in Lemon Grove
The most common commute times in Lemon Grove are 15 to 19 minutes (82 commuters, 59.4%) for males and 20 to 24 minutes (73 commuters, 47.1%) for females.
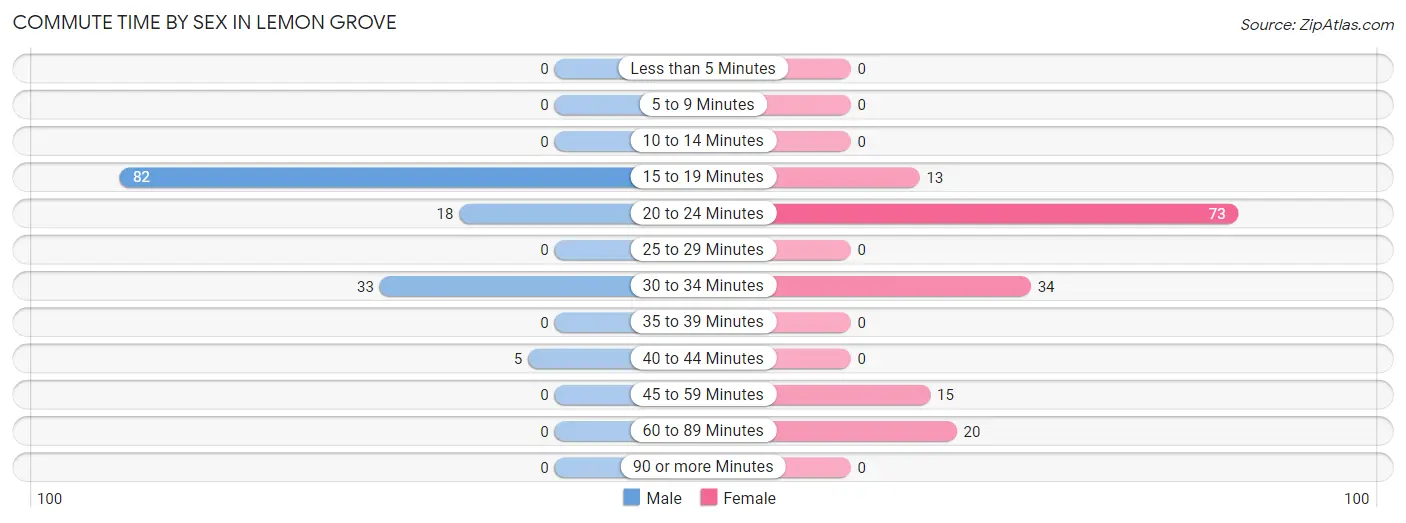
| Commute Time | Male | Female |
| Less than 5 Minutes | 0 (0.0%) | 0 (0.0%) |
| 5 to 9 Minutes | 0 (0.0%) | 0 (0.0%) |
| 10 to 14 Minutes | 0 (0.0%) | 0 (0.0%) |
| 15 to 19 Minutes | 82 (59.4%) | 13 (8.4%) |
| 20 to 24 Minutes | 18 (13.0%) | 73 (47.1%) |
| 25 to 29 Minutes | 0 (0.0%) | 0 (0.0%) |
| 30 to 34 Minutes | 33 (23.9%) | 34 (21.9%) |
| 35 to 39 Minutes | 0 (0.0%) | 0 (0.0%) |
| 40 to 44 Minutes | 5 (3.6%) | 0 (0.0%) |
| 45 to 59 Minutes | 0 (0.0%) | 15 (9.7%) |
| 60 to 89 Minutes | 0 (0.0%) | 20 (12.9%) |
| 90 or more Minutes | 0 (0.0%) | 0 (0.0%) |
Time of Departure to Work by Sex in Lemon Grove
The most frequent times of departure to work in Lemon Grove are 7:00 AM to 7:29 AM (38, 27.5%) for males and 5:30 AM to 5:59 AM (54, 34.8%) for females.
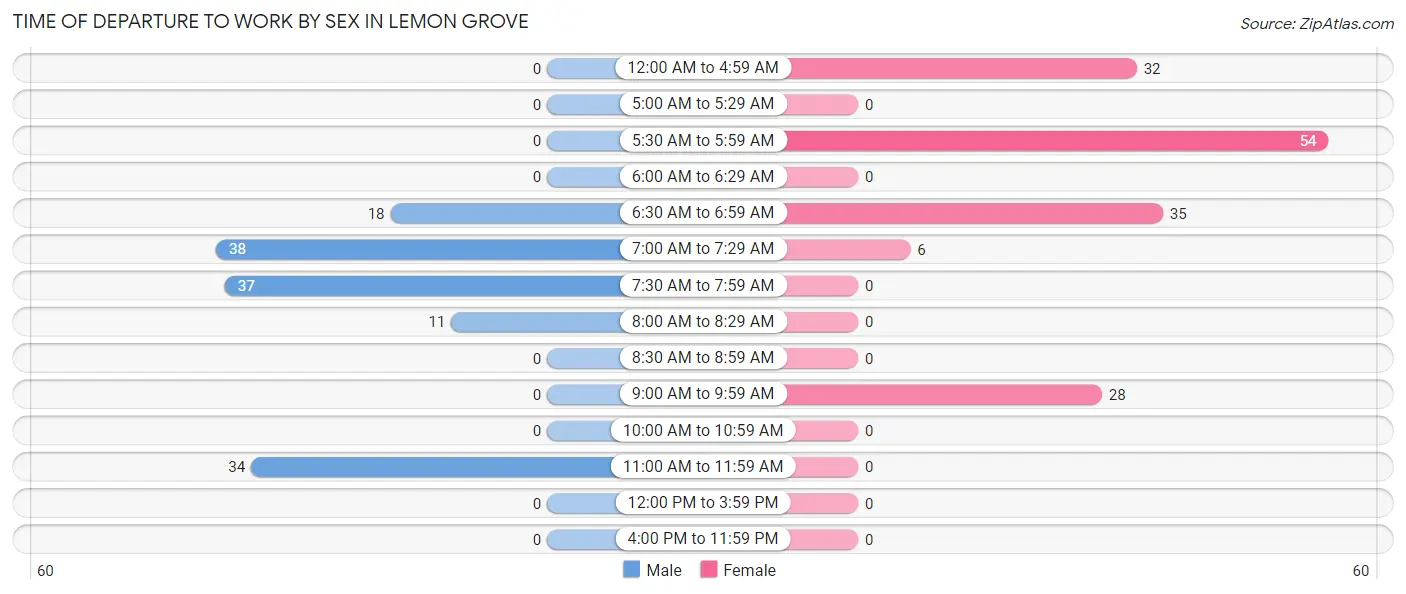
| Time of Departure | Male | Female |
| 12:00 AM to 4:59 AM | 0 (0.0%) | 32 (20.6%) |
| 5:00 AM to 5:29 AM | 0 (0.0%) | 0 (0.0%) |
| 5:30 AM to 5:59 AM | 0 (0.0%) | 54 (34.8%) |
| 6:00 AM to 6:29 AM | 0 (0.0%) | 0 (0.0%) |
| 6:30 AM to 6:59 AM | 18 (13.0%) | 35 (22.6%) |
| 7:00 AM to 7:29 AM | 38 (27.5%) | 6 (3.9%) |
| 7:30 AM to 7:59 AM | 37 (26.8%) | 0 (0.0%) |
| 8:00 AM to 8:29 AM | 11 (8.0%) | 0 (0.0%) |
| 8:30 AM to 8:59 AM | 0 (0.0%) | 0 (0.0%) |
| 9:00 AM to 9:59 AM | 0 (0.0%) | 28 (18.1%) |
| 10:00 AM to 10:59 AM | 0 (0.0%) | 0 (0.0%) |
| 11:00 AM to 11:59 AM | 34 (24.6%) | 0 (0.0%) |
| 12:00 PM to 3:59 PM | 0 (0.0%) | 0 (0.0%) |
| 4:00 PM to 11:59 PM | 0 (0.0%) | 0 (0.0%) |
| Total | 138 (100.0%) | 155 (100.0%) |
Housing Occupancy in Lemon Grove
Occupancy by Ownership in Lemon Grove
Of the total 279 dwellings in Lemon Grove, owner-occupied units account for 189 (67.7%), while renter-occupied units make up 90 (32.3%).
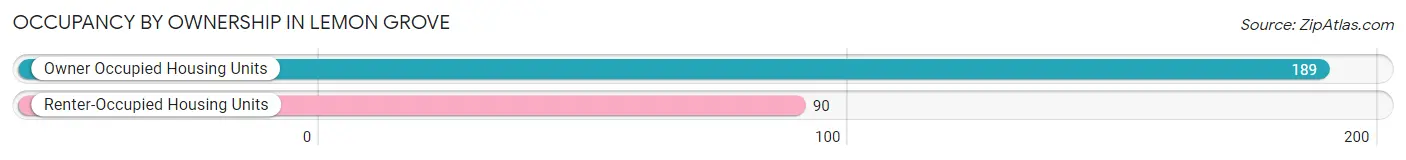
| Occupancy | # Housing Units | % Housing Units |
| Owner Occupied Housing Units | 189 | 67.7% |
| Renter-Occupied Housing Units | 90 | 32.3% |
| Total Occupied Housing Units | 279 | 100.0% |
Occupancy by Household Size in Lemon Grove
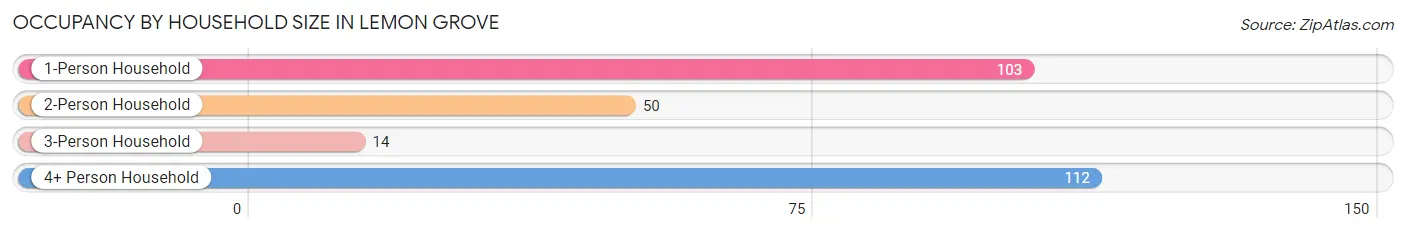
| Household Size | # Housing Units | % Housing Units |
| 1-Person Household | 103 | 36.9% |
| 2-Person Household | 50 | 17.9% |
| 3-Person Household | 14 | 5.0% |
| 4+ Person Household | 112 | 40.1% |
| Total Housing Units | 279 | 100.0% |
Occupancy by Ownership by Household Size in Lemon Grove
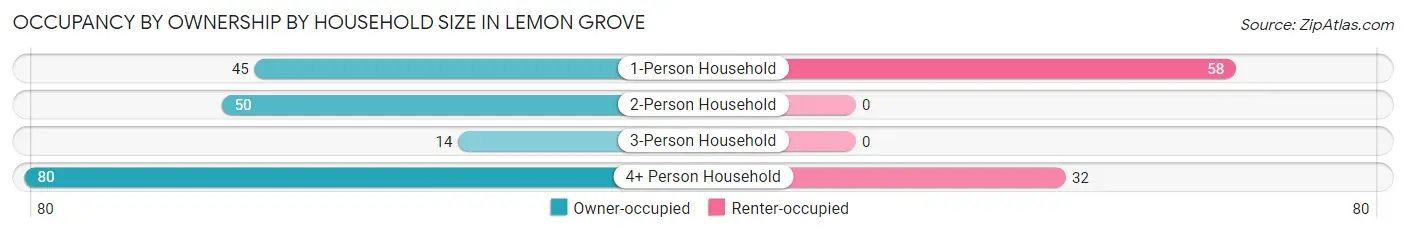
| Household Size | Owner-occupied | Renter-occupied |
| 1-Person Household | 45 (43.7%) | 58 (56.3%) |
| 2-Person Household | 50 (100.0%) | 0 (0.0%) |
| 3-Person Household | 14 (100.0%) | 0 (0.0%) |
| 4+ Person Household | 80 (71.4%) | 32 (28.6%) |
| Total Housing Units | 189 (67.7%) | 90 (32.3%) |
Occupancy by Educational Attainment in Lemon Grove
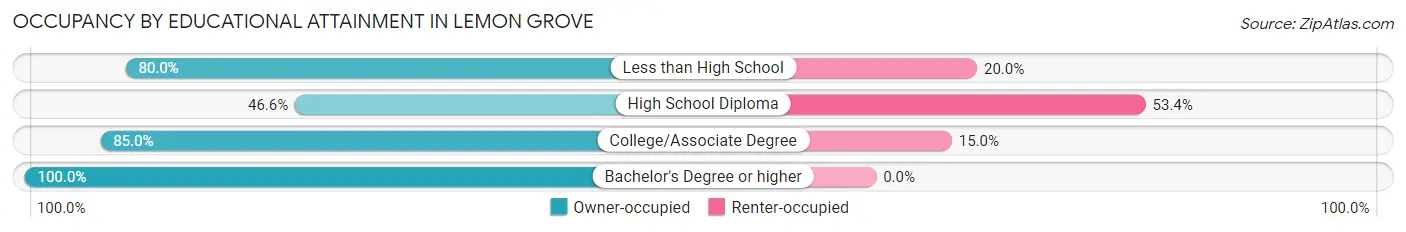
| Household Size | Owner-occupied | Renter-occupied |
| Less than High School | 24 (80.0%) | 6 (20.0%) |
| High School Diploma | 68 (46.6%) | 78 (53.4%) |
| College/Associate Degree | 34 (85.0%) | 6 (15.0%) |
| Bachelor's Degree or higher | 63 (100.0%) | 0 (0.0%) |
Occupancy by Age of Householder in Lemon Grove
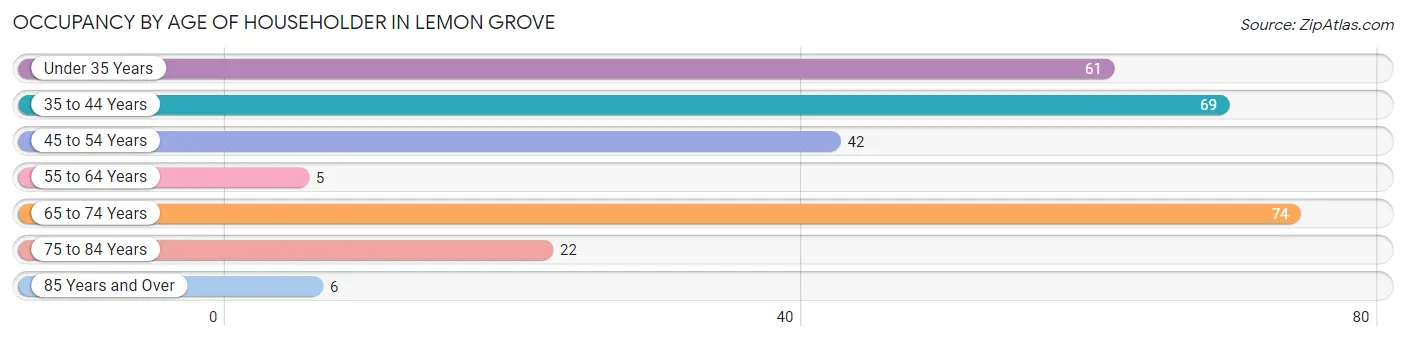
| Age Bracket | # Households | % Households |
| Under 35 Years | 61 | 21.9% |
| 35 to 44 Years | 69 | 24.7% |
| 45 to 54 Years | 42 | 15.0% |
| 55 to 64 Years | 5 | 1.8% |
| 65 to 74 Years | 74 | 26.5% |
| 75 to 84 Years | 22 | 7.9% |
| 85 Years and Over | 6 | 2.1% |
| Total | 279 | 100.0% |
Housing Finances in Lemon Grove
Median Income by Occupancy in Lemon Grove
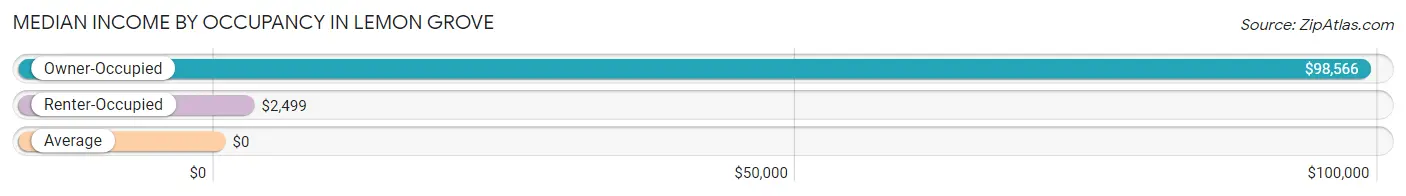
| Occupancy Type | # Households | Median Income |
| Owner-Occupied | 189 (67.7%) | $98,566 |
| Renter-Occupied | 90 (32.3%) | $2,499 |
| Average | 279 (100.0%) | $0 |
Occupancy by Householder Income Bracket in Lemon Grove
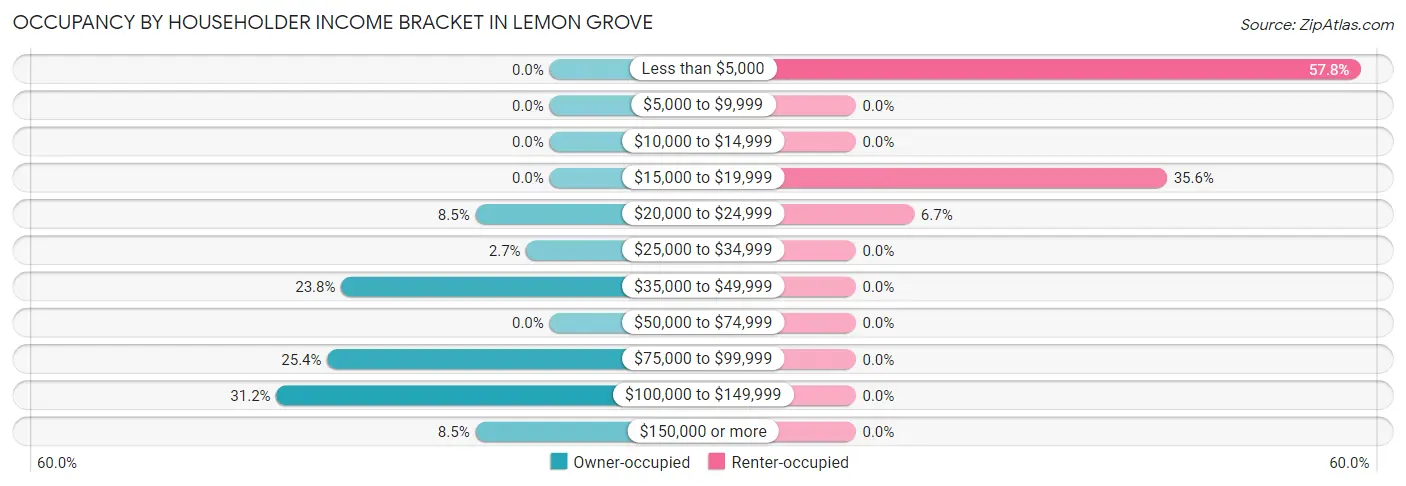
| Income Bracket | Owner-occupied | Renter-occupied |
| Less than $5,000 | 0 (0.0%) | 52 (57.8%) |
| $5,000 to $9,999 | 0 (0.0%) | 0 (0.0%) |
| $10,000 to $14,999 | 0 (0.0%) | 0 (0.0%) |
| $15,000 to $19,999 | 0 (0.0%) | 32 (35.6%) |
| $20,000 to $24,999 | 16 (8.5%) | 6 (6.7%) |
| $25,000 to $34,999 | 5 (2.6%) | 0 (0.0%) |
| $35,000 to $49,999 | 45 (23.8%) | 0 (0.0%) |
| $50,000 to $74,999 | 0 (0.0%) | 0 (0.0%) |
| $75,000 to $99,999 | 48 (25.4%) | 0 (0.0%) |
| $100,000 to $149,999 | 59 (31.2%) | 0 (0.0%) |
| $150,000 or more | 16 (8.5%) | 0 (0.0%) |
| Total | 189 (100.0%) | 90 (100.0%) |
Monthly Housing Cost Tiers in Lemon Grove

| Monthly Cost | Owner-occupied | Renter-occupied |
| Less than $300 | 0 (0.0%) | 6 (6.7%) |
| $300 to $499 | 35 (18.5%) | 15 (16.7%) |
| $500 to $799 | 61 (32.3%) | 31 (34.4%) |
| $800 to $999 | 36 (19.1%) | 32 (35.6%) |
| $1,000 to $1,499 | 34 (18.0%) | 0 (0.0%) |
| $1,500 to $1,999 | 23 (12.2%) | 0 (0.0%) |
| $2,000 to $2,499 | 0 (0.0%) | 0 (0.0%) |
| $2,500 to $2,999 | 0 (0.0%) | 0 (0.0%) |
| $3,000 or more | 0 (0.0%) | 0 (0.0%) |
| Total | 189 (100.0%) | 90 (100.0%) |
Physical Housing Characteristics in Lemon Grove
Housing Structures in Lemon Grove
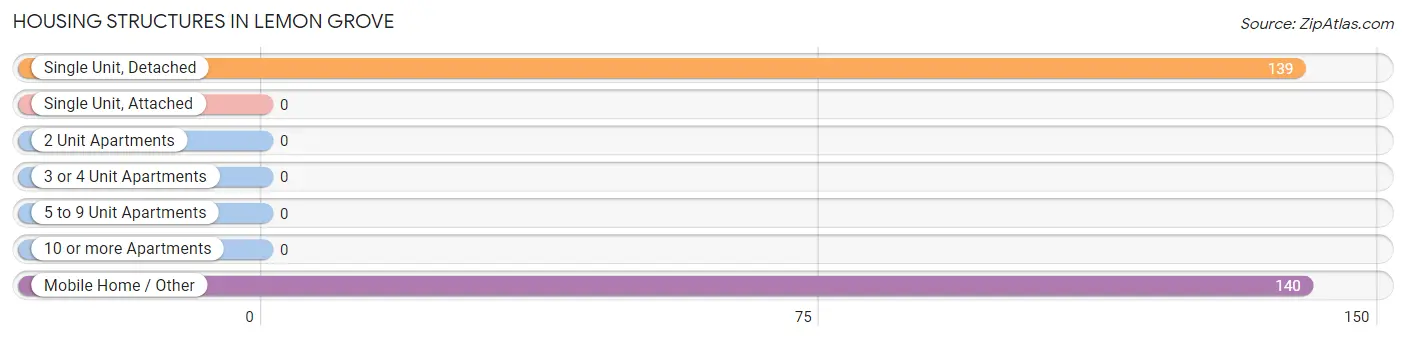
| Structure Type | # Housing Units | % Housing Units |
| Single Unit, Detached | 139 | 49.8% |
| Single Unit, Attached | 0 | 0.0% |
| 2 Unit Apartments | 0 | 0.0% |
| 3 or 4 Unit Apartments | 0 | 0.0% |
| 5 to 9 Unit Apartments | 0 | 0.0% |
| 10 or more Apartments | 0 | 0.0% |
| Mobile Home / Other | 140 | 50.2% |
| Total | 279 | 100.0% |
Housing Structures by Occupancy in Lemon Grove
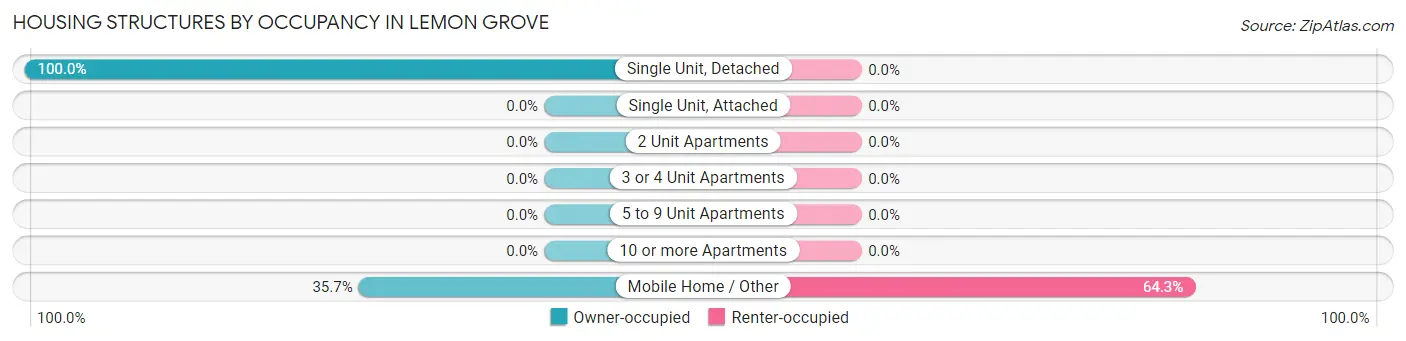
| Structure Type | Owner-occupied | Renter-occupied |
| Single Unit, Detached | 139 (100.0%) | 0 (0.0%) |
| Single Unit, Attached | 0 (0.0%) | 0 (0.0%) |
| 2 Unit Apartments | 0 (0.0%) | 0 (0.0%) |
| 3 or 4 Unit Apartments | 0 (0.0%) | 0 (0.0%) |
| 5 to 9 Unit Apartments | 0 (0.0%) | 0 (0.0%) |
| 10 or more Apartments | 0 (0.0%) | 0 (0.0%) |
| Mobile Home / Other | 50 (35.7%) | 90 (64.3%) |
| Total | 189 (67.7%) | 90 (32.3%) |
Housing Structures by Number of Rooms in Lemon Grove
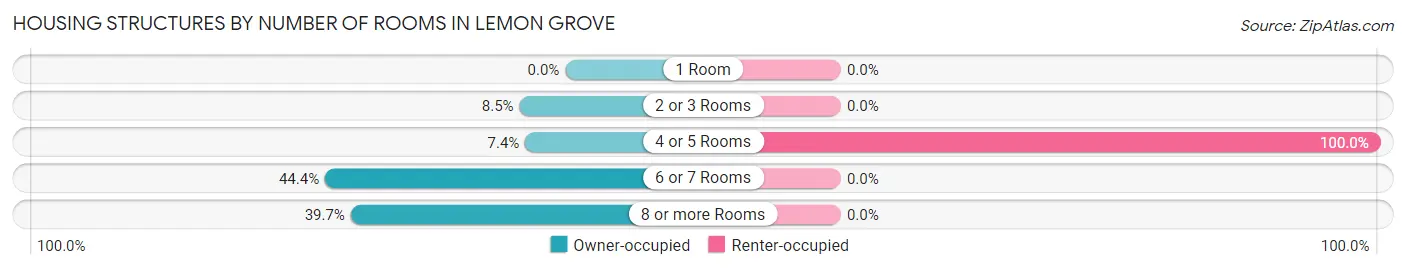
| Number of Rooms | Owner-occupied | Renter-occupied |
| 1 Room | 0 (0.0%) | 0 (0.0%) |
| 2 or 3 Rooms | 16 (8.5%) | 0 (0.0%) |
| 4 or 5 Rooms | 14 (7.4%) | 90 (100.0%) |
| 6 or 7 Rooms | 84 (44.4%) | 0 (0.0%) |
| 8 or more Rooms | 75 (39.7%) | 0 (0.0%) |
| Total | 189 (100.0%) | 90 (100.0%) |
Housing Structure by Heating Type in Lemon Grove
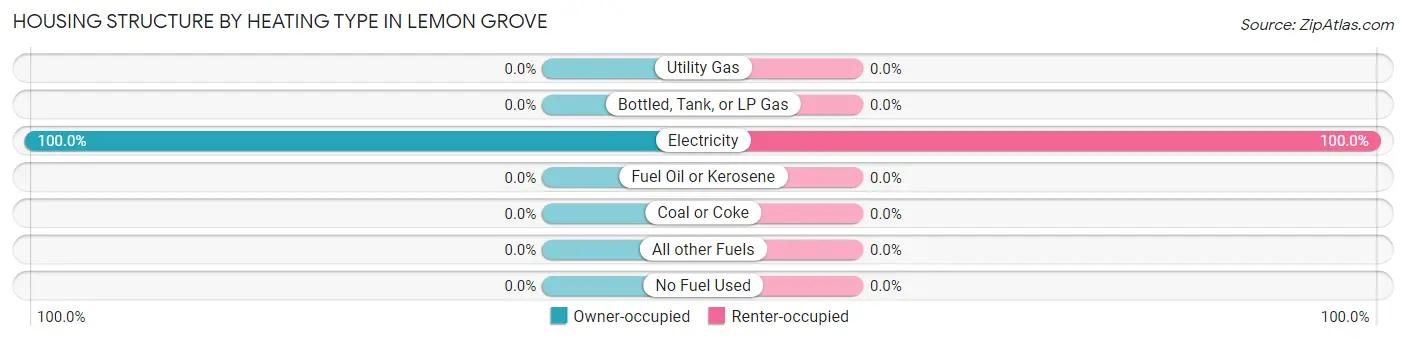
| Heating Type | Owner-occupied | Renter-occupied |
| Utility Gas | 0 (0.0%) | 0 (0.0%) |
| Bottled, Tank, or LP Gas | 0 (0.0%) | 0 (0.0%) |
| Electricity | 189 (100.0%) | 90 (100.0%) |
| Fuel Oil or Kerosene | 0 (0.0%) | 0 (0.0%) |
| Coal or Coke | 0 (0.0%) | 0 (0.0%) |
| All other Fuels | 0 (0.0%) | 0 (0.0%) |
| No Fuel Used | 0 (0.0%) | 0 (0.0%) |
| Total | 189 (100.0%) | 90 (100.0%) |
Household Vehicle Usage in Lemon Grove
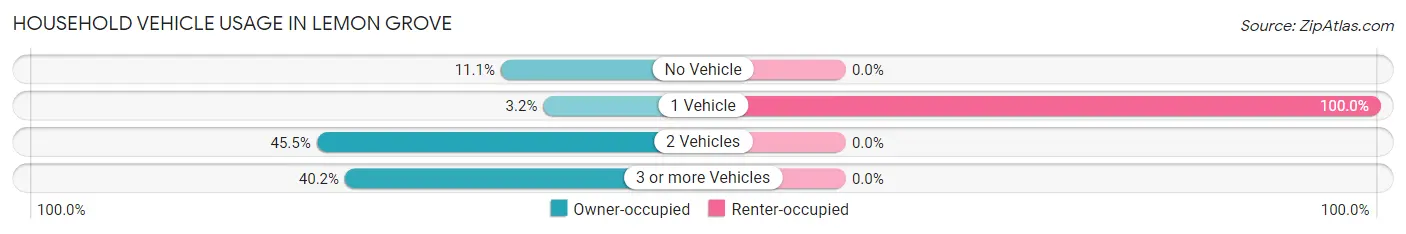
| Vehicles per Household | Owner-occupied | Renter-occupied |
| No Vehicle | 21 (11.1%) | 0 (0.0%) |
| 1 Vehicle | 6 (3.2%) | 90 (100.0%) |
| 2 Vehicles | 86 (45.5%) | 0 (0.0%) |
| 3 or more Vehicles | 76 (40.2%) | 0 (0.0%) |
| Total | 189 (100.0%) | 90 (100.0%) |
Real Estate & Mortgages in Lemon Grove
Real Estate and Mortgage Overview in Lemon Grove
| Characteristic | Without Mortgage | With Mortgage |
| Housing Units | 78 | 111 |
| Median Property Value | $542,600 | $204,200 |
| Median Household Income | $100,929 | $16 |
| Monthly Housing Costs | $616 | $0 |
| Real Estate Taxes | $2,328 | $5 |
Property Value by Mortgage Status in Lemon Grove
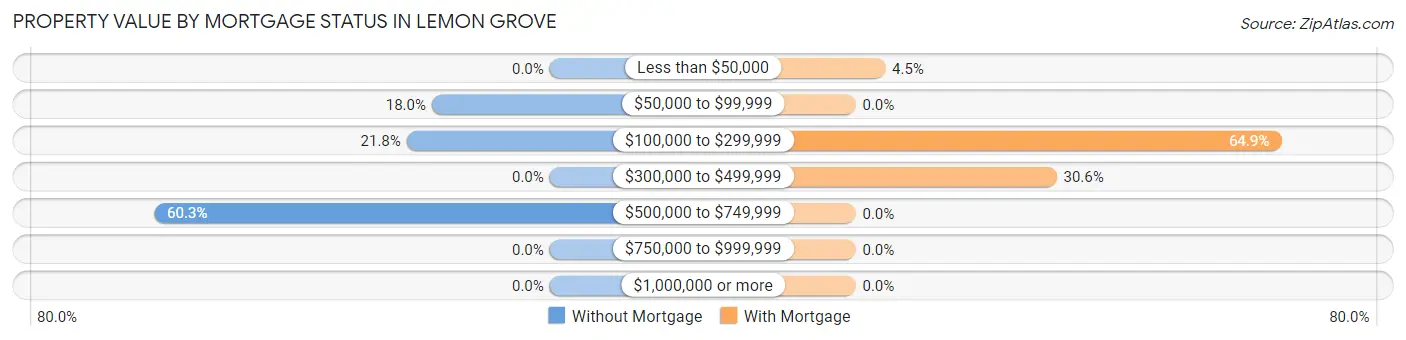
| Property Value | Without Mortgage | With Mortgage |
| Less than $50,000 | 0 (0.0%) | 5 (4.5%) |
| $50,000 to $99,999 | 14 (17.9%) | 0 (0.0%) |
| $100,000 to $299,999 | 17 (21.8%) | 72 (64.9%) |
| $300,000 to $499,999 | 0 (0.0%) | 34 (30.6%) |
| $500,000 to $749,999 | 47 (60.3%) | 0 (0.0%) |
| $750,000 to $999,999 | 0 (0.0%) | 0 (0.0%) |
| $1,000,000 or more | 0 (0.0%) | 0 (0.0%) |
| Total | 78 (100.0%) | 111 (100.0%) |
Household Income by Mortgage Status in Lemon Grove
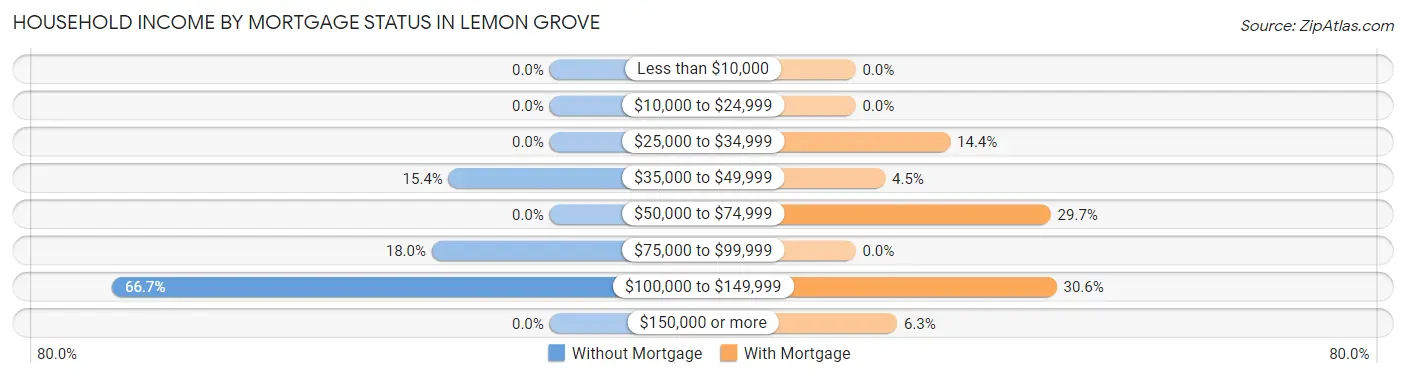
| Household Income | Without Mortgage | With Mortgage |
| Less than $10,000 | 0 (0.0%) | 0 (0.0%) |
| $10,000 to $24,999 | 0 (0.0%) | 0 (0.0%) |
| $25,000 to $34,999 | 0 (0.0%) | 16 (14.4%) |
| $35,000 to $49,999 | 12 (15.4%) | 5 (4.5%) |
| $50,000 to $74,999 | 0 (0.0%) | 33 (29.7%) |
| $75,000 to $99,999 | 14 (17.9%) | 0 (0.0%) |
| $100,000 to $149,999 | 52 (66.7%) | 34 (30.6%) |
| $150,000 or more | 0 (0.0%) | 7 (6.3%) |
| Total | 78 (100.0%) | 111 (100.0%) |
Property Value to Household Income Ratio in Lemon Grove
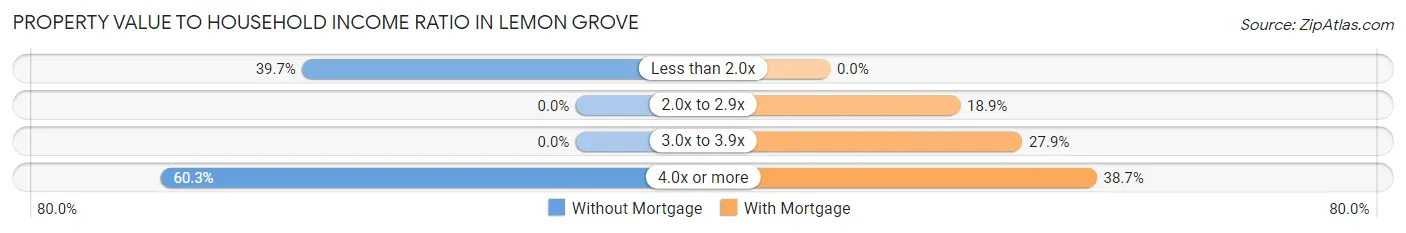
| Value-to-Income Ratio | Without Mortgage | With Mortgage |
| Less than 2.0x | 31 (39.7%) | 0 (0.0%) |
| 2.0x to 2.9x | 0 (0.0%) | 21 (18.9%) |
| 3.0x to 3.9x | 0 (0.0%) | 31 (27.9%) |
| 4.0x or more | 47 (60.3%) | 43 (38.7%) |
| Total | 78 (100.0%) | 111 (100.0%) |
Real Estate Taxes by Mortgage Status in Lemon Grove
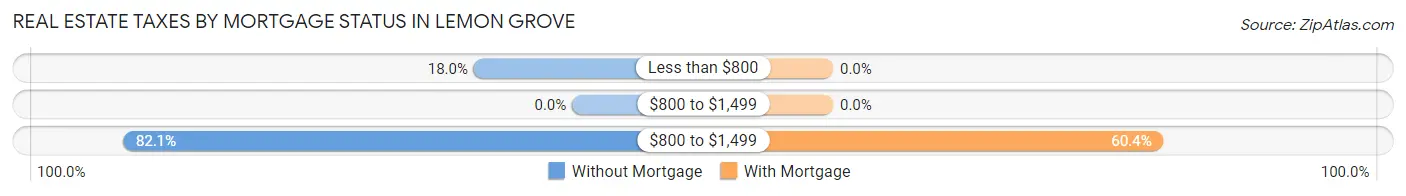
| Property Taxes | Without Mortgage | With Mortgage |
| Less than $800 | 14 (17.9%) | 0 (0.0%) |
| $800 to $1,499 | 0 (0.0%) | 0 (0.0%) |
| $800 to $1,499 | 64 (82.1%) | 67 (60.4%) |
| Total | 78 (100.0%) | 111 (100.0%) |
Health & Disability in Lemon Grove
Health Insurance Coverage by Age in Lemon Grove
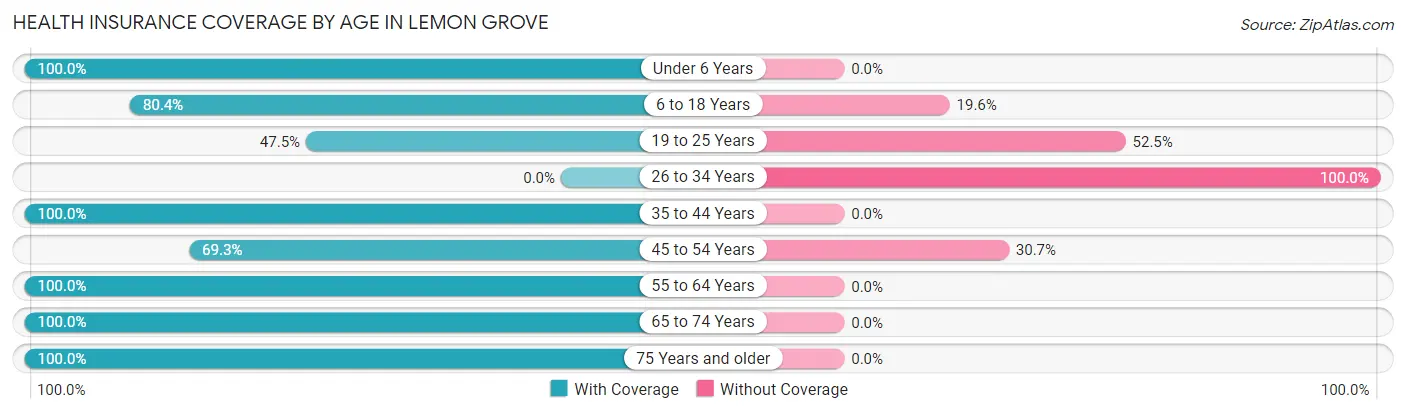
| Age Bracket | With Coverage | Without Coverage |
| Under 6 Years | 50 (100.0%) | 0 (0.0%) |
| 6 to 18 Years | 90 (80.4%) | 22 (19.6%) |
| 19 to 25 Years | 29 (47.5%) | 32 (52.5%) |
| 26 to 34 Years | 0 (0.0%) | 15 (100.0%) |
| 35 to 44 Years | 137 (100.0%) | 0 (0.0%) |
| 45 to 54 Years | 70 (69.3%) | 31 (30.7%) |
| 55 to 64 Years | 19 (100.0%) | 0 (0.0%) |
| 65 to 74 Years | 87 (100.0%) | 0 (0.0%) |
| 75 Years and older | 28 (100.0%) | 0 (0.0%) |
| Total | 510 (83.6%) | 100 (16.4%) |
Health Insurance Coverage by Citizenship Status in Lemon Grove
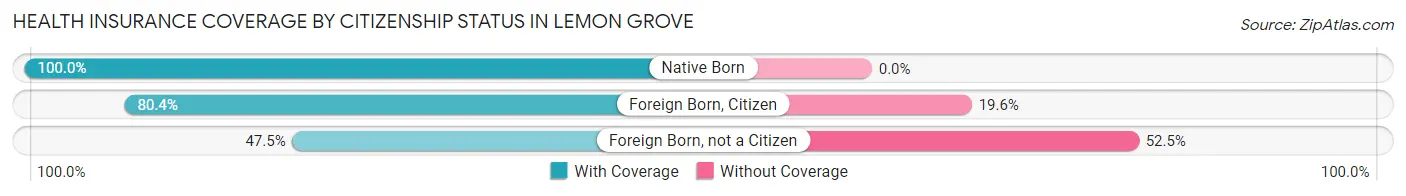
| Citizenship Status | With Coverage | Without Coverage |
| Native Born | 50 (100.0%) | 0 (0.0%) |
| Foreign Born, Citizen | 90 (80.4%) | 22 (19.6%) |
| Foreign Born, not a Citizen | 29 (47.5%) | 32 (52.5%) |
Health Insurance Coverage by Household Income in Lemon Grove
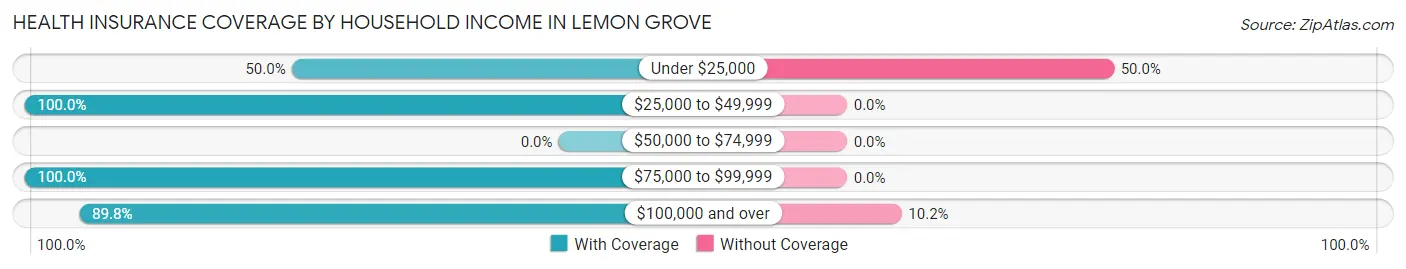
| Household Income | With Coverage | Without Coverage |
| Under $25,000 | 78 (50.0%) | 78 (50.0%) |
| $25,000 to $49,999 | 83 (100.0%) | 0 (0.0%) |
| $50,000 to $74,999 | 0 (0.0%) | 0 (0.0%) |
| $75,000 to $99,999 | 156 (100.0%) | 0 (0.0%) |
| $100,000 and over | 193 (89.8%) | 22 (10.2%) |
Public vs Private Health Insurance Coverage by Age in Lemon Grove
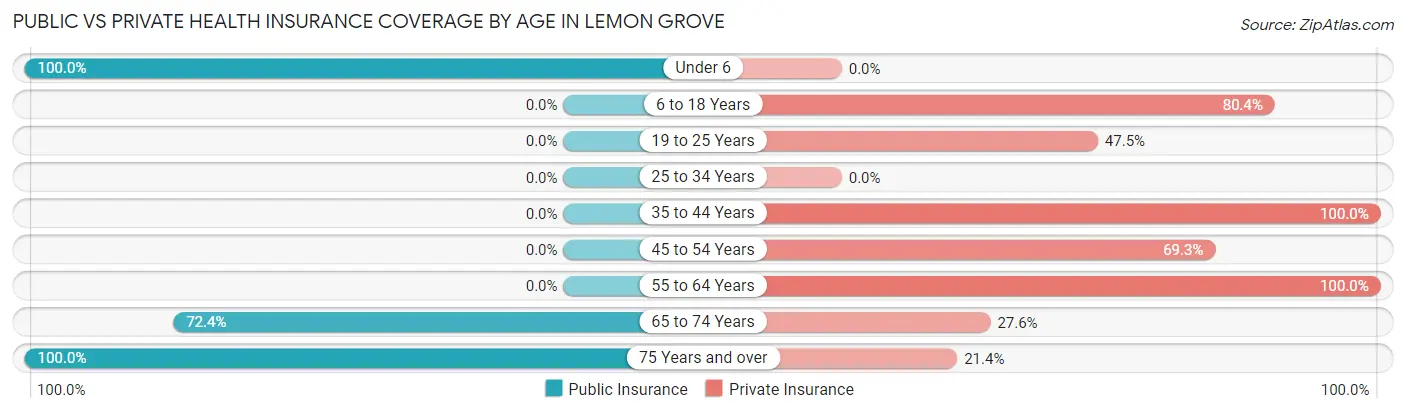
| Age Bracket | Public Insurance | Private Insurance |
| Under 6 | 50 (100.0%) | 0 (0.0%) |
| 6 to 18 Years | 0 (0.0%) | 90 (80.4%) |
| 19 to 25 Years | 0 (0.0%) | 29 (47.5%) |
| 25 to 34 Years | 0 (0.0%) | 0 (0.0%) |
| 35 to 44 Years | 0 (0.0%) | 137 (100.0%) |
| 45 to 54 Years | 0 (0.0%) | 70 (69.3%) |
| 55 to 64 Years | 0 (0.0%) | 19 (100.0%) |
| 65 to 74 Years | 63 (72.4%) | 24 (27.6%) |
| 75 Years and over | 28 (100.0%) | 6 (21.4%) |
| Total | 141 (23.1%) | 375 (61.5%) |
Disability Status by Sex by Age in Lemon Grove
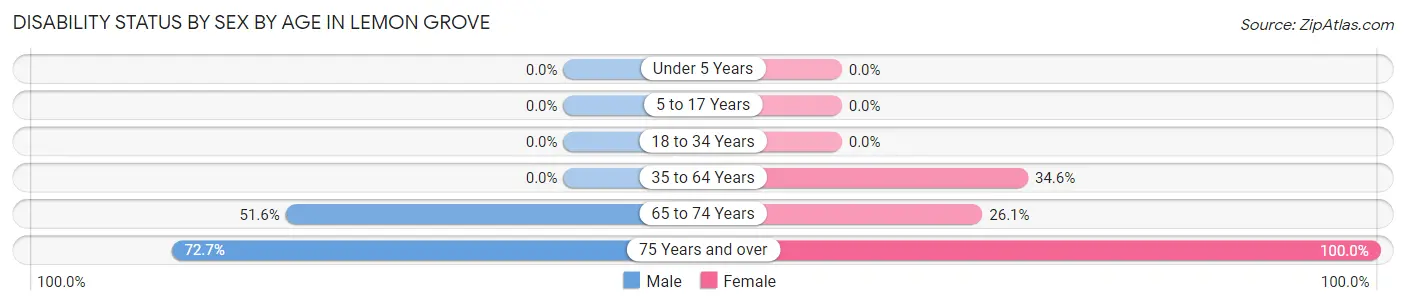
| Age Bracket | Male | Female |
| Under 5 Years | 0 (0.0%) | 0 (0.0%) |
| 5 to 17 Years | 0 (0.0%) | 0 (0.0%) |
| 18 to 34 Years | 0 (0.0%) | 0 (0.0%) |
| 35 to 64 Years | 0 (0.0%) | 56 (34.6%) |
| 65 to 74 Years | 33 (51.6%) | 6 (26.1%) |
| 75 Years and over | 16 (72.7%) | 6 (100.0%) |
Disability Class by Sex by Age in Lemon Grove
Disability Class: Hearing Difficulty
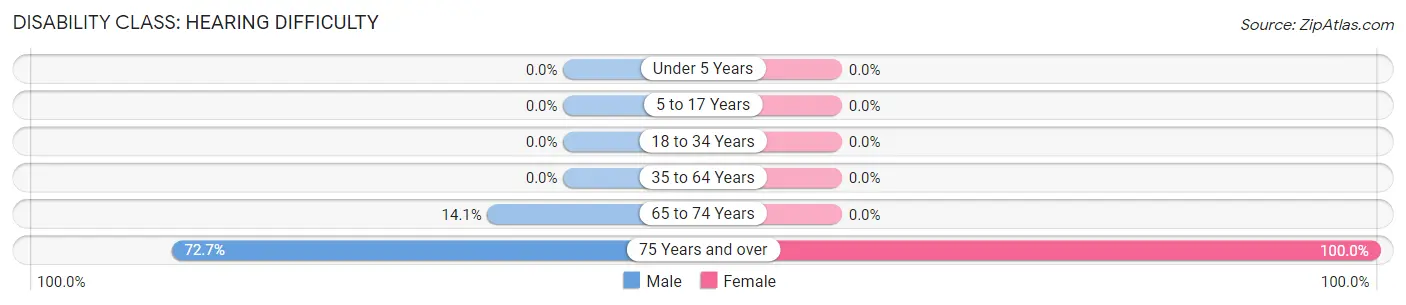
| Age Bracket | Male | Female |
| Under 5 Years | 0 (0.0%) | 0 (0.0%) |
| 5 to 17 Years | 0 (0.0%) | 0 (0.0%) |
| 18 to 34 Years | 0 (0.0%) | 0 (0.0%) |
| 35 to 64 Years | 0 (0.0%) | 0 (0.0%) |
| 65 to 74 Years | 9 (14.1%) | 0 (0.0%) |
| 75 Years and over | 16 (72.7%) | 6 (100.0%) |
Disability Class: Vision Difficulty
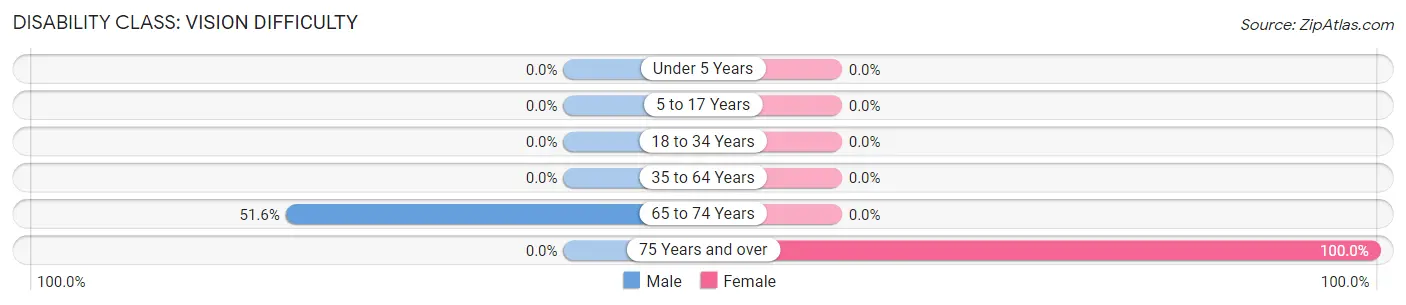
| Age Bracket | Male | Female |
| Under 5 Years | 0 (0.0%) | 0 (0.0%) |
| 5 to 17 Years | 0 (0.0%) | 0 (0.0%) |
| 18 to 34 Years | 0 (0.0%) | 0 (0.0%) |
| 35 to 64 Years | 0 (0.0%) | 0 (0.0%) |
| 65 to 74 Years | 33 (51.6%) | 0 (0.0%) |
| 75 Years and over | 0 (0.0%) | 6 (100.0%) |
Disability Class: Cognitive Difficulty
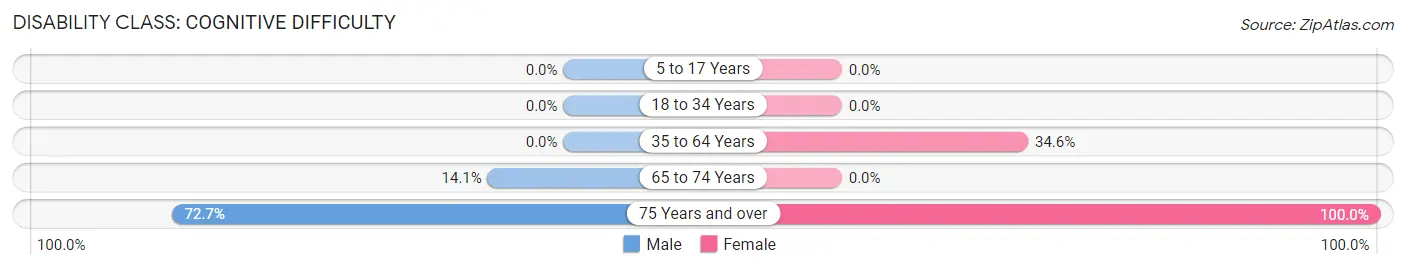
| Age Bracket | Male | Female |
| 5 to 17 Years | 0 (0.0%) | 0 (0.0%) |
| 18 to 34 Years | 0 (0.0%) | 0 (0.0%) |
| 35 to 64 Years | 0 (0.0%) | 56 (34.6%) |
| 65 to 74 Years | 9 (14.1%) | 0 (0.0%) |
| 75 Years and over | 16 (72.7%) | 6 (100.0%) |
Disability Class: Ambulatory Difficulty
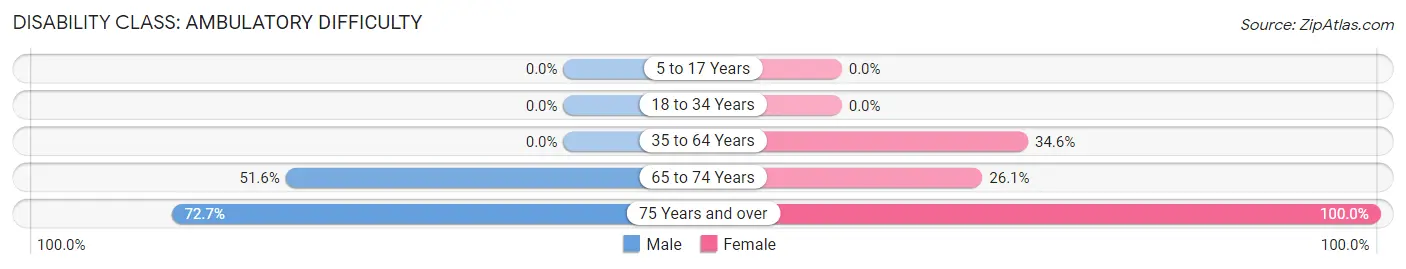
| Age Bracket | Male | Female |
| 5 to 17 Years | 0 (0.0%) | 0 (0.0%) |
| 18 to 34 Years | 0 (0.0%) | 0 (0.0%) |
| 35 to 64 Years | 0 (0.0%) | 56 (34.6%) |
| 65 to 74 Years | 33 (51.6%) | 6 (26.1%) |
| 75 Years and over | 16 (72.7%) | 6 (100.0%) |
Disability Class: Self-Care Difficulty
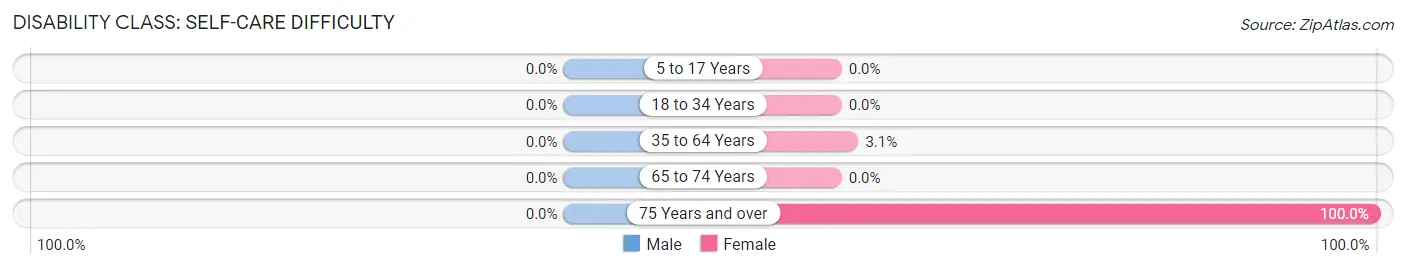
| Age Bracket | Male | Female |
| 5 to 17 Years | 0 (0.0%) | 0 (0.0%) |
| 18 to 34 Years | 0 (0.0%) | 0 (0.0%) |
| 35 to 64 Years | 0 (0.0%) | 5 (3.1%) |
| 65 to 74 Years | 0 (0.0%) | 0 (0.0%) |
| 75 Years and over | 0 (0.0%) | 6 (100.0%) |
Technology Access in Lemon Grove
Computing Device Access in Lemon Grove
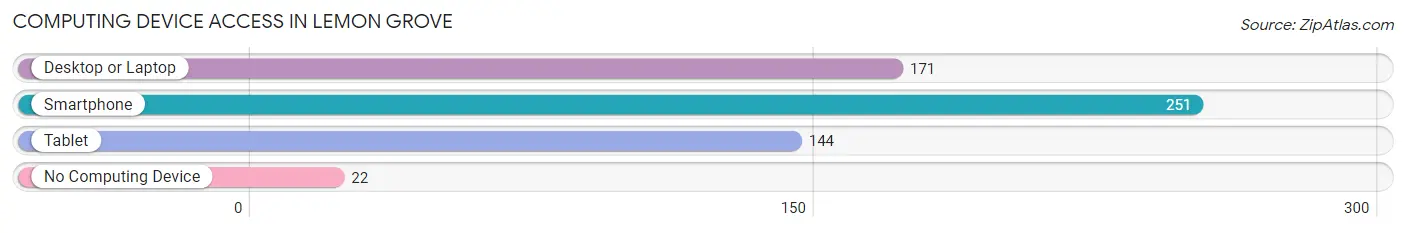
| Device Type | # Households | % Households |
| Desktop or Laptop | 171 | 61.3% |
| Smartphone | 251 | 90.0% |
| Tablet | 144 | 51.6% |
| No Computing Device | 22 | 7.9% |
| Total | 279 | 100.0% |
Internet Access in Lemon Grove
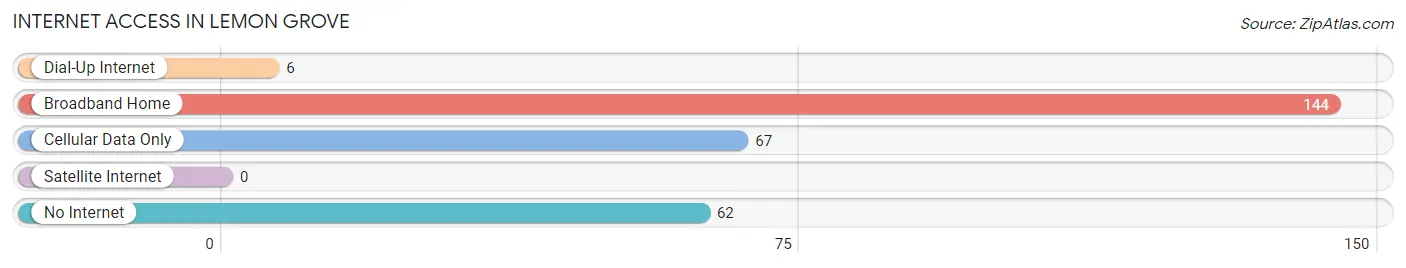
| Internet Type | # Households | % Households |
| Dial-Up Internet | 6 | 2.1% |
| Broadband Home | 144 | 51.6% |
| Cellular Data Only | 67 | 24.0% |
| Satellite Internet | 0 | 0.0% |
| No Internet | 62 | 22.2% |
| Total | 279 | 100.0% |
Lemon Grove Summary
Lemon Grove is a small city located in San Diego County, California. It is situated in the southeastern part of the county, just east of the city of San Diego. The city has a population of approximately 25,000 people and covers an area of 4.2 square miles.
History
Lemon Grove was founded in 1894 by a group of settlers from the Midwest. The settlers were attracted to the area by the abundance of lemon groves, which gave the city its name. The first post office was established in 1895 and the city was officially incorporated in 1925.
In the early years, Lemon Grove was primarily an agricultural community, with the main crops being lemons, oranges, and walnuts. The city also had a thriving dairy industry, with several dairy farms located in the area.
In the 1950s, the city began to experience rapid growth as the population increased and new businesses were established. This growth was fueled by the construction of Interstate 8, which provided easy access to the city from San Diego and other nearby cities.
Geography
Lemon Grove is located in the southeastern part of San Diego County, just east of the city of San Diego. The city is situated in a valley surrounded by hills and mountains. The climate is mild and sunny, with temperatures rarely dropping below freezing.
The city is divided into several neighborhoods, including Lemon Grove Heights, Lemon Grove Park, and Lemon Grove Village. The city is also home to several parks, including Lemon Grove Park, which features a playground, picnic areas, and a lake.
Economy
Lemon Grove’s economy is primarily based on retail and services. The city is home to several shopping centers, including the Lemon Grove Shopping Center and the Lemon Grove Plaza. The city also has a number of restaurants, bars, and other businesses.
The city is also home to several manufacturing companies, including a furniture manufacturer and a plastics manufacturer. The city is also home to a number of government offices, including the San Diego County Sheriff’s Department and the San Diego County Health Department.
Demographics
As of the 2010 census, Lemon Grove had a population of 25,320 people. The racial makeup of the city was 63.3% White, 4.2% African American, 0.7% Native American, 11.2% Asian, 0.3% Pacific Islander, and 17.3% from other races. Hispanic or Latino of any race were 33.2% of the population.
The median household income in Lemon Grove was $50,945, and the median family income was $58,945. The per capita income for the city was $22,945. About 11.2% of families and 14.2% of the population were below the poverty line, including 19.2% of those under age 18 and 8.2% of those age 65 or over.
Lemon Grove is a diverse city with a rich history and a vibrant economy. The city is home to a variety of businesses, parks, and other attractions, making it an ideal place to live and work.
Common Questions
What is Per Capita Income in Lemon Grove?
Per Capita income in Lemon Grove is $27,566.
What is the Median Family Income in Lemon Grove?
Median Family Income in Lemon Grove is $97,794.
What is Income or Wage Gap in Lemon Grove?
Income or Wage Gap in Lemon Grove is 31.5%.
Women in Lemon Grove earn 68.5 cents for every dollar earned by a man.
What is Inequality or Gini Index in Lemon Grove?
Inequality or Gini Index in Lemon Grove is 0.47.
What is the Total Population of Lemon Grove?
Total Population of Lemon Grove is 610.
What is the Total Male Population of Lemon Grove?
Total Male Population of Lemon Grove is 265.
What is the Total Female Population of Lemon Grove?
Total Female Population of Lemon Grove is 345.
What is the Ratio of Males per 100 Females in Lemon Grove?
There are 76.81 Males per 100 Females in Lemon Grove.
What is the Ratio of Females per 100 Males in Lemon Grove?
There are 130.19 Females per 100 Males in Lemon Grove.
What is the Median Population Age in Lemon Grove?
Median Population Age in Lemon Grove is 39.5 Years.
What is the Average Family Size in Lemon Grove
Average Family Size in Lemon Grove is 2.9 People.
What is the Average Household Size in Lemon Grove
Average Household Size in Lemon Grove is 2.2 People.
How Large is the Labor Force in Lemon Grove?
There are 322 People in the Labor Forcein in Lemon Grove.
What is the Percentage of People in the Labor Force in Lemon Grove?
63.4% of People are in the Labor Force in Lemon Grove.
What is the Unemployment Rate in Lemon Grove?
Unemployment Rate in Lemon Grove is 4.7%.