Cities with the Highest Percentage of Immigrants from Hungary in Florida
RELATED REPORTS & OPTIONS
Hungary
Florida
Compare Cities
Map of Cities with the Highest Percentage of Immigrants from Hungary in Florida
0.00%
2.50%
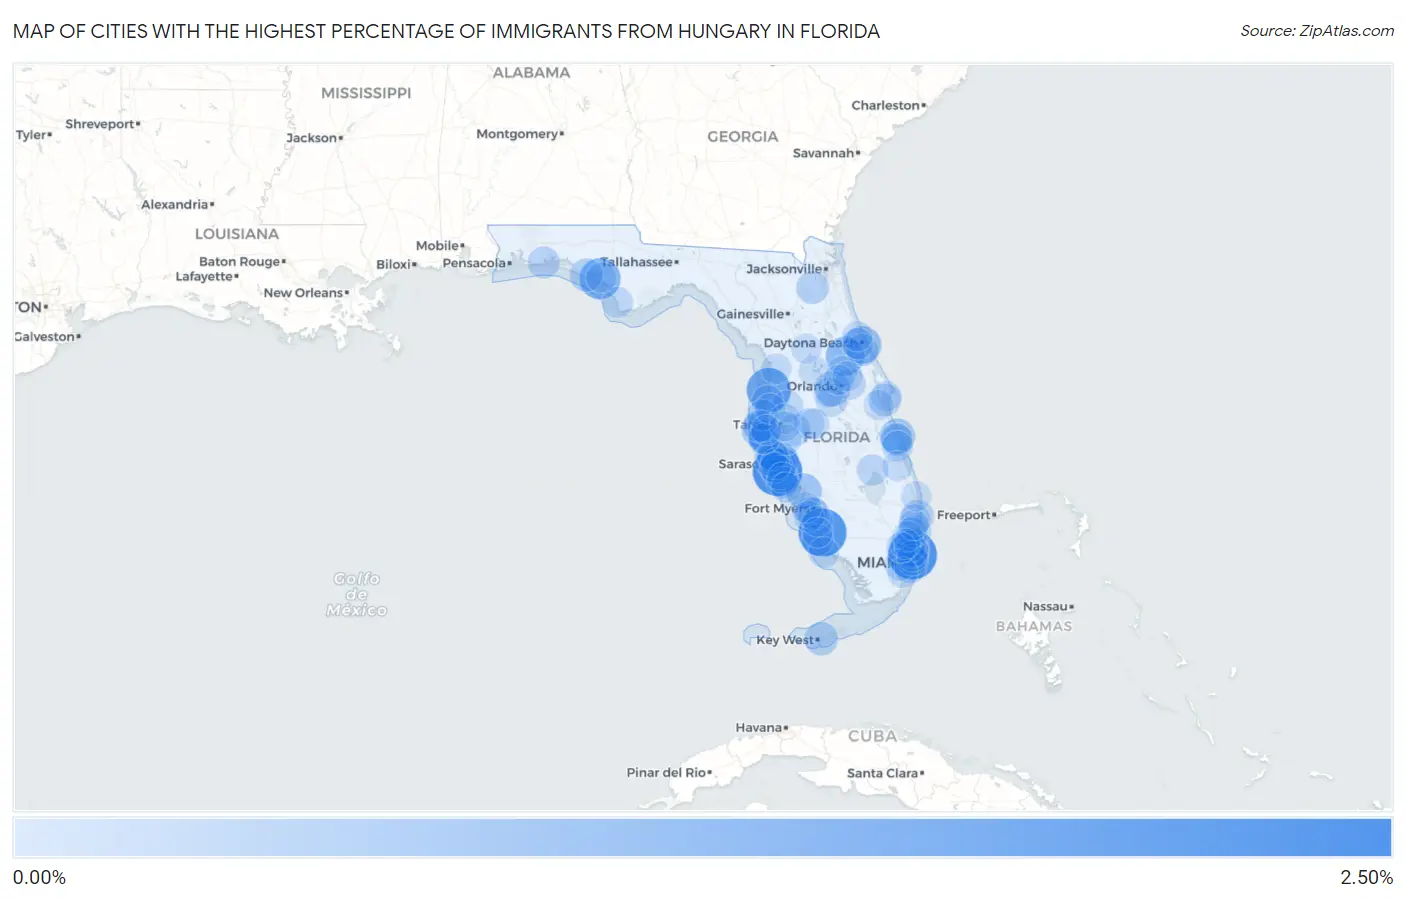
Cities with the Highest Percentage of Immigrants from Hungary in Florida
| City | Hungary | vs State | vs National | |
| 1. | Vamo | 2.15% | 0.042% (+2.10)#1 | 0.020% (+2.13)#15 |
| 2. | Bal Harbour | 2.08% | 0.042% (+2.03)#2 | 0.020% (+2.06)#16 |
| 3. | Island Walk | 1.98% | 0.042% (+1.94)#3 | 0.020% (+1.96)#19 |
| 4. | Hernando Beach | 1.56% | 0.042% (+1.52)#4 | 0.020% (+1.54)#28 |
| 5. | Cedar Grove | 1.23% | 0.042% (+1.18)#5 | 0.020% (+1.21)#39 |
| 6. | Deland Southwest | 0.97% | 0.042% (+0.931)#6 | 0.020% (+0.954)#52 |
| 7. | South Daytona | 0.86% | 0.042% (+0.818)#7 | 0.020% (+0.841)#64 |
| 8. | The Meadows | 0.83% | 0.042% (+0.792)#8 | 0.020% (+0.815)#66 |
| 9. | Ridge Wood Heights | 0.83% | 0.042% (+0.789)#9 | 0.020% (+0.812)#67 |
| 10. | Charlotte Park | 0.67% | 0.042% (+0.626)#10 | 0.020% (+0.649)#85 |
| 11. | Windermere | 0.62% | 0.042% (+0.582)#11 | 0.020% (+0.605)#97 |
| 12. | Wabasso Beach | 0.62% | 0.042% (+0.577)#12 | 0.020% (+0.599)#98 |
| 13. | Indian Shores | 0.51% | 0.042% (+0.465)#13 | 0.020% (+0.488)#127 |
| 14. | Gulfport | 0.49% | 0.042% (+0.450)#14 | 0.020% (+0.472)#132 |
| 15. | Dania Beach | 0.48% | 0.042% (+0.437)#15 | 0.020% (+0.460)#139 |
| 16. | Osprey | 0.44% | 0.042% (+0.394)#16 | 0.020% (+0.416)#163 |
| 17. | Ojus | 0.42% | 0.042% (+0.377)#17 | 0.020% (+0.400)#167 |
| 18. | Stock Island | 0.42% | 0.042% (+0.374)#18 | 0.020% (+0.397)#169 |
| 19. | Panama City Beach | 0.40% | 0.042% (+0.357)#19 | 0.020% (+0.380)#182 |
| 20. | Hallandale Beach | 0.39% | 0.042% (+0.347)#20 | 0.020% (+0.370)#186 |
| 21. | Fish Hawk | 0.36% | 0.042% (+0.319)#21 | 0.020% (+0.342)#203 |
| 22. | Palmer Ranch | 0.36% | 0.042% (+0.318)#22 | 0.020% (+0.340)#207 |
| 23. | Briny Breezes | 0.35% | 0.042% (+0.309)#23 | 0.020% (+0.331)#213 |
| 24. | Middleburg | 0.35% | 0.042% (+0.304)#24 | 0.020% (+0.327)#216 |
| 25. | Bear Creek | 0.34% | 0.042% (+0.297)#25 | 0.020% (+0.319)#220 |
| 26. | South Pasadena | 0.34% | 0.042% (+0.295)#26 | 0.020% (+0.318)#221 |
| 27. | Cocoa Beach | 0.34% | 0.042% (+0.293)#27 | 0.020% (+0.316)#223 |
| 28. | Belleair Beach | 0.33% | 0.042% (+0.289)#28 | 0.020% (+0.311)#227 |
| 29. | Lighthouse Point | 0.32% | 0.042% (+0.282)#29 | 0.020% (+0.304)#234 |
| 30. | Pine Ridge Cdp Collier County | 0.30% | 0.042% (+0.263)#30 | 0.020% (+0.285)#252 |
| 31. | Port Orange | 0.30% | 0.042% (+0.255)#31 | 0.020% (+0.278)#259 |
| 32. | Mcgregor | 0.29% | 0.042% (+0.245)#32 | 0.020% (+0.268)#269 |
| 33. | Belleair Bluffs | 0.28% | 0.042% (+0.241)#33 | 0.020% (+0.263)#273 |
| 34. | Villas | 0.28% | 0.042% (+0.233)#34 | 0.020% (+0.256)#287 |
| 35. | Cinco Bayou | 0.27% | 0.042% (+0.228)#35 | 0.020% (+0.250)#294 |
| 36. | Wesley Chapel | 0.27% | 0.042% (+0.224)#36 | 0.020% (+0.246)#297 |
| 37. | Jasmine Estates | 0.26% | 0.042% (+0.216)#37 | 0.020% (+0.238)#304 |
| 38. | Indian River Shores | 0.26% | 0.042% (+0.216)#38 | 0.020% (+0.238)#305 |
| 39. | Bayshore Gardens | 0.26% | 0.042% (+0.214)#39 | 0.020% (+0.236)#309 |
| 40. | Aventura | 0.24% | 0.042% (+0.200)#40 | 0.020% (+0.223)#331 |
| 41. | Longboat Key | 0.24% | 0.042% (+0.199)#41 | 0.020% (+0.221)#334 |
| 42. | On Top Of The World | 0.24% | 0.042% (+0.195)#42 | 0.020% (+0.218)#338 |
| 43. | Winter Beach | 0.23% | 0.042% (+0.192)#43 | 0.020% (+0.214)#345 |
| 44. | South Venice | 0.23% | 0.042% (+0.187)#44 | 0.020% (+0.209)#353 |
| 45. | Key Biscayne | 0.23% | 0.042% (+0.184)#45 | 0.020% (+0.207)#358 |
| 46. | Naples | 0.22% | 0.042% (+0.180)#46 | 0.020% (+0.203)#363 |
| 47. | Daytona Beach | 0.22% | 0.042% (+0.173)#47 | 0.020% (+0.196)#376 |
| 48. | Gulf Gate | 0.21% | 0.042% (+0.172)#48 | 0.020% (+0.194)#380 |
| 49. | Delray Beach | 0.21% | 0.042% (+0.171)#49 | 0.020% (+0.193)#384 |
| 50. | Union Park | 0.21% | 0.042% (+0.170)#50 | 0.020% (+0.193)#387 |
| 51. | Okeechobee | 0.21% | 0.042% (+0.165)#51 | 0.020% (+0.187)#400 |
| 52. | Lakewood Ranch | 0.20% | 0.042% (+0.156)#52 | 0.020% (+0.178)#414 |
| 53. | Celebration | 0.19% | 0.042% (+0.149)#53 | 0.020% (+0.172)#427 |
| 54. | Lakeland Highlands | 0.19% | 0.042% (+0.144)#54 | 0.020% (+0.167)#434 |
| 55. | Hollywood | 0.18% | 0.042% (+0.139)#55 | 0.020% (+0.162)#450 |
| 56. | South Bradenton | 0.18% | 0.042% (+0.135)#56 | 0.020% (+0.157)#460 |
| 57. | Westchester | 0.17% | 0.042% (+0.129)#57 | 0.020% (+0.152)#469 |
| 58. | Port St Joe | 0.17% | 0.042% (+0.128)#58 | 0.020% (+0.150)#473 |
| 59. | Largo | 0.17% | 0.042% (+0.126)#59 | 0.020% (+0.149)#475 |
| 60. | Palm Harbor | 0.17% | 0.042% (+0.123)#60 | 0.020% (+0.146)#485 |
| 61. | Highland City | 0.16% | 0.042% (+0.118)#61 | 0.020% (+0.141)#496 |
| 62. | Liberty Triangle | 0.16% | 0.042% (+0.118)#62 | 0.020% (+0.140)#497 |
| 63. | St Pete Beach | 0.16% | 0.042% (+0.115)#63 | 0.020% (+0.138)#503 |
| 64. | Sarasota | 0.15% | 0.042% (+0.113)#64 | 0.020% (+0.135)#508 |
| 65. | Iona | 0.15% | 0.042% (+0.112)#65 | 0.020% (+0.134)#511 |
| 66. | Vero Beach South | 0.15% | 0.042% (+0.111)#66 | 0.020% (+0.134)#512 |
| 67. | Pompano Beach | 0.15% | 0.042% (+0.107)#67 | 0.020% (+0.130)#516 |
| 68. | Heathrow | 0.14% | 0.042% (+0.099)#68 | 0.020% (+0.122)#543 |
| 69. | Miami Beach | 0.14% | 0.042% (+0.097)#69 | 0.020% (+0.120)#548 |
| 70. | Homosassa Springs | 0.14% | 0.042% (+0.095)#70 | 0.020% (+0.117)#558 |
| 71. | Marco Island | 0.13% | 0.042% (+0.083)#71 | 0.020% (+0.106)#586 |
| 72. | Surfside | 0.12% | 0.042% (+0.082)#72 | 0.020% (+0.105)#591 |
| 73. | Trinity | 0.12% | 0.042% (+0.081)#73 | 0.020% (+0.104)#596 |
| 74. | Cape Canaveral | 0.12% | 0.042% (+0.078)#74 | 0.020% (+0.101)#601 |
| 75. | Temple Terrace | 0.12% | 0.042% (+0.073)#75 | 0.020% (+0.096)#613 |
| 76. | Tamarac | 0.11% | 0.042% (+0.071)#76 | 0.020% (+0.094)#622 |
| 77. | Siesta Key | 0.11% | 0.042% (+0.066)#77 | 0.020% (+0.089)#642 |
| 78. | Panama City | 0.11% | 0.042% (+0.066)#78 | 0.020% (+0.088)#645 |
| 79. | Palmetto Bay | 0.11% | 0.042% (+0.065)#79 | 0.020% (+0.088)#647 |
| 80. | Leesburg | 0.11% | 0.042% (+0.064)#80 | 0.020% (+0.087)#651 |
| 81. | Davie | 0.10% | 0.042% (+0.062)#81 | 0.020% (+0.084)#663 |
| 82. | Estero | 0.10% | 0.042% (+0.061)#82 | 0.020% (+0.084)#665 |
| 83. | Cape Coral | 0.10% | 0.042% (+0.061)#83 | 0.020% (+0.084)#666 |
| 84. | Sun City Center | 0.10% | 0.042% (+0.060)#84 | 0.020% (+0.083)#669 |
| 85. | Ormond Beach | 0.10% | 0.042% (+0.060)#85 | 0.020% (+0.082)#671 |
| 86. | Palm River Clair Mel | 0.10% | 0.042% (+0.059)#86 | 0.020% (+0.081)#674 |
| 87. | Horizon West | 0.10% | 0.042% (+0.059)#87 | 0.020% (+0.081)#675 |
| 88. | Viera West | 0.10% | 0.042% (+0.058)#88 | 0.020% (+0.081)#679 |
| 89. | Lockhart | 0.100% | 0.042% (+0.058)#89 | 0.020% (+0.080)#680 |
| 90. | Naples Park | 0.096% | 0.042% (+0.054)#90 | 0.020% (+0.077)#687 |
| 91. | Port St Lucie | 0.095% | 0.042% (+0.053)#91 | 0.020% (+0.076)#692 |
| 92. | Silver Springs Shores | 0.094% | 0.042% (+0.052)#92 | 0.020% (+0.075)#698 |
| 93. | Pinellas Park | 0.094% | 0.042% (+0.052)#93 | 0.020% (+0.074)#701 |
| 94. | Winter Springs | 0.092% | 0.042% (+0.049)#94 | 0.020% (+0.072)#711 |
| 95. | Venice | 0.089% | 0.042% (+0.047)#95 | 0.020% (+0.070)#721 |
| 96. | University Cdp Orange County | 0.088% | 0.042% (+0.046)#96 | 0.020% (+0.068)#726 |
| 97. | Boca Raton | 0.086% | 0.042% (+0.044)#97 | 0.020% (+0.066)#734 |
| 98. | Pembroke Pines | 0.086% | 0.042% (+0.043)#98 | 0.020% (+0.066)#736 |
| 99. | North Palm Beach | 0.084% | 0.042% (+0.042)#99 | 0.020% (+0.064)#742 |
| 100. | Englewood | 0.083% | 0.042% (+0.040)#100 | 0.020% (+0.063)#747 |
Common Questions
What are the Top 10 Cities with the Highest Percentage of Immigrants from Hungary in Florida?
Top 10 Cities with the Highest Percentage of Immigrants from Hungary in Florida are:
#1
2.15%
#2
2.08%
#3
1.98%
#4
1.56%
#5
1.23%
#6
0.97%
#7
0.86%
#8
0.83%
#9
0.83%
#10
0.67%
What city has the Highest Percentage of Immigrants from Hungary in Florida?
Vamo has the Highest Percentage of Immigrants from Hungary in Florida with 2.15%.
What is the Percentage of Immigrants from Hungary in the State of Florida?
Percentage of Immigrants from Hungary in Florida is 0.042%.
What is the Percentage of Immigrants from Hungary in the United States?
Percentage of Immigrants from Hungary in the United States is 0.020%.