Cities with the Highest Percentage of Immigrants from Sweden in Florida
RELATED REPORTS & OPTIONS
Sweden
Florida
Compare Cities
Map of Cities with the Highest Percentage of Immigrants from Sweden in Florida
0.00%
1.00%
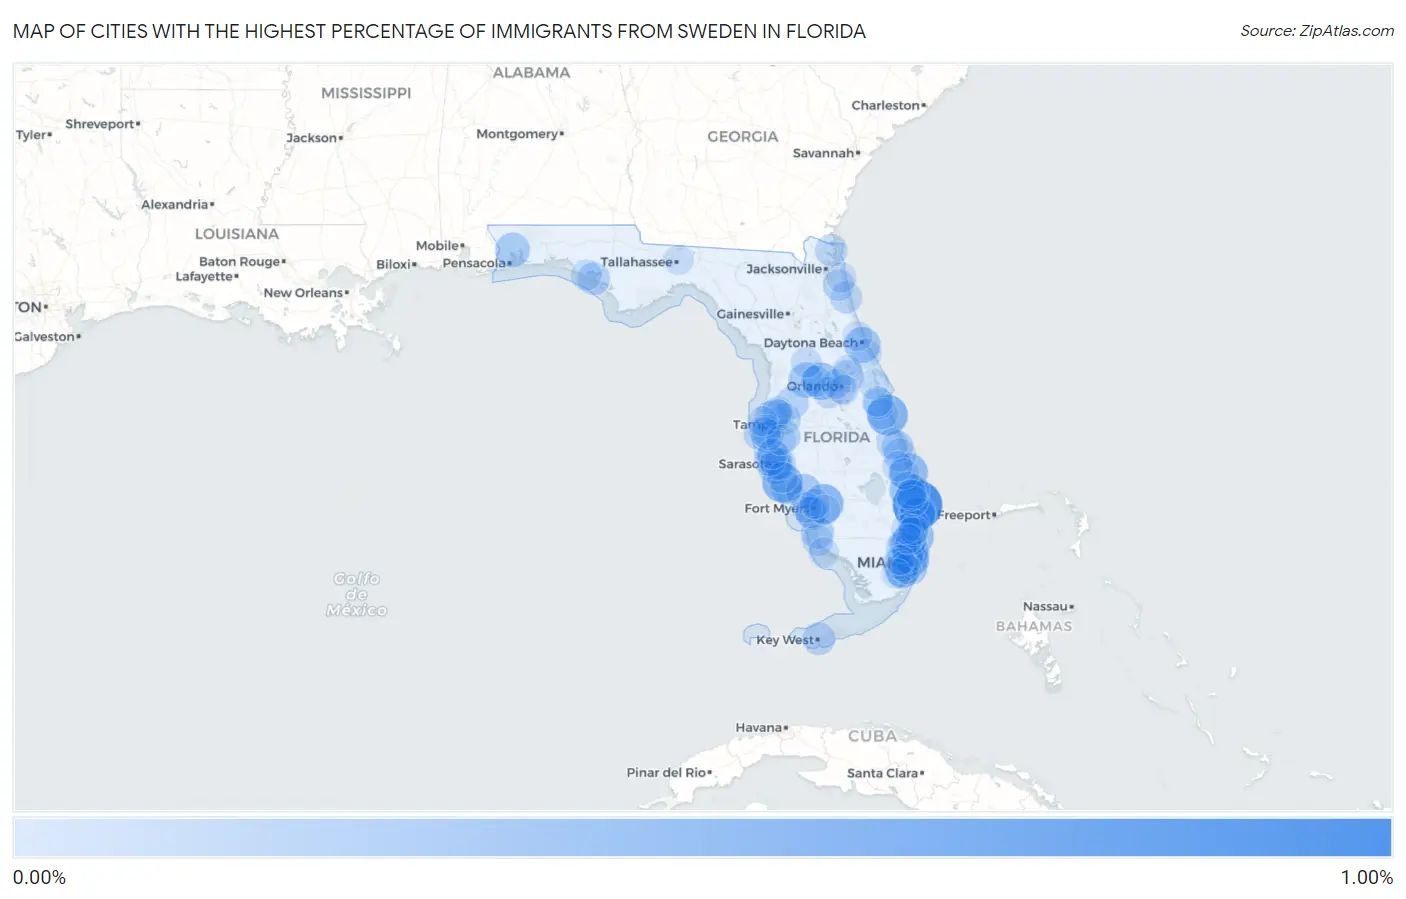
Cities with the Highest Percentage of Immigrants from Sweden in Florida
| City | Sweden | vs State | vs National | |
| 1. | Palm Beach | 0.98% | 0.022% (+0.956)#1 | 0.014% (+0.964)#55 |
| 2. | Indialantic | 0.53% | 0.022% (+0.509)#2 | 0.014% (+0.516)#108 |
| 3. | South Venice | 0.50% | 0.022% (+0.482)#3 | 0.014% (+0.490)#114 |
| 4. | Olga | 0.47% | 0.022% (+0.450)#4 | 0.014% (+0.458)#120 |
| 5. | Pine Ridge Cdp Collier County | 0.43% | 0.022% (+0.405)#5 | 0.014% (+0.413)#130 |
| 6. | Sewall S Point | 0.42% | 0.022% (+0.395)#6 | 0.014% (+0.402)#139 |
| 7. | Lauderdale By The Sea | 0.39% | 0.022% (+0.365)#7 | 0.014% (+0.373)#155 |
| 8. | Minneola | 0.37% | 0.022% (+0.346)#8 | 0.014% (+0.354)#162 |
| 9. | Ojus | 0.33% | 0.022% (+0.313)#9 | 0.014% (+0.320)#174 |
| 10. | Hypoluxo | 0.33% | 0.022% (+0.309)#10 | 0.014% (+0.316)#176 |
| 11. | Jupiter Farms | 0.31% | 0.022% (+0.293)#11 | 0.014% (+0.300)#183 |
| 12. | South Daytona | 0.30% | 0.022% (+0.283)#12 | 0.014% (+0.290)#188 |
| 13. | Broadview Park | 0.30% | 0.022% (+0.276)#13 | 0.014% (+0.284)#190 |
| 14. | Ocean Ridge | 0.29% | 0.022% (+0.270)#14 | 0.014% (+0.278)#196 |
| 15. | Center Hill | 0.27% | 0.022% (+0.244)#15 | 0.014% (+0.252)#220 |
| 16. | North Bay Village | 0.26% | 0.022% (+0.240)#16 | 0.014% (+0.248)#224 |
| 17. | Punta Gorda | 0.26% | 0.022% (+0.233)#17 | 0.014% (+0.241)#231 |
| 18. | Pinecrest | 0.25% | 0.022% (+0.224)#18 | 0.014% (+0.232)#244 |
| 19. | Pace | 0.24% | 0.022% (+0.216)#19 | 0.014% (+0.224)#249 |
| 20. | Key Biscayne | 0.23% | 0.022% (+0.205)#20 | 0.014% (+0.212)#263 |
| 21. | Whiskey Creek | 0.23% | 0.022% (+0.205)#21 | 0.014% (+0.212)#264 |
| 22. | Bayshore Gardens | 0.21% | 0.022% (+0.192)#22 | 0.014% (+0.199)#274 |
| 23. | Siesta Key | 0.20% | 0.022% (+0.177)#23 | 0.014% (+0.185)#287 |
| 24. | Westchase | 0.19% | 0.022% (+0.171)#24 | 0.014% (+0.179)#294 |
| 25. | Apollo Beach | 0.18% | 0.022% (+0.160)#25 | 0.014% (+0.167)#304 |
| 26. | Miami Beach | 0.17% | 0.022% (+0.146)#26 | 0.014% (+0.153)#328 |
| 27. | Naples Park | 0.15% | 0.022% (+0.132)#27 | 0.014% (+0.140)#351 |
| 28. | Redington Beach | 0.15% | 0.022% (+0.130)#28 | 0.014% (+0.137)#356 |
| 29. | Pasadena Hills | 0.15% | 0.022% (+0.128)#29 | 0.014% (+0.136)#360 |
| 30. | Key West | 0.15% | 0.022% (+0.128)#30 | 0.014% (+0.135)#363 |
| 31. | Upper Grand Lagoon | 0.15% | 0.022% (+0.125)#31 | 0.014% (+0.132)#367 |
| 32. | Winter Springs | 0.14% | 0.022% (+0.122)#32 | 0.014% (+0.130)#373 |
| 33. | Englewood | 0.14% | 0.022% (+0.118)#33 | 0.014% (+0.125)#376 |
| 34. | Fort Pierce North | 0.14% | 0.022% (+0.116)#34 | 0.014% (+0.124)#378 |
| 35. | Ave Maria | 0.14% | 0.022% (+0.114)#35 | 0.014% (+0.122)#381 |
| 36. | West Park | 0.13% | 0.022% (+0.104)#36 | 0.014% (+0.112)#397 |
| 37. | Sarasota | 0.12% | 0.022% (+0.101)#37 | 0.014% (+0.108)#401 |
| 38. | Palmetto Bay | 0.12% | 0.022% (+0.094)#38 | 0.014% (+0.101)#413 |
| 39. | Davie | 0.11% | 0.022% (+0.092)#39 | 0.014% (+0.099)#414 |
| 40. | Fruitville | 0.11% | 0.022% (+0.089)#40 | 0.014% (+0.097)#420 |
| 41. | St Augustine | 0.11% | 0.022% (+0.088)#41 | 0.014% (+0.095)#421 |
| 42. | Yulee | 0.11% | 0.022% (+0.087)#42 | 0.014% (+0.095)#423 |
| 43. | Longboat Key | 0.11% | 0.022% (+0.085)#43 | 0.014% (+0.093)#426 |
| 44. | Temple Terrace | 0.10% | 0.022% (+0.083)#44 | 0.014% (+0.090)#431 |
| 45. | Nocatee | 0.096% | 0.022% (+0.074)#45 | 0.014% (+0.082)#458 |
| 46. | Vero Beach South | 0.090% | 0.022% (+0.068)#46 | 0.014% (+0.076)#471 |
| 47. | West Vero Corridor | 0.087% | 0.022% (+0.066)#47 | 0.014% (+0.073)#482 |
| 48. | Horizon West | 0.087% | 0.022% (+0.065)#48 | 0.014% (+0.073)#483 |
| 49. | Aventura | 0.086% | 0.022% (+0.064)#49 | 0.014% (+0.072)#487 |
| 50. | Melbourne | 0.082% | 0.022% (+0.061)#50 | 0.014% (+0.068)#503 |
| 51. | Mcgregor | 0.078% | 0.022% (+0.057)#51 | 0.014% (+0.064)#513 |
| 52. | Naples | 0.078% | 0.022% (+0.056)#52 | 0.014% (+0.064)#519 |
| 53. | Jupiter | 0.076% | 0.022% (+0.054)#53 | 0.014% (+0.061)#527 |
| 54. | West Little River | 0.075% | 0.022% (+0.053)#54 | 0.014% (+0.061)#531 |
| 55. | Boca Raton | 0.073% | 0.022% (+0.052)#55 | 0.014% (+0.059)#537 |
| 56. | West Palm Beach | 0.073% | 0.022% (+0.051)#56 | 0.014% (+0.059)#538 |
| 57. | Viera East | 0.072% | 0.022% (+0.050)#57 | 0.014% (+0.058)#542 |
| 58. | Panama City Beach | 0.071% | 0.022% (+0.049)#58 | 0.014% (+0.057)#545 |
| 59. | Groveland | 0.068% | 0.022% (+0.046)#59 | 0.014% (+0.053)#561 |
| 60. | Palm City | 0.065% | 0.022% (+0.044)#60 | 0.014% (+0.051)#569 |
| 61. | Pembroke Pines | 0.065% | 0.022% (+0.043)#61 | 0.014% (+0.051)#572 |
| 62. | Fort Lauderdale | 0.063% | 0.022% (+0.041)#62 | 0.014% (+0.049)#585 |
| 63. | Titusville | 0.058% | 0.022% (+0.036)#63 | 0.014% (+0.043)#608 |
| 64. | The Villages | 0.056% | 0.022% (+0.034)#64 | 0.014% (+0.041)#621 |
| 65. | Venice | 0.054% | 0.022% (+0.033)#65 | 0.014% (+0.040)#628 |
| 66. | Pompano Beach | 0.054% | 0.022% (+0.032)#66 | 0.014% (+0.040)#632 |
| 67. | Cheval | 0.053% | 0.022% (+0.031)#67 | 0.014% (+0.039)#637 |
| 68. | Palm Beach Gardens | 0.052% | 0.022% (+0.031)#68 | 0.014% (+0.038)#638 |
| 69. | Gulfport | 0.051% | 0.022% (+0.029)#69 | 0.014% (+0.037)#645 |
| 70. | Rockledge | 0.050% | 0.022% (+0.029)#70 | 0.014% (+0.036)#651 |
| 71. | St Petersburg | 0.048% | 0.022% (+0.026)#71 | 0.014% (+0.034)#671 |
| 72. | Lake Magdalene | 0.048% | 0.022% (+0.026)#72 | 0.014% (+0.033)#674 |
| 73. | Northdale | 0.046% | 0.022% (+0.024)#73 | 0.014% (+0.032)#684 |
| 74. | Cape Coral | 0.046% | 0.022% (+0.024)#74 | 0.014% (+0.032)#689 |
| 75. | Tamiami | 0.045% | 0.022% (+0.024)#75 | 0.014% (+0.031)#692 |
| 76. | Pinellas Park | 0.043% | 0.022% (+0.021)#76 | 0.014% (+0.029)#709 |
| 77. | West Lealman | 0.042% | 0.022% (+0.020)#77 | 0.014% (+0.028)#725 |
| 78. | Edgewood | 0.037% | 0.022% (+0.015)#78 | 0.014% (+0.023)#753 |
| 79. | New Smyrna Beach | 0.036% | 0.022% (+0.014)#79 | 0.014% (+0.022)#760 |
| 80. | Palm Valley | 0.035% | 0.022% (+0.014)#80 | 0.014% (+0.021)#767 |
| 81. | Bradenton | 0.034% | 0.022% (+0.012)#81 | 0.014% (+0.020)#783 |
| 82. | Marco Island | 0.031% | 0.022% (+0.010)#82 | 0.014% (+0.017)#797 |
| 83. | Ruskin | 0.031% | 0.022% (+0.009)#83 | 0.014% (+0.017)#801 |
| 84. | Lehigh Acres | 0.027% | 0.022% (+0.006)#84 | 0.014% (+0.013)#835 |
| 85. | Port St Lucie | 0.026% | 0.022% (+0.004)#85 | 0.014% (+0.012)#851 |
| 86. | North Fort Myers | 0.026% | 0.022% (+0.004)#86 | 0.014% (+0.012)#854 |
| 87. | Parkland | 0.026% | 0.022% (+0.004)#87 | 0.014% (+0.012)#855 |
| 88. | South Miami | 0.025% | 0.022% (+0.003)#88 | 0.014% (+0.011)#861 |
| 89. | Tallahassee | 0.025% | 0.022% (+0.003)#89 | 0.014% (+0.011)#863 |
| 90. | Ormond Beach | 0.023% | 0.022% (+0.001)#90 | 0.014% (+0.009)#881 |
| 91. | Sanford | 0.023% | 0.022% (+0.001)#91 | 0.014% (+0.009)#885 |
| 92. | Coral Gables | 0.022% | 0.022% (+0.000)#92 | 0.014% (+0.008)#897 |
| 93. | Richmond West | 0.022% | 0.022% (-0.000)#93 | 0.014% (+0.007)#903 |
| 94. | Orlando | 0.021% | 0.022% (-0.001)#94 | 0.014% (+0.007)#910 |
| 95. | Lauderhill | 0.020% | 0.022% (-0.001)#95 | 0.014% (+0.006)#918 |
| 96. | Deerfield Beach | 0.020% | 0.022% (-0.002)#96 | 0.014% (+0.006)#929 |
| 97. | Pine Hills | 0.019% | 0.022% (-0.002)#97 | 0.014% (+0.005)#935 |
| 98. | Lake Worth Beach | 0.019% | 0.022% (-0.003)#98 | 0.014% (+0.005)#939 |
| 99. | Clearwater | 0.019% | 0.022% (-0.003)#99 | 0.014% (+0.005)#941 |
| 100. | Doral | 0.019% | 0.022% (-0.003)#100 | 0.014% (+0.005)#945 |
Common Questions
What are the Top 10 Cities with the Highest Percentage of Immigrants from Sweden in Florida?
Top 10 Cities with the Highest Percentage of Immigrants from Sweden in Florida are:
#1
0.98%
#2
0.53%
#3
0.50%
#4
0.47%
#5
0.42%
#6
0.39%
#7
0.37%
#8
0.33%
#9
0.33%
#10
0.31%
What city has the Highest Percentage of Immigrants from Sweden in Florida?
Palm Beach has the Highest Percentage of Immigrants from Sweden in Florida with 0.98%.
What is the Percentage of Immigrants from Sweden in the State of Florida?
Percentage of Immigrants from Sweden in Florida is 0.022%.
What is the Percentage of Immigrants from Sweden in the United States?
Percentage of Immigrants from Sweden in the United States is 0.014%.