Zip Codes with the Highest Percentage of Population Employed in Food Preparation & Serving in Stuart, FL
RELATED REPORTS & OPTIONS
Food Preparation & Serving
Stuart
Compare Zip Codes
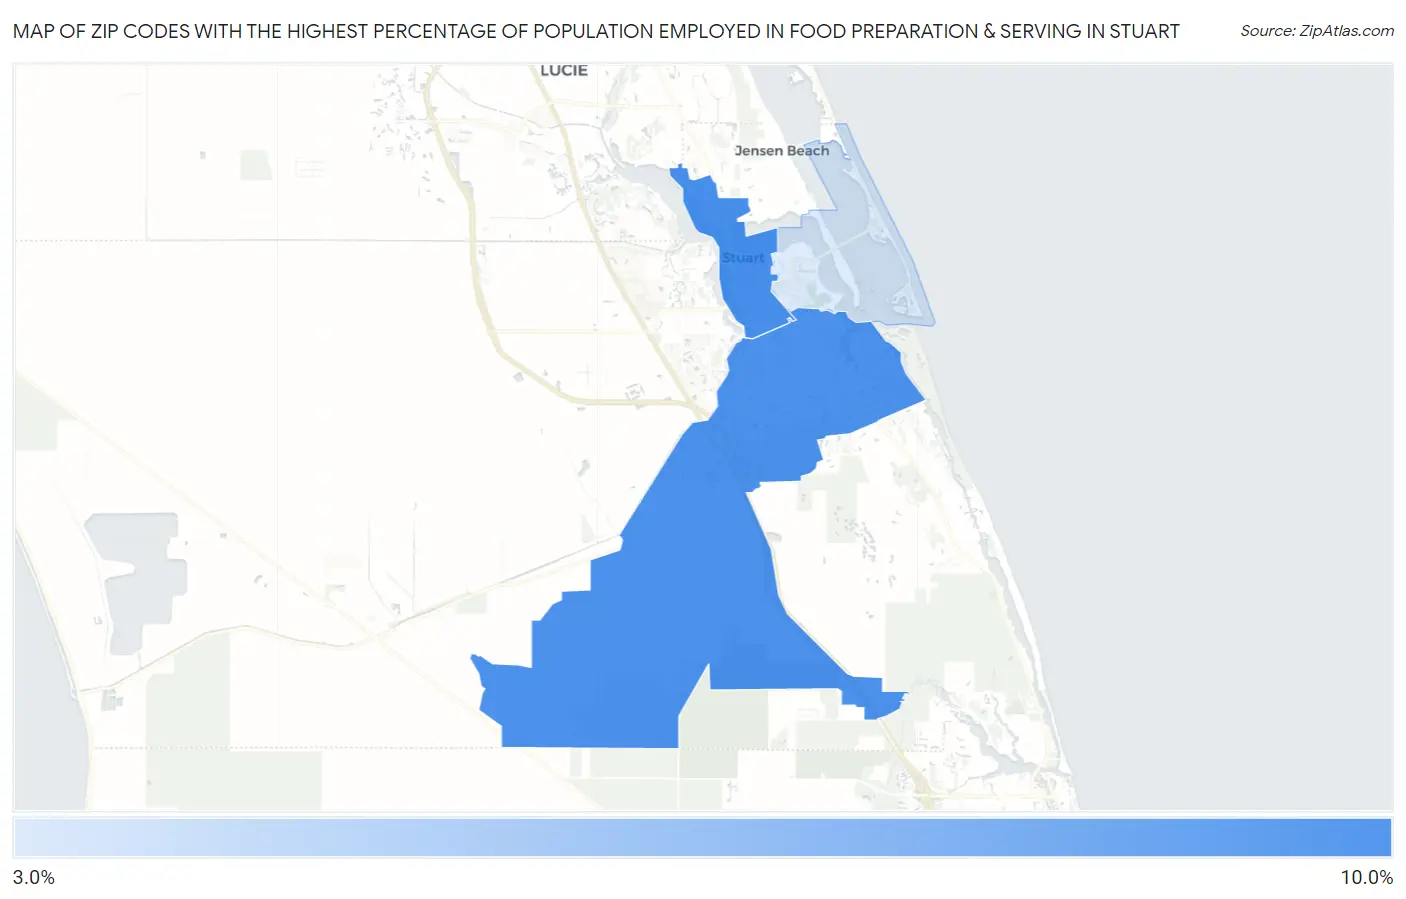
Map of Zip Codes with the Highest Percentage of Population Employed in Food Preparation & Serving in Stuart
3.4%
9.3%
Zip Codes with the Highest Percentage of Population Employed in Food Preparation & Serving in Stuart, FL
| Zip Code | % Employed | vs State | vs National | |
| 1. | 34994 | 9.3% | 6.1%(+3.18)#124 | 5.3%(+3.99)#3,256 |
| 2. | 34997 | 9.1% | 6.1%(+3.00)#135 | 5.3%(+3.81)#3,421 |
| 3. | 34996 | 3.4% | 6.1%(-2.71)#794 | 5.3%(-1.91)#19,702 |
1
Common Questions
What are the Top Zip Codes with the Highest Percentage of Population Employed in Food Preparation & Serving in Stuart, FL?
Top Zip Codes with the Highest Percentage of Population Employed in Food Preparation & Serving in Stuart, FL are:
What zip code has the Highest Percentage of Population Employed in Food Preparation & Serving in Stuart, FL?
34994 has the Highest Percentage of Population Employed in Food Preparation & Serving in Stuart, FL with 9.3%.
What is the Percentage of Population Employed in Food Preparation & Serving in Stuart, FL?
Percentage of Population Employed in Food Preparation & Serving in Stuart is 6.7%.
What is the Percentage of Population Employed in Food Preparation & Serving in Florida?
Percentage of Population Employed in Food Preparation & Serving in Florida is 6.1%.
What is the Percentage of Population Employed in Food Preparation & Serving in the United States?
Percentage of Population Employed in Food Preparation & Serving in the United States is 5.3%.