Cortez, FL Map & Demographics
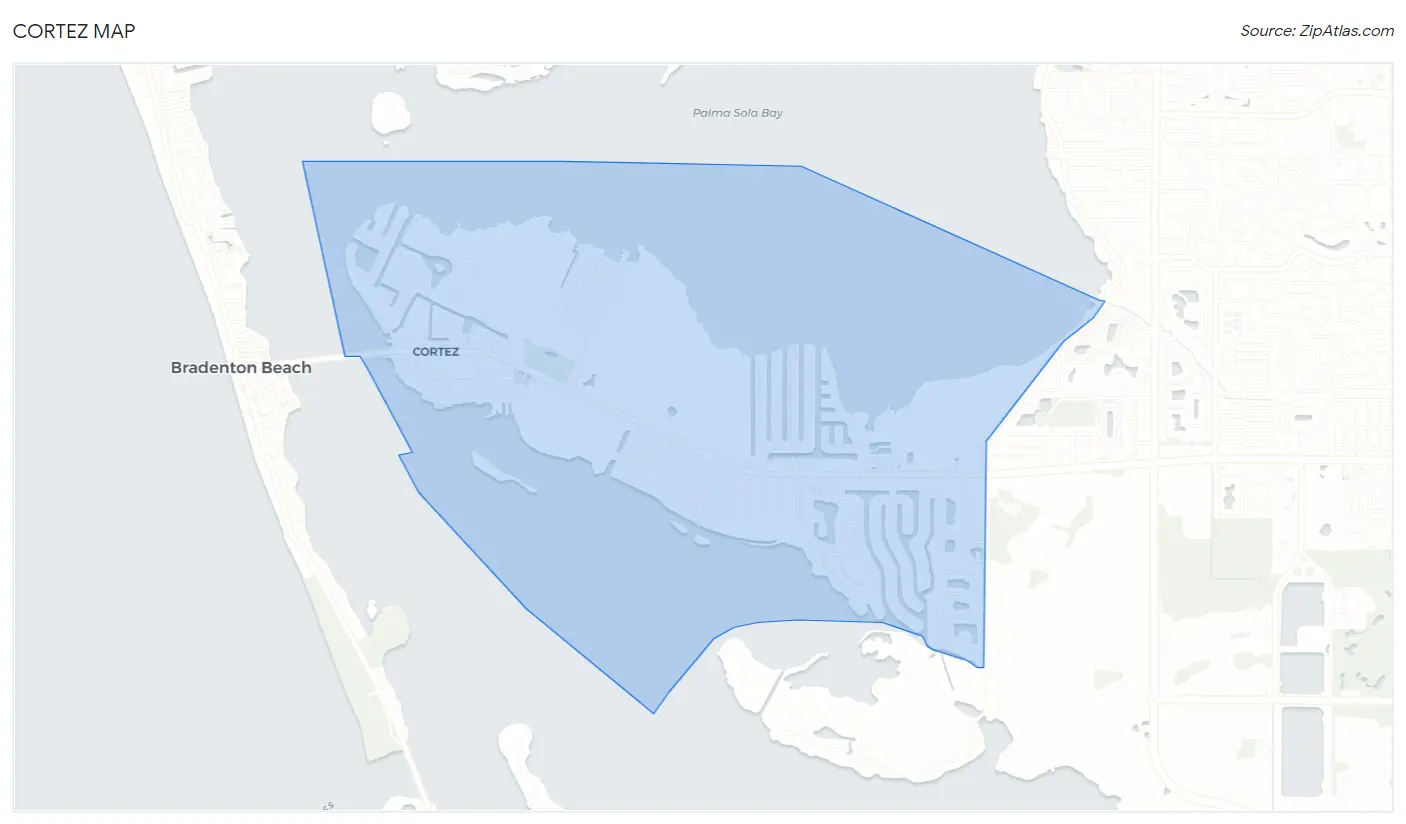
Cortez Map
Cortez Overview
$55,014
PER CAPITA INCOME
$89,804
AVG FAMILY INCOME
$74,769
AVG HOUSEHOLD INCOME
56.8%
WAGE / INCOME GAP [ % ]
43.2¢/ $1
WAGE / INCOME GAP [ $ ]
$8,569
FAMILY INCOME DEFICIT
0.49
INEQUALITY / GINI INDEX
5,033
TOTAL POPULATION
2,523
MALE POPULATION
2,510
FEMALE POPULATION
100.52
MALES / 100 FEMALES
99.48
FEMALES / 100 MALES
63.4
MEDIAN AGE
2.4
AVG FAMILY SIZE
2.1
AVG HOUSEHOLD SIZE
1,861
LABOR FORCE [ PEOPLE ]
39.7%
PERCENT IN LABOR FORCE
10.6%
UNEMPLOYMENT RATE
Cortez Zip Codes
Cortez Area Codes
Income in Cortez
Income Overview in Cortez
Per Capita Income in Cortez is $55,014, while median incomes of families and households are $89,804 and $74,769 respectively.
| Characteristic | Number | Measure |
| Per Capita Income | 5,033 | $55,014 |
| Median Family Income | 1,514 | $89,804 |
| Mean Family Income | 1,514 | $134,381 |
| Median Household Income | 2,419 | $74,769 |
| Mean Household Income | 2,419 | $111,959 |
| Income Deficit | 1,514 | $8,569 |
| Wage / Income Gap (%) | 5,033 | 56.83% |
| Wage / Income Gap ($) | 5,033 | 43.17¢ per $1 |
| Gini / Inequality Index | 5,033 | 0.49 |
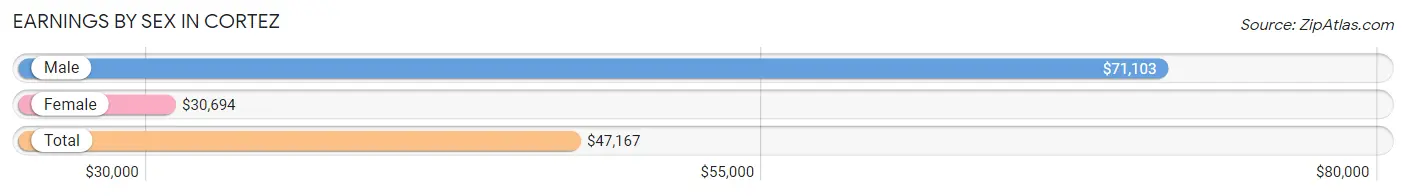
Earnings by Sex in Cortez
Average Earnings in Cortez are $47,167, $71,103 for men and $30,694 for women, a difference of 56.8%.
| Sex | Number | Average Earnings |
| Male | 1,105 (60.5%) | $71,103 |
| Female | 721 (39.5%) | $30,694 |
| Total | 1,826 (100.0%) | $47,167 |
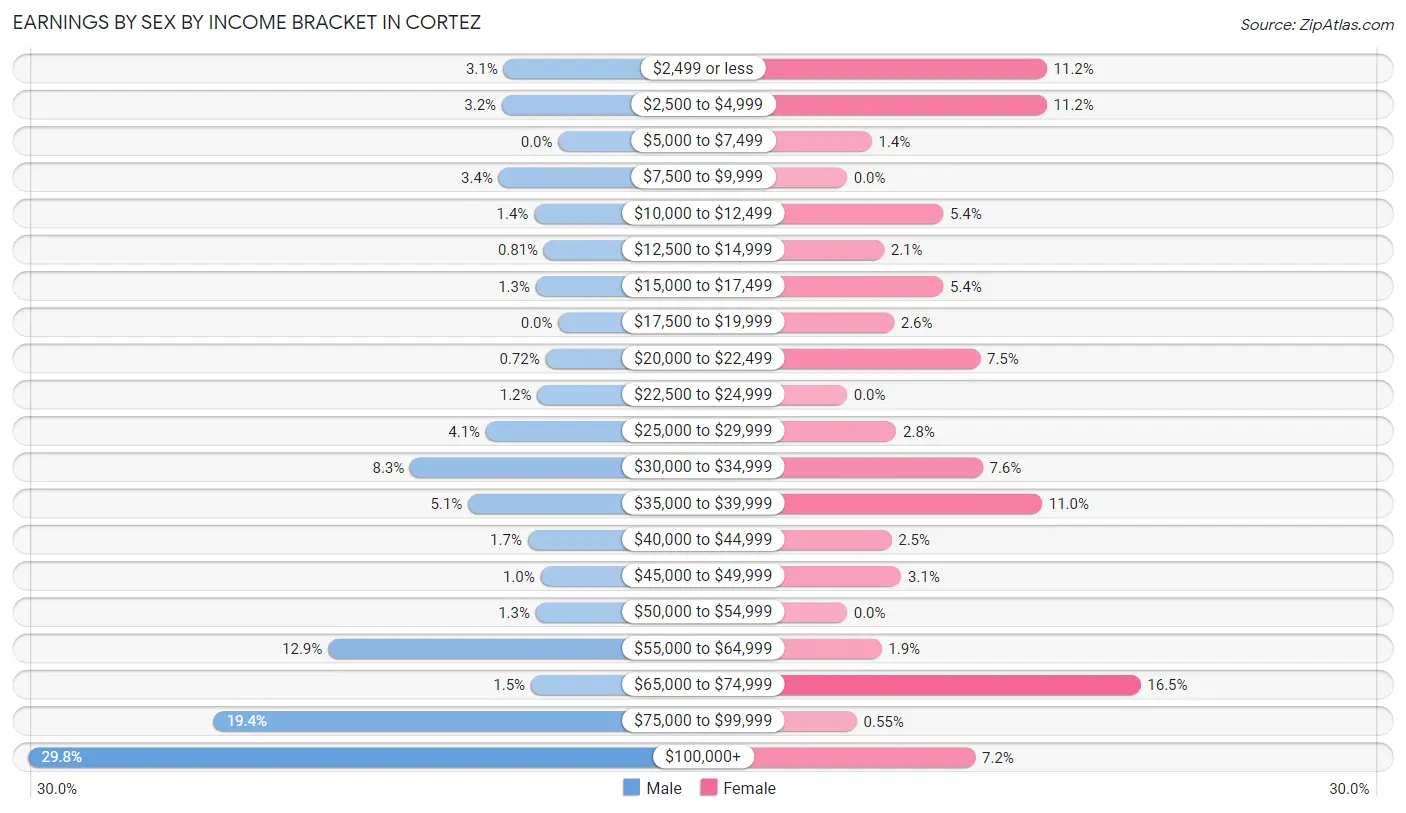
Earnings by Sex by Income Bracket in Cortez
The most common earnings brackets in Cortez are $100,000+ for men (329 | 29.8%) and $65,000 to $74,999 for women (119 | 16.5%).
| Income | Male | Female |
| $2,499 or less | 34 (3.1%) | 81 (11.2%) |
| $2,500 to $4,999 | 35 (3.2%) | 81 (11.2%) |
| $5,000 to $7,499 | 0 (0.0%) | 10 (1.4%) |
| $7,500 to $9,999 | 37 (3.4%) | 0 (0.0%) |
| $10,000 to $12,499 | 15 (1.4%) | 39 (5.4%) |
| $12,500 to $14,999 | 9 (0.8%) | 15 (2.1%) |
| $15,000 to $17,499 | 14 (1.3%) | 39 (5.4%) |
| $17,500 to $19,999 | 0 (0.0%) | 19 (2.6%) |
| $20,000 to $22,499 | 8 (0.7%) | 54 (7.5%) |
| $22,500 to $24,999 | 13 (1.2%) | 0 (0.0%) |
| $25,000 to $29,999 | 45 (4.1%) | 20 (2.8%) |
| $30,000 to $34,999 | 92 (8.3%) | 55 (7.6%) |
| $35,000 to $39,999 | 56 (5.1%) | 79 (11.0%) |
| $40,000 to $44,999 | 19 (1.7%) | 18 (2.5%) |
| $45,000 to $49,999 | 11 (1.0%) | 22 (3.0%) |
| $50,000 to $54,999 | 14 (1.3%) | 0 (0.0%) |
| $55,000 to $64,999 | 143 (12.9%) | 14 (1.9%) |
| $65,000 to $74,999 | 17 (1.5%) | 119 (16.5%) |
| $75,000 to $99,999 | 214 (19.4%) | 4 (0.5%) |
| $100,000+ | 329 (29.8%) | 52 (7.2%) |
| Total | 1,105 (100.0%) | 721 (100.0%) |
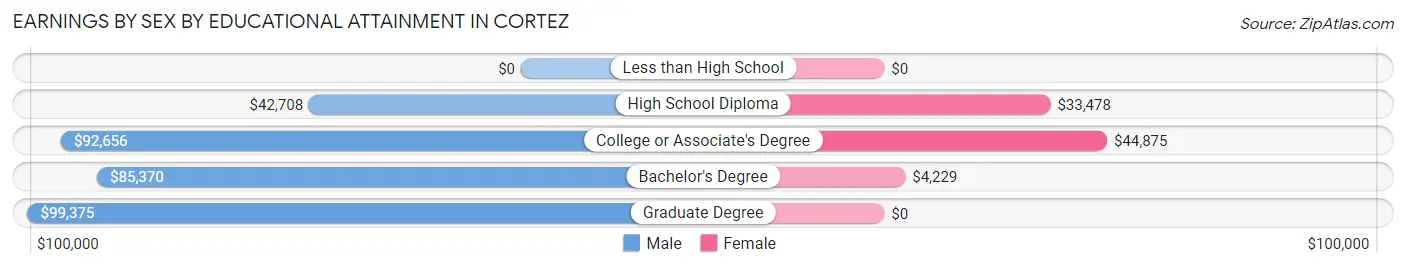
Earnings by Sex by Educational Attainment in Cortez
Average earnings in Cortez are $85,267 for men and $30,694 for women, a difference of 64.0%. Men with an educational attainment of graduate degree enjoy the highest average annual earnings of $99,375, while those with high school diploma education earn the least with $42,708. Women with an educational attainment of college or associate's degree earn the most with the average annual earnings of $44,875, while those with bachelor's degree education have the smallest earnings of $4,229.
| Educational Attainment | Male Income | Female Income |
| Less than High School | - | - |
| High School Diploma | $42,708 | $33,478 |
| College or Associate's Degree | $92,656 | $44,875 |
| Bachelor's Degree | $85,370 | $4,229 |
| Graduate Degree | $99,375 | $0 |
| Total | $85,267 | $30,694 |
Family Income in Cortez
Family Income Brackets in Cortez
According to the Cortez family income data, there are 307 families falling into the $100,000 to $149,999 income range, which is the most common income bracket and makes up 20.3% of all families. Conversely, the less than $10,000 income bracket is the least frequent group with only 30 families (2.0%) belonging to this category.
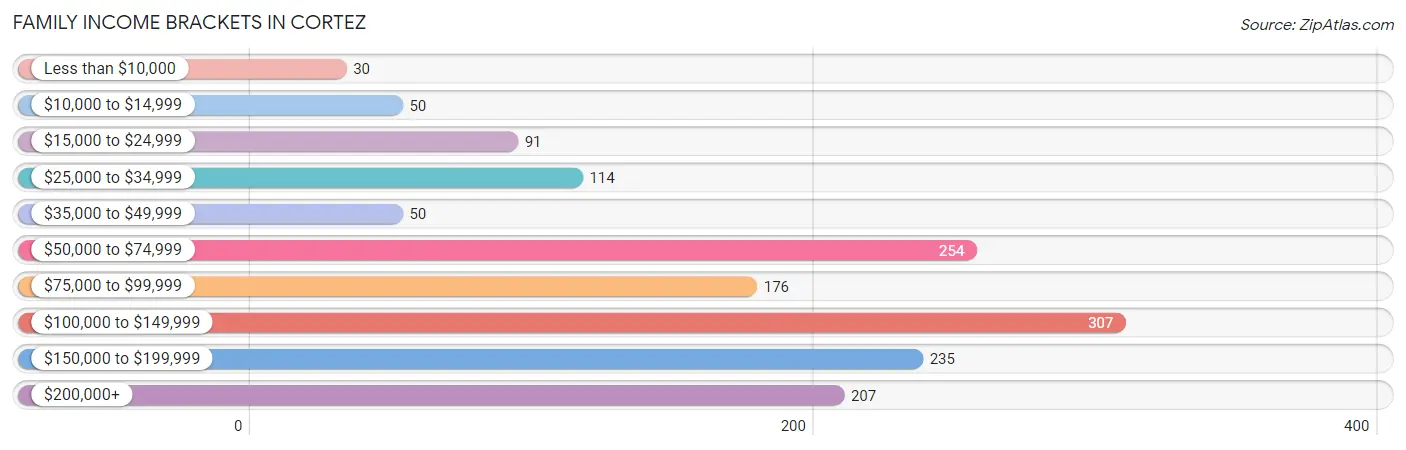
| Income Bracket | # Families | % Families |
| Less than $10,000 | 30 | 2.0% |
| $10,000 to $14,999 | 50 | 3.3% |
| $15,000 to $24,999 | 91 | 6.0% |
| $25,000 to $34,999 | 114 | 7.5% |
| $35,000 to $49,999 | 50 | 3.3% |
| $50,000 to $74,999 | 254 | 16.8% |
| $75,000 to $99,999 | 176 | 11.6% |
| $100,000 to $149,999 | 307 | 20.3% |
| $150,000 to $199,999 | 235 | 15.5% |
| $200,000+ | 207 | 13.7% |
Family Income by Famaliy Size in Cortez
3-person families (182 | 12.0%) account for the highest median family income in Cortez with $140,500 per family, while 3-person families (182 | 12.0%) have the highest median income of $46,833 per family member.
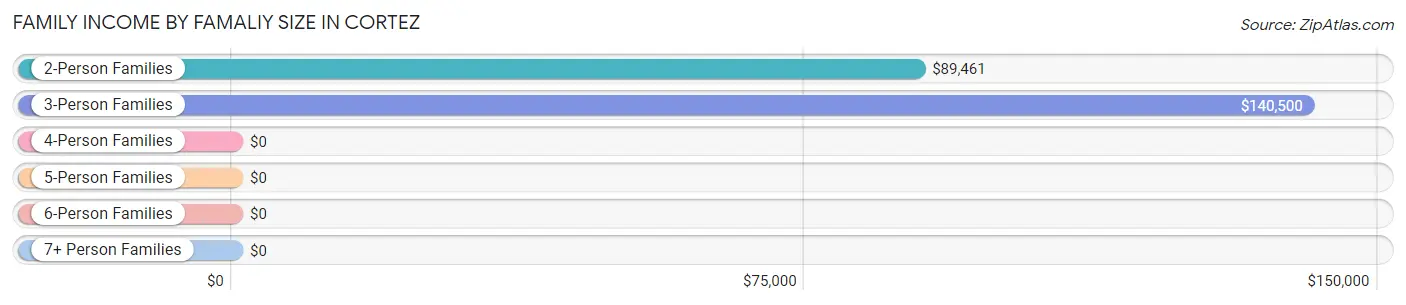
| Income Bracket | # Families | Median Income |
| 2-Person Families | 1,232 (81.4%) | $89,461 |
| 3-Person Families | 182 (12.0%) | $140,500 |
| 4-Person Families | 100 (6.6%) | $0 |
| 5-Person Families | 0 (0.0%) | $0 |
| 6-Person Families | 0 (0.0%) | $0 |
| 7+ Person Families | 0 (0.0%) | $0 |
| Total | 1,514 (100.0%) | $89,804 |
Family Income by Number of Earners in Cortez
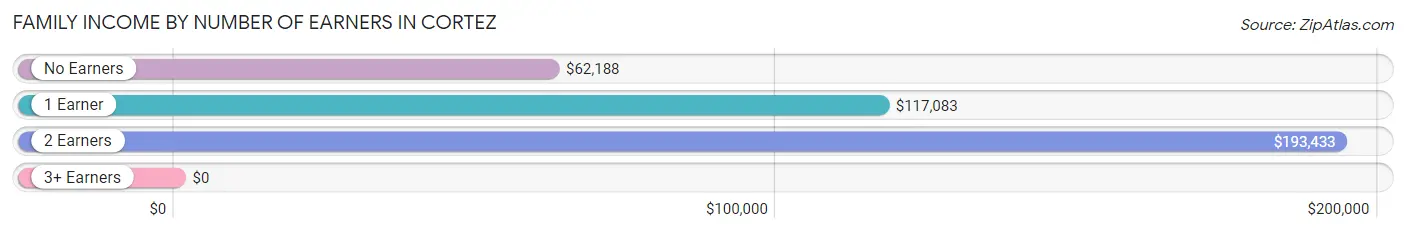
| Number of Earners | # Families | Median Income |
| No Earners | 652 (43.1%) | $62,188 |
| 1 Earner | 548 (36.2%) | $117,083 |
| 2 Earners | 314 (20.7%) | $193,433 |
| 3+ Earners | 0 (0.0%) | $0 |
| Total | 1,514 (100.0%) | $89,804 |
Household Income in Cortez
Household Income Brackets in Cortez
With 460 households falling in the category, the $50,000 to $74,999 income range is the most frequent in Cortez, accounting for 19.0% of all households. In contrast, only 97 households (4.0%) fall into the less than $10,000 income bracket, making it the least populous group.
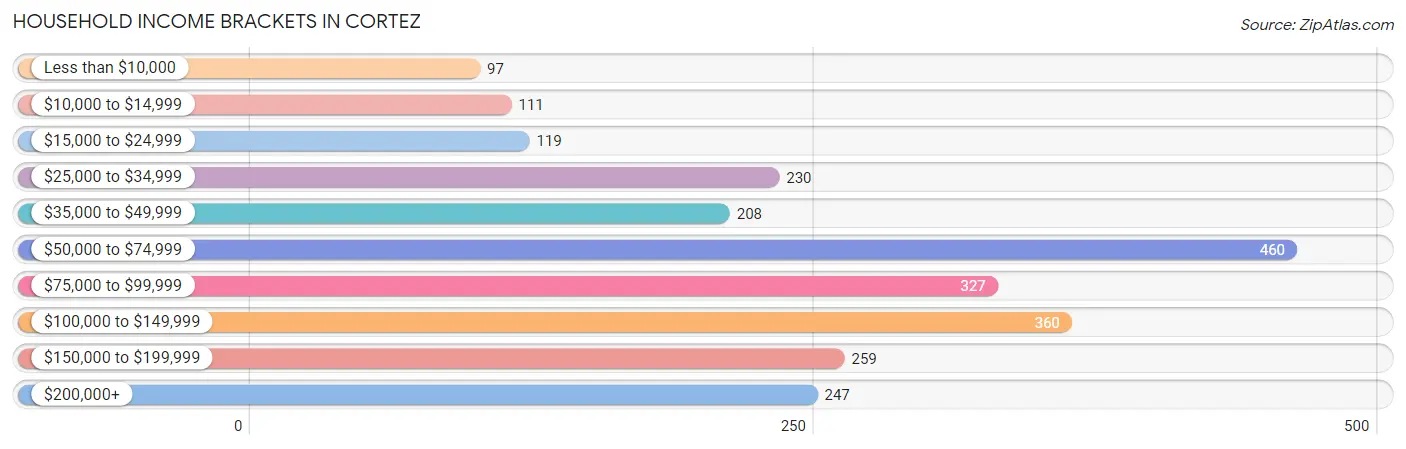
| Income Bracket | # Households | % Households |
| Less than $10,000 | 97 | 4.0% |
| $10,000 to $14,999 | 111 | 4.6% |
| $15,000 to $24,999 | 119 | 4.9% |
| $25,000 to $34,999 | 230 | 9.5% |
| $35,000 to $49,999 | 208 | 8.6% |
| $50,000 to $74,999 | 460 | 19.0% |
| $75,000 to $99,999 | 327 | 13.5% |
| $100,000 to $149,999 | 360 | 14.9% |
| $150,000 to $199,999 | 259 | 10.7% |
| $200,000+ | 247 | 10.2% |
Household Income by Householder Age in Cortez
The median household income in Cortez is $74,769, with the highest median household income of $141,078 found in the 45 to 64 years age bracket for the primary householder. A total of 688 households (28.4%) fall into this category.
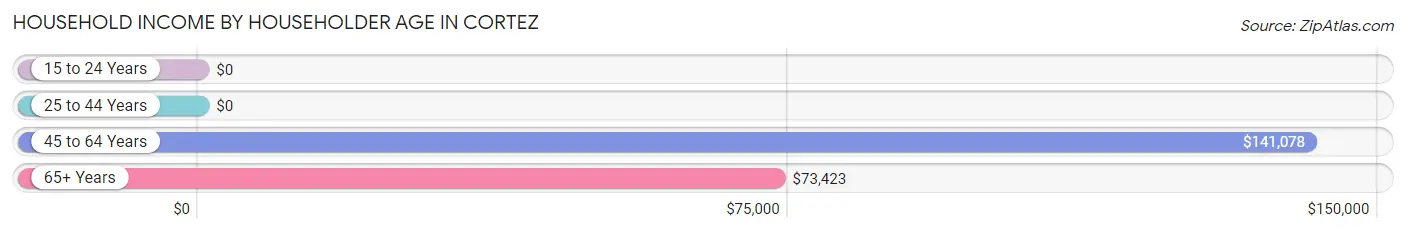
| Income Bracket | # Households | Median Income |
| 15 to 24 Years | 0 (0.0%) | $0 |
| 25 to 44 Years | 289 (11.9%) | $0 |
| 45 to 64 Years | 688 (28.4%) | $141,078 |
| 65+ Years | 1,442 (59.6%) | $73,423 |
| Total | 2,419 (100.0%) | $74,769 |
Poverty in Cortez
Income Below Poverty by Sex and Age in Cortez
With 7.7% poverty level for males and 10.7% for females among the residents of Cortez, 25 to 34 year old males and 25 to 34 year old females are the most vulnerable to poverty, with 37 males (22.3%) and 40 females (33.3%) in their respective age groups living below the poverty level.
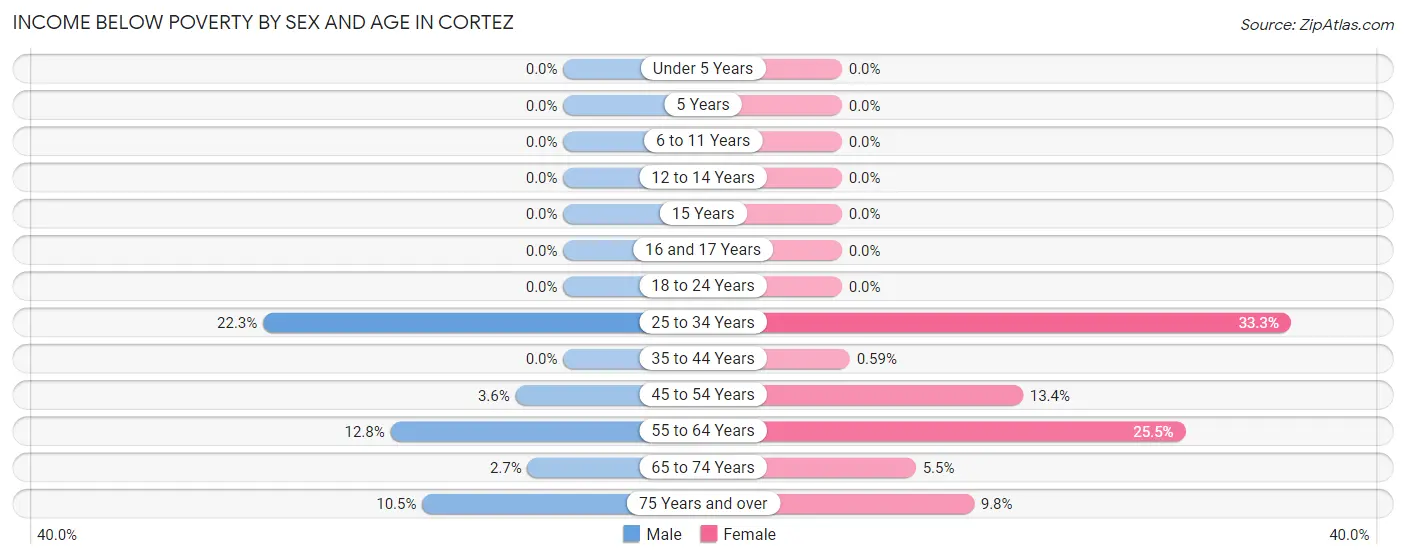
| Age Bracket | Male | Female |
| Under 5 Years | 0 (0.0%) | 0 (0.0%) |
| 5 Years | 0 (0.0%) | 0 (0.0%) |
| 6 to 11 Years | 0 (0.0%) | 0 (0.0%) |
| 12 to 14 Years | 0 (0.0%) | 0 (0.0%) |
| 15 Years | 0 (0.0%) | 0 (0.0%) |
| 16 and 17 Years | 0 (0.0%) | 0 (0.0%) |
| 18 to 24 Years | 0 (0.0%) | 0 (0.0%) |
| 25 to 34 Years | 37 (22.3%) | 40 (33.3%) |
| 35 to 44 Years | 0 (0.0%) | 1 (0.6%) |
| 45 to 54 Years | 10 (3.5%) | 25 (13.4%) |
| 55 to 64 Years | 63 (12.8%) | 112 (25.5%) |
| 65 to 74 Years | 11 (2.7%) | 36 (5.5%) |
| 75 Years and over | 72 (10.5%) | 54 (9.8%) |
| Total | 193 (7.7%) | 268 (10.7%) |
Income Above Poverty by Sex and Age in Cortez
According to the poverty statistics in Cortez, males aged under 5 years and females aged under 5 years are the age groups that are most secure financially, with 100.0% of males and 100.0% of females in these age groups living above the poverty line.
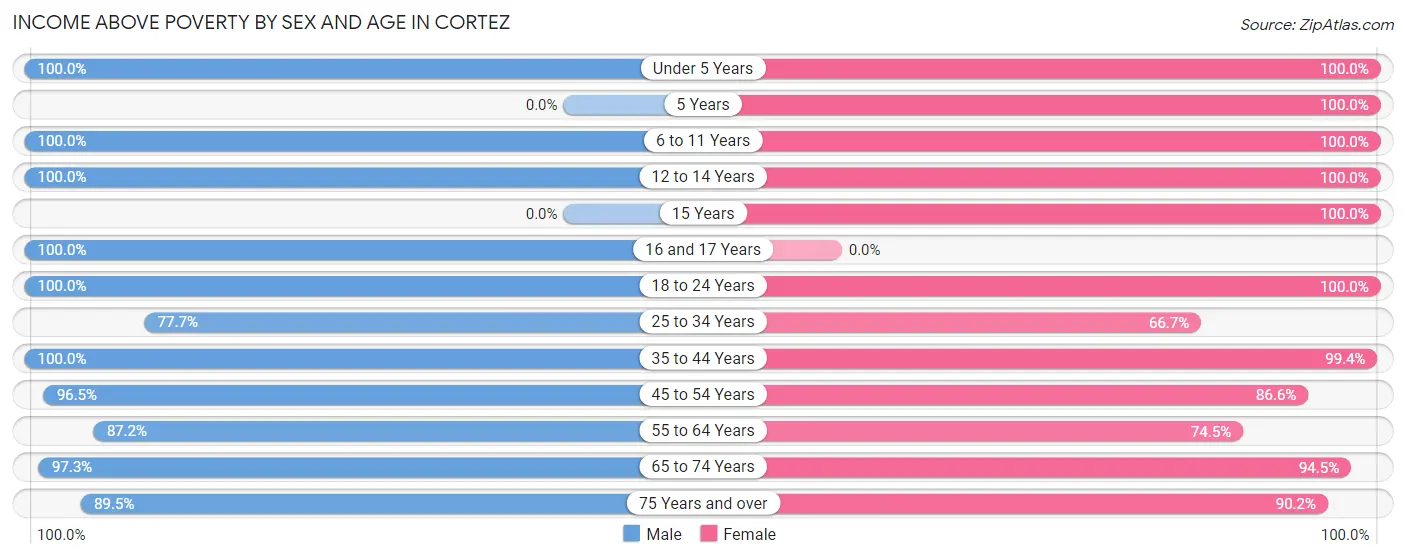
| Age Bracket | Male | Female |
| Under 5 Years | 46 (100.0%) | 186 (100.0%) |
| 5 Years | 0 (0.0%) | 5 (100.0%) |
| 6 to 11 Years | 8 (100.0%) | 3 (100.0%) |
| 12 to 14 Years | 45 (100.0%) | 26 (100.0%) |
| 15 Years | 0 (0.0%) | 26 (100.0%) |
| 16 and 17 Years | 154 (100.0%) | 0 (0.0%) |
| 18 to 24 Years | 49 (100.0%) | 139 (100.0%) |
| 25 to 34 Years | 129 (77.7%) | 80 (66.7%) |
| 35 to 44 Years | 158 (100.0%) | 169 (99.4%) |
| 45 to 54 Years | 272 (96.5%) | 161 (86.6%) |
| 55 to 64 Years | 428 (87.2%) | 327 (74.5%) |
| 65 to 74 Years | 403 (97.3%) | 620 (94.5%) |
| 75 Years and over | 616 (89.5%) | 497 (90.2%) |
| Total | 2,308 (92.3%) | 2,239 (89.3%) |
Income Below Poverty Among Married-Couple Families in Cortez
The poverty statistics for married-couple families in Cortez show that 6.6% or 88 of the total 1,330 families live below the poverty line. Families with no children have the highest poverty rate of 7.1%, comprising of 88 families. On the other hand, families with 1 or 2 children have the lowest poverty rate of 0.0%, which includes 0 families.
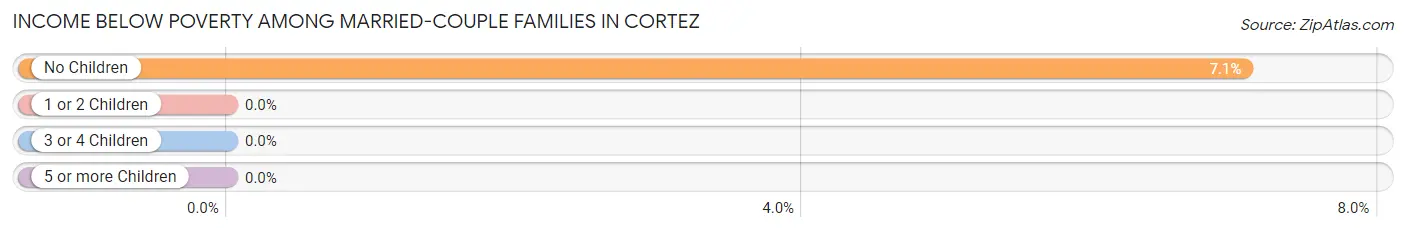
| Children | Above Poverty | Below Poverty |
| No Children | 1,157 (92.9%) | 88 (7.1%) |
| 1 or 2 Children | 85 (100.0%) | 0 (0.0%) |
| 3 or 4 Children | 0 (0.0%) | 0 (0.0%) |
| 5 or more Children | 0 (0.0%) | 0 (0.0%) |
| Total | 1,242 (93.4%) | 88 (6.6%) |
Income Below Poverty Among Single-Parent Households in Cortez
| Children | Single Father | Single Mother |
| No Children | 0 (0.0%) | 0 (0.0%) |
| 1 or 2 Children | 0 (0.0%) | 0 (0.0%) |
| 3 or 4 Children | 0 (0.0%) | 0 (0.0%) |
| 5 or more Children | 0 (0.0%) | 0 (0.0%) |
| Total | 0 (0.0%) | 0 (0.0%) |
Income Below Poverty Among Married-Couple vs Single-Parent Households in Cortez
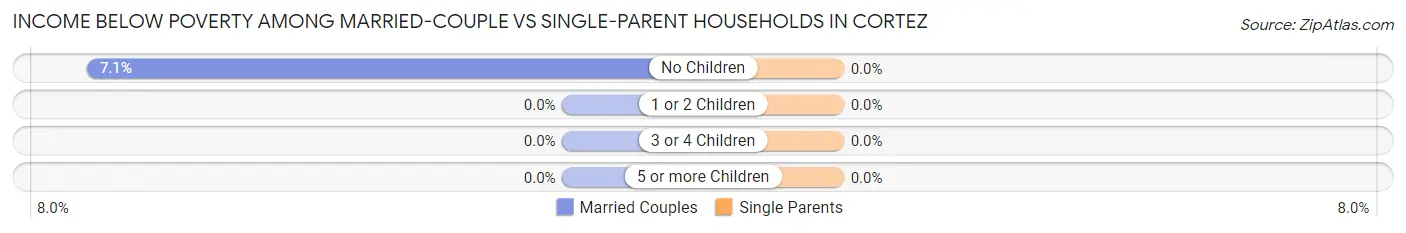
| Children | Married-Couple Families | Single-Parent Households |
| No Children | 88 (7.1%) | 0 (0.0%) |
| 1 or 2 Children | 0 (0.0%) | 0 (0.0%) |
| 3 or 4 Children | 0 (0.0%) | 0 (0.0%) |
| 5 or more Children | 0 (0.0%) | 0 (0.0%) |
| Total | 88 (6.6%) | 0 (0.0%) |
Race in Cortez
The most populous races in Cortez are White / Caucasian (4,934 | 98.0%), Hispanic or Latino (123 | 2.4%), and Two or more Races (55 | 1.1%).
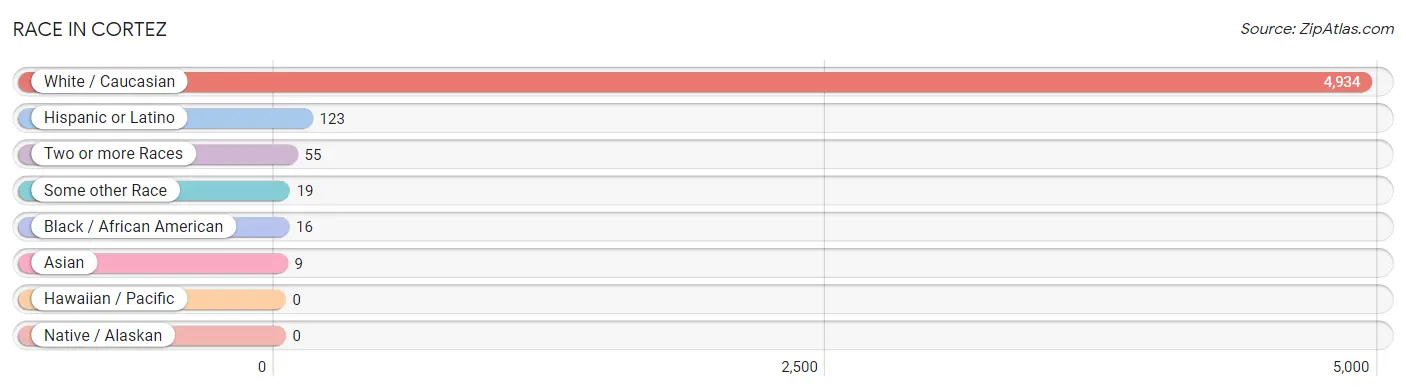
| Race | # Population | % Population |
| Asian | 9 | 0.2% |
| Black / African American | 16 | 0.3% |
| Hawaiian / Pacific | 0 | 0.0% |
| Hispanic or Latino | 123 | 2.4% |
| Native / Alaskan | 0 | 0.0% |
| White / Caucasian | 4,934 | 98.0% |
| Two or more Races | 55 | 1.1% |
| Some other Race | 19 | 0.4% |
| Total | 5,033 | 100.0% |
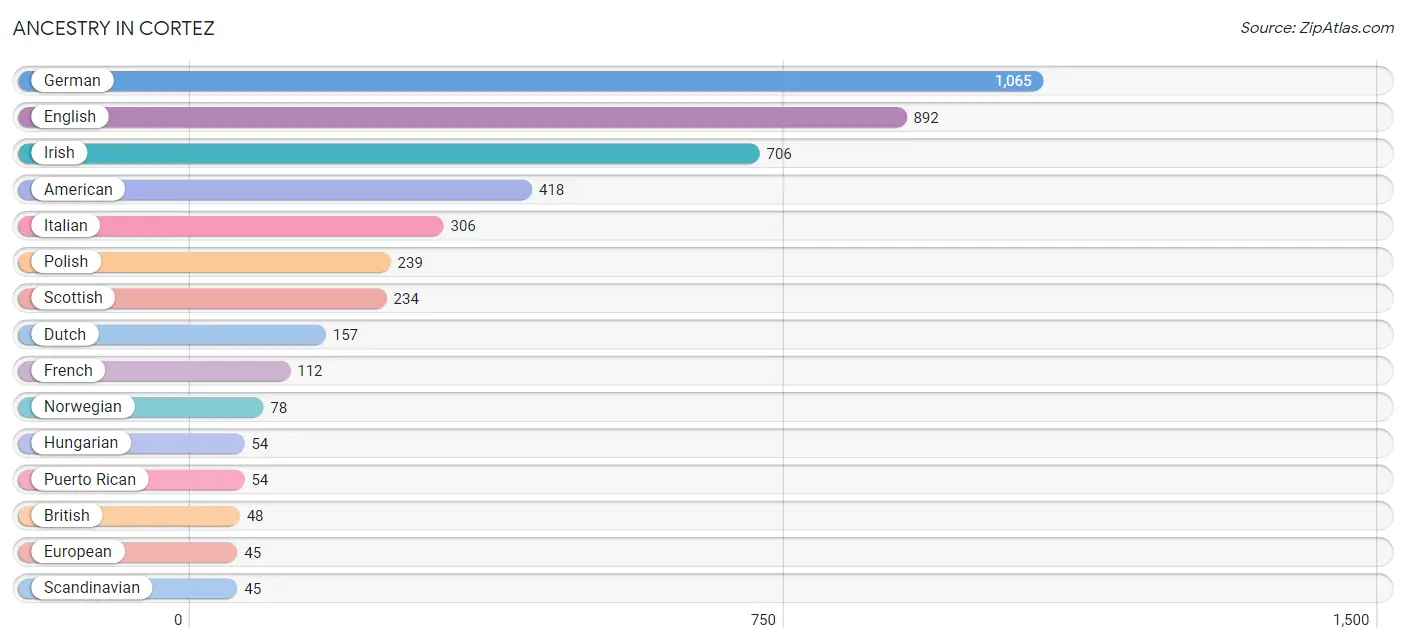
Ancestry in Cortez
The most populous ancestries reported in Cortez are German (1,065 | 21.2%), English (892 | 17.7%), Irish (706 | 14.0%), American (418 | 8.3%), and Italian (306 | 6.1%), together accounting for 67.3% of all Cortez residents.
| Ancestry | # Population | % Population |
| American | 418 | 8.3% |
| Austrian | 24 | 0.5% |
| Bhutanese | 16 | 0.3% |
| British | 48 | 0.9% |
| Canadian | 39 | 0.8% |
| Cuban | 21 | 0.4% |
| Czech | 10 | 0.2% |
| Danish | 21 | 0.4% |
| Dutch | 157 | 3.1% |
| English | 892 | 17.7% |
| European | 45 | 0.9% |
| Finnish | 15 | 0.3% |
| French | 112 | 2.2% |
| French Canadian | 15 | 0.3% |
| German | 1,065 | 21.2% |
| Greek | 11 | 0.2% |
| Guyanese | 9 | 0.2% |
| Hungarian | 54 | 1.1% |
| Indian (Asian) | 1 | 0.0% |
| Irish | 706 | 14.0% |
| Italian | 306 | 6.1% |
| Lithuanian | 19 | 0.4% |
| Macedonian | 14 | 0.3% |
| Mexican | 32 | 0.6% |
| Northern European | 20 | 0.4% |
| Norwegian | 78 | 1.5% |
| Polish | 239 | 4.8% |
| Portuguese | 14 | 0.3% |
| Puerto Rican | 54 | 1.1% |
| Russian | 23 | 0.5% |
| Scandinavian | 45 | 0.9% |
| Scotch-Irish | 41 | 0.8% |
| Scottish | 234 | 4.6% |
| Slovak | 22 | 0.4% |
| South American | 3 | 0.1% |
| Spaniard | 13 | 0.3% |
| Swedish | 9 | 0.2% |
| Swiss | 13 | 0.3% |
| Venezuelan | 3 | 0.1% |
| Welsh | 30 | 0.6% | View All 40 Rows |
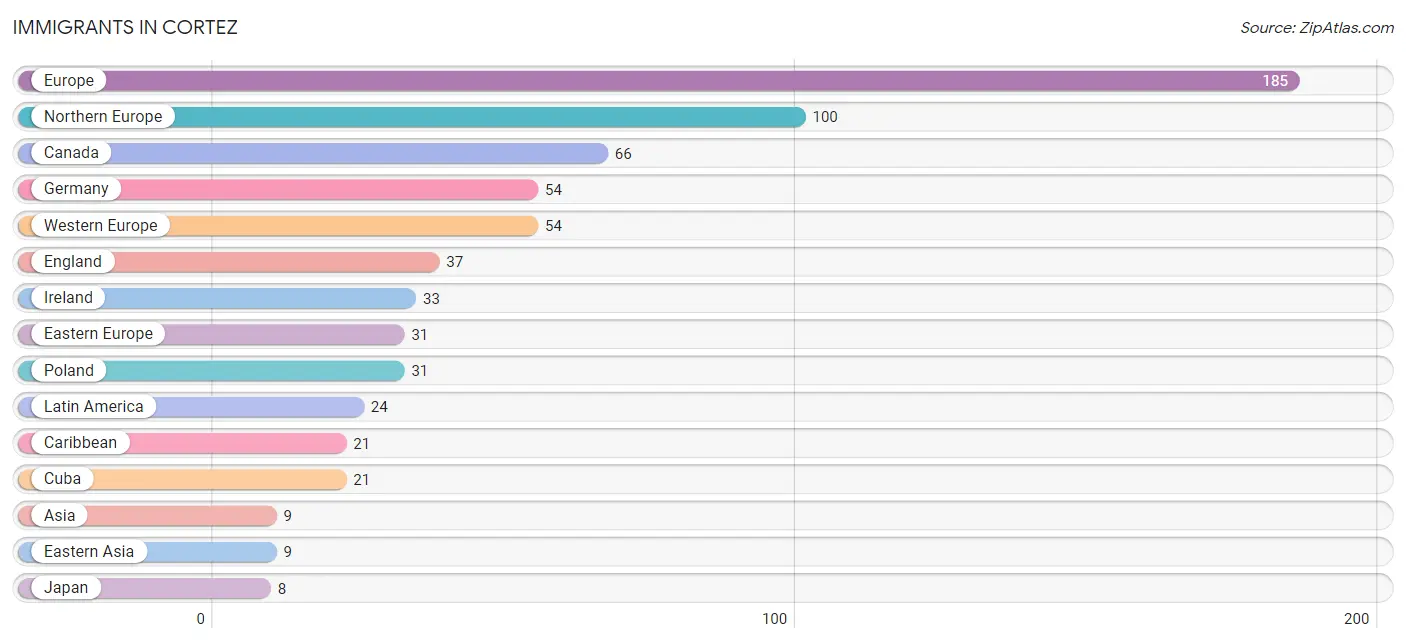
Immigrants in Cortez
The most numerous immigrant groups reported in Cortez came from Europe (185 | 3.7%), Northern Europe (100 | 2.0%), Canada (66 | 1.3%), Germany (54 | 1.1%), and Western Europe (54 | 1.1%), together accounting for 9.1% of all Cortez residents.
| Immigration Origin | # Population | % Population |
| Asia | 9 | 0.2% |
| Canada | 66 | 1.3% |
| Caribbean | 21 | 0.4% |
| China | 1 | 0.0% |
| Cuba | 21 | 0.4% |
| Eastern Asia | 9 | 0.2% |
| Eastern Europe | 31 | 0.6% |
| England | 37 | 0.7% |
| Europe | 185 | 3.7% |
| Germany | 54 | 1.1% |
| Ireland | 33 | 0.7% |
| Japan | 8 | 0.2% |
| Latin America | 24 | 0.5% |
| Northern Europe | 100 | 2.0% |
| Poland | 31 | 0.6% |
| South America | 3 | 0.1% |
| Venezuela | 3 | 0.1% |
| Western Europe | 54 | 1.1% | View All 18 Rows |
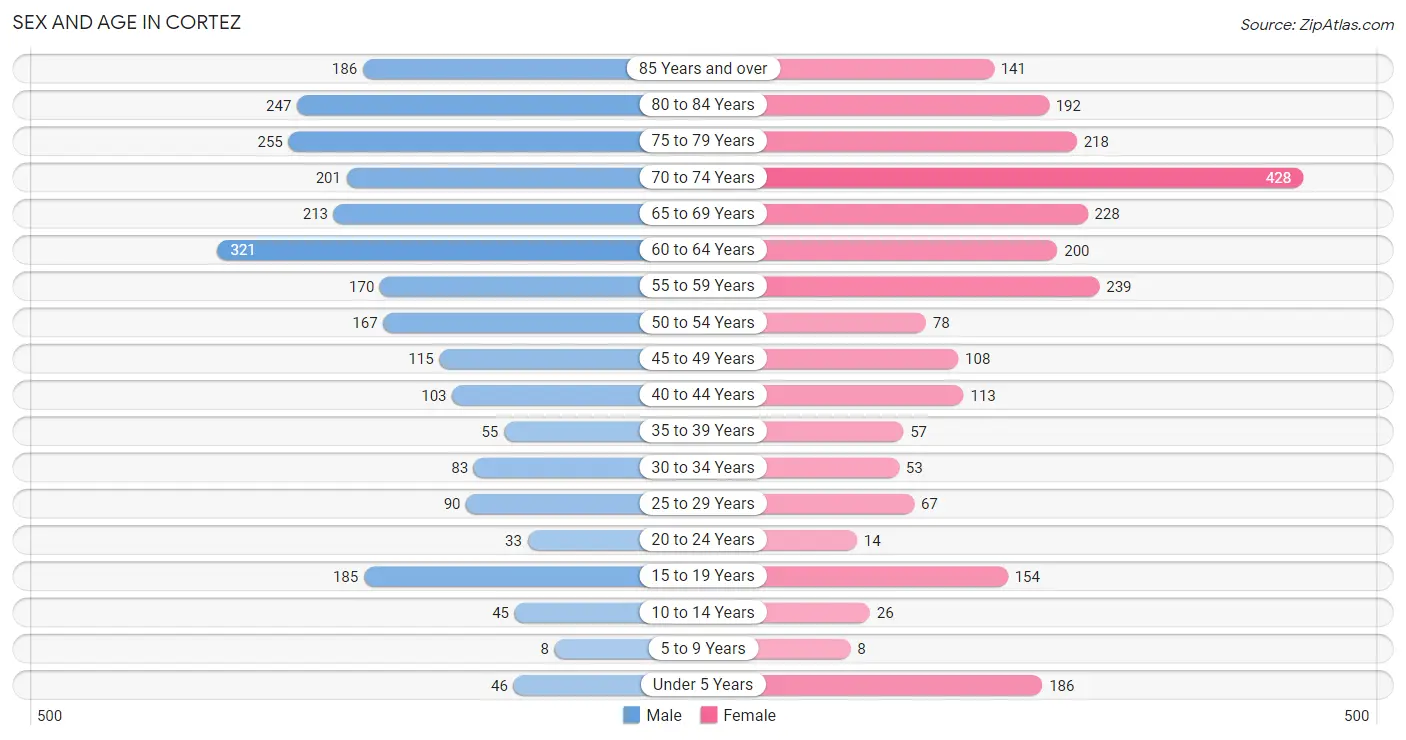
Sex and Age in Cortez
Sex and Age in Cortez
The most populous age groups in Cortez are 60 to 64 Years (321 | 12.7%) for men and 70 to 74 Years (428 | 17.1%) for women.
| Age Bracket | Male | Female |
| Under 5 Years | 46 (1.8%) | 186 (7.4%) |
| 5 to 9 Years | 8 (0.3%) | 8 (0.3%) |
| 10 to 14 Years | 45 (1.8%) | 26 (1.0%) |
| 15 to 19 Years | 185 (7.3%) | 154 (6.1%) |
| 20 to 24 Years | 33 (1.3%) | 14 (0.6%) |
| 25 to 29 Years | 90 (3.6%) | 67 (2.7%) |
| 30 to 34 Years | 83 (3.3%) | 53 (2.1%) |
| 35 to 39 Years | 55 (2.2%) | 57 (2.3%) |
| 40 to 44 Years | 103 (4.1%) | 113 (4.5%) |
| 45 to 49 Years | 115 (4.6%) | 108 (4.3%) |
| 50 to 54 Years | 167 (6.6%) | 78 (3.1%) |
| 55 to 59 Years | 170 (6.7%) | 239 (9.5%) |
| 60 to 64 Years | 321 (12.7%) | 200 (8.0%) |
| 65 to 69 Years | 213 (8.4%) | 228 (9.1%) |
| 70 to 74 Years | 201 (8.0%) | 428 (17.1%) |
| 75 to 79 Years | 255 (10.1%) | 218 (8.7%) |
| 80 to 84 Years | 247 (9.8%) | 192 (7.6%) |
| 85 Years and over | 186 (7.4%) | 141 (5.6%) |
| Total | 2,523 (100.0%) | 2,510 (100.0%) |
Families and Households in Cortez
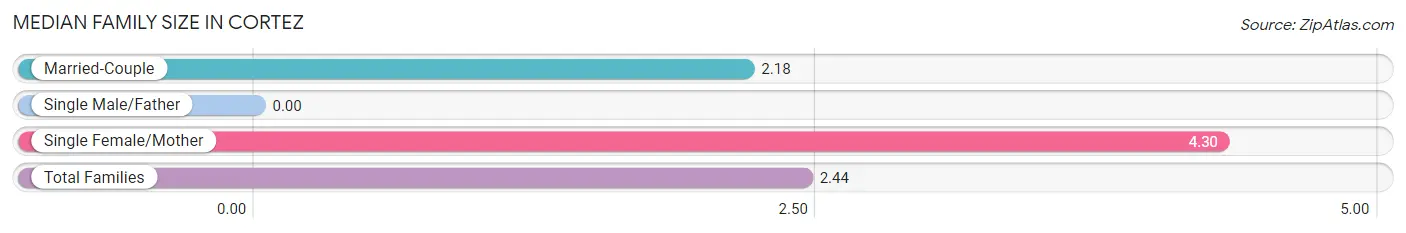
Median Family Size in Cortez
| Family Type | # Families | Family Size |
| Married-Couple | 1,330 (87.8%) | 2.18 |
| Single Male/Father | 0 (0.0%) | - |
| Single Female/Mother | 184 (12.1%) | 4.30 |
| Total Families | 1,514 (100.0%) | 2.44 |
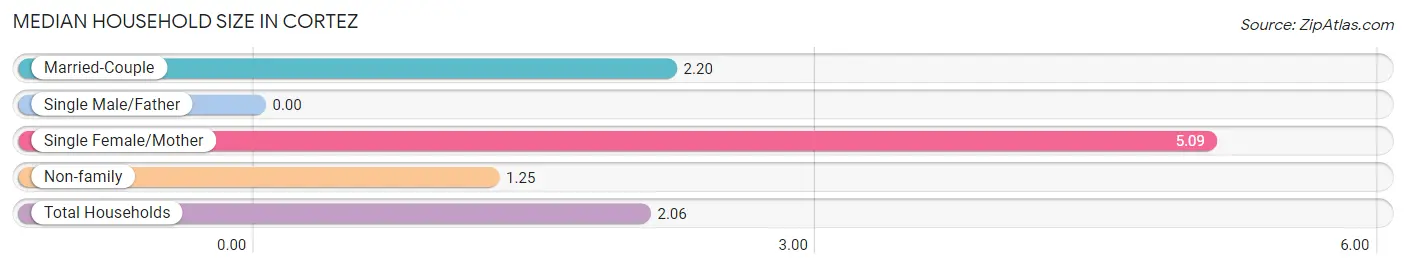
Median Household Size in Cortez
| Household Type | # Households | Household Size |
| Married-Couple | 1,330 (55.0%) | 2.20 |
| Single Male/Father | 0 (0.0%) | - |
| Single Female/Mother | 184 (7.6%) | 5.09 |
| Non-family | 905 (37.4%) | 1.25 |
| Total Households | 2,419 (100.0%) | 2.06 |
Household Size by Marriage Status in Cortez
Out of a total of 2,419 households in Cortez, 1,514 (62.6%) are family households, while 905 (37.4%) are nonfamily households. The most numerous type of family households are 2-person households, comprising 1,158, and the most common type of nonfamily households are 1-person households, comprising 754.
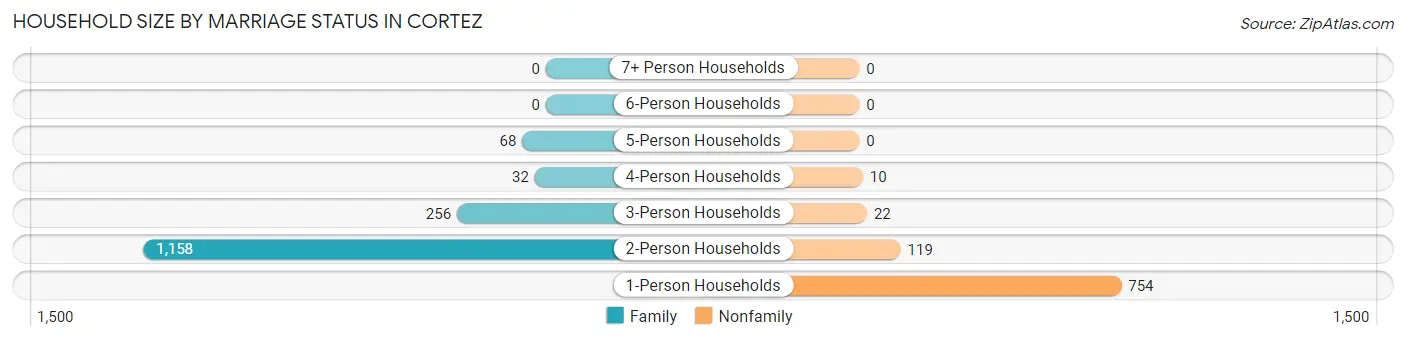
| Household Size | Family Households | Nonfamily Households |
| 1-Person Households | - | 754 (31.2%) |
| 2-Person Households | 1,158 (47.9%) | 119 (4.9%) |
| 3-Person Households | 256 (10.6%) | 22 (0.9%) |
| 4-Person Households | 32 (1.3%) | 10 (0.4%) |
| 5-Person Households | 68 (2.8%) | 0 (0.0%) |
| 6-Person Households | 0 (0.0%) | 0 (0.0%) |
| 7+ Person Households | 0 (0.0%) | 0 (0.0%) |
| Total | 1,514 (62.6%) | 905 (37.4%) |
Female Fertility in Cortez
Fertility by Age in Cortez
Average fertility rate in Cortez is 125.0 births per 1,000 women. Women in the age bracket of 35 to 50 years have the highest fertility rate with 245.0 births per 1,000 women. Women in the age bracket of 35 to 50 years acount for 95.8% of all women with births.
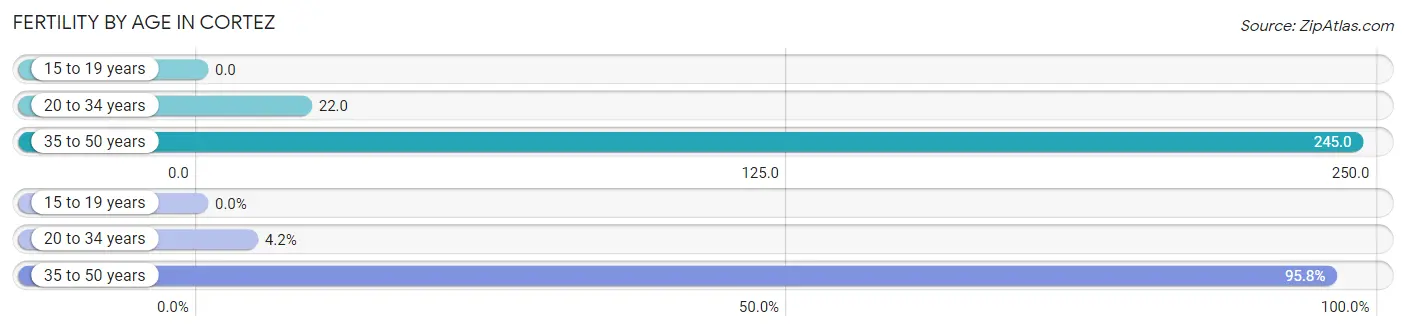
| Age Bracket | Women with Births | Births / 1,000 Women |
| 15 to 19 years | 0 (0.0%) | 0.0 |
| 20 to 34 years | 3 (4.2%) | 22.0 |
| 35 to 50 years | 68 (95.8%) | 245.0 |
| Total | 71 (100.0%) | 125.0 |
Fertility by Age by Marriage Status in Cortez
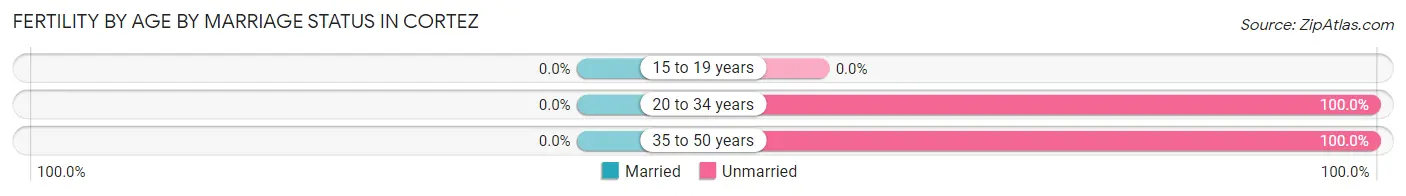
| Age Bracket | Married | Unmarried |
| 15 to 19 years | 0 (0.0%) | 0 (0.0%) |
| 20 to 34 years | 0 (0.0%) | 3 (100.0%) |
| 35 to 50 years | 0 (0.0%) | 68 (100.0%) |
| Total | 0 (0.0%) | 71 (100.0%) |
Fertility by Education in Cortez
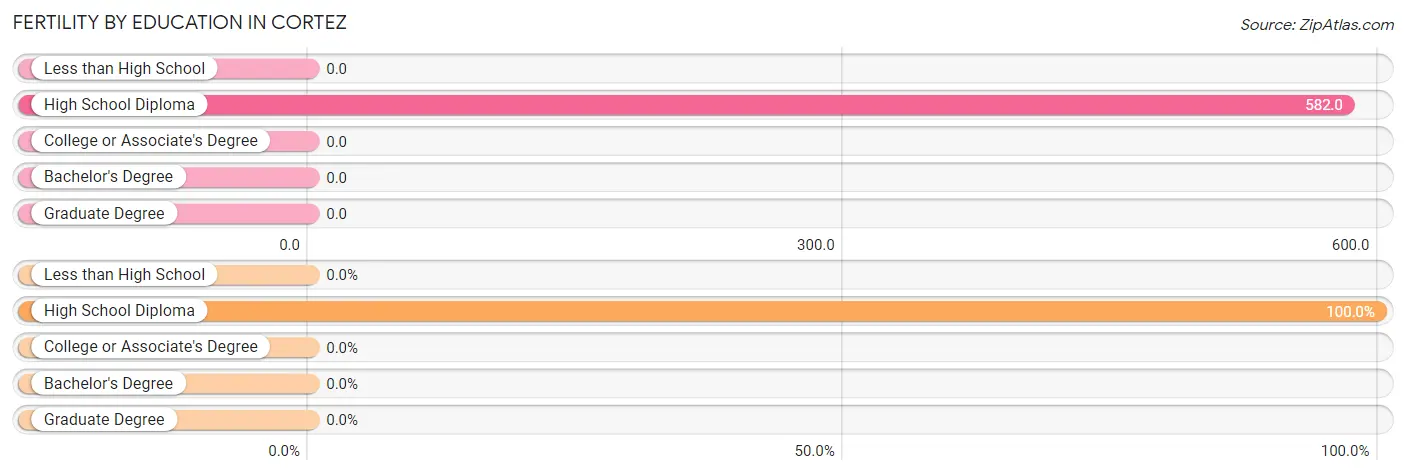
| Educational Attainment | Women with Births | Births / 1,000 Women |
| Less than High School | 0 (0.0%) | 0.0 |
| High School Diploma | 71 (100.0%) | 582.0 |
| College or Associate's Degree | 0 (0.0%) | 0.0 |
| Bachelor's Degree | 0 (0.0%) | 0.0 |
| Graduate Degree | 0 (0.0%) | 0.0 |
| Total | 71 (100.0%) | 125.0 |
Fertility by Education by Marriage Status in Cortez
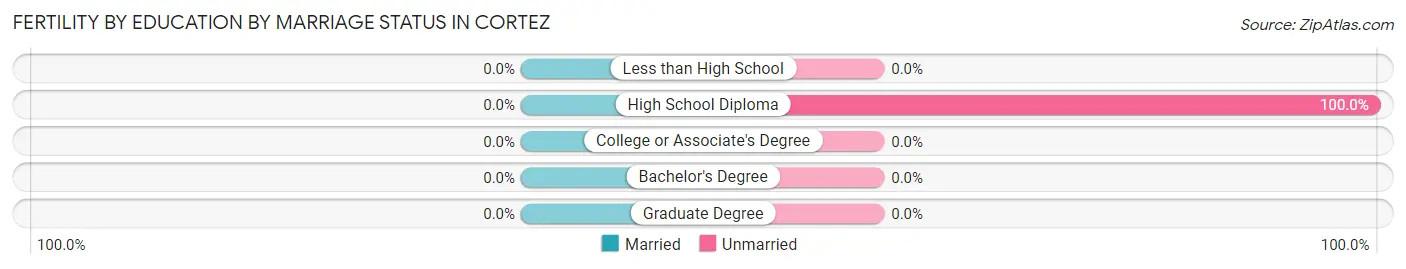
| Educational Attainment | Married | Unmarried |
| Less than High School | 0 (0.0%) | 0 (0.0%) |
| High School Diploma | 0 (0.0%) | 71 (100.0%) |
| College or Associate's Degree | 0 (0.0%) | 0 (0.0%) |
| Bachelor's Degree | 0 (0.0%) | 0 (0.0%) |
| Graduate Degree | 0 (0.0%) | 0 (0.0%) |
| Total | 0 (0.0%) | 71 (100.0%) |
Employment Characteristics in Cortez
Employment by Class of Employer in Cortez
Among the 1,637 employed individuals in Cortez, private company employees (1,033 | 63.1%), self-employed (incorporated) (222 | 13.6%), and self-employed (not incorporated) (201 | 12.3%) make up the most common classes of employment.
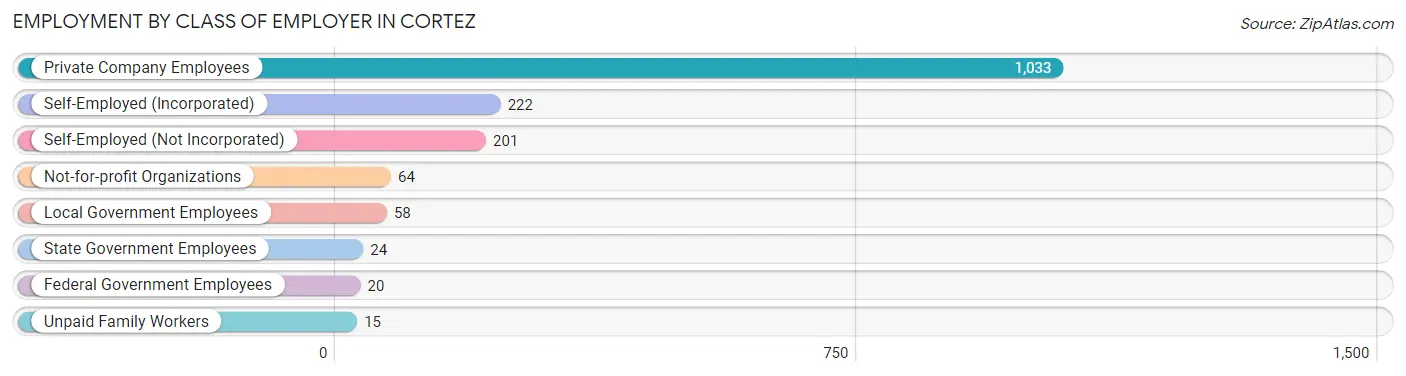
| Employer Class | # Employees | % Employees |
| Private Company Employees | 1,033 | 63.1% |
| Self-Employed (Incorporated) | 222 | 13.6% |
| Self-Employed (Not Incorporated) | 201 | 12.3% |
| Not-for-profit Organizations | 64 | 3.9% |
| Local Government Employees | 58 | 3.5% |
| State Government Employees | 24 | 1.5% |
| Federal Government Employees | 20 | 1.2% |
| Unpaid Family Workers | 15 | 0.9% |
| Total | 1,637 | 100.0% |
Employment Status by Age in Cortez
According to the labor force statistics for Cortez, out of the total population over 16 years of age (4,688), 39.7% or 1,861 individuals are in the labor force, with 10.6% or 197 of them unemployed. The age group with the highest labor force participation rate is 30 to 34 years, with 97.8% or 133 individuals in the labor force. Within the labor force, the 16 to 19 years age range has the highest percentage of unemployed individuals, with 100.0% or 160 of them being unemployed.
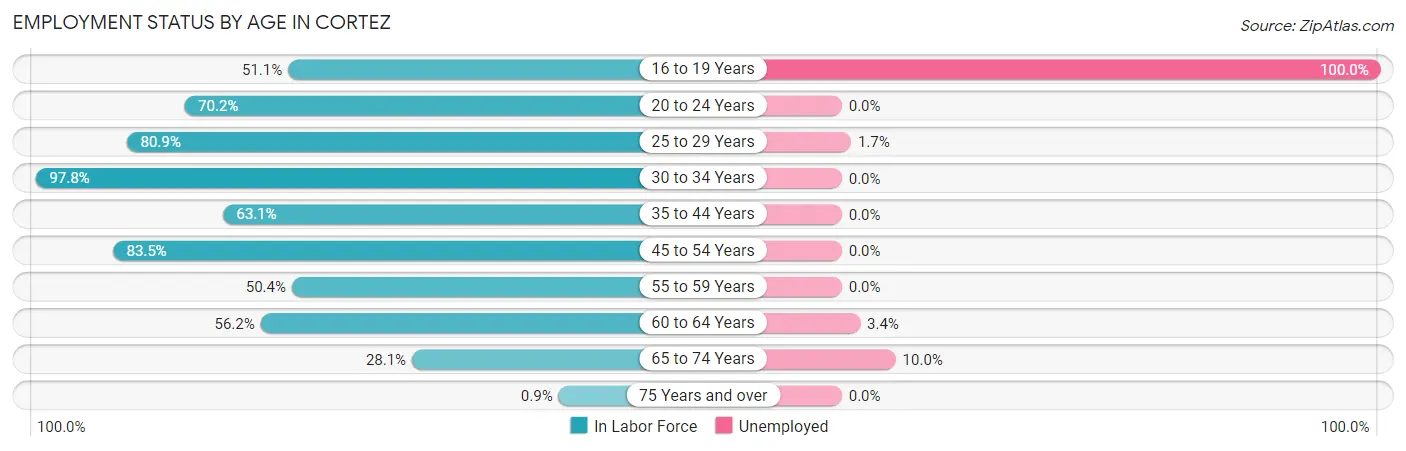
| Age Bracket | In Labor Force | Unemployed |
| 16 to 19 Years | 160 (51.1%) | 160 (100.0%) |
| 20 to 24 Years | 33 (70.2%) | 0 (0.0%) |
| 25 to 29 Years | 127 (80.9%) | 2 (1.7%) |
| 30 to 34 Years | 133 (97.8%) | 0 (0.0%) |
| 35 to 44 Years | 207 (63.1%) | 0 (0.0%) |
| 45 to 54 Years | 391 (83.5%) | 0 (0.0%) |
| 55 to 59 Years | 206 (50.4%) | 0 (0.0%) |
| 60 to 64 Years | 293 (56.2%) | 10 (3.4%) |
| 65 to 74 Years | 301 (28.1%) | 30 (10.0%) |
| 75 Years and over | 11 (0.9%) | 0 (0.0%) |
| Total | 1,861 (39.7%) | 197 (10.6%) |
Employment Status by Educational Attainment in Cortez
According to labor force statistics for Cortez, 67.2% of individuals (1,357) out of the total population between 25 and 64 years of age (2,019) are in the labor force, with 0.9% or 12 of them being unemployed. The group with the highest labor force participation rate are those with the educational attainment of high school diploma, with 71.3% or 343 individuals in the labor force. Within the labor force, individuals with college / associate degree education have the highest percentage of unemployment, with 2.4% or 12 of them being unemployed.
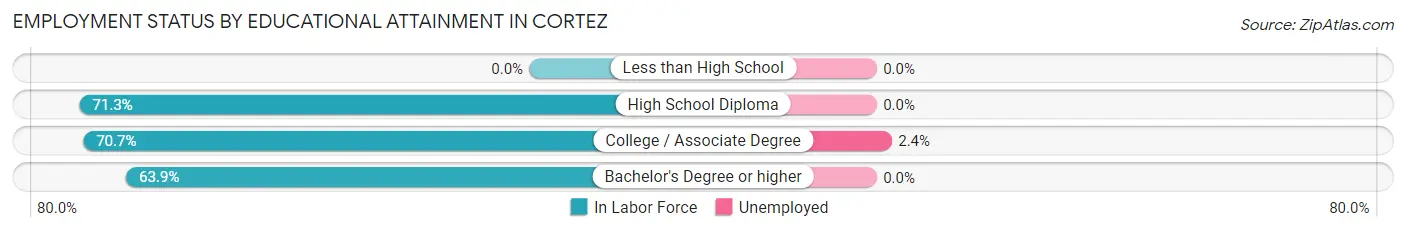
| Educational Attainment | In Labor Force | Unemployed |
| Less than High School | 0 (0.0%) | 0 (0.0%) |
| High School Diploma | 343 (71.3%) | 0 (0.0%) |
| College / Associate Degree | 511 (70.7%) | 17 (2.4%) |
| Bachelor's Degree or higher | 503 (63.9%) | 0 (0.0%) |
| Total | 1,357 (67.2%) | 18 (0.9%) |
Employment Occupations by Sex in Cortez
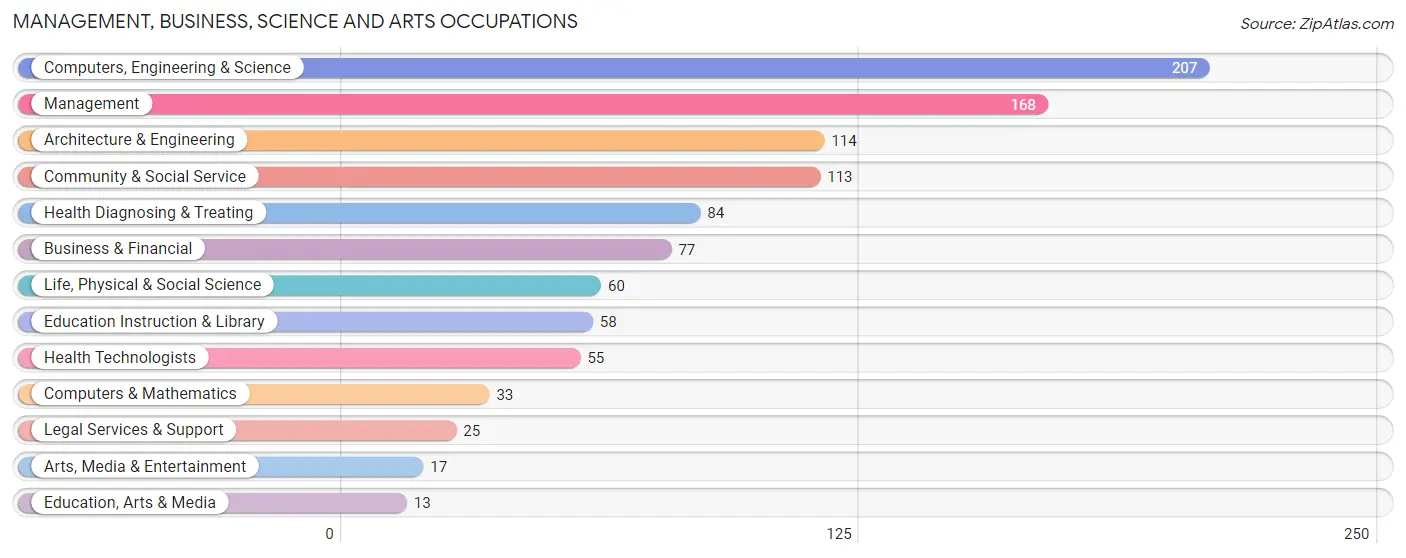
Management, Business, Science and Arts Occupations
The most common Management, Business, Science and Arts occupations in Cortez are Computers, Engineering & Science (207 | 12.6%), Management (168 | 10.2%), Architecture & Engineering (114 | 6.9%), Community & Social Service (113 | 6.9%), and Health Diagnosing & Treating (84 | 5.1%).
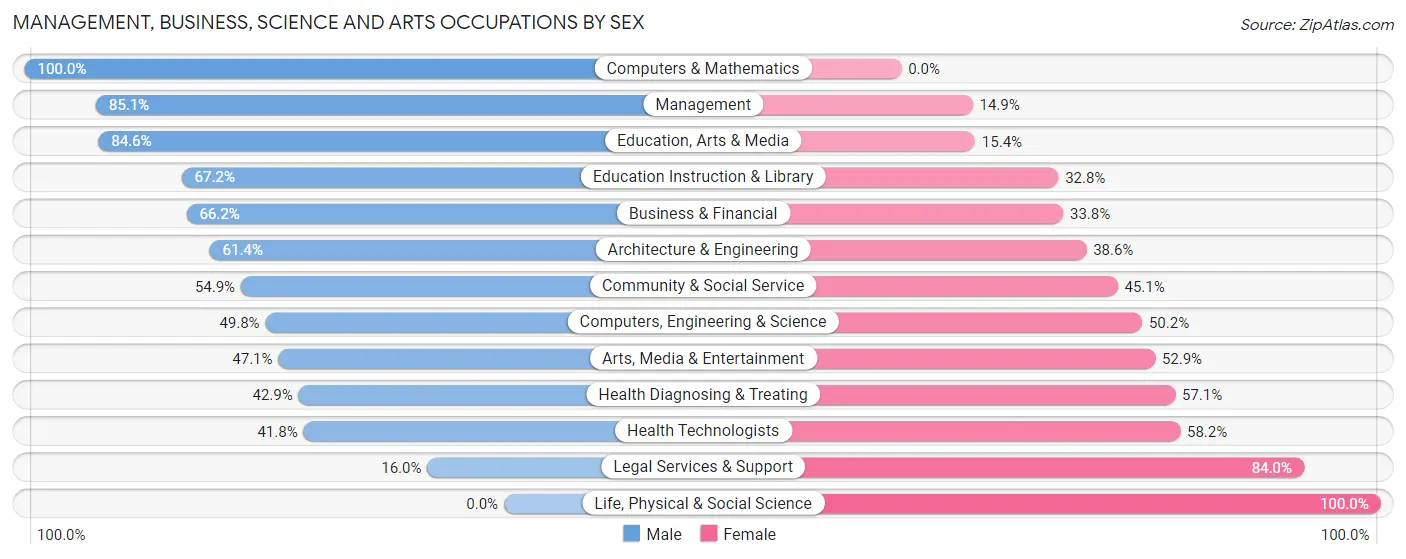
Management, Business, Science and Arts Occupations by Sex
Within the Management, Business, Science and Arts occupations in Cortez, the most male-oriented occupations are Computers & Mathematics (100.0%), Management (85.1%), and Education, Arts & Media (84.6%), while the most female-oriented occupations are Life, Physical & Social Science (100.0%), Legal Services & Support (84.0%), and Health Technologists (58.2%).
| Occupation | Male | Female |
| Management | 143 (85.1%) | 25 (14.9%) |
| Business & Financial | 51 (66.2%) | 26 (33.8%) |
| Computers, Engineering & Science | 103 (49.8%) | 104 (50.2%) |
| Computers & Mathematics | 33 (100.0%) | 0 (0.0%) |
| Architecture & Engineering | 70 (61.4%) | 44 (38.6%) |
| Life, Physical & Social Science | 0 (0.0%) | 60 (100.0%) |
| Community & Social Service | 62 (54.9%) | 51 (45.1%) |
| Education, Arts & Media | 11 (84.6%) | 2 (15.4%) |
| Legal Services & Support | 4 (16.0%) | 21 (84.0%) |
| Education Instruction & Library | 39 (67.2%) | 19 (32.8%) |
| Arts, Media & Entertainment | 8 (47.1%) | 9 (52.9%) |
| Health Diagnosing & Treating | 36 (42.9%) | 48 (57.1%) |
| Health Technologists | 23 (41.8%) | 32 (58.2%) |
| Total (Category) | 395 (60.9%) | 254 (39.1%) |
| Total (Overall) | 1,059 (64.3%) | 589 (35.7%) |
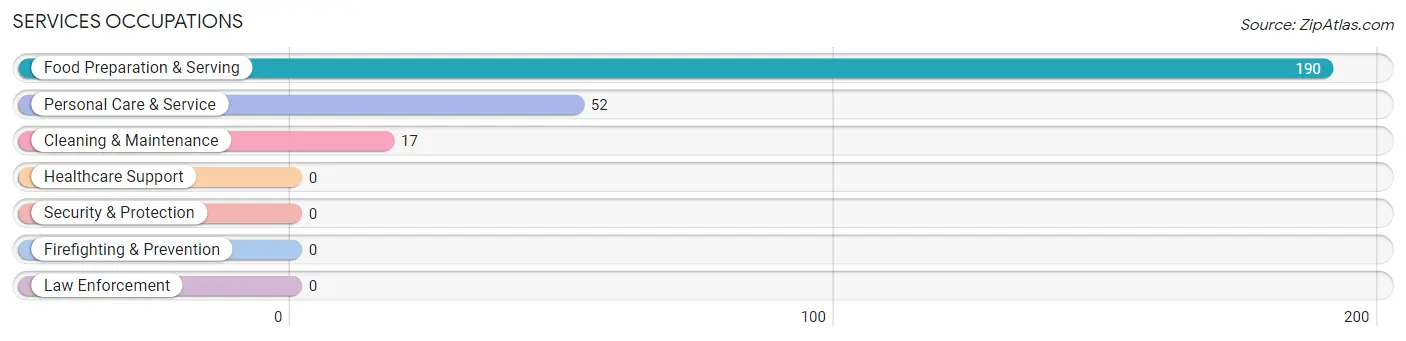
Services Occupations
The most common Services occupations in Cortez are Food Preparation & Serving (190 | 11.5%), Personal Care & Service (52 | 3.2%), and Cleaning & Maintenance (17 | 1.0%).
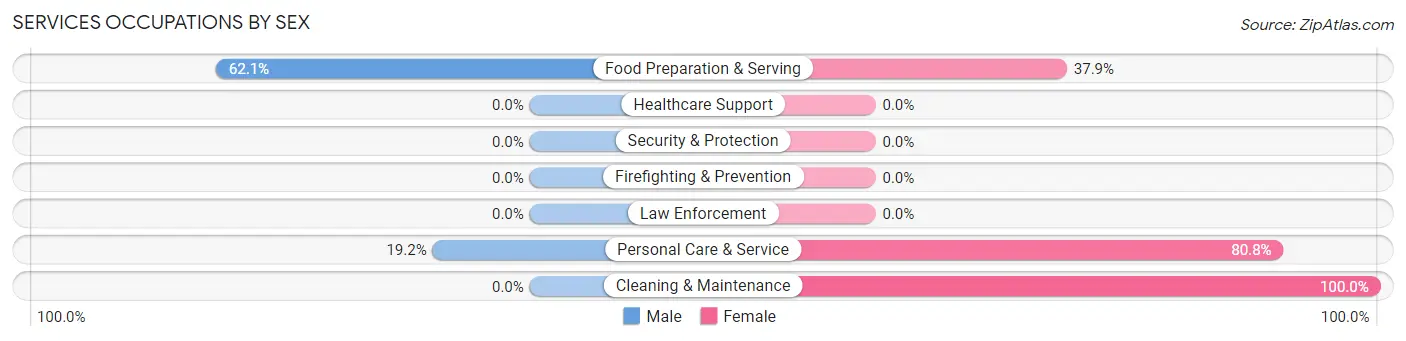
Services Occupations by Sex
Within the Services occupations in Cortez, the most male-oriented occupations are Food Preparation & Serving (62.1%), and Personal Care & Service (19.2%), while the most female-oriented occupations are Cleaning & Maintenance (100.0%), Personal Care & Service (80.8%), and Food Preparation & Serving (37.9%).
| Occupation | Male | Female |
| Healthcare Support | 0 (0.0%) | 0 (0.0%) |
| Security & Protection | 0 (0.0%) | 0 (0.0%) |
| Firefighting & Prevention | 0 (0.0%) | 0 (0.0%) |
| Law Enforcement | 0 (0.0%) | 0 (0.0%) |
| Food Preparation & Serving | 118 (62.1%) | 72 (37.9%) |
| Cleaning & Maintenance | 0 (0.0%) | 17 (100.0%) |
| Personal Care & Service | 10 (19.2%) | 42 (80.8%) |
| Total (Category) | 128 (49.4%) | 131 (50.6%) |
| Total (Overall) | 1,059 (64.3%) | 589 (35.7%) |
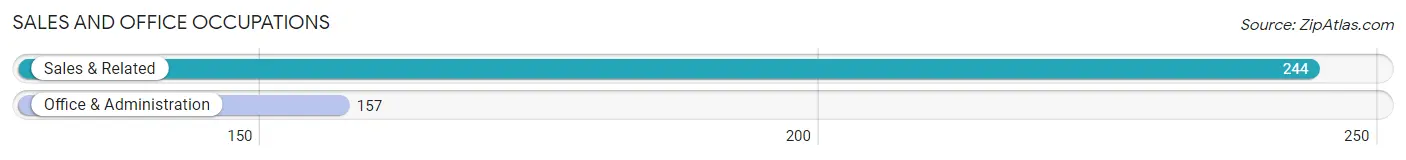
Sales and Office Occupations
The most common Sales and Office occupations in Cortez are Sales & Related (244 | 14.8%), and Office & Administration (157 | 9.5%).
Sales and Office Occupations by Sex
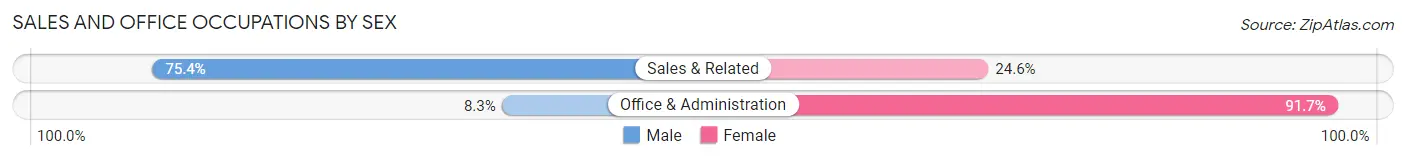
| Occupation | Male | Female |
| Sales & Related | 184 (75.4%) | 60 (24.6%) |
| Office & Administration | 13 (8.3%) | 144 (91.7%) |
| Total (Category) | 197 (49.1%) | 204 (50.9%) |
| Total (Overall) | 1,059 (64.3%) | 589 (35.7%) |
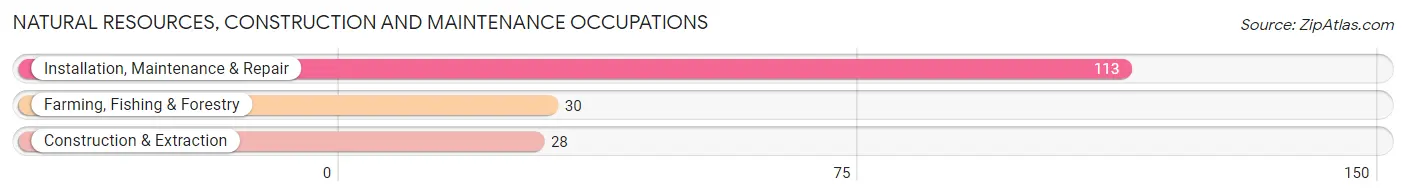
Natural Resources, Construction and Maintenance Occupations
The most common Natural Resources, Construction and Maintenance occupations in Cortez are Installation, Maintenance & Repair (113 | 6.9%), Farming, Fishing & Forestry (30 | 1.8%), and Construction & Extraction (28 | 1.7%).
Natural Resources, Construction and Maintenance Occupations by Sex
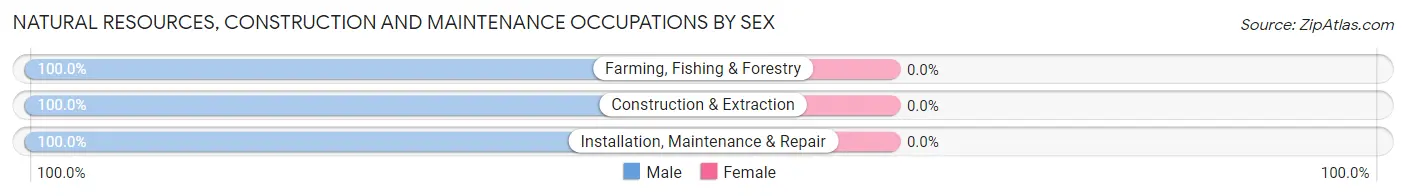
| Occupation | Male | Female |
| Farming, Fishing & Forestry | 30 (100.0%) | 0 (0.0%) |
| Construction & Extraction | 28 (100.0%) | 0 (0.0%) |
| Installation, Maintenance & Repair | 113 (100.0%) | 0 (0.0%) |
| Total (Category) | 171 (100.0%) | 0 (0.0%) |
| Total (Overall) | 1,059 (64.3%) | 589 (35.7%) |
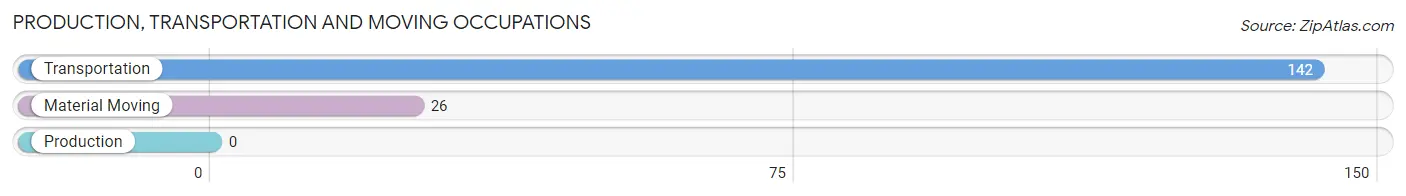
Production, Transportation and Moving Occupations
The most common Production, Transportation and Moving occupations in Cortez are Transportation (142 | 8.6%), and Material Moving (26 | 1.6%).
Production, Transportation and Moving Occupations by Sex
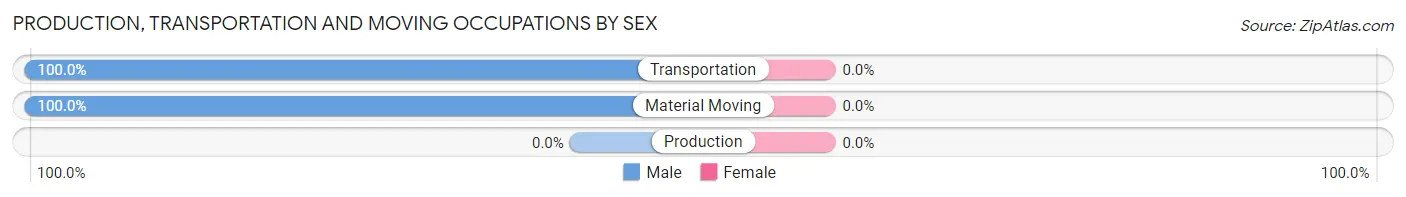
| Occupation | Male | Female |
| Production | 0 (0.0%) | 0 (0.0%) |
| Transportation | 142 (100.0%) | 0 (0.0%) |
| Material Moving | 26 (100.0%) | 0 (0.0%) |
| Total (Category) | 168 (100.0%) | 0 (0.0%) |
| Total (Overall) | 1,059 (64.3%) | 589 (35.7%) |
Employment Industries by Sex in Cortez
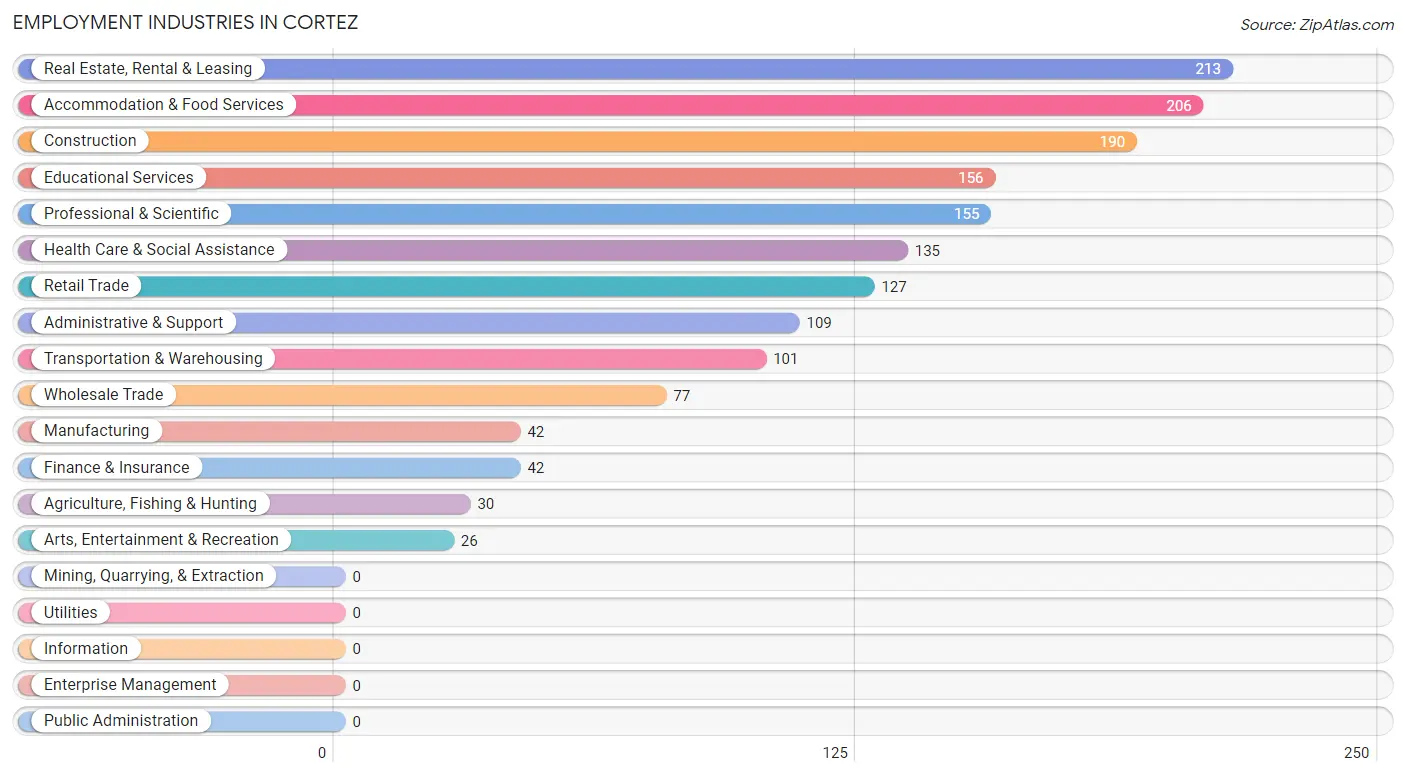
Employment Industries in Cortez
The major employment industries in Cortez include Real Estate, Rental & Leasing (213 | 12.9%), Accommodation & Food Services (206 | 12.5%), Construction (190 | 11.5%), Educational Services (156 | 9.5%), and Professional & Scientific (155 | 9.4%).
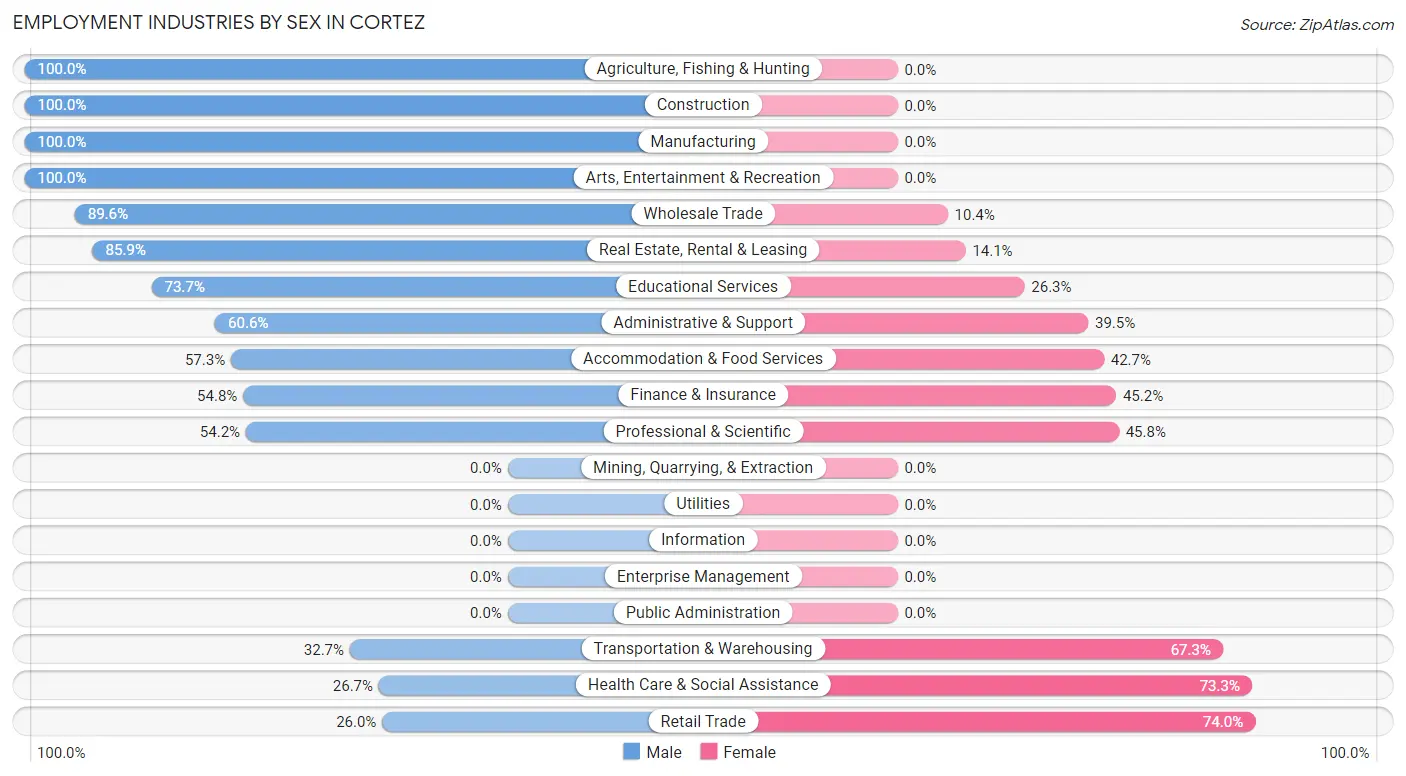
Employment Industries by Sex in Cortez
The Cortez industries that see more men than women are Agriculture, Fishing & Hunting (100.0%), Construction (100.0%), and Manufacturing (100.0%), whereas the industries that tend to have a higher number of women are Retail Trade (74.0%), Health Care & Social Assistance (73.3%), and Transportation & Warehousing (67.3%).
| Industry | Male | Female |
| Agriculture, Fishing & Hunting | 30 (100.0%) | 0 (0.0%) |
| Mining, Quarrying, & Extraction | 0 (0.0%) | 0 (0.0%) |
| Construction | 190 (100.0%) | 0 (0.0%) |
| Manufacturing | 42 (100.0%) | 0 (0.0%) |
| Wholesale Trade | 69 (89.6%) | 8 (10.4%) |
| Retail Trade | 33 (26.0%) | 94 (74.0%) |
| Transportation & Warehousing | 33 (32.7%) | 68 (67.3%) |
| Utilities | 0 (0.0%) | 0 (0.0%) |
| Information | 0 (0.0%) | 0 (0.0%) |
| Finance & Insurance | 23 (54.8%) | 19 (45.2%) |
| Real Estate, Rental & Leasing | 183 (85.9%) | 30 (14.1%) |
| Professional & Scientific | 84 (54.2%) | 71 (45.8%) |
| Enterprise Management | 0 (0.0%) | 0 (0.0%) |
| Administrative & Support | 66 (60.6%) | 43 (39.5%) |
| Educational Services | 115 (73.7%) | 41 (26.3%) |
| Health Care & Social Assistance | 36 (26.7%) | 99 (73.3%) |
| Arts, Entertainment & Recreation | 26 (100.0%) | 0 (0.0%) |
| Accommodation & Food Services | 118 (57.3%) | 88 (42.7%) |
| Public Administration | 0 (0.0%) | 0 (0.0%) |
| Total | 1,059 (64.3%) | 589 (35.7%) |
Education in Cortez
School Enrollment in Cortez
The most common levels of schooling among the 449 students in Cortez are college / undergraduate (300 | 66.8%), middle school (71 | 15.8%), and graduate / professional (36 | 8.0%).
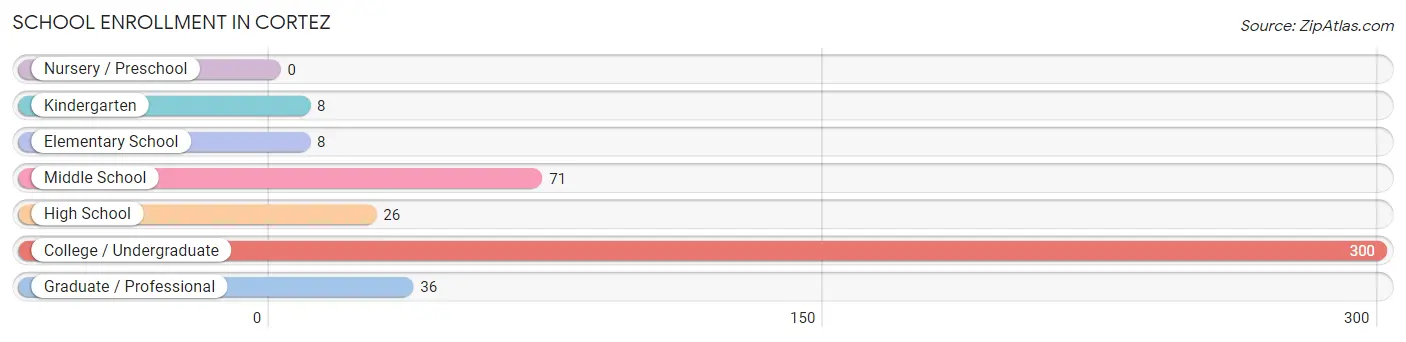
| School Level | # Students | % Students |
| Nursery / Preschool | 0 | 0.0% |
| Kindergarten | 8 | 1.8% |
| Elementary School | 8 | 1.8% |
| Middle School | 71 | 15.8% |
| High School | 26 | 5.8% |
| College / Undergraduate | 300 | 66.8% |
| Graduate / Professional | 36 | 8.0% |
| Total | 449 | 100.0% |
School Enrollment by Age by Funding Source in Cortez
Out of a total of 449 students who are enrolled in schools in Cortez, 136 (30.3%) attend a private institution, while the remaining 313 (69.7%) are enrolled in public schools. The age group of 10 to 14 year olds has the highest likelihood of being enrolled in private schools, with 71 (100.0% in the age bracket) enrolled. Conversely, the age group of 5 to 9 year old has the lowest likelihood of being enrolled in a private school, with 16 (100.0% in the age bracket) attending a public institution.
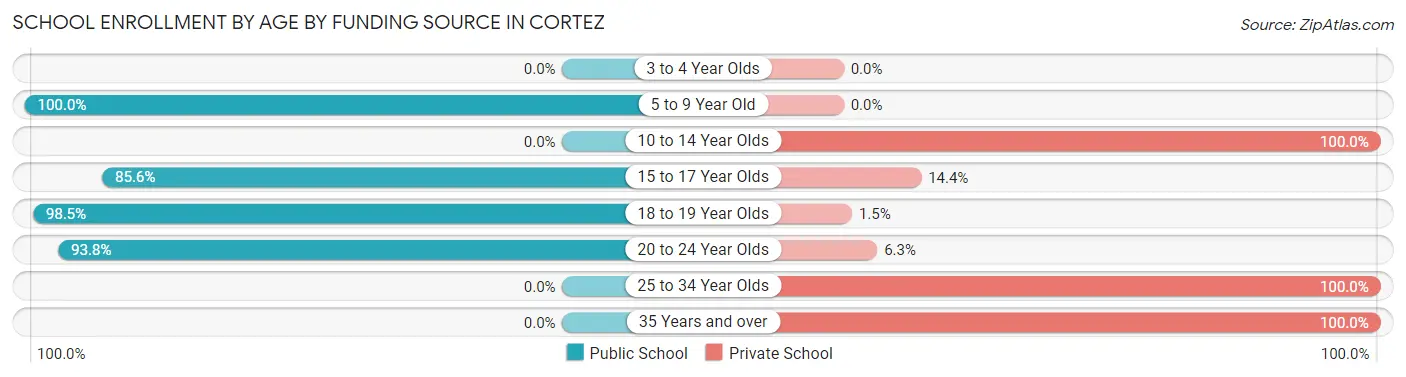
| Age Bracket | Public School | Private School |
| 3 to 4 Year Olds | 0 (0.0%) | 0 (0.0%) |
| 5 to 9 Year Old | 16 (100.0%) | 0 (0.0%) |
| 10 to 14 Year Olds | 0 (0.0%) | 71 (100.0%) |
| 15 to 17 Year Olds | 154 (85.6%) | 26 (14.4%) |
| 18 to 19 Year Olds | 128 (98.5%) | 2 (1.5%) |
| 20 to 24 Year Olds | 15 (93.8%) | 1 (6.2%) |
| 25 to 34 Year Olds | 0 (0.0%) | 4 (100.0%) |
| 35 Years and over | 0 (0.0%) | 32 (100.0%) |
| Total | 313 (69.7%) | 136 (30.3%) |
Educational Attainment by Field of Study in Cortez
Business (734 | 35.3%), science & technology (340 | 16.4%), education (333 | 16.0%), arts & humanities (131 | 6.3%), and physical & health sciences (98 | 4.7%) are the most common fields of study among 2,077 individuals in Cortez who have obtained a bachelor's degree or higher.
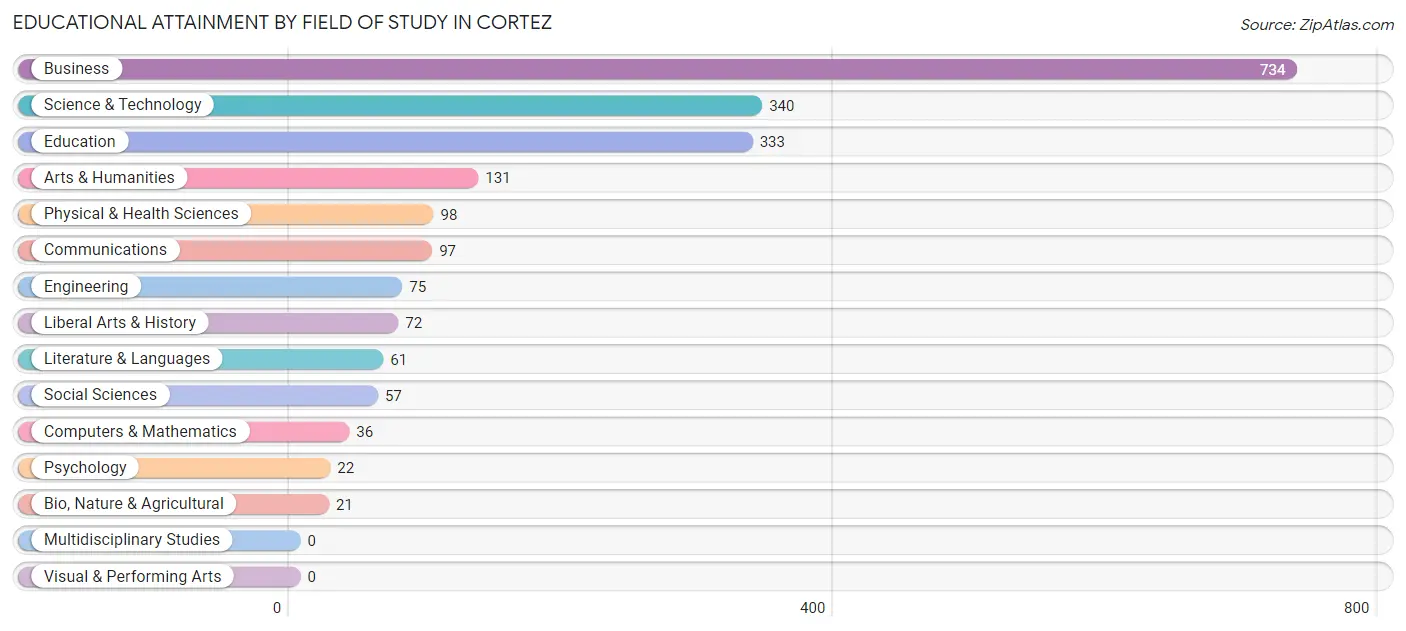
| Field of Study | # Graduates | % Graduates |
| Computers & Mathematics | 36 | 1.7% |
| Bio, Nature & Agricultural | 21 | 1.0% |
| Physical & Health Sciences | 98 | 4.7% |
| Psychology | 22 | 1.1% |
| Social Sciences | 57 | 2.7% |
| Engineering | 75 | 3.6% |
| Multidisciplinary Studies | 0 | 0.0% |
| Science & Technology | 340 | 16.4% |
| Business | 734 | 35.3% |
| Education | 333 | 16.0% |
| Literature & Languages | 61 | 2.9% |
| Liberal Arts & History | 72 | 3.5% |
| Visual & Performing Arts | 0 | 0.0% |
| Communications | 97 | 4.7% |
| Arts & Humanities | 131 | 6.3% |
| Total | 2,077 | 100.0% |
Transportation & Commute in Cortez
Vehicle Availability by Sex in Cortez
The most prevalent vehicle ownership categories in Cortez are males with 2 vehicles (541, accounting for 52.6%) and females with 2 vehicles (305, making up 92.8%).
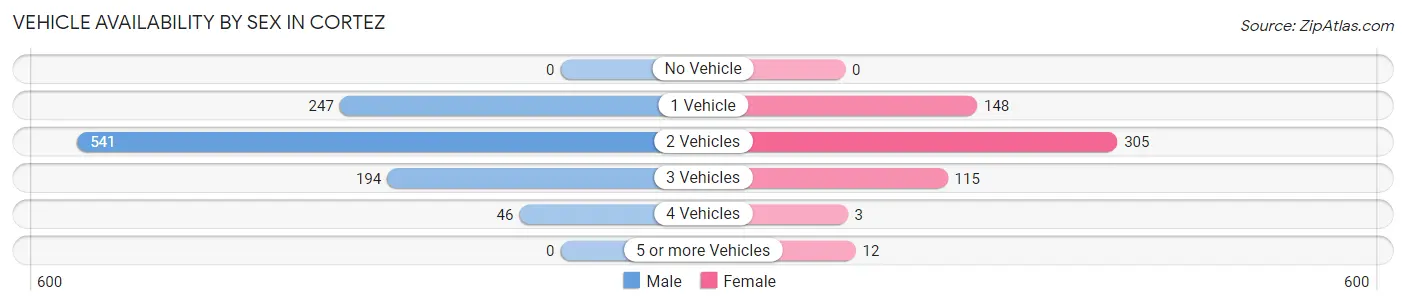
| Vehicles Available | Male | Female |
| No Vehicle | 0 (0.0%) | 0 (0.0%) |
| 1 Vehicle | 247 (24.0%) | 148 (25.4%) |
| 2 Vehicles | 541 (52.6%) | 305 (52.3%) |
| 3 Vehicles | 194 (18.9%) | 115 (19.7%) |
| 4 Vehicles | 46 (4.5%) | 3 (0.5%) |
| 5 or more Vehicles | 0 (0.0%) | 12 (2.1%) |
| Total | 1,028 (100.0%) | 583 (100.0%) |
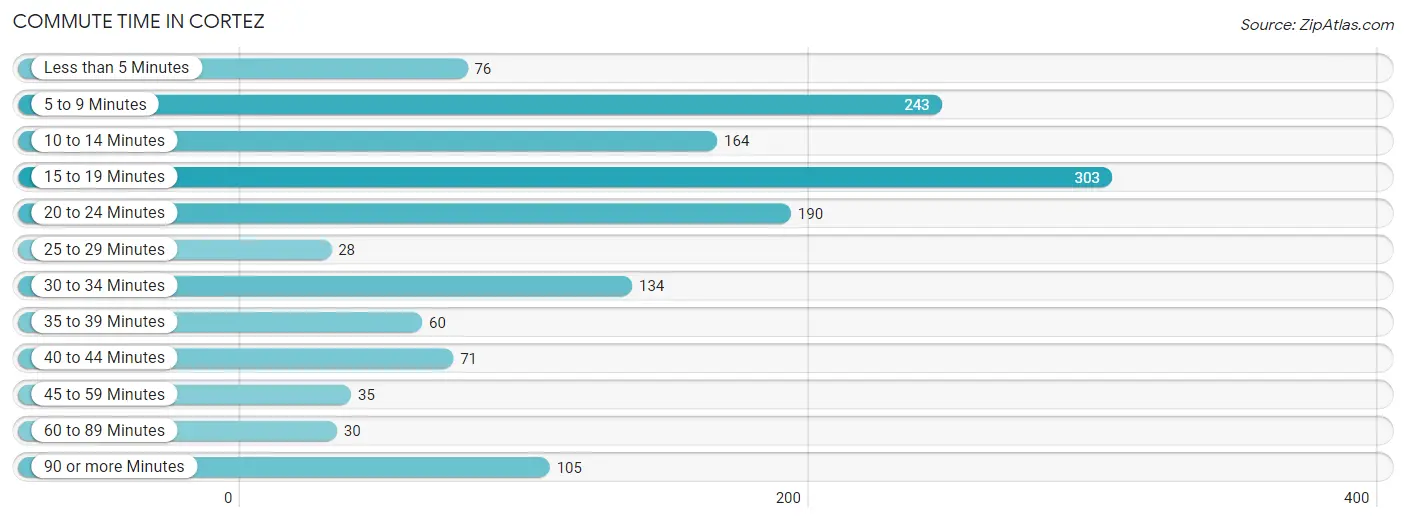
Commute Time in Cortez
The most frequently occuring commute durations in Cortez are 15 to 19 minutes (303 commuters, 21.1%), 5 to 9 minutes (243 commuters, 16.9%), and 20 to 24 minutes (190 commuters, 13.2%).
| Commute Time | # Commuters | % Commuters |
| Less than 5 Minutes | 76 | 5.3% |
| 5 to 9 Minutes | 243 | 16.9% |
| 10 to 14 Minutes | 164 | 11.4% |
| 15 to 19 Minutes | 303 | 21.1% |
| 20 to 24 Minutes | 190 | 13.2% |
| 25 to 29 Minutes | 28 | 1.9% |
| 30 to 34 Minutes | 134 | 9.3% |
| 35 to 39 Minutes | 60 | 4.2% |
| 40 to 44 Minutes | 71 | 4.9% |
| 45 to 59 Minutes | 35 | 2.4% |
| 60 to 89 Minutes | 30 | 2.1% |
| 90 or more Minutes | 105 | 7.3% |
Commute Time by Sex in Cortez
The most common commute times in Cortez are 15 to 19 minutes (169 commuters, 18.1%) for males and 5 to 9 minutes (158 commuters, 31.2%) for females.
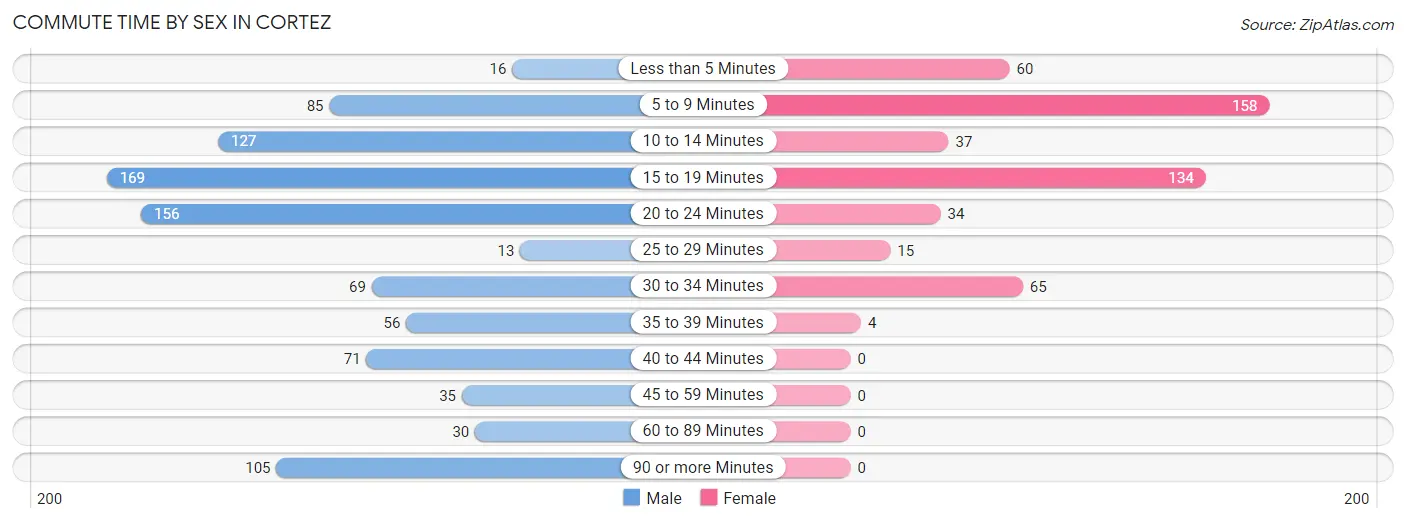
| Commute Time | Male | Female |
| Less than 5 Minutes | 16 (1.7%) | 60 (11.8%) |
| 5 to 9 Minutes | 85 (9.1%) | 158 (31.2%) |
| 10 to 14 Minutes | 127 (13.6%) | 37 (7.3%) |
| 15 to 19 Minutes | 169 (18.1%) | 134 (26.4%) |
| 20 to 24 Minutes | 156 (16.7%) | 34 (6.7%) |
| 25 to 29 Minutes | 13 (1.4%) | 15 (3.0%) |
| 30 to 34 Minutes | 69 (7.4%) | 65 (12.8%) |
| 35 to 39 Minutes | 56 (6.0%) | 4 (0.8%) |
| 40 to 44 Minutes | 71 (7.6%) | 0 (0.0%) |
| 45 to 59 Minutes | 35 (3.8%) | 0 (0.0%) |
| 60 to 89 Minutes | 30 (3.2%) | 0 (0.0%) |
| 90 or more Minutes | 105 (11.3%) | 0 (0.0%) |
Time of Departure to Work by Sex in Cortez
The most frequent times of departure to work in Cortez are 7:00 AM to 7:29 AM (165, 17.7%) for males and 12:00 PM to 3:59 PM (203, 40.0%) for females.
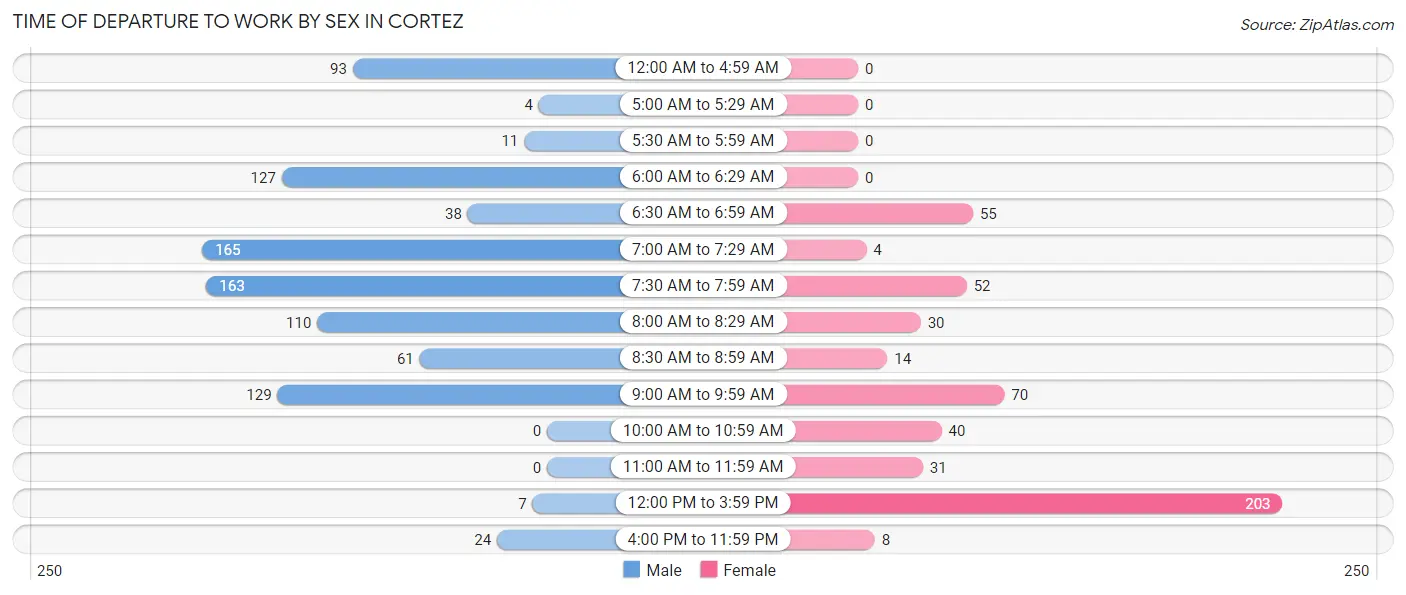
| Time of Departure | Male | Female |
| 12:00 AM to 4:59 AM | 93 (10.0%) | 0 (0.0%) |
| 5:00 AM to 5:29 AM | 4 (0.4%) | 0 (0.0%) |
| 5:30 AM to 5:59 AM | 11 (1.2%) | 0 (0.0%) |
| 6:00 AM to 6:29 AM | 127 (13.6%) | 0 (0.0%) |
| 6:30 AM to 6:59 AM | 38 (4.1%) | 55 (10.8%) |
| 7:00 AM to 7:29 AM | 165 (17.7%) | 4 (0.8%) |
| 7:30 AM to 7:59 AM | 163 (17.5%) | 52 (10.3%) |
| 8:00 AM to 8:29 AM | 110 (11.8%) | 30 (5.9%) |
| 8:30 AM to 8:59 AM | 61 (6.6%) | 14 (2.8%) |
| 9:00 AM to 9:59 AM | 129 (13.8%) | 70 (13.8%) |
| 10:00 AM to 10:59 AM | 0 (0.0%) | 40 (7.9%) |
| 11:00 AM to 11:59 AM | 0 (0.0%) | 31 (6.1%) |
| 12:00 PM to 3:59 PM | 7 (0.7%) | 203 (40.0%) |
| 4:00 PM to 11:59 PM | 24 (2.6%) | 8 (1.6%) |
| Total | 932 (100.0%) | 507 (100.0%) |
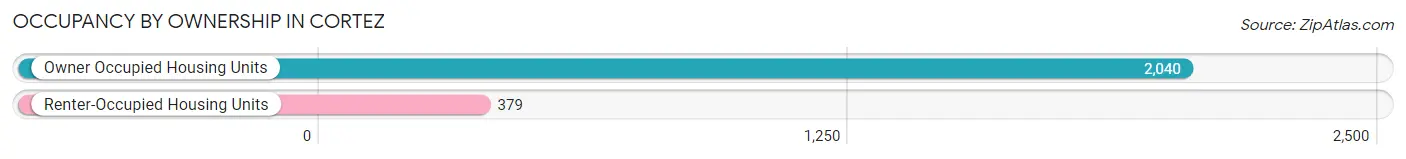
Housing Occupancy in Cortez
Occupancy by Ownership in Cortez
Of the total 2,419 dwellings in Cortez, owner-occupied units account for 2,040 (84.3%), while renter-occupied units make up 379 (15.7%).
| Occupancy | # Housing Units | % Housing Units |
| Owner Occupied Housing Units | 2,040 | 84.3% |
| Renter-Occupied Housing Units | 379 | 15.7% |
| Total Occupied Housing Units | 2,419 | 100.0% |
Occupancy by Household Size in Cortez
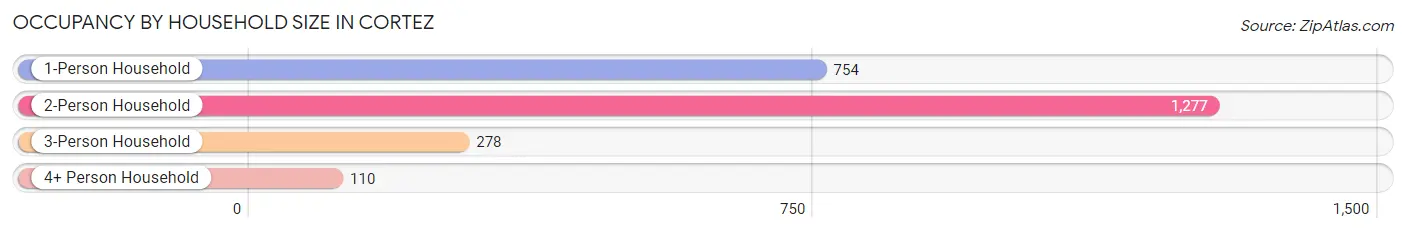
| Household Size | # Housing Units | % Housing Units |
| 1-Person Household | 754 | 31.2% |
| 2-Person Household | 1,277 | 52.8% |
| 3-Person Household | 278 | 11.5% |
| 4+ Person Household | 110 | 4.5% |
| Total Housing Units | 2,419 | 100.0% |
Occupancy by Ownership by Household Size in Cortez
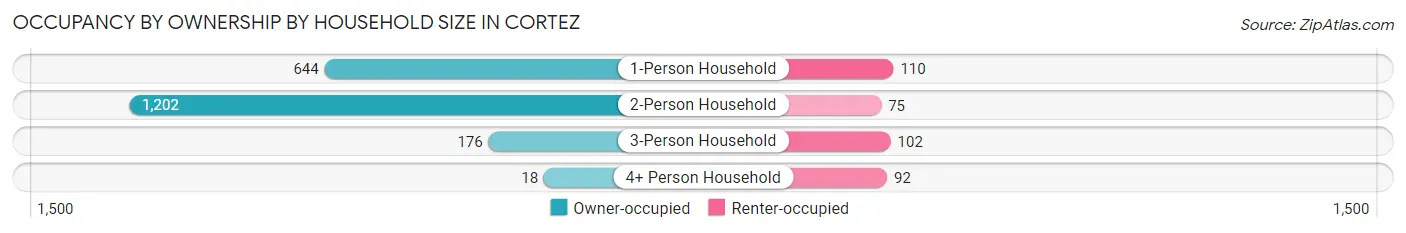
| Household Size | Owner-occupied | Renter-occupied |
| 1-Person Household | 644 (85.4%) | 110 (14.6%) |
| 2-Person Household | 1,202 (94.1%) | 75 (5.9%) |
| 3-Person Household | 176 (63.3%) | 102 (36.7%) |
| 4+ Person Household | 18 (16.4%) | 92 (83.6%) |
| Total Housing Units | 2,040 (84.3%) | 379 (15.7%) |
Occupancy by Educational Attainment in Cortez
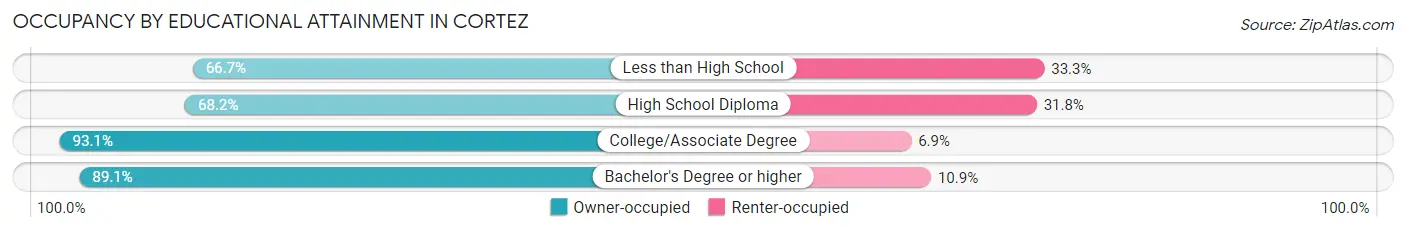
| Household Size | Owner-occupied | Renter-occupied |
| Less than High School | 54 (66.7%) | 27 (33.3%) |
| High School Diploma | 407 (68.2%) | 190 (31.8%) |
| College/Associate Degree | 644 (93.1%) | 48 (6.9%) |
| Bachelor's Degree or higher | 935 (89.1%) | 114 (10.9%) |
Occupancy by Age of Householder in Cortez
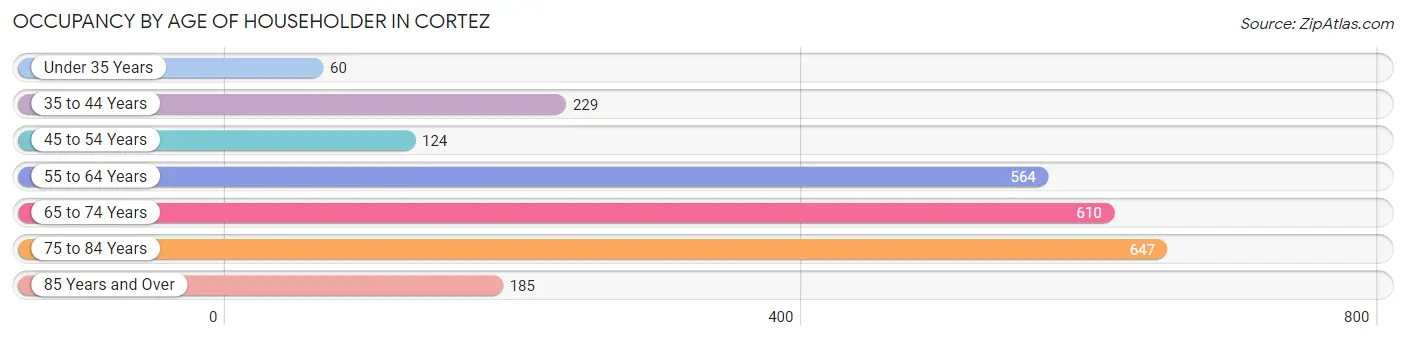
| Age Bracket | # Households | % Households |
| Under 35 Years | 60 | 2.5% |
| 35 to 44 Years | 229 | 9.5% |
| 45 to 54 Years | 124 | 5.1% |
| 55 to 64 Years | 564 | 23.3% |
| 65 to 74 Years | 610 | 25.2% |
| 75 to 84 Years | 647 | 26.8% |
| 85 Years and Over | 185 | 7.6% |
| Total | 2,419 | 100.0% |
Housing Finances in Cortez
Median Income by Occupancy in Cortez
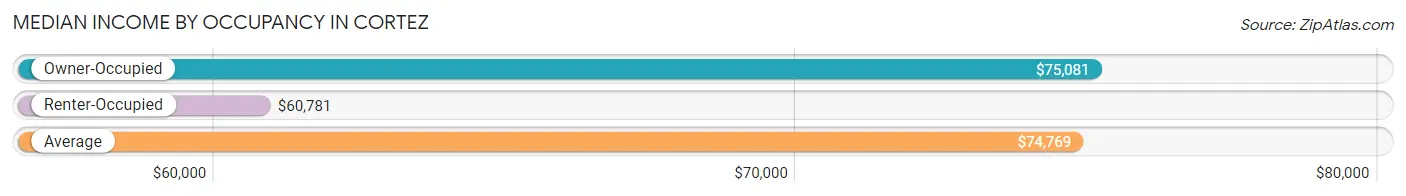
| Occupancy Type | # Households | Median Income |
| Owner-Occupied | 2,040 (84.3%) | $75,081 |
| Renter-Occupied | 379 (15.7%) | $60,781 |
| Average | 2,419 (100.0%) | $74,769 |
Occupancy by Householder Income Bracket in Cortez
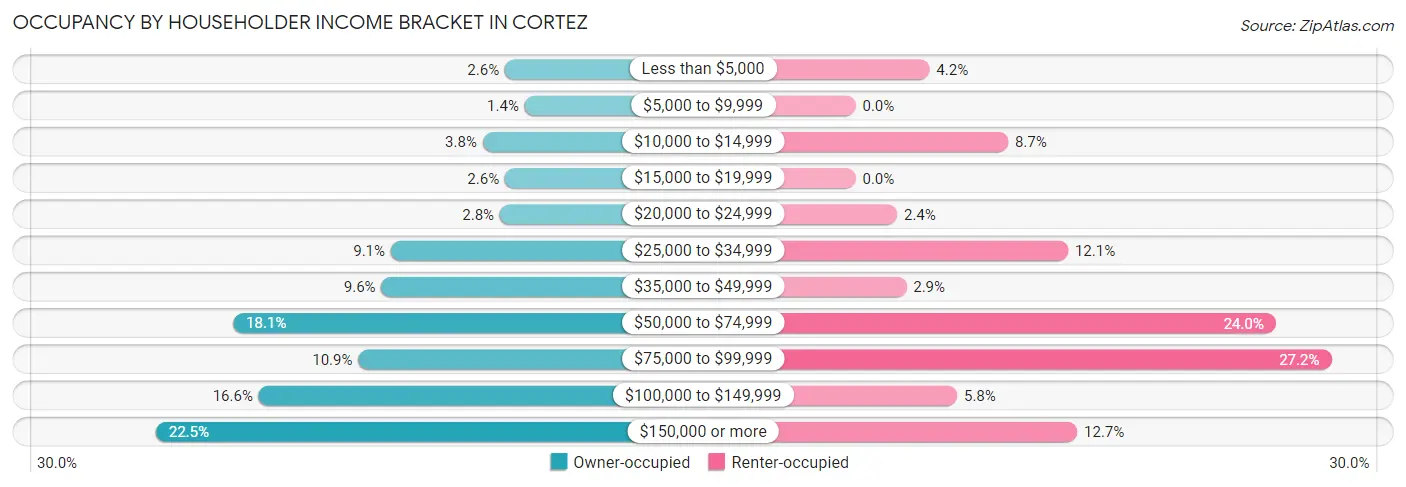
| Income Bracket | Owner-occupied | Renter-occupied |
| Less than $5,000 | 52 (2.5%) | 16 (4.2%) |
| $5,000 to $9,999 | 29 (1.4%) | 0 (0.0%) |
| $10,000 to $14,999 | 78 (3.8%) | 33 (8.7%) |
| $15,000 to $19,999 | 52 (2.5%) | 0 (0.0%) |
| $20,000 to $24,999 | 58 (2.8%) | 9 (2.4%) |
| $25,000 to $34,999 | 185 (9.1%) | 46 (12.1%) |
| $35,000 to $49,999 | 196 (9.6%) | 11 (2.9%) |
| $50,000 to $74,999 | 369 (18.1%) | 91 (24.0%) |
| $75,000 to $99,999 | 223 (10.9%) | 103 (27.2%) |
| $100,000 to $149,999 | 339 (16.6%) | 22 (5.8%) |
| $150,000 or more | 459 (22.5%) | 48 (12.7%) |
| Total | 2,040 (100.0%) | 379 (100.0%) |
Monthly Housing Cost Tiers in Cortez
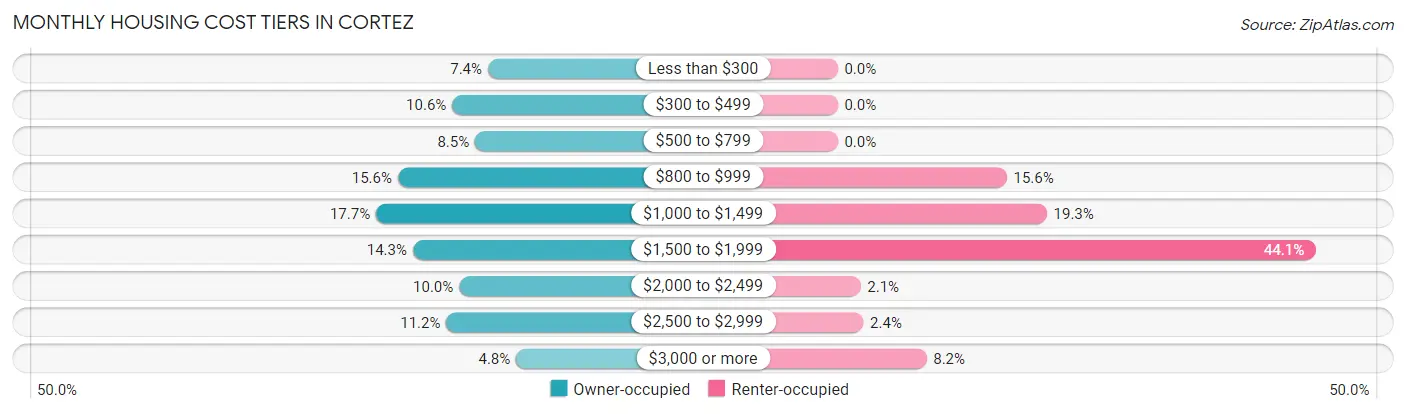
| Monthly Cost | Owner-occupied | Renter-occupied |
| Less than $300 | 150 (7.3%) | 0 (0.0%) |
| $300 to $499 | 217 (10.6%) | 0 (0.0%) |
| $500 to $799 | 174 (8.5%) | 0 (0.0%) |
| $800 to $999 | 319 (15.6%) | 59 (15.6%) |
| $1,000 to $1,499 | 360 (17.6%) | 73 (19.3%) |
| $1,500 to $1,999 | 291 (14.3%) | 167 (44.1%) |
| $2,000 to $2,499 | 204 (10.0%) | 8 (2.1%) |
| $2,500 to $2,999 | 228 (11.2%) | 9 (2.4%) |
| $3,000 or more | 97 (4.8%) | 31 (8.2%) |
| Total | 2,040 (100.0%) | 379 (100.0%) |
Physical Housing Characteristics in Cortez
Housing Structures in Cortez
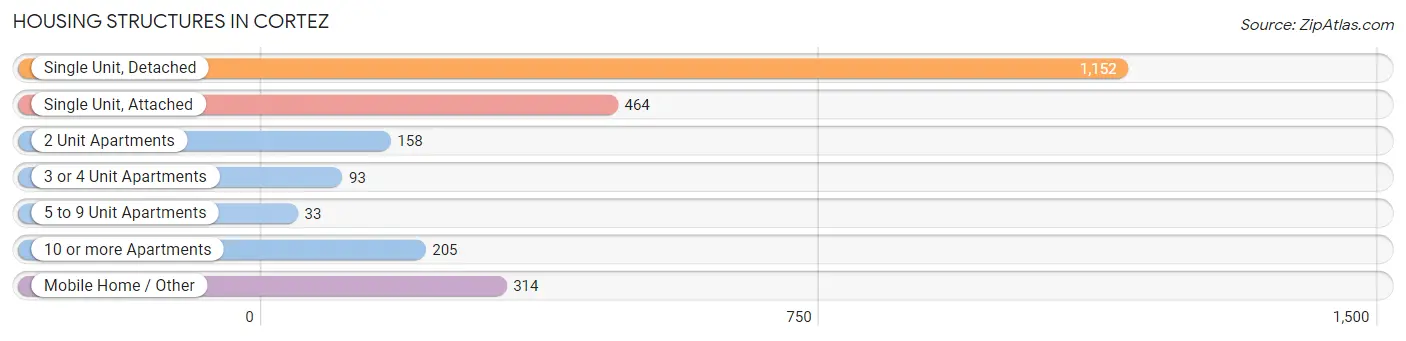
| Structure Type | # Housing Units | % Housing Units |
| Single Unit, Detached | 1,152 | 47.6% |
| Single Unit, Attached | 464 | 19.2% |
| 2 Unit Apartments | 158 | 6.5% |
| 3 or 4 Unit Apartments | 93 | 3.8% |
| 5 to 9 Unit Apartments | 33 | 1.4% |
| 10 or more Apartments | 205 | 8.5% |
| Mobile Home / Other | 314 | 13.0% |
| Total | 2,419 | 100.0% |
Housing Structures by Occupancy in Cortez
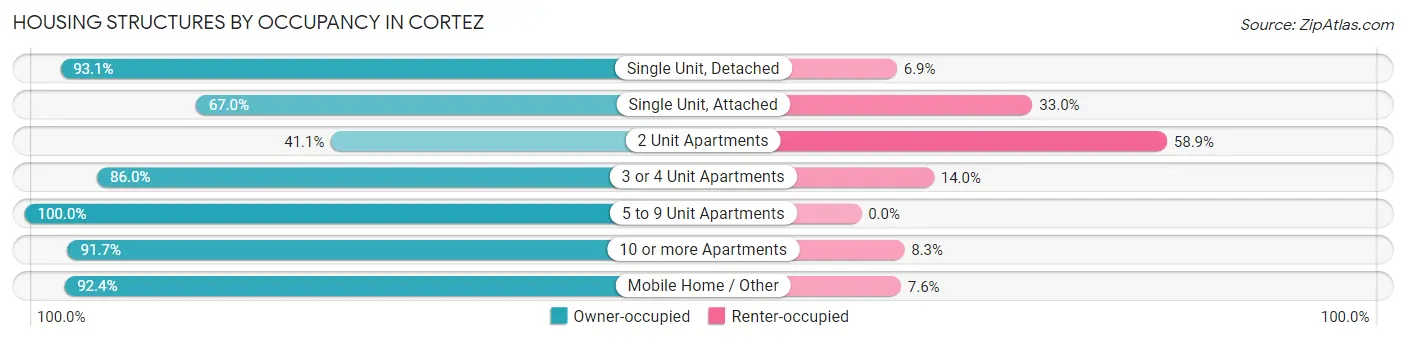
| Structure Type | Owner-occupied | Renter-occupied |
| Single Unit, Detached | 1,073 (93.1%) | 79 (6.9%) |
| Single Unit, Attached | 311 (67.0%) | 153 (33.0%) |
| 2 Unit Apartments | 65 (41.1%) | 93 (58.9%) |
| 3 or 4 Unit Apartments | 80 (86.0%) | 13 (14.0%) |
| 5 to 9 Unit Apartments | 33 (100.0%) | 0 (0.0%) |
| 10 or more Apartments | 188 (91.7%) | 17 (8.3%) |
| Mobile Home / Other | 290 (92.4%) | 24 (7.6%) |
| Total | 2,040 (84.3%) | 379 (15.7%) |
Housing Structures by Number of Rooms in Cortez
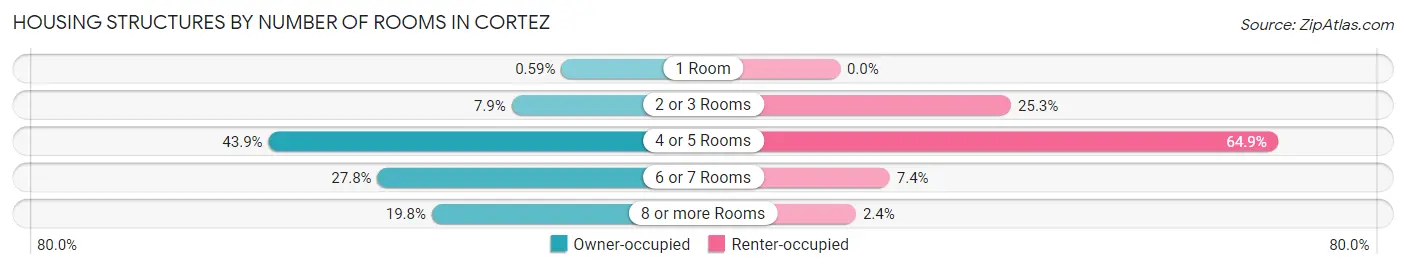
| Number of Rooms | Owner-occupied | Renter-occupied |
| 1 Room | 12 (0.6%) | 0 (0.0%) |
| 2 or 3 Rooms | 162 (7.9%) | 96 (25.3%) |
| 4 or 5 Rooms | 896 (43.9%) | 246 (64.9%) |
| 6 or 7 Rooms | 567 (27.8%) | 28 (7.4%) |
| 8 or more Rooms | 403 (19.8%) | 9 (2.4%) |
| Total | 2,040 (100.0%) | 379 (100.0%) |
Housing Structure by Heating Type in Cortez
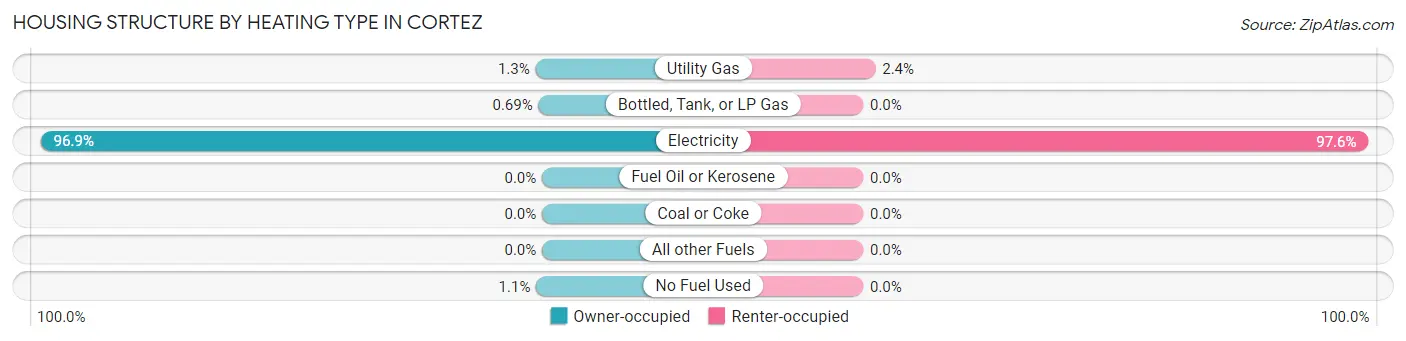
| Heating Type | Owner-occupied | Renter-occupied |
| Utility Gas | 26 (1.3%) | 9 (2.4%) |
| Bottled, Tank, or LP Gas | 14 (0.7%) | 0 (0.0%) |
| Electricity | 1,977 (96.9%) | 370 (97.6%) |
| Fuel Oil or Kerosene | 0 (0.0%) | 0 (0.0%) |
| Coal or Coke | 0 (0.0%) | 0 (0.0%) |
| All other Fuels | 0 (0.0%) | 0 (0.0%) |
| No Fuel Used | 23 (1.1%) | 0 (0.0%) |
| Total | 2,040 (100.0%) | 379 (100.0%) |
Household Vehicle Usage in Cortez
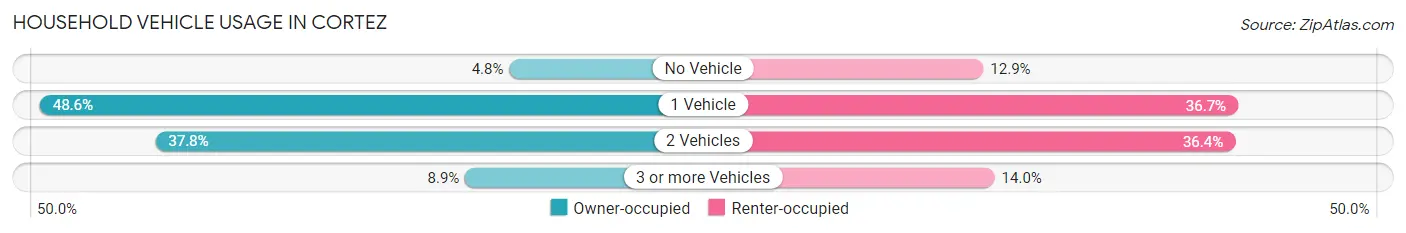
| Vehicles per Household | Owner-occupied | Renter-occupied |
| No Vehicle | 97 (4.8%) | 49 (12.9%) |
| 1 Vehicle | 991 (48.6%) | 139 (36.7%) |
| 2 Vehicles | 771 (37.8%) | 138 (36.4%) |
| 3 or more Vehicles | 181 (8.9%) | 53 (14.0%) |
| Total | 2,040 (100.0%) | 379 (100.0%) |
Real Estate & Mortgages in Cortez
Real Estate and Mortgage Overview in Cortez
| Characteristic | Without Mortgage | With Mortgage |
| Housing Units | 1,207 | 833 |
| Median Property Value | $319,300 | $444,400 |
| Median Household Income | $61,406 | $286 |
| Monthly Housing Costs | $849 | $97 |
| Real Estate Taxes | $2,393 | $0 |
Property Value by Mortgage Status in Cortez
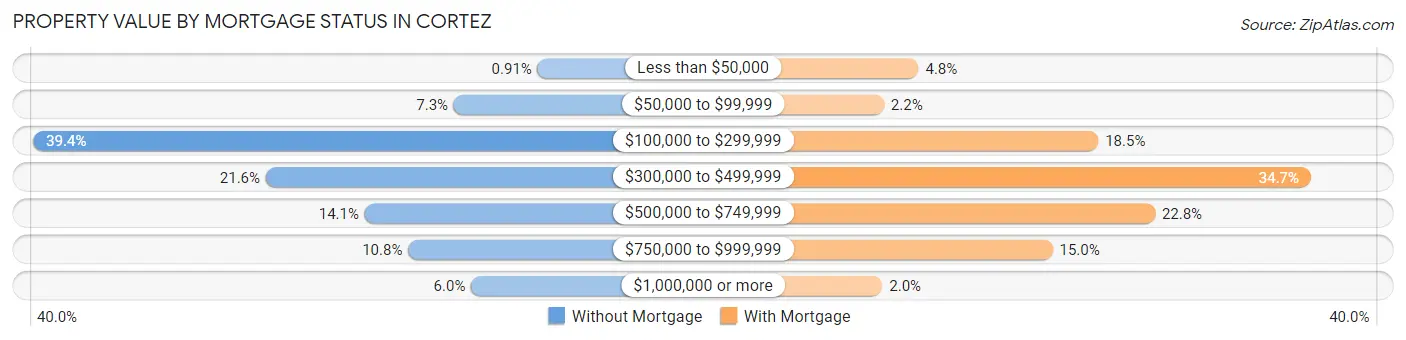
| Property Value | Without Mortgage | With Mortgage |
| Less than $50,000 | 11 (0.9%) | 40 (4.8%) |
| $50,000 to $99,999 | 88 (7.3%) | 18 (2.2%) |
| $100,000 to $299,999 | 475 (39.4%) | 154 (18.5%) |
| $300,000 to $499,999 | 261 (21.6%) | 289 (34.7%) |
| $500,000 to $749,999 | 170 (14.1%) | 190 (22.8%) |
| $750,000 to $999,999 | 130 (10.8%) | 125 (15.0%) |
| $1,000,000 or more | 72 (6.0%) | 17 (2.0%) |
| Total | 1,207 (100.0%) | 833 (100.0%) |
Household Income by Mortgage Status in Cortez
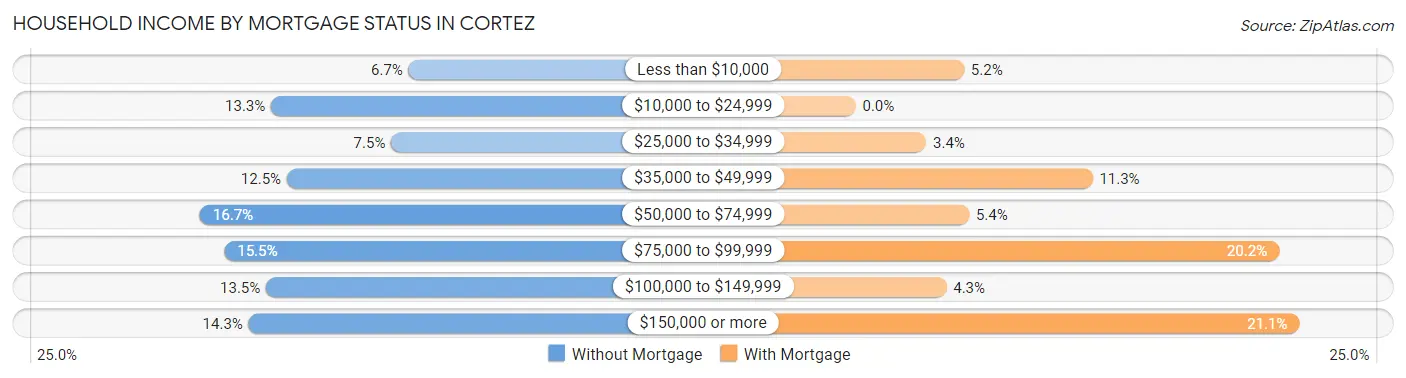
| Household Income | Without Mortgage | With Mortgage |
| Less than $10,000 | 81 (6.7%) | 43 (5.2%) |
| $10,000 to $24,999 | 160 (13.3%) | 0 (0.0%) |
| $25,000 to $34,999 | 91 (7.5%) | 28 (3.4%) |
| $35,000 to $49,999 | 151 (12.5%) | 94 (11.3%) |
| $50,000 to $74,999 | 201 (16.7%) | 45 (5.4%) |
| $75,000 to $99,999 | 187 (15.5%) | 168 (20.2%) |
| $100,000 to $149,999 | 163 (13.5%) | 36 (4.3%) |
| $150,000 or more | 173 (14.3%) | 176 (21.1%) |
| Total | 1,207 (100.0%) | 833 (100.0%) |
Property Value to Household Income Ratio in Cortez
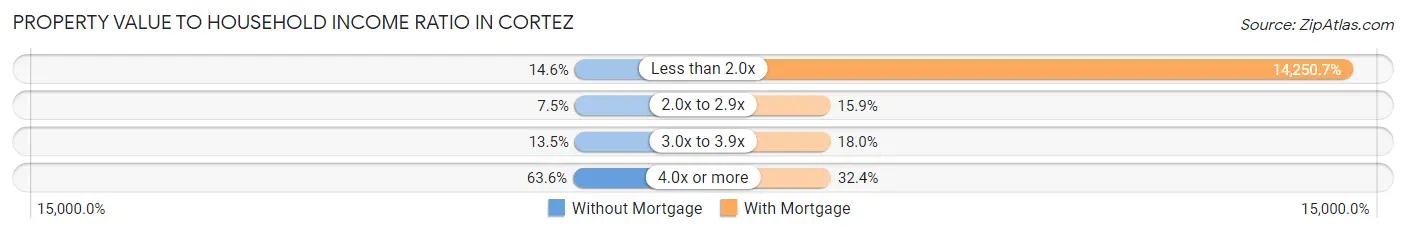
| Value-to-Income Ratio | Without Mortgage | With Mortgage |
| Less than 2.0x | 176 (14.6%) | 118,708 (14,250.7%) |
| 2.0x to 2.9x | 90 (7.5%) | 132 (15.9%) |
| 3.0x to 3.9x | 163 (13.5%) | 150 (18.0%) |
| 4.0x or more | 768 (63.6%) | 270 (32.4%) |
| Total | 1,207 (100.0%) | 833 (100.0%) |
Real Estate Taxes by Mortgage Status in Cortez
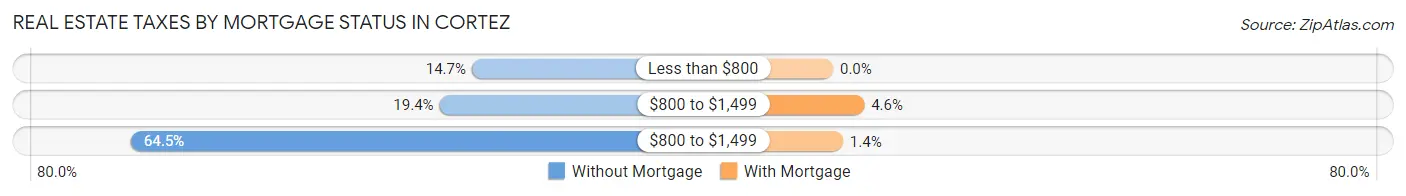
| Property Taxes | Without Mortgage | With Mortgage |
| Less than $800 | 177 (14.7%) | 0 (0.0%) |
| $800 to $1,499 | 234 (19.4%) | 38 (4.6%) |
| $800 to $1,499 | 778 (64.5%) | 12 (1.4%) |
| Total | 1,207 (100.0%) | 833 (100.0%) |
Health & Disability in Cortez
Health Insurance Coverage by Age in Cortez
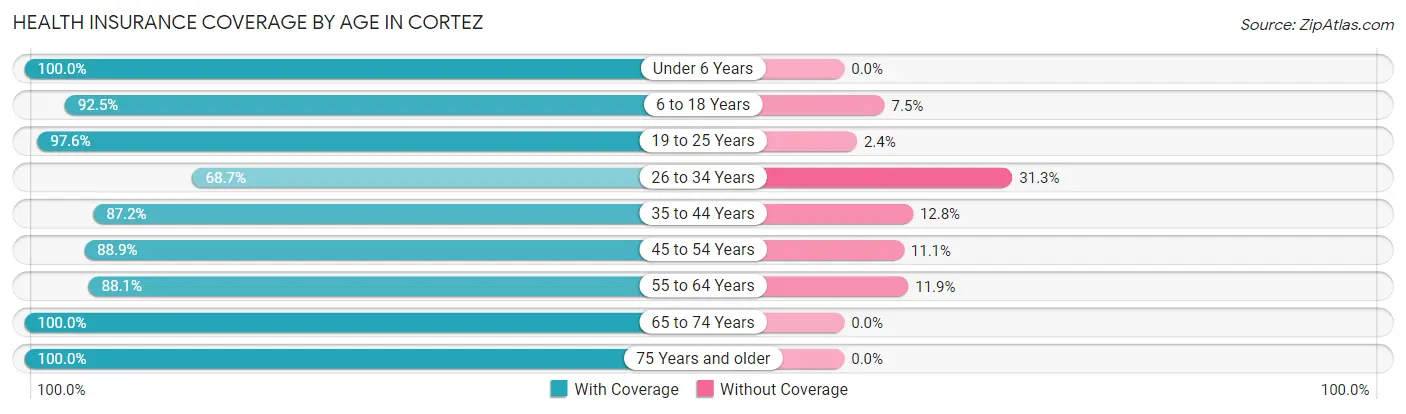
| Age Bracket | With Coverage | Without Coverage |
| Under 6 Years | 237 (100.0%) | 0 (0.0%) |
| 6 to 18 Years | 283 (92.5%) | 23 (7.5%) |
| 19 to 25 Years | 165 (97.6%) | 4 (2.4%) |
| 26 to 34 Years | 184 (68.7%) | 84 (31.3%) |
| 35 to 44 Years | 286 (87.2%) | 42 (12.8%) |
| 45 to 54 Years | 416 (88.9%) | 52 (11.1%) |
| 55 to 64 Years | 819 (88.1%) | 111 (11.9%) |
| 65 to 74 Years | 1,070 (100.0%) | 0 (0.0%) |
| 75 Years and older | 1,239 (100.0%) | 0 (0.0%) |
| Total | 4,699 (93.7%) | 316 (6.3%) |
Health Insurance Coverage by Citizenship Status in Cortez
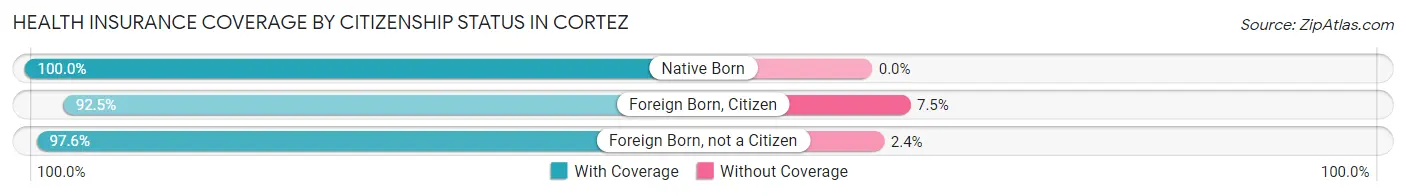
| Citizenship Status | With Coverage | Without Coverage |
| Native Born | 237 (100.0%) | 0 (0.0%) |
| Foreign Born, Citizen | 283 (92.5%) | 23 (7.5%) |
| Foreign Born, not a Citizen | 165 (97.6%) | 4 (2.4%) |
Health Insurance Coverage by Household Income in Cortez
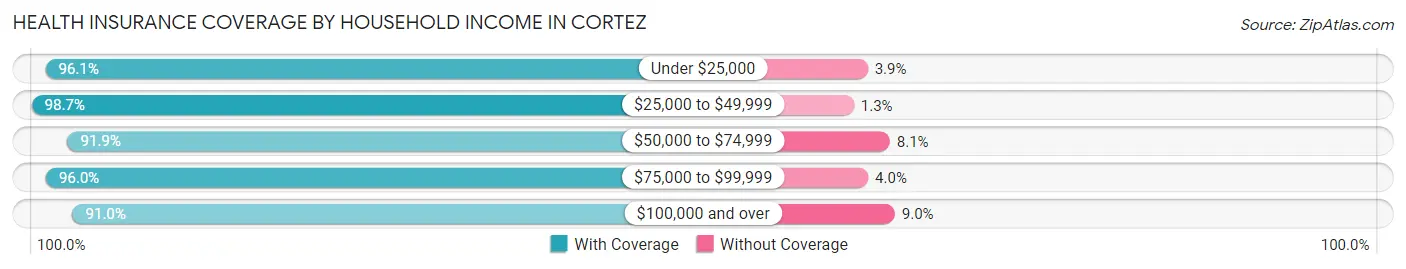
| Household Income | With Coverage | Without Coverage |
| Under $25,000 | 490 (96.1%) | 20 (3.9%) |
| $25,000 to $49,999 | 600 (98.7%) | 8 (1.3%) |
| $50,000 to $74,999 | 696 (91.9%) | 61 (8.1%) |
| $75,000 to $99,999 | 1,079 (96.0%) | 45 (4.0%) |
| $100,000 and over | 1,809 (91.0%) | 179 (9.0%) |
Public vs Private Health Insurance Coverage by Age in Cortez
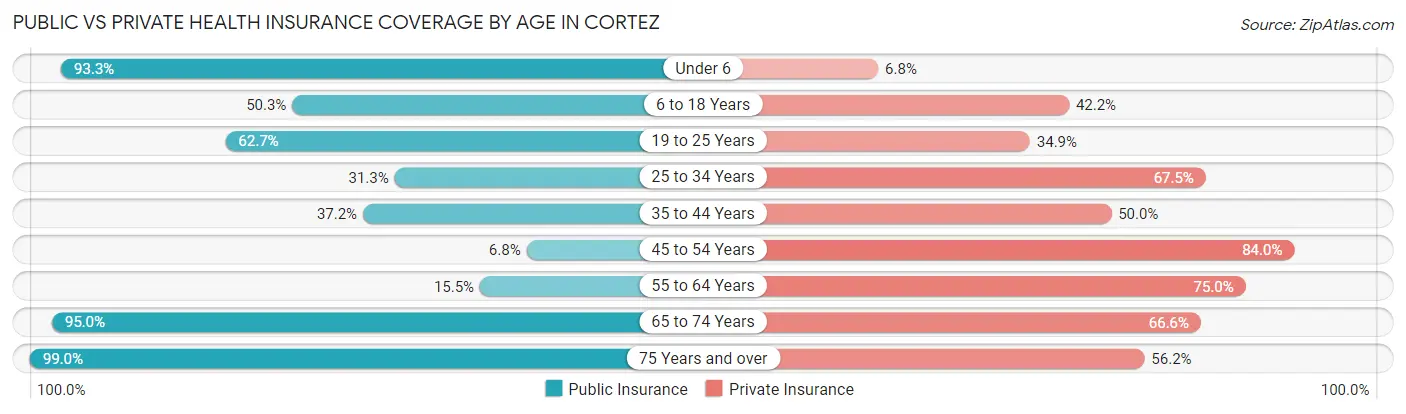
| Age Bracket | Public Insurance | Private Insurance |
| Under 6 | 221 (93.2%) | 16 (6.8%) |
| 6 to 18 Years | 154 (50.3%) | 129 (42.2%) |
| 19 to 25 Years | 106 (62.7%) | 59 (34.9%) |
| 25 to 34 Years | 84 (31.3%) | 181 (67.5%) |
| 35 to 44 Years | 122 (37.2%) | 164 (50.0%) |
| 45 to 54 Years | 32 (6.8%) | 393 (84.0%) |
| 55 to 64 Years | 144 (15.5%) | 697 (75.0%) |
| 65 to 74 Years | 1,016 (95.0%) | 713 (66.6%) |
| 75 Years and over | 1,227 (99.0%) | 696 (56.2%) |
| Total | 3,106 (61.9%) | 3,048 (60.8%) |
Disability Status by Sex by Age in Cortez
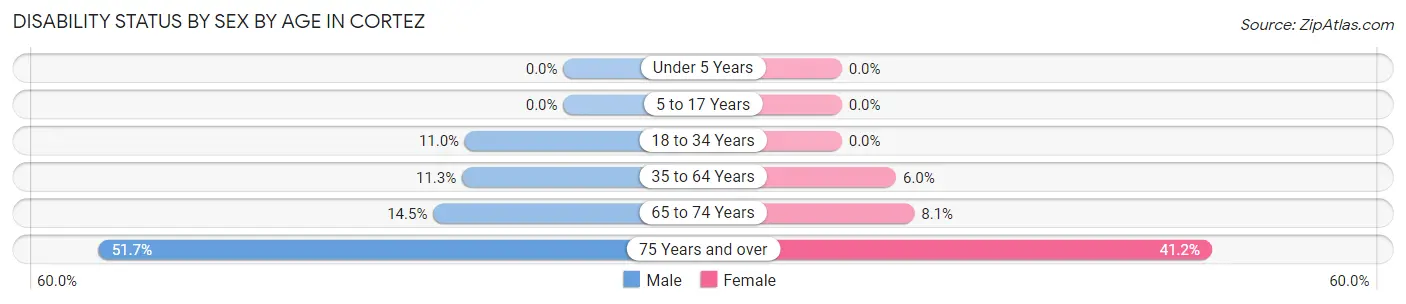
| Age Bracket | Male | Female |
| Under 5 Years | 0 (0.0%) | 0 (0.0%) |
| 5 to 17 Years | 0 (0.0%) | 0 (0.0%) |
| 18 to 34 Years | 24 (11.0%) | 0 (0.0%) |
| 35 to 64 Years | 105 (11.3%) | 48 (6.0%) |
| 65 to 74 Years | 60 (14.5%) | 53 (8.1%) |
| 75 Years and over | 356 (51.7%) | 227 (41.2%) |
Disability Class by Sex by Age in Cortez
Disability Class: Hearing Difficulty
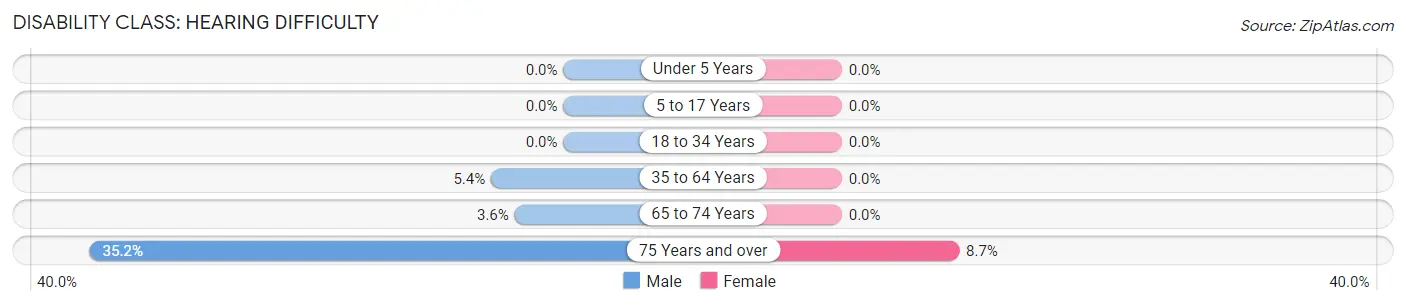
| Age Bracket | Male | Female |
| Under 5 Years | 0 (0.0%) | 0 (0.0%) |
| 5 to 17 Years | 0 (0.0%) | 0 (0.0%) |
| 18 to 34 Years | 0 (0.0%) | 0 (0.0%) |
| 35 to 64 Years | 50 (5.4%) | 0 (0.0%) |
| 65 to 74 Years | 15 (3.6%) | 0 (0.0%) |
| 75 Years and over | 242 (35.2%) | 48 (8.7%) |
Disability Class: Vision Difficulty
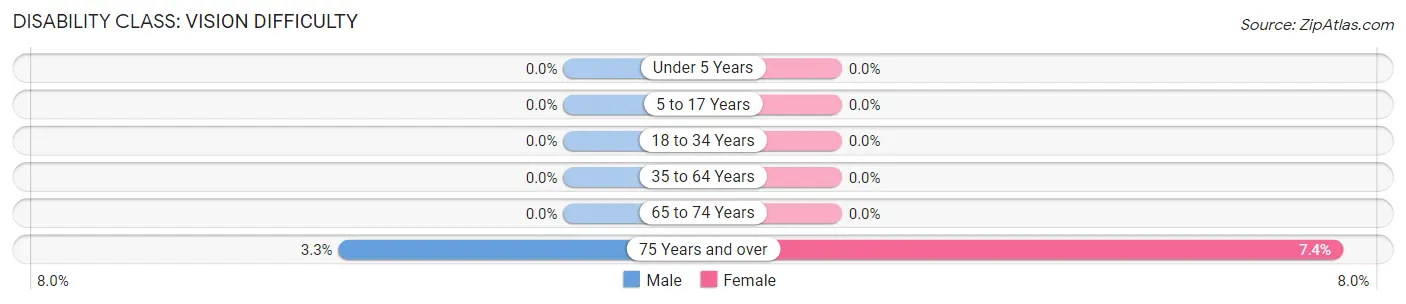
| Age Bracket | Male | Female |
| Under 5 Years | 0 (0.0%) | 0 (0.0%) |
| 5 to 17 Years | 0 (0.0%) | 0 (0.0%) |
| 18 to 34 Years | 0 (0.0%) | 0 (0.0%) |
| 35 to 64 Years | 0 (0.0%) | 0 (0.0%) |
| 65 to 74 Years | 0 (0.0%) | 0 (0.0%) |
| 75 Years and over | 23 (3.3%) | 41 (7.4%) |
Disability Class: Cognitive Difficulty
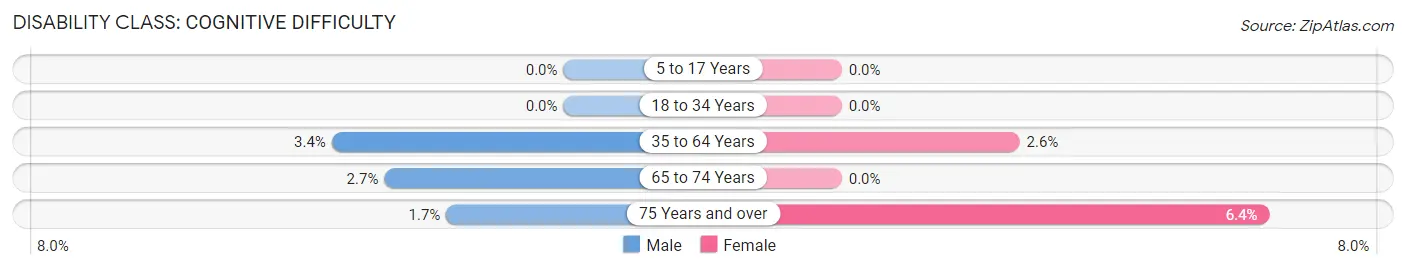
| Age Bracket | Male | Female |
| 5 to 17 Years | 0 (0.0%) | 0 (0.0%) |
| 18 to 34 Years | 0 (0.0%) | 0 (0.0%) |
| 35 to 64 Years | 32 (3.4%) | 21 (2.6%) |
| 65 to 74 Years | 11 (2.7%) | 0 (0.0%) |
| 75 Years and over | 12 (1.7%) | 35 (6.4%) |
Disability Class: Ambulatory Difficulty
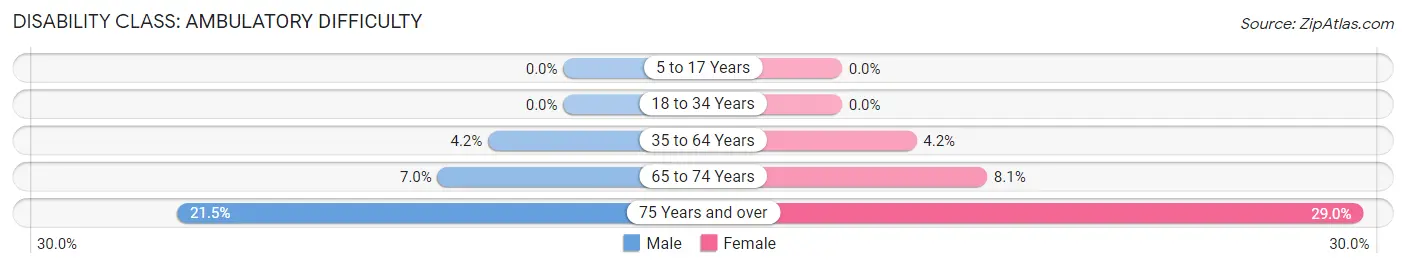
| Age Bracket | Male | Female |
| 5 to 17 Years | 0 (0.0%) | 0 (0.0%) |
| 18 to 34 Years | 0 (0.0%) | 0 (0.0%) |
| 35 to 64 Years | 39 (4.2%) | 33 (4.2%) |
| 65 to 74 Years | 29 (7.0%) | 53 (8.1%) |
| 75 Years and over | 148 (21.5%) | 160 (29.0%) |
Disability Class: Self-Care Difficulty
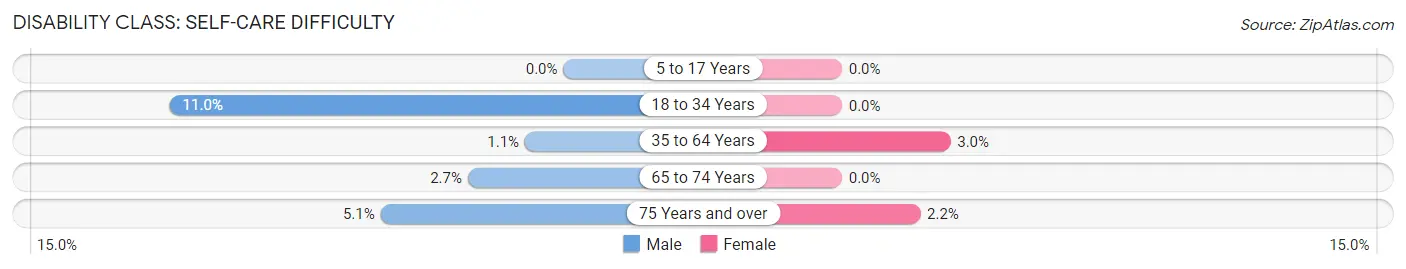
| Age Bracket | Male | Female |
| 5 to 17 Years | 0 (0.0%) | 0 (0.0%) |
| 18 to 34 Years | 24 (11.0%) | 0 (0.0%) |
| 35 to 64 Years | 10 (1.1%) | 24 (3.0%) |
| 65 to 74 Years | 11 (2.7%) | 0 (0.0%) |
| 75 Years and over | 35 (5.1%) | 12 (2.2%) |
Technology Access in Cortez
Computing Device Access in Cortez
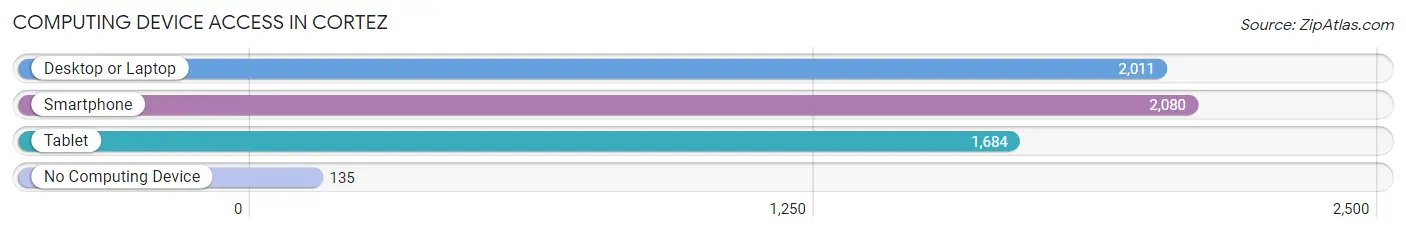
| Device Type | # Households | % Households |
| Desktop or Laptop | 2,011 | 83.1% |
| Smartphone | 2,080 | 86.0% |
| Tablet | 1,684 | 69.6% |
| No Computing Device | 135 | 5.6% |
| Total | 2,419 | 100.0% |
Internet Access in Cortez
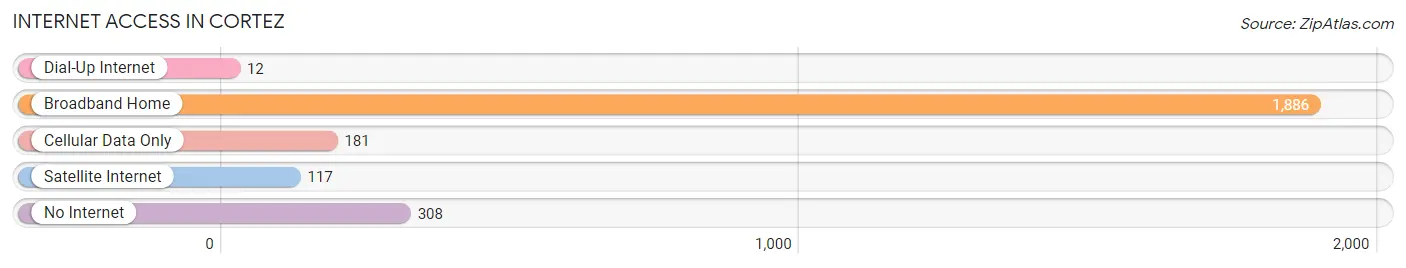
| Internet Type | # Households | % Households |
| Dial-Up Internet | 12 | 0.5% |
| Broadband Home | 1,886 | 78.0% |
| Cellular Data Only | 181 | 7.5% |
| Satellite Internet | 117 | 4.8% |
| No Internet | 308 | 12.7% |
| Total | 2,419 | 100.0% |
Cortez Summary
Cortez is a small fishing village located in Manatee County, Florida. It is situated on the west coast of Florida, just south of Tampa Bay. The village is known for its rich history, unique geography, vibrant economy, and diverse demographics.
History
Cortez was first settled in the late 1800s by fishermen from the Bahamas. The village was originally called Hunter’s Point, but was later renamed Cortez in honor of the Spanish explorer Hernando de Soto. The village was incorporated in 1945 and has since become a popular tourist destination.
Geography
Cortez is located on the west coast of Florida, just south of Tampa Bay. The village is situated on a peninsula, surrounded by the Gulf of Mexico to the west and Sarasota Bay to the east. The village is home to several small islands, including Anna Maria Island, Longboat Key, and Palma Sola Bay. The village is also home to several small creeks and rivers, including the Braden River, Manatee River, and Palma Sola Creek.
Economy
Cortez is known for its vibrant economy. The village is home to several seafood processing plants, as well as a number of restaurants and shops. The village is also home to several marinas, which provide access to the Gulf of Mexico and Sarasota Bay. Tourism is also an important part of the local economy, with many visitors coming to the village to enjoy its beaches, fishing, and other outdoor activities.
Demographics
Cortez is home to a diverse population. According to the 2000 census, the village had a population of 2,845 people. The population was made up of a variety of ethnic and racial backgrounds, including White (77.3%), African American (14.2%), Hispanic (4.7%), and Asian (2.7%). The median household income in the village was $37,941, and the median age was 44.7 years.
Conclusion
Cortez is a small fishing village located in Manatee County, Florida. It is known for its rich history, unique geography, vibrant economy, and diverse demographics. The village is home to several seafood processing plants, marinas, restaurants, and shops. Tourism is also an important part of the local economy, with many visitors coming to the village to enjoy its beaches, fishing, and other outdoor activities. The village is home to a diverse population, with a variety of ethnic and racial backgrounds.
Common Questions
What is Per Capita Income in Cortez?
Per Capita income in Cortez is $55,014.
What is the Median Family Income in Cortez?
Median Family Income in Cortez is $89,804.
What is the Median Household income in Cortez?
Median Household Income in Cortez is $74,769.
What is Income or Wage Gap in Cortez?
Income or Wage Gap in Cortez is 56.8%.
Women in Cortez earn 43.2 cents for every dollar earned by a man.
What is Family Income Deficit in Cortez?
Family Income Deficit in Cortez is $8,569.
Families that are below poverty line in Cortez earn $8,569 less on average than the poverty threshold level.
What is Inequality or Gini Index in Cortez?
Inequality or Gini Index in Cortez is 0.49.
What is the Total Population of Cortez?
Total Population of Cortez is 5,033.
What is the Total Male Population of Cortez?
Total Male Population of Cortez is 2,523.
What is the Total Female Population of Cortez?
Total Female Population of Cortez is 2,510.
What is the Ratio of Males per 100 Females in Cortez?
There are 100.52 Males per 100 Females in Cortez.
What is the Ratio of Females per 100 Males in Cortez?
There are 99.48 Females per 100 Males in Cortez.
What is the Median Population Age in Cortez?
Median Population Age in Cortez is 63.4 Years.
What is the Average Family Size in Cortez
Average Family Size in Cortez is 2.4 People.
What is the Average Household Size in Cortez
Average Household Size in Cortez is 2.1 People.
How Large is the Labor Force in Cortez?
There are 1,861 People in the Labor Forcein in Cortez.
What is the Percentage of People in the Labor Force in Cortez?
39.7% of People are in the Labor Force in Cortez.
What is the Unemployment Rate in Cortez?
Unemployment Rate in Cortez is 10.6%.