Wabasso Beach, FL Map & Demographics
Wabasso Beach Map
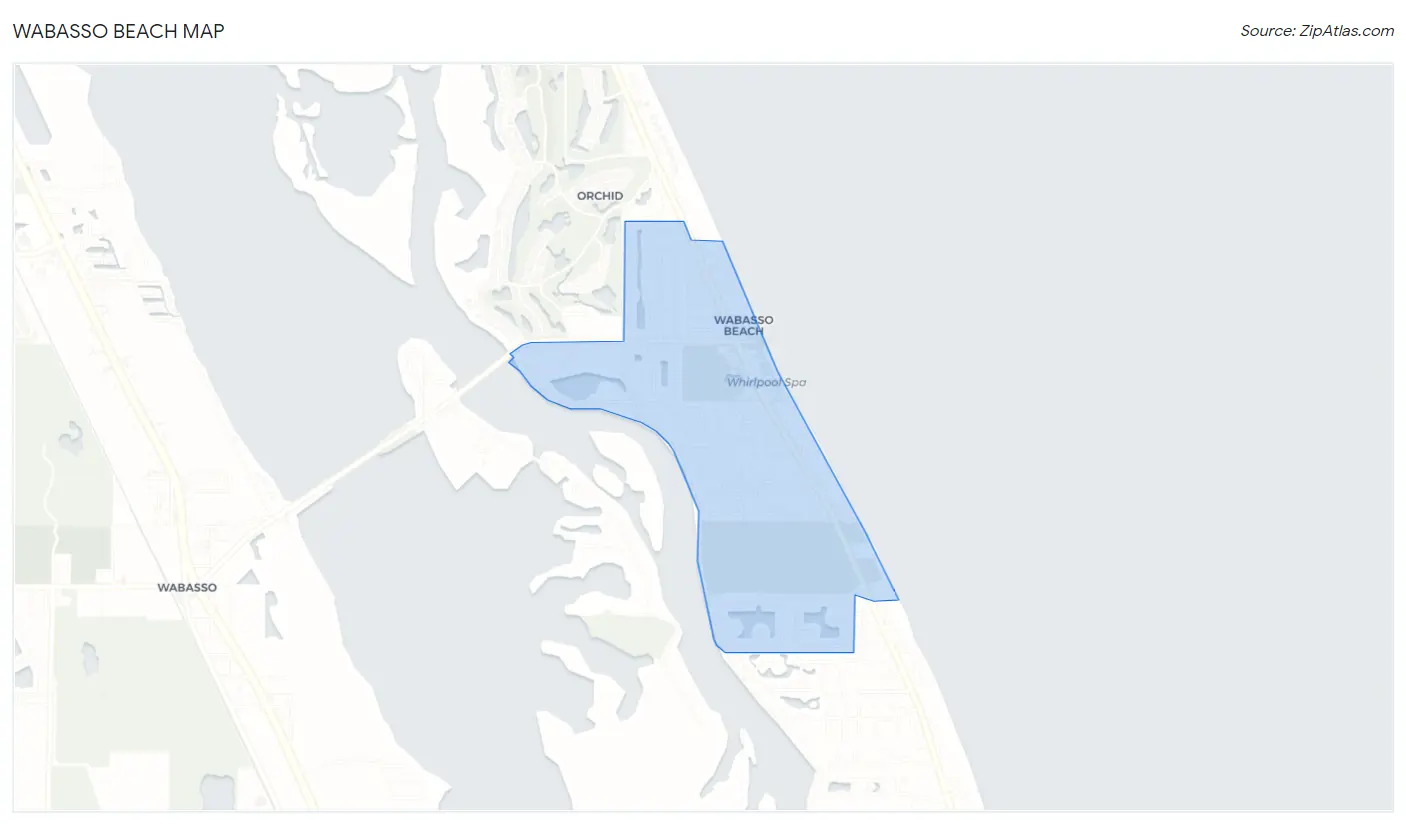
Wabasso Beach Overview
$71,153
PER CAPITA INCOME
$118,611
AVG FAMILY INCOME
$120,673
AVG HOUSEHOLD INCOME
0.43
INEQUALITY / GINI INDEX
2,101
TOTAL POPULATION
1,011
MALE POPULATION
1,090
FEMALE POPULATION
92.75
MALES / 100 FEMALES
107.81
FEMALES / 100 MALES
69.8
MEDIAN AGE
2.5
AVG FAMILY SIZE
2.2
AVG HOUSEHOLD SIZE
613
LABOR FORCE [ PEOPLE ]
29.2%
PERCENT IN LABOR FORCE
Income in Wabasso Beach
Income Overview in Wabasso Beach
Per Capita Income in Wabasso Beach is $71,153, while median incomes of families and households are $118,611 and $120,673 respectively.
| Characteristic | Number | Measure |
| Per Capita Income | 2,101 | $71,153 |
| Median Family Income | 728 | $118,611 |
| Mean Family Income | 728 | $157,502 |
| Median Household Income | 953 | $120,673 |
| Mean Household Income | 953 | $145,994 |
| Income Deficit | 728 | $0 |
| Wage / Income Gap (%) | 2,101 | 0.00% |
| Wage / Income Gap ($) | 2,101 | 100.00¢ per $1 |
| Gini / Inequality Index | 2,101 | 0.43 |
Earnings by Sex in Wabasso Beach
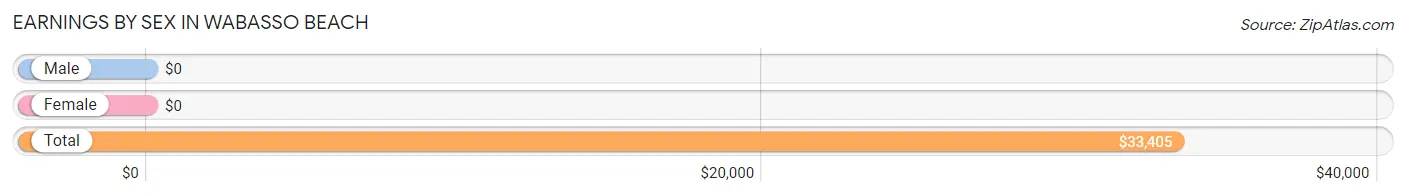
| Sex | Number | Average Earnings |
| Male | 490 (68.7%) | $0 |
| Female | 223 (31.3%) | $0 |
| Total | 713 (100.0%) | $33,405 |
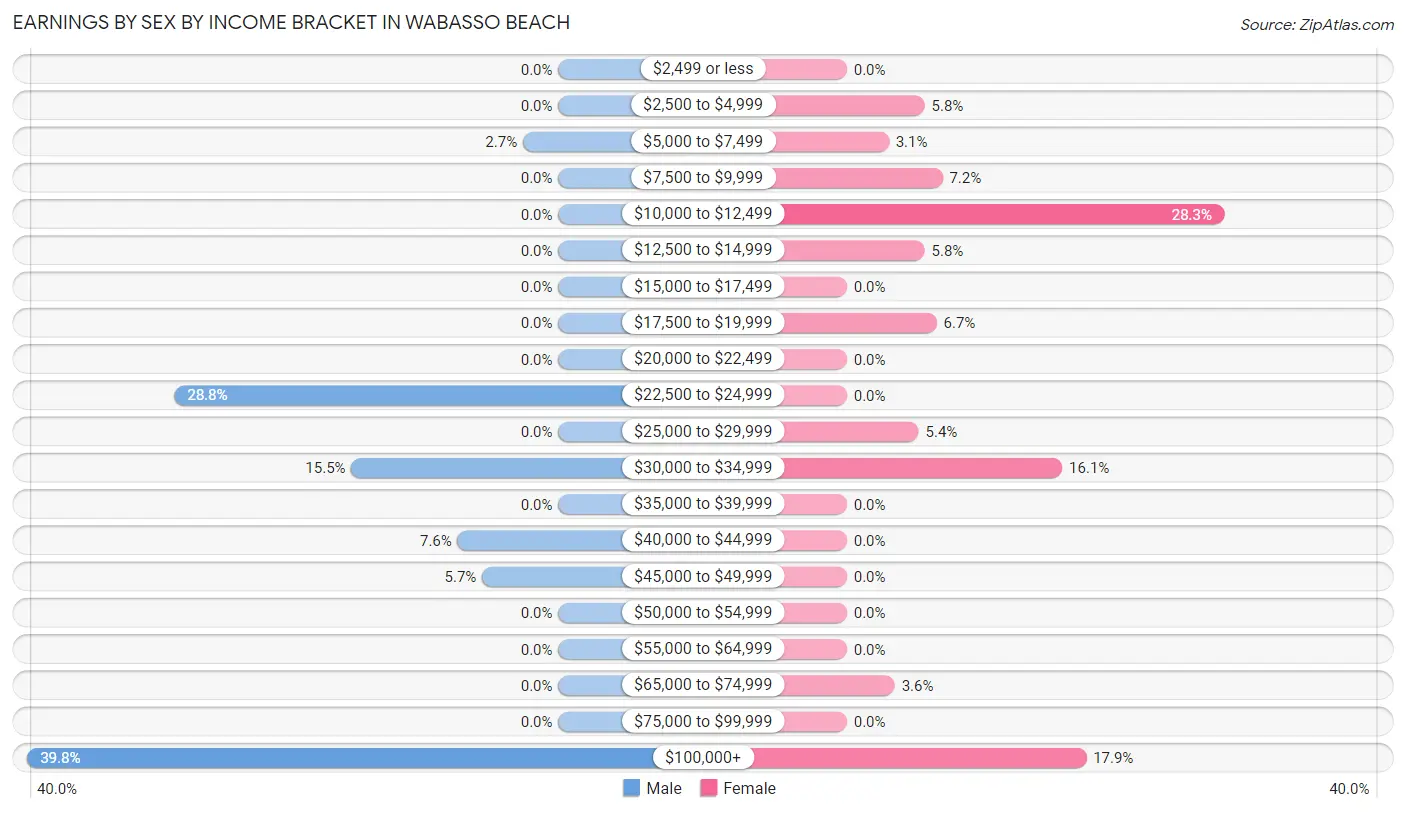
Earnings by Sex by Income Bracket in Wabasso Beach
The most common earnings brackets in Wabasso Beach are $100,000+ for men (195 | 39.8%) and $10,000 to $12,499 for women (63 | 28.2%).
| Income | Male | Female |
| $2,499 or less | 0 (0.0%) | 0 (0.0%) |
| $2,500 to $4,999 | 0 (0.0%) | 13 (5.8%) |
| $5,000 to $7,499 | 13 (2.6%) | 7 (3.1%) |
| $7,500 to $9,999 | 0 (0.0%) | 16 (7.2%) |
| $10,000 to $12,499 | 0 (0.0%) | 63 (28.2%) |
| $12,500 to $14,999 | 0 (0.0%) | 13 (5.8%) |
| $15,000 to $17,499 | 0 (0.0%) | 0 (0.0%) |
| $17,500 to $19,999 | 0 (0.0%) | 15 (6.7%) |
| $20,000 to $22,499 | 0 (0.0%) | 0 (0.0%) |
| $22,500 to $24,999 | 141 (28.8%) | 0 (0.0%) |
| $25,000 to $29,999 | 0 (0.0%) | 12 (5.4%) |
| $30,000 to $34,999 | 76 (15.5%) | 36 (16.1%) |
| $35,000 to $39,999 | 0 (0.0%) | 0 (0.0%) |
| $40,000 to $44,999 | 37 (7.5%) | 0 (0.0%) |
| $45,000 to $49,999 | 28 (5.7%) | 0 (0.0%) |
| $50,000 to $54,999 | 0 (0.0%) | 0 (0.0%) |
| $55,000 to $64,999 | 0 (0.0%) | 0 (0.0%) |
| $65,000 to $74,999 | 0 (0.0%) | 8 (3.6%) |
| $75,000 to $99,999 | 0 (0.0%) | 0 (0.0%) |
| $100,000+ | 195 (39.8%) | 40 (17.9%) |
| Total | 490 (100.0%) | 223 (100.0%) |
Earnings by Sex by Educational Attainment in Wabasso Beach
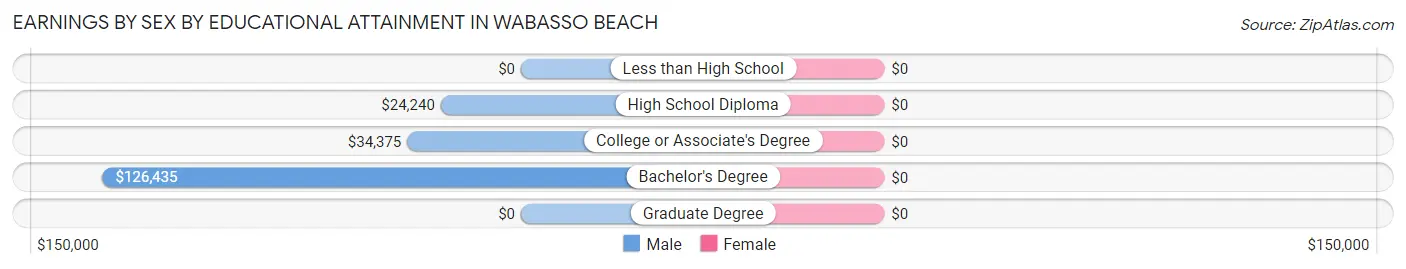
| Educational Attainment | Male Income | Female Income |
| Less than High School | - | - |
| High School Diploma | $24,240 | $0 |
| College or Associate's Degree | $34,375 | $0 |
| Bachelor's Degree | $126,435 | $0 |
| Graduate Degree | - | - |
| Total | - | - |
Family Income in Wabasso Beach
Family Income Brackets in Wabasso Beach
According to the Wabasso Beach family income data, there are 187 families falling into the $200,000+ income range, which is the most common income bracket and makes up 25.7% of all families.
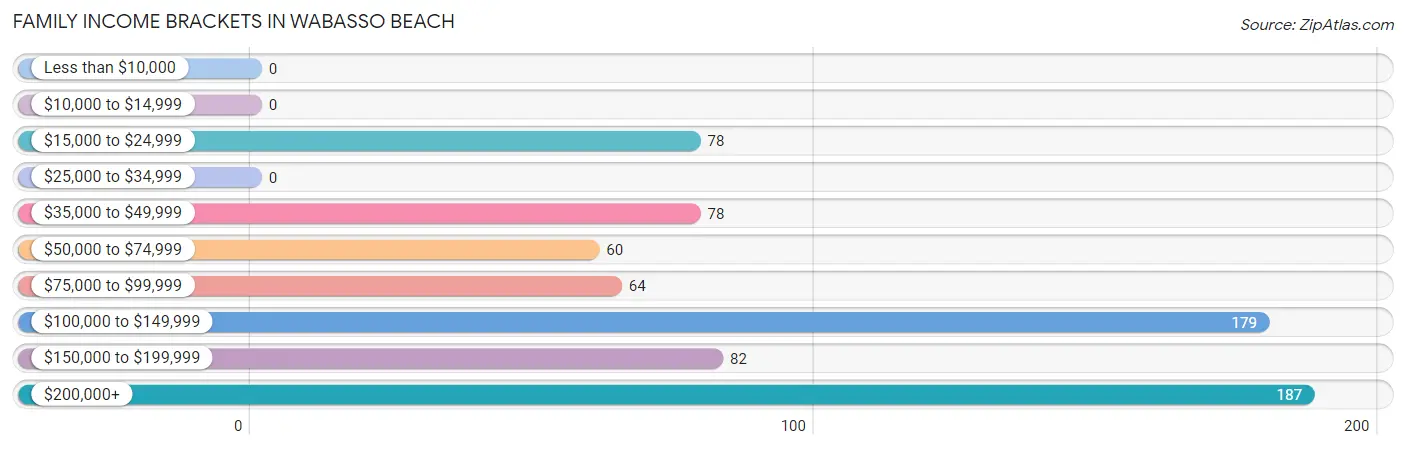
| Income Bracket | # Families | % Families |
| Less than $10,000 | 0 | 0.0% |
| $10,000 to $14,999 | 0 | 0.0% |
| $15,000 to $24,999 | 78 | 10.7% |
| $25,000 to $34,999 | 0 | 0.0% |
| $35,000 to $49,999 | 78 | 10.7% |
| $50,000 to $74,999 | 60 | 8.2% |
| $75,000 to $99,999 | 64 | 8.8% |
| $100,000 to $149,999 | 179 | 24.6% |
| $150,000 to $199,999 | 82 | 11.3% |
| $200,000+ | 187 | 25.7% |
Family Income by Famaliy Size in Wabasso Beach
3-person families (92 | 12.6%) account for the highest median family income in Wabasso Beach with $168,426 per family, while 2-person families (622 | 85.4%) have the highest median income of $56,932 per family member.
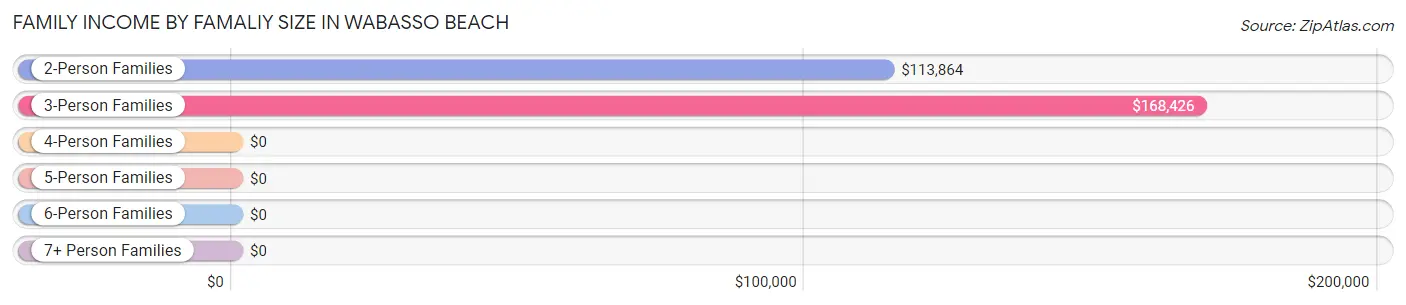
| Income Bracket | # Families | Median Income |
| 2-Person Families | 622 (85.4%) | $113,864 |
| 3-Person Families | 92 (12.6%) | $168,426 |
| 4-Person Families | 14 (1.9%) | $0 |
| 5-Person Families | 0 (0.0%) | $0 |
| 6-Person Families | 0 (0.0%) | $0 |
| 7+ Person Families | 0 (0.0%) | $0 |
| Total | 728 (100.0%) | $118,611 |
Family Income by Number of Earners in Wabasso Beach
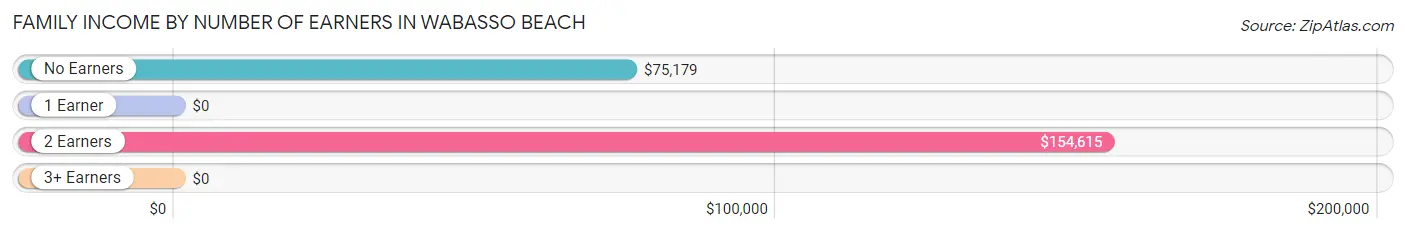
| Number of Earners | # Families | Median Income |
| No Earners | 408 (56.0%) | $75,179 |
| 1 Earner | 222 (30.5%) | $0 |
| 2 Earners | 62 (8.5%) | $154,615 |
| 3+ Earners | 36 (5.0%) | $0 |
| Total | 728 (100.0%) | $118,611 |
Household Income in Wabasso Beach
Household Income Brackets in Wabasso Beach
With 236 households falling in the category, the $100,000 to $149,999 income range is the most frequent in Wabasso Beach, accounting for 24.8% of all households.
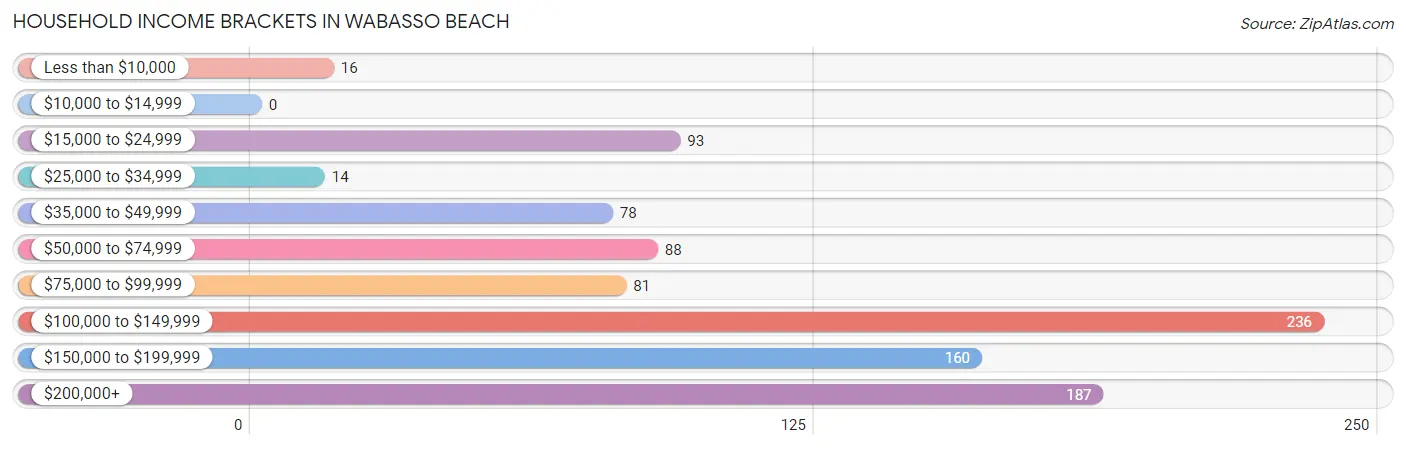
| Income Bracket | # Households | % Households |
| Less than $10,000 | 16 | 1.7% |
| $10,000 to $14,999 | 0 | 0.0% |
| $15,000 to $24,999 | 93 | 9.8% |
| $25,000 to $34,999 | 14 | 1.5% |
| $35,000 to $49,999 | 78 | 8.2% |
| $50,000 to $74,999 | 88 | 9.2% |
| $75,000 to $99,999 | 81 | 8.5% |
| $100,000 to $149,999 | 236 | 24.8% |
| $150,000 to $199,999 | 160 | 16.8% |
| $200,000+ | 187 | 19.6% |
Household Income by Householder Age in Wabasso Beach
The median household income in Wabasso Beach is $120,673, with the highest median household income of $127,898 found in the 65+ years age bracket for the primary householder. A total of 829 households (87.0%) fall into this category.
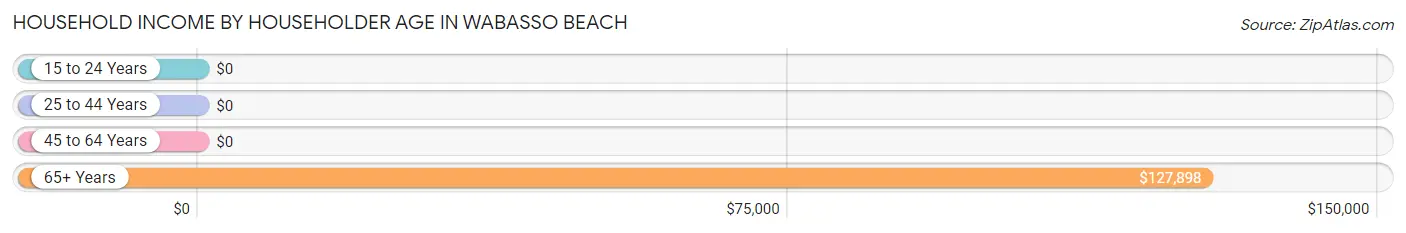
| Income Bracket | # Households | Median Income |
| 15 to 24 Years | 0 (0.0%) | $0 |
| 25 to 44 Years | 0 (0.0%) | $0 |
| 45 to 64 Years | 124 (13.0%) | $0 |
| 65+ Years | 829 (87.0%) | $127,898 |
| Total | 953 (100.0%) | $120,673 |
Poverty in Wabasso Beach
Income Below Poverty by Sex and Age in Wabasso Beach
With 4.3% poverty level for males and 5.3% for females among the residents of Wabasso Beach, 55 to 64 year old males and 55 to 64 year old females are the most vulnerable to poverty, with 14 males (17.1%) and 30 females (13.6%) in their respective age groups living below the poverty level.
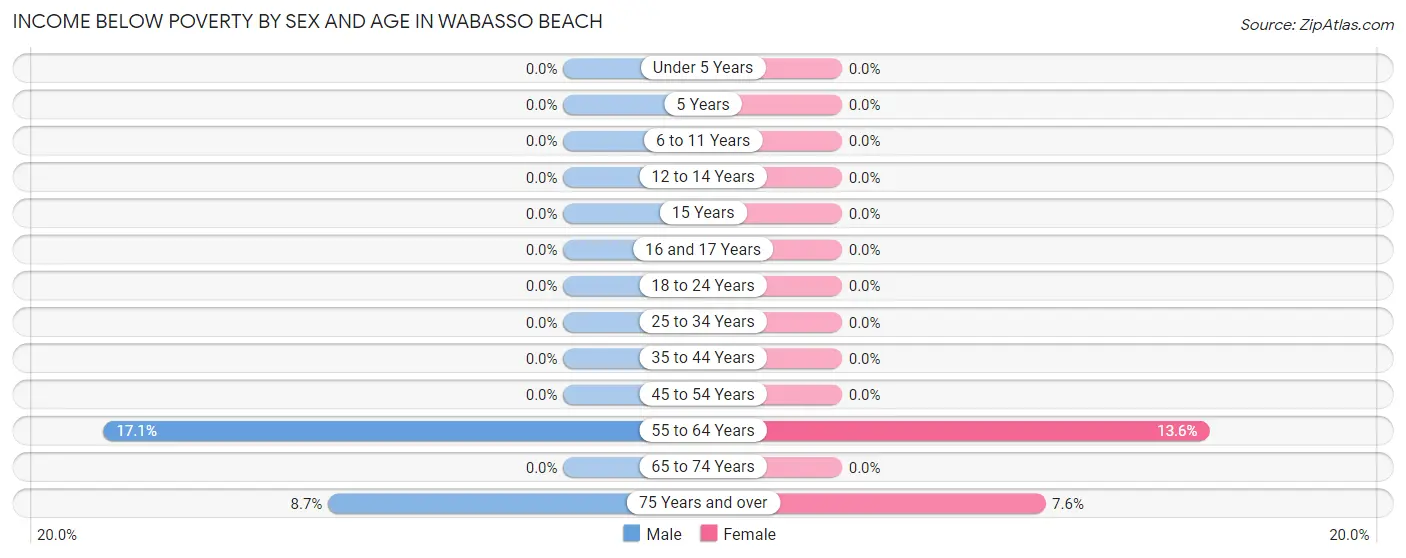
| Age Bracket | Male | Female |
| Under 5 Years | 0 (0.0%) | 0 (0.0%) |
| 5 Years | 0 (0.0%) | 0 (0.0%) |
| 6 to 11 Years | 0 (0.0%) | 0 (0.0%) |
| 12 to 14 Years | 0 (0.0%) | 0 (0.0%) |
| 15 Years | 0 (0.0%) | 0 (0.0%) |
| 16 and 17 Years | 0 (0.0%) | 0 (0.0%) |
| 18 to 24 Years | 0 (0.0%) | 0 (0.0%) |
| 25 to 34 Years | 0 (0.0%) | 0 (0.0%) |
| 35 to 44 Years | 0 (0.0%) | 0 (0.0%) |
| 45 to 54 Years | 0 (0.0%) | 0 (0.0%) |
| 55 to 64 Years | 14 (17.1%) | 30 (13.6%) |
| 65 to 74 Years | 0 (0.0%) | 0 (0.0%) |
| 75 Years and over | 29 (8.7%) | 28 (7.5%) |
| Total | 43 (4.3%) | 58 (5.3%) |
Income Above Poverty by Sex and Age in Wabasso Beach
According to the poverty statistics in Wabasso Beach, males aged 25 to 34 years and females aged 18 to 24 years are the age groups that are most secure financially, with 100.0% of males and 100.0% of females in these age groups living above the poverty line.
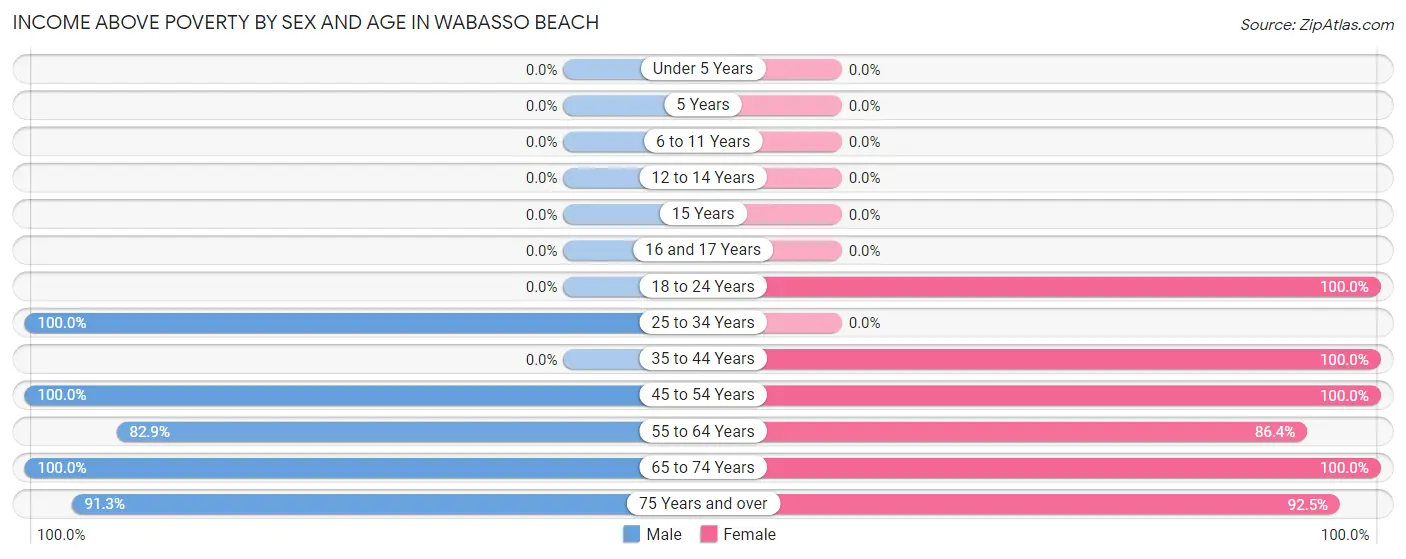
| Age Bracket | Male | Female |
| Under 5 Years | 0 (0.0%) | 0 (0.0%) |
| 5 Years | 0 (0.0%) | 0 (0.0%) |
| 6 to 11 Years | 0 (0.0%) | 0 (0.0%) |
| 12 to 14 Years | 0 (0.0%) | 0 (0.0%) |
| 15 Years | 0 (0.0%) | 0 (0.0%) |
| 16 and 17 Years | 0 (0.0%) | 0 (0.0%) |
| 18 to 24 Years | 0 (0.0%) | 63 (100.0%) |
| 25 to 34 Years | 217 (100.0%) | 0 (0.0%) |
| 35 to 44 Years | 0 (0.0%) | 8 (100.0%) |
| 45 to 54 Years | 68 (100.0%) | 118 (100.0%) |
| 55 to 64 Years | 68 (82.9%) | 190 (86.4%) |
| 65 to 74 Years | 312 (100.0%) | 310 (100.0%) |
| 75 Years and over | 303 (91.3%) | 343 (92.4%) |
| Total | 968 (95.8%) | 1,032 (94.7%) |
Income Below Poverty Among Married-Couple Families in Wabasso Beach
The poverty statistics for married-couple families in Wabasso Beach show that 2.3% or 14 of the total 604 families live below the poverty line. Families with no children have the highest poverty rate of 2.3%, comprising of 14 families. On the other hand, families with no children have the lowest poverty rate of 2.3%, which includes 14 families.
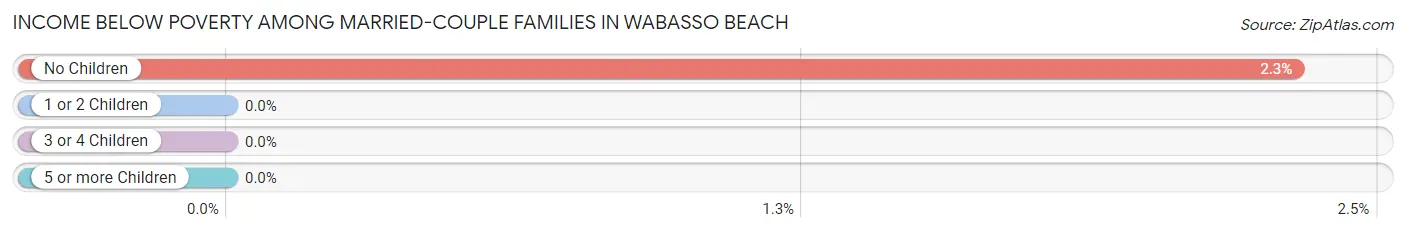
| Children | Above Poverty | Below Poverty |
| No Children | 590 (97.7%) | 14 (2.3%) |
| 1 or 2 Children | 0 (0.0%) | 0 (0.0%) |
| 3 or 4 Children | 0 (0.0%) | 0 (0.0%) |
| 5 or more Children | 0 (0.0%) | 0 (0.0%) |
| Total | 590 (97.7%) | 14 (2.3%) |
Income Below Poverty Among Single-Parent Households in Wabasso Beach
| Children | Single Father | Single Mother |
| No Children | 0 (0.0%) | 0 (0.0%) |
| 1 or 2 Children | 0 (0.0%) | 0 (0.0%) |
| 3 or 4 Children | 0 (0.0%) | 0 (0.0%) |
| 5 or more Children | 0 (0.0%) | 0 (0.0%) |
| Total | 0 (0.0%) | 0 (0.0%) |
Income Below Poverty Among Married-Couple vs Single-Parent Households in Wabasso Beach
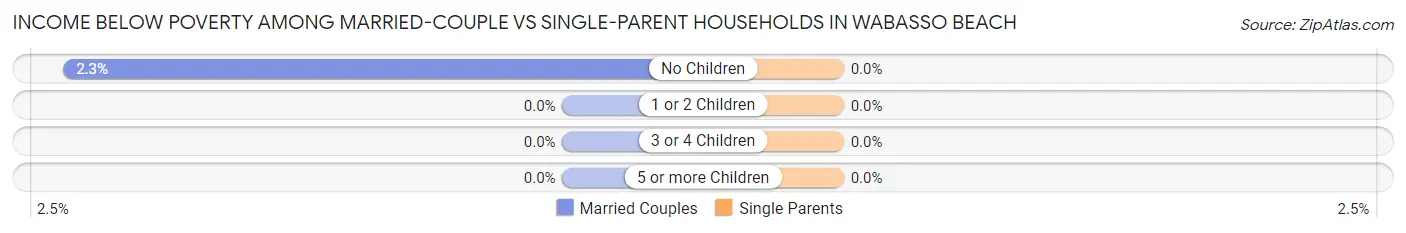
| Children | Married-Couple Families | Single-Parent Households |
| No Children | 14 (2.3%) | 0 (0.0%) |
| 1 or 2 Children | 0 (0.0%) | 0 (0.0%) |
| 3 or 4 Children | 0 (0.0%) | 0 (0.0%) |
| 5 or more Children | 0 (0.0%) | 0 (0.0%) |
| Total | 14 (2.3%) | 0 (0.0%) |
Race in Wabasso Beach
The most populous races in Wabasso Beach are White / Caucasian (2,014 | 95.9%), Two or more Races (79 | 3.8%), and Hispanic or Latino (14 | 0.7%).
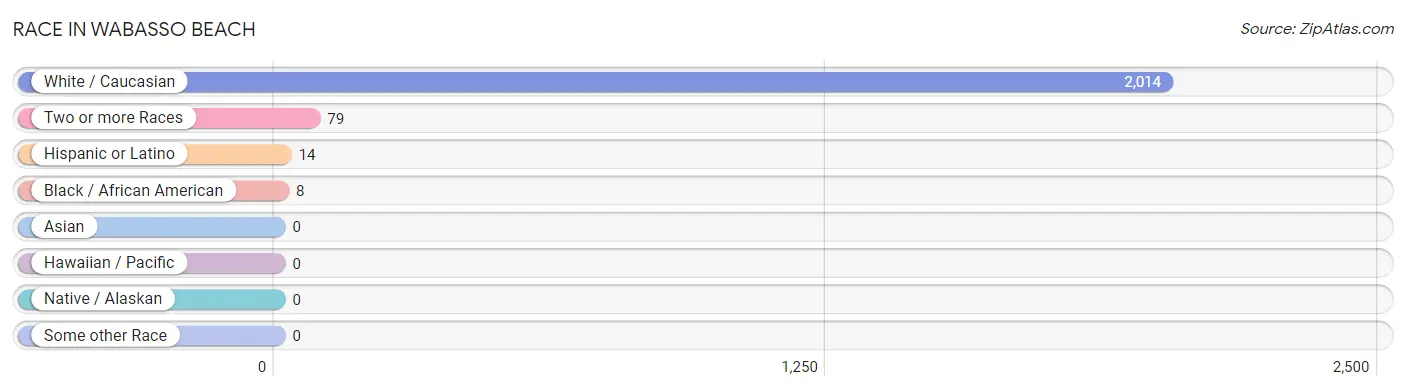
| Race | # Population | % Population |
| Asian | 0 | 0.0% |
| Black / African American | 8 | 0.4% |
| Hawaiian / Pacific | 0 | 0.0% |
| Hispanic or Latino | 14 | 0.7% |
| Native / Alaskan | 0 | 0.0% |
| White / Caucasian | 2,014 | 95.9% |
| Two or more Races | 79 | 3.8% |
| Some other Race | 0 | 0.0% |
| Total | 2,101 | 100.0% |
Ancestry in Wabasso Beach
The most populous ancestries reported in Wabasso Beach are English (505 | 24.0%), Irish (424 | 20.2%), German (337 | 16.0%), Italian (220 | 10.5%), and American (165 | 7.9%), together accounting for 78.6% of all Wabasso Beach residents.
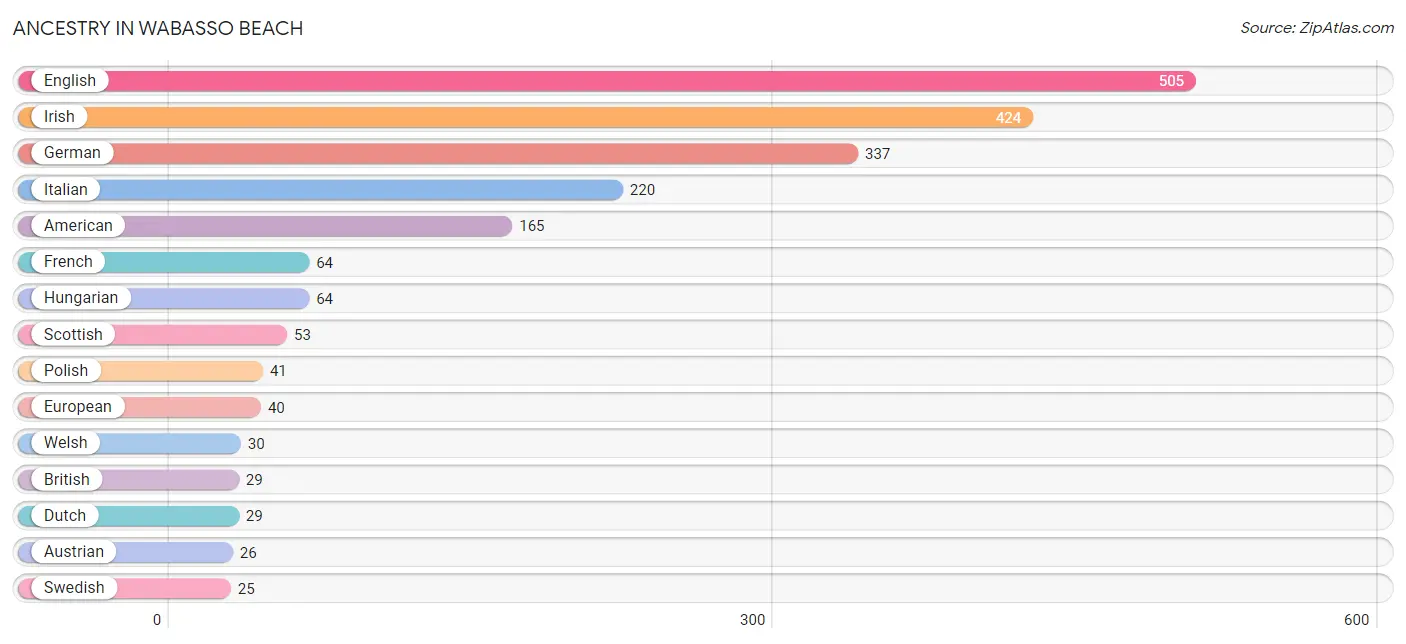
| Ancestry | # Population | % Population |
| American | 165 | 7.9% |
| Austrian | 26 | 1.2% |
| British | 29 | 1.4% |
| Cuban | 14 | 0.7% |
| Dutch | 29 | 1.4% |
| Eastern European | 15 | 0.7% |
| English | 505 | 24.0% |
| European | 40 | 1.9% |
| French | 64 | 3.0% |
| German | 337 | 16.0% |
| Hungarian | 64 | 3.0% |
| Irish | 424 | 20.2% |
| Italian | 220 | 10.5% |
| Jamaican | 8 | 0.4% |
| Norwegian | 9 | 0.4% |
| Polish | 41 | 1.9% |
| Russian | 17 | 0.8% |
| Scandinavian | 13 | 0.6% |
| Scotch-Irish | 14 | 0.7% |
| Scottish | 53 | 2.5% |
| Swedish | 25 | 1.2% |
| Welsh | 30 | 1.4% | View All 22 Rows |
Immigrants in Wabasso Beach
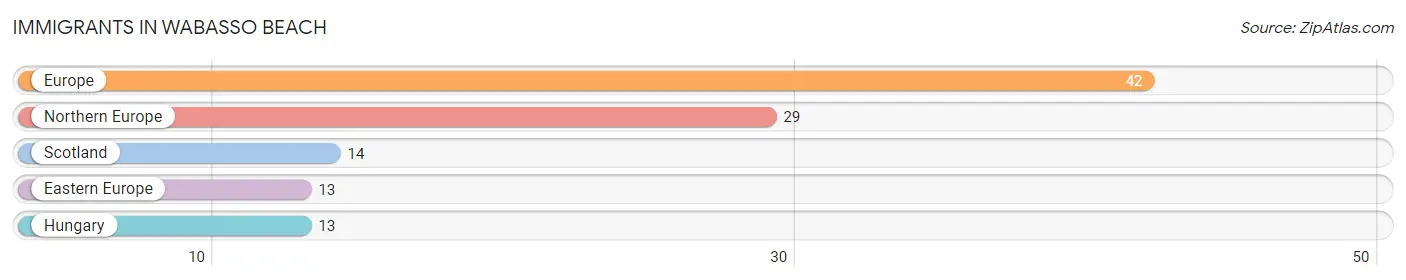
The most numerous immigrant groups reported in Wabasso Beach came from Europe (42 | 2.0%), Northern Europe (29 | 1.4%), Scotland (14 | 0.7%), Eastern Europe (13 | 0.6%), and Hungary (13 | 0.6%), together accounting for 5.3% of all Wabasso Beach residents.
| Immigration Origin | # Population | % Population |
| Eastern Europe | 13 | 0.6% |
| Europe | 42 | 2.0% |
| Hungary | 13 | 0.6% |
| Northern Europe | 29 | 1.4% |
| Scotland | 14 | 0.7% | View All 5 Rows |
Sex and Age in Wabasso Beach
Sex and Age in Wabasso Beach
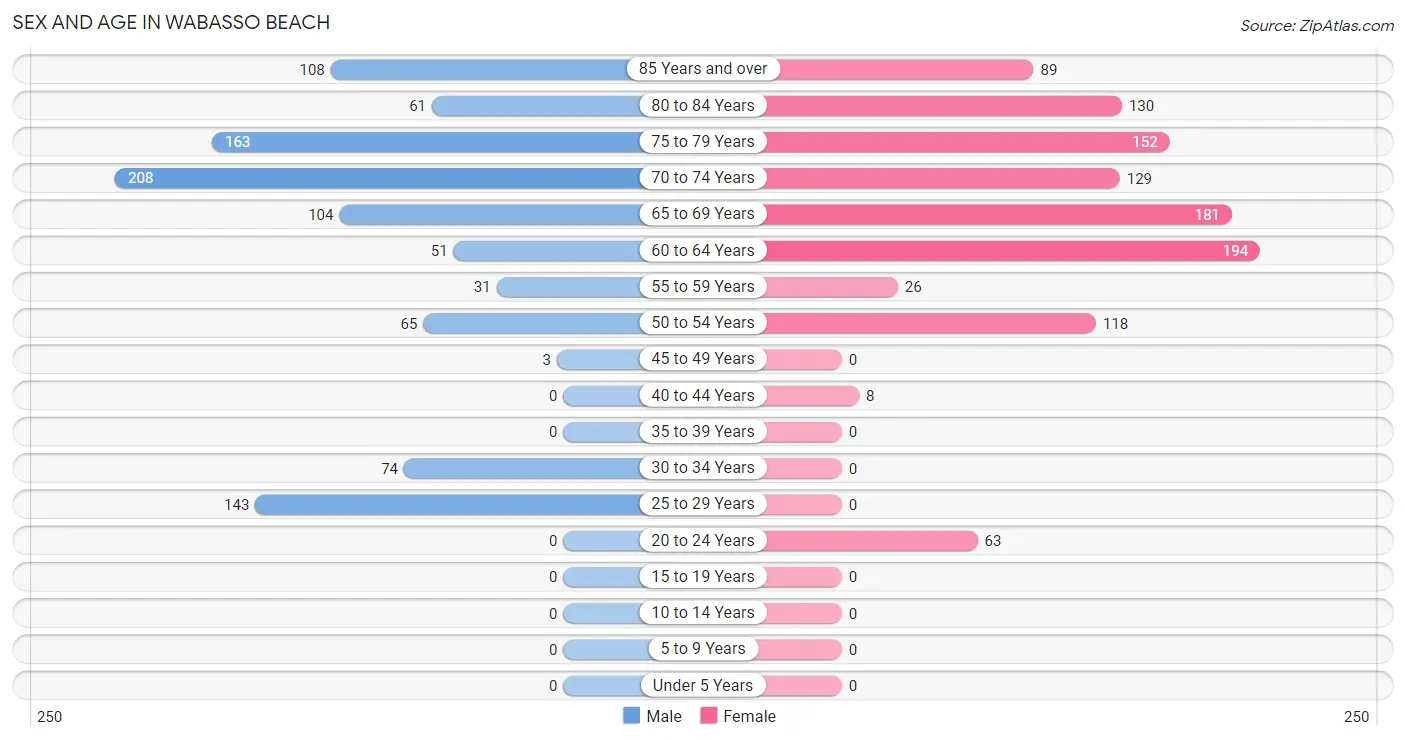
The most populous age groups in Wabasso Beach are 70 to 74 Years (208 | 20.6%) for men and 60 to 64 Years (194 | 17.8%) for women.
| Age Bracket | Male | Female |
| Under 5 Years | 0 (0.0%) | 0 (0.0%) |
| 5 to 9 Years | 0 (0.0%) | 0 (0.0%) |
| 10 to 14 Years | 0 (0.0%) | 0 (0.0%) |
| 15 to 19 Years | 0 (0.0%) | 0 (0.0%) |
| 20 to 24 Years | 0 (0.0%) | 63 (5.8%) |
| 25 to 29 Years | 143 (14.1%) | 0 (0.0%) |
| 30 to 34 Years | 74 (7.3%) | 0 (0.0%) |
| 35 to 39 Years | 0 (0.0%) | 0 (0.0%) |
| 40 to 44 Years | 0 (0.0%) | 8 (0.7%) |
| 45 to 49 Years | 3 (0.3%) | 0 (0.0%) |
| 50 to 54 Years | 65 (6.4%) | 118 (10.8%) |
| 55 to 59 Years | 31 (3.1%) | 26 (2.4%) |
| 60 to 64 Years | 51 (5.0%) | 194 (17.8%) |
| 65 to 69 Years | 104 (10.3%) | 181 (16.6%) |
| 70 to 74 Years | 208 (20.6%) | 129 (11.8%) |
| 75 to 79 Years | 163 (16.1%) | 152 (13.9%) |
| 80 to 84 Years | 61 (6.0%) | 130 (11.9%) |
| 85 Years and over | 108 (10.7%) | 89 (8.2%) |
| Total | 1,011 (100.0%) | 1,090 (100.0%) |
Families and Households in Wabasso Beach
Median Family Size in Wabasso Beach
The median family size in Wabasso Beach is 2.50 persons per family, with single female/mother families (91 | 12.5%) accounting for the largest median family size of 3.63 persons per family. On the other hand, married-couple families (604 | 83.0%) represent the smallest median family size with 2.28 persons per family.
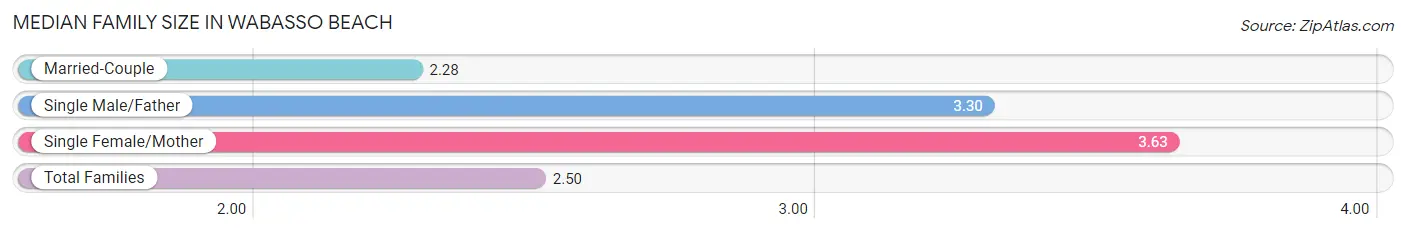
| Family Type | # Families | Family Size |
| Married-Couple | 604 (83.0%) | 2.28 |
| Single Male/Father | 33 (4.5%) | 3.30 |
| Single Female/Mother | 91 (12.5%) | 3.63 |
| Total Families | 728 (100.0%) | 2.50 |
Median Household Size in Wabasso Beach
The median household size in Wabasso Beach is 2.20 persons per household, with single male/father households (33 | 3.5%) accounting for the largest median household size of 4.36 persons per household. non-family households (225 | 23.6%) represent the smallest median household size with 1.07 persons per household.
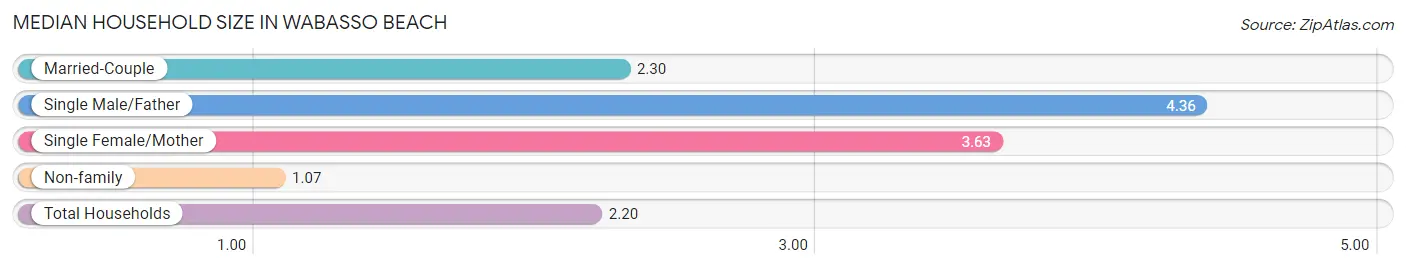
| Household Type | # Households | Household Size |
| Married-Couple | 604 (63.4%) | 2.30 |
| Single Male/Father | 33 (3.5%) | 4.36 |
| Single Female/Mother | 91 (9.6%) | 3.63 |
| Non-family | 225 (23.6%) | 1.07 |
| Total Households | 953 (100.0%) | 2.20 |
Household Size by Marriage Status in Wabasso Beach
Out of a total of 953 households in Wabasso Beach, 728 (76.4%) are family households, while 225 (23.6%) are nonfamily households. The most numerous type of family households are 2-person households, comprising 589, and the most common type of nonfamily households are 1-person households, comprising 211.
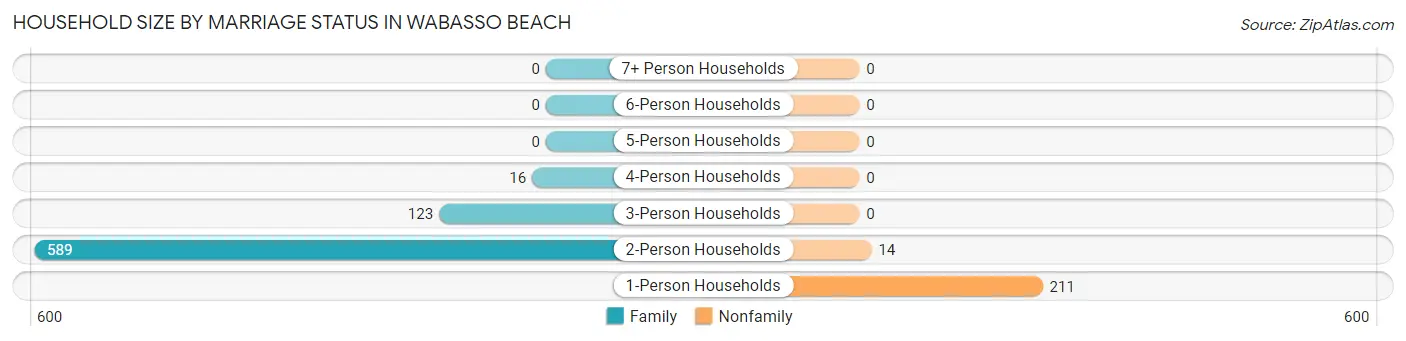
| Household Size | Family Households | Nonfamily Households |
| 1-Person Households | - | 211 (22.1%) |
| 2-Person Households | 589 (61.8%) | 14 (1.5%) |
| 3-Person Households | 123 (12.9%) | 0 (0.0%) |
| 4-Person Households | 16 (1.7%) | 0 (0.0%) |
| 5-Person Households | 0 (0.0%) | 0 (0.0%) |
| 6-Person Households | 0 (0.0%) | 0 (0.0%) |
| 7+ Person Households | 0 (0.0%) | 0 (0.0%) |
| Total | 728 (76.4%) | 225 (23.6%) |
Female Fertility in Wabasso Beach
Fertility by Age in Wabasso Beach
| Age Bracket | Women with Births | Births / 1,000 Women |
| 15 to 19 years | 0 (0.0%) | 0.0 |
| 20 to 34 years | 0 (0.0%) | 0.0 |
| 35 to 50 years | 0 (0.0%) | 0.0 |
| Total | 0 (0.0%) | 0.0 |
Fertility by Age by Marriage Status in Wabasso Beach
| Age Bracket | Married | Unmarried |
| 15 to 19 years | 0 (0.0%) | 0 (0.0%) |
| 20 to 34 years | 0 (0.0%) | 0 (0.0%) |
| 35 to 50 years | 0 (0.0%) | 0 (0.0%) |
| Total | 0 (0.0%) | 0 (0.0%) |
Fertility by Education in Wabasso Beach
| Educational Attainment | Women with Births | Births / 1,000 Women |
| Less than High School | 0 (0.0%) | 0.0 |
| High School Diploma | 0 (0.0%) | 0.0 |
| College or Associate's Degree | 0 (0.0%) | 0.0 |
| Bachelor's Degree | 0 (0.0%) | 0.0 |
| Graduate Degree | 0 (0.0%) | 0.0 |
| Total | 0 (0.0%) | 0.0 |
Fertility by Education by Marriage Status in Wabasso Beach
| Educational Attainment | Married | Unmarried |
| Less than High School | 0 (0.0%) | 0 (0.0%) |
| High School Diploma | 0 (0.0%) | 0 (0.0%) |
| College or Associate's Degree | 0 (0.0%) | 0 (0.0%) |
| Bachelor's Degree | 0 (0.0%) | 0 (0.0%) |
| Graduate Degree | 0 (0.0%) | 0 (0.0%) |
| Total | 0 (0.0%) | 0 (0.0%) |
Employment Characteristics in Wabasso Beach
Employment by Class of Employer in Wabasso Beach
Among the 614 employed individuals in Wabasso Beach, private company employees (415 | 67.6%), self-employed (incorporated) (75 | 12.2%), and not-for-profit organizations (63 | 10.3%) make up the most common classes of employment.
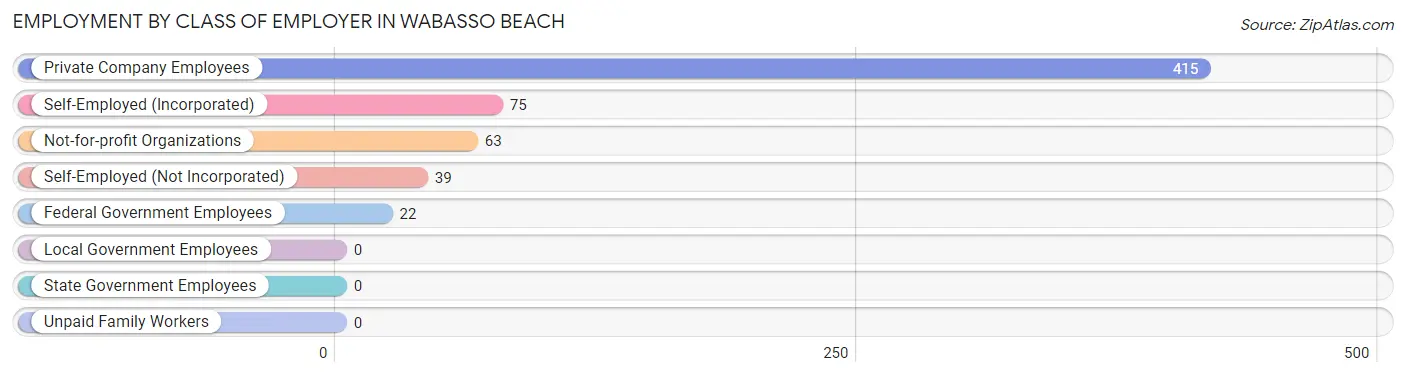
| Employer Class | # Employees | % Employees |
| Private Company Employees | 415 | 67.6% |
| Self-Employed (Incorporated) | 75 | 12.2% |
| Self-Employed (Not Incorporated) | 39 | 6.4% |
| Not-for-profit Organizations | 63 | 10.3% |
| Local Government Employees | 0 | 0.0% |
| State Government Employees | 0 | 0.0% |
| Federal Government Employees | 22 | 3.6% |
| Unpaid Family Workers | 0 | 0.0% |
| Total | 614 | 100.0% |
Employment Status by Age in Wabasso Beach
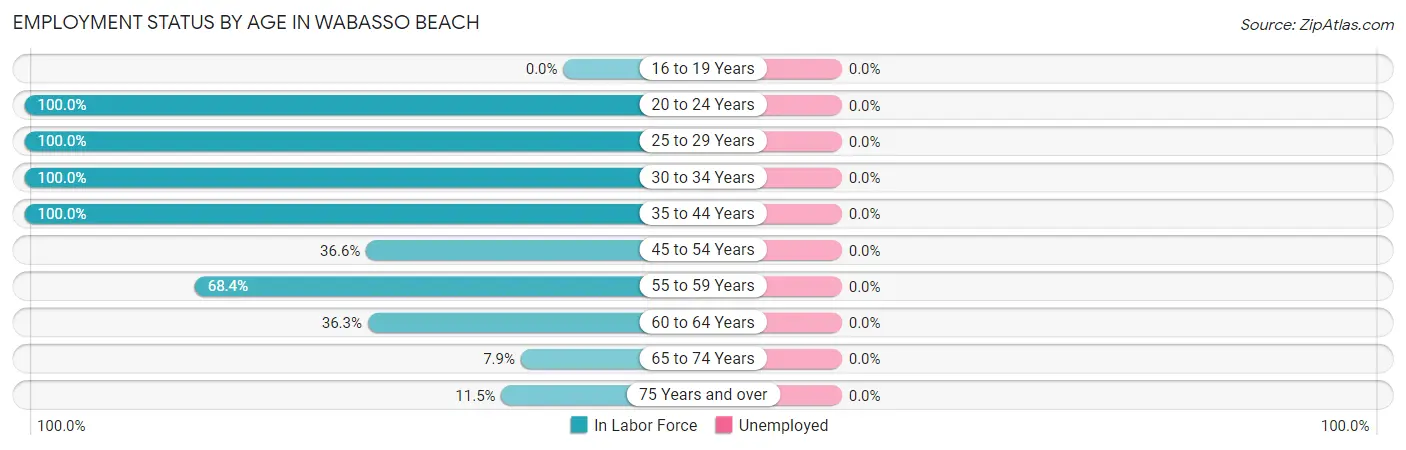
| Age Bracket | In Labor Force | Unemployed |
| 16 to 19 Years | 0 (0.0%) | 0 (0.0%) |
| 20 to 24 Years | 63 (100.0%) | 0 (0.0%) |
| 25 to 29 Years | 143 (100.0%) | 0 (0.0%) |
| 30 to 34 Years | 74 (100.0%) | 0 (0.0%) |
| 35 to 44 Years | 8 (100.0%) | 0 (0.0%) |
| 45 to 54 Years | 68 (36.6%) | 0 (0.0%) |
| 55 to 59 Years | 39 (68.4%) | 0 (0.0%) |
| 60 to 64 Years | 89 (36.3%) | 0 (0.0%) |
| 65 to 74 Years | 49 (7.9%) | 0 (0.0%) |
| 75 Years and over | 81 (11.5%) | 0 (0.0%) |
| Total | 613 (29.2%) | 0 (0.0%) |
Employment Status by Educational Attainment in Wabasso Beach
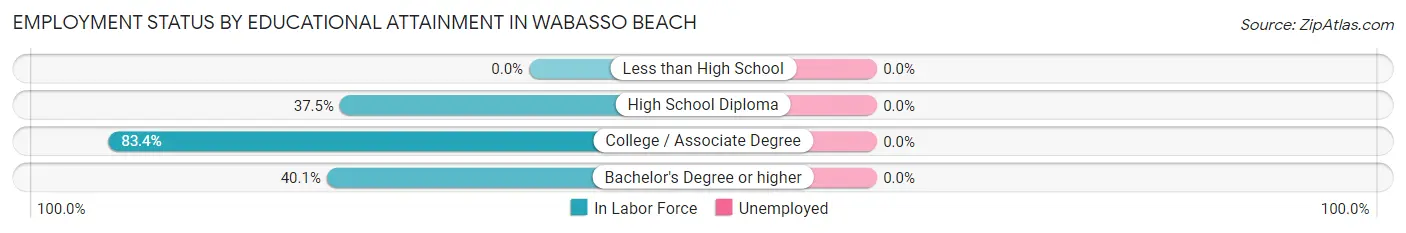
| Educational Attainment | In Labor Force | Unemployed |
| Less than High School | 0 (0.0%) | 0 (0.0%) |
| High School Diploma | 90 (37.5%) | 0 (0.0%) |
| College / Associate Degree | 272 (83.4%) | 0 (0.0%) |
| Bachelor's Degree or higher | 59 (40.1%) | 0 (0.0%) |
| Total | 421 (59.0%) | 0 (0.0%) |
Employment Occupations by Sex in Wabasso Beach
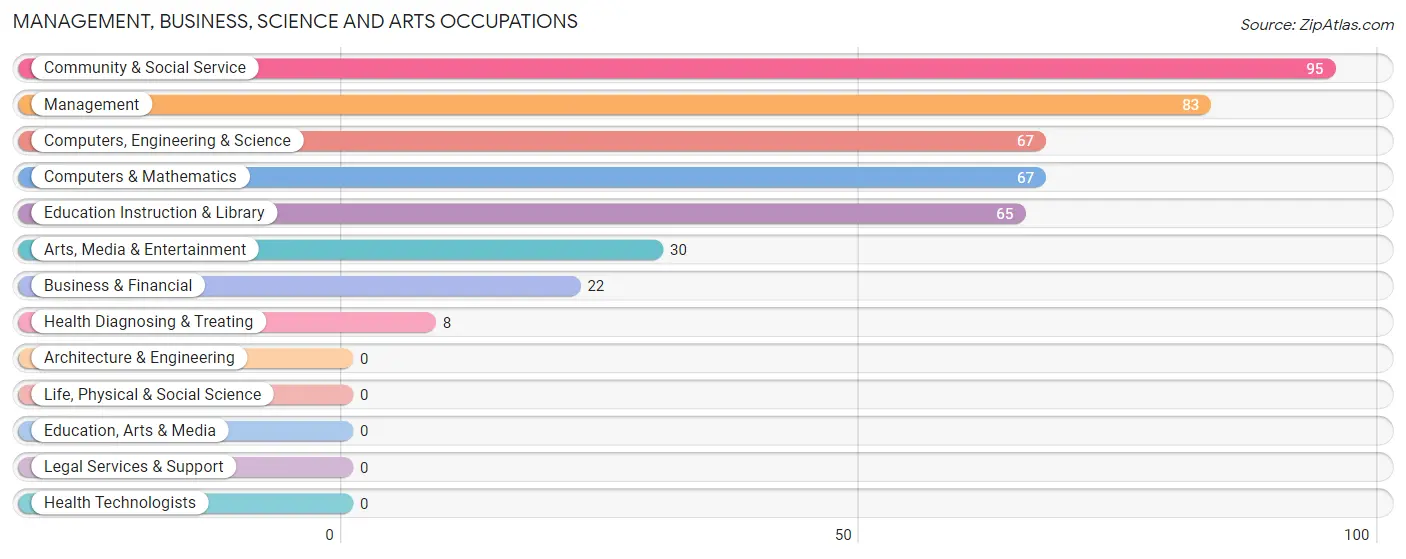
Management, Business, Science and Arts Occupations
The most common Management, Business, Science and Arts occupations in Wabasso Beach are Community & Social Service (95 | 15.5%), Management (83 | 13.5%), Computers, Engineering & Science (67 | 10.9%), Computers & Mathematics (67 | 10.9%), and Education Instruction & Library (65 | 10.6%).
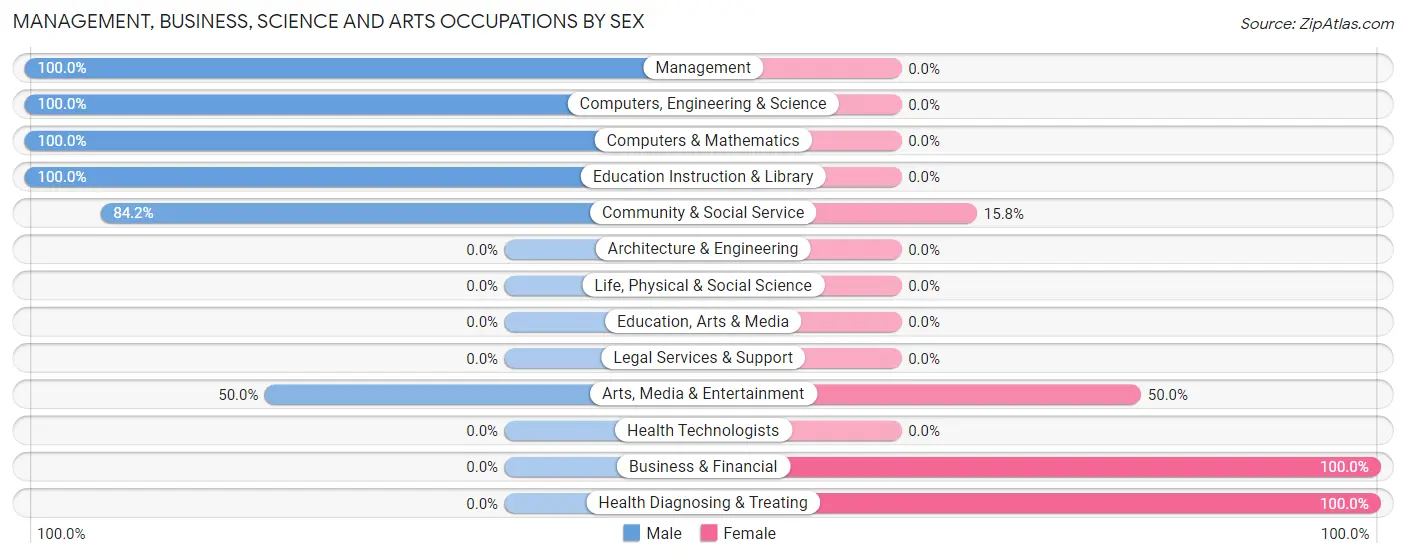
Management, Business, Science and Arts Occupations by Sex
Within the Management, Business, Science and Arts occupations in Wabasso Beach, the most male-oriented occupations are Management (100.0%), Computers, Engineering & Science (100.0%), and Computers & Mathematics (100.0%), while the most female-oriented occupations are Business & Financial (100.0%), Health Diagnosing & Treating (100.0%), and Arts, Media & Entertainment (50.0%).
| Occupation | Male | Female |
| Management | 83 (100.0%) | 0 (0.0%) |
| Business & Financial | 0 (0.0%) | 22 (100.0%) |
| Computers, Engineering & Science | 67 (100.0%) | 0 (0.0%) |
| Computers & Mathematics | 67 (100.0%) | 0 (0.0%) |
| Architecture & Engineering | 0 (0.0%) | 0 (0.0%) |
| Life, Physical & Social Science | 0 (0.0%) | 0 (0.0%) |
| Community & Social Service | 80 (84.2%) | 15 (15.8%) |
| Education, Arts & Media | 0 (0.0%) | 0 (0.0%) |
| Legal Services & Support | 0 (0.0%) | 0 (0.0%) |
| Education Instruction & Library | 65 (100.0%) | 0 (0.0%) |
| Arts, Media & Entertainment | 15 (50.0%) | 15 (50.0%) |
| Health Diagnosing & Treating | 0 (0.0%) | 8 (100.0%) |
| Health Technologists | 0 (0.0%) | 0 (0.0%) |
| Total (Category) | 230 (83.6%) | 45 (16.4%) |
| Total (Overall) | 452 (73.6%) | 162 (26.4%) |
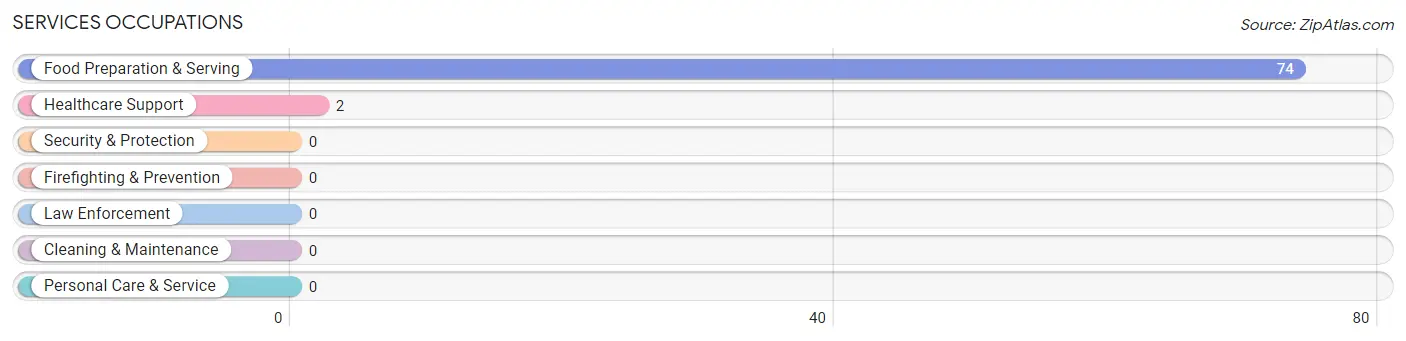
Services Occupations
The most common Services occupations in Wabasso Beach are Food Preparation & Serving (74 | 12.0%), and Healthcare Support (2 | 0.3%).
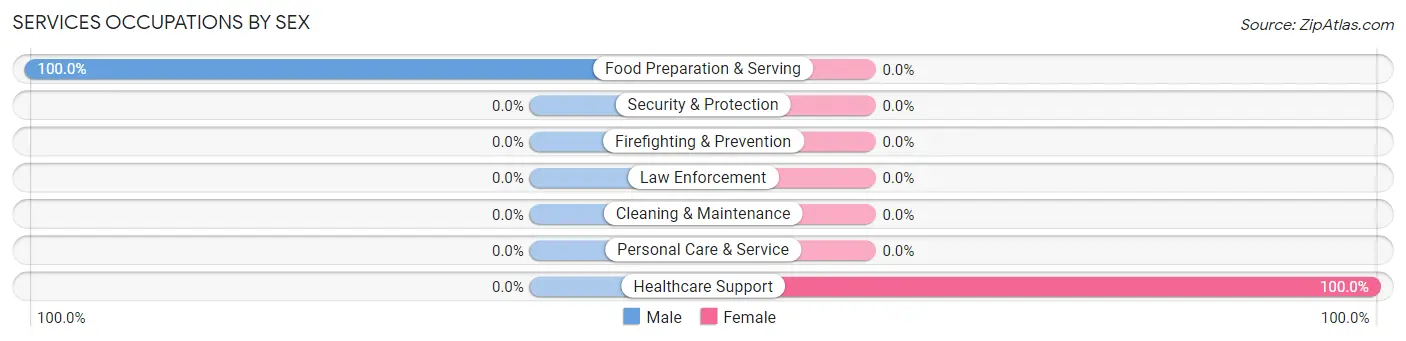
Services Occupations by Sex
| Occupation | Male | Female |
| Healthcare Support | 0 (0.0%) | 2 (100.0%) |
| Security & Protection | 0 (0.0%) | 0 (0.0%) |
| Firefighting & Prevention | 0 (0.0%) | 0 (0.0%) |
| Law Enforcement | 0 (0.0%) | 0 (0.0%) |
| Food Preparation & Serving | 74 (100.0%) | 0 (0.0%) |
| Cleaning & Maintenance | 0 (0.0%) | 0 (0.0%) |
| Personal Care & Service | 0 (0.0%) | 0 (0.0%) |
| Total (Category) | 74 (97.4%) | 2 (2.6%) |
| Total (Overall) | 452 (73.6%) | 162 (26.4%) |
Sales and Office Occupations
The most common Sales and Office occupations in Wabasso Beach are Sales & Related (186 | 30.3%), and Office & Administration (63 | 10.3%).
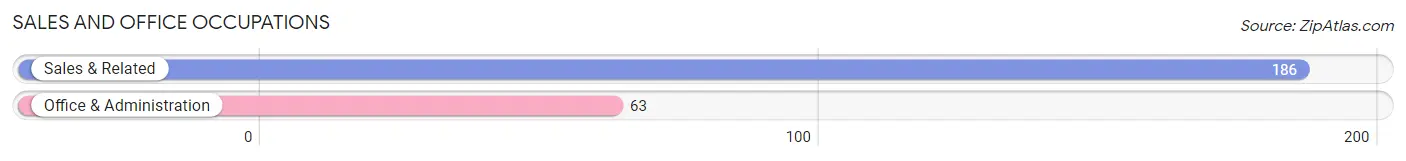
Sales and Office Occupations by Sex

| Occupation | Male | Female |
| Sales & Related | 134 (72.0%) | 52 (28.0%) |
| Office & Administration | 0 (0.0%) | 63 (100.0%) |
| Total (Category) | 134 (53.8%) | 115 (46.2%) |
| Total (Overall) | 452 (73.6%) | 162 (26.4%) |
Natural Resources, Construction and Maintenance Occupations
The most common Natural Resources, Construction and Maintenance occupations in Wabasso Beach are , and Installation, Maintenance & Repair (14 | 2.3%).
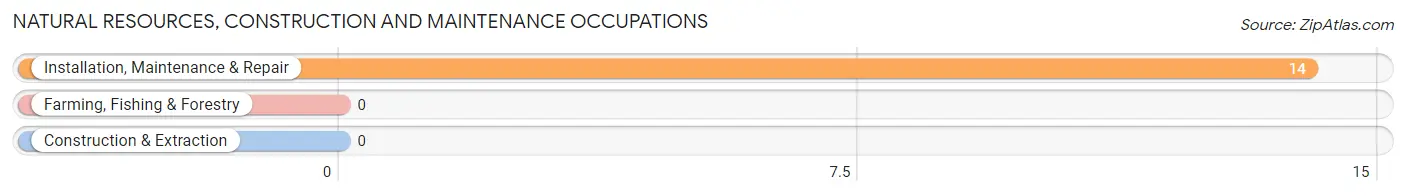
Natural Resources, Construction and Maintenance Occupations by Sex
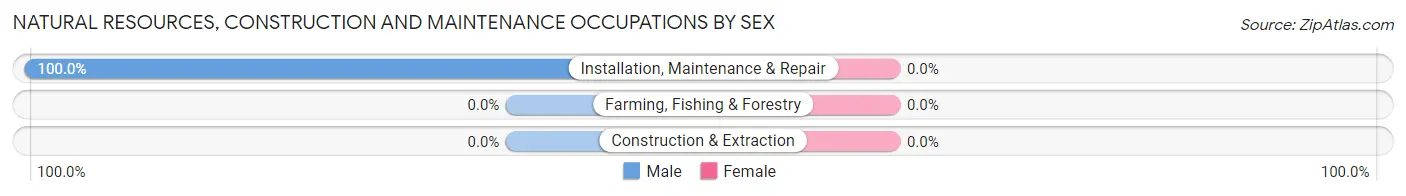
| Occupation | Male | Female |
| Farming, Fishing & Forestry | 0 (0.0%) | 0 (0.0%) |
| Construction & Extraction | 0 (0.0%) | 0 (0.0%) |
| Installation, Maintenance & Repair | 14 (100.0%) | 0 (0.0%) |
| Total (Category) | 14 (100.0%) | 0 (0.0%) |
| Total (Overall) | 452 (73.6%) | 162 (26.4%) |
Production, Transportation and Moving Occupations
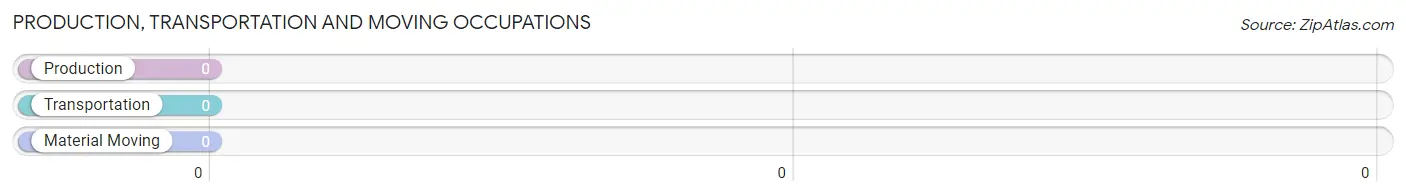
Production, Transportation and Moving Occupations by Sex
| Occupation | Male | Female |
| Production | 0 (0.0%) | 0 (0.0%) |
| Transportation | 0 (0.0%) | 0 (0.0%) |
| Material Moving | 0 (0.0%) | 0 (0.0%) |
| Total (Category) | 0 (0.0%) | 0 (0.0%) |
| Total (Overall) | 452 (73.6%) | 162 (26.4%) |
Employment Industries by Sex in Wabasso Beach
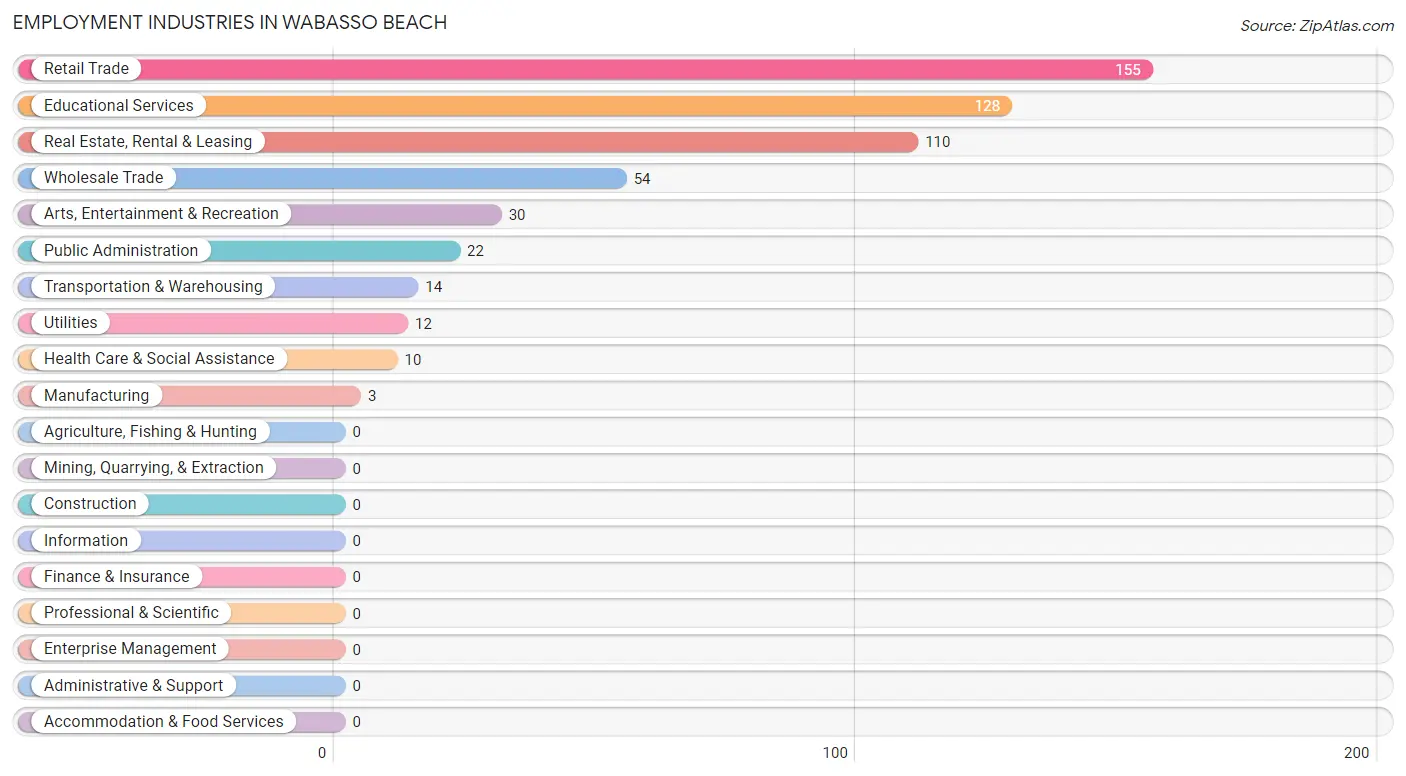
Employment Industries in Wabasso Beach
The major employment industries in Wabasso Beach include Retail Trade (155 | 25.2%), Educational Services (128 | 20.8%), Real Estate, Rental & Leasing (110 | 17.9%), Wholesale Trade (54 | 8.8%), and Arts, Entertainment & Recreation (30 | 4.9%).
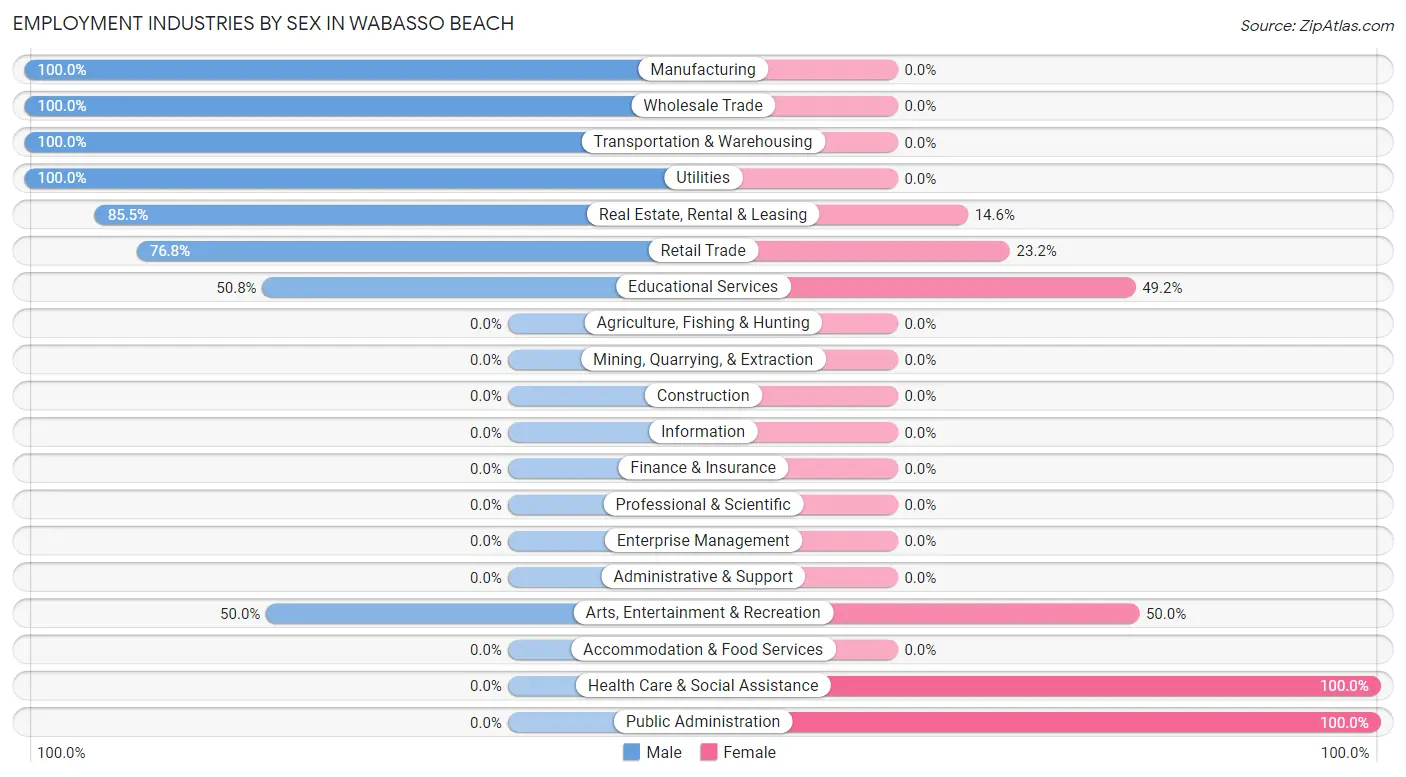
Employment Industries by Sex in Wabasso Beach
The Wabasso Beach industries that see more men than women are Manufacturing (100.0%), Wholesale Trade (100.0%), and Transportation & Warehousing (100.0%), whereas the industries that tend to have a higher number of women are Health Care & Social Assistance (100.0%), Public Administration (100.0%), and Arts, Entertainment & Recreation (50.0%).
| Industry | Male | Female |
| Agriculture, Fishing & Hunting | 0 (0.0%) | 0 (0.0%) |
| Mining, Quarrying, & Extraction | 0 (0.0%) | 0 (0.0%) |
| Construction | 0 (0.0%) | 0 (0.0%) |
| Manufacturing | 3 (100.0%) | 0 (0.0%) |
| Wholesale Trade | 54 (100.0%) | 0 (0.0%) |
| Retail Trade | 119 (76.8%) | 36 (23.2%) |
| Transportation & Warehousing | 14 (100.0%) | 0 (0.0%) |
| Utilities | 12 (100.0%) | 0 (0.0%) |
| Information | 0 (0.0%) | 0 (0.0%) |
| Finance & Insurance | 0 (0.0%) | 0 (0.0%) |
| Real Estate, Rental & Leasing | 94 (85.5%) | 16 (14.5%) |
| Professional & Scientific | 0 (0.0%) | 0 (0.0%) |
| Enterprise Management | 0 (0.0%) | 0 (0.0%) |
| Administrative & Support | 0 (0.0%) | 0 (0.0%) |
| Educational Services | 65 (50.8%) | 63 (49.2%) |
| Health Care & Social Assistance | 0 (0.0%) | 10 (100.0%) |
| Arts, Entertainment & Recreation | 15 (50.0%) | 15 (50.0%) |
| Accommodation & Food Services | 0 (0.0%) | 0 (0.0%) |
| Public Administration | 0 (0.0%) | 22 (100.0%) |
| Total | 452 (73.6%) | 162 (26.4%) |
Education in Wabasso Beach
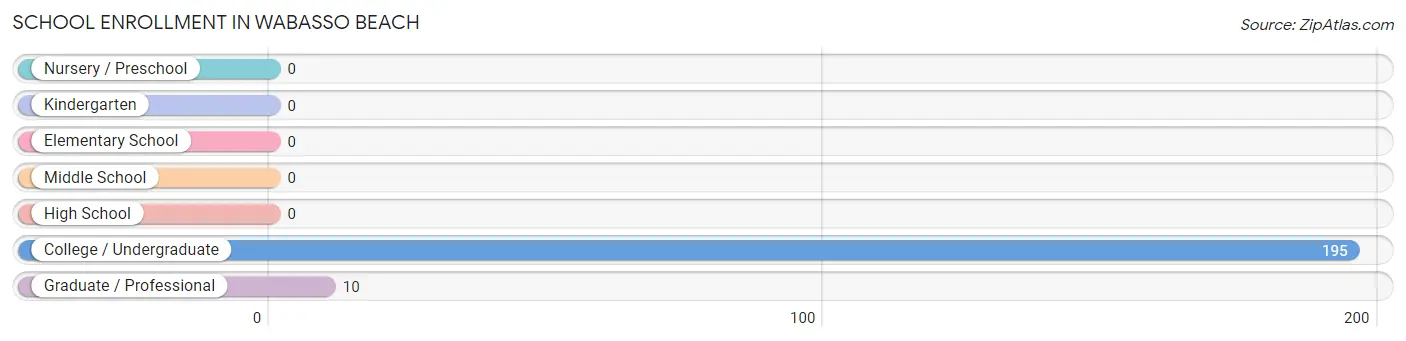
School Enrollment in Wabasso Beach
The most common levels of schooling among the 205 students in Wabasso Beach are college / undergraduate (195 | 95.1%), and graduate / professional (10 | 4.9%).
| School Level | # Students | % Students |
| Nursery / Preschool | 0 | 0.0% |
| Kindergarten | 0 | 0.0% |
| Elementary School | 0 | 0.0% |
| Middle School | 0 | 0.0% |
| High School | 0 | 0.0% |
| College / Undergraduate | 195 | 95.1% |
| Graduate / Professional | 10 | 4.9% |
| Total | 205 | 100.0% |
School Enrollment by Age by Funding Source in Wabasso Beach
Out of a total of 205 students who are enrolled in schools in Wabasso Beach, 7 (3.4%) attend a private institution, while the remaining 198 (96.6%) are enrolled in public schools. The age group of 35 years and over has the highest likelihood of being enrolled in private schools, with 7 (9.3% in the age bracket) enrolled. Conversely, the age group of 20 to 24 year olds has the lowest likelihood of being enrolled in a private school, with 63 (100.0% in the age bracket) attending a public institution.
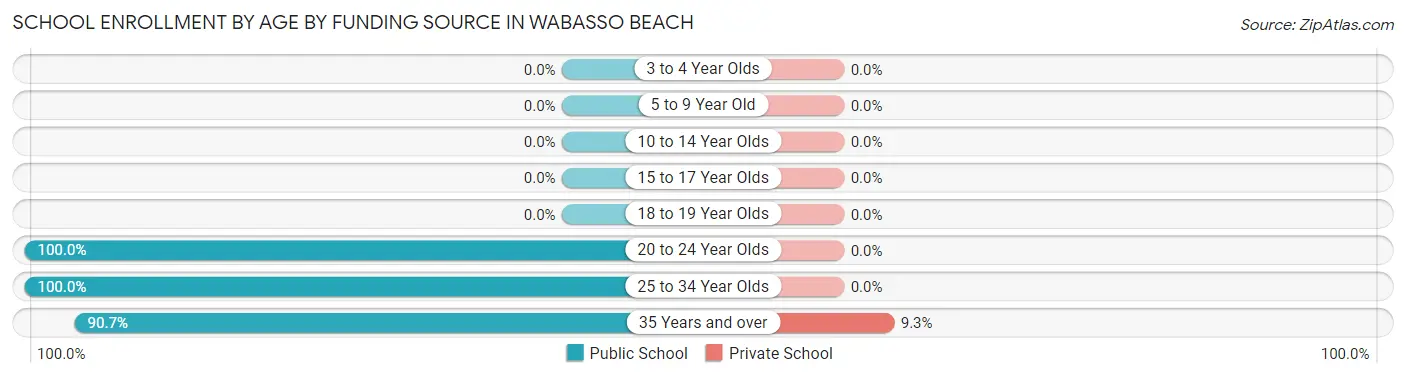
| Age Bracket | Public School | Private School |
| 3 to 4 Year Olds | 0 (0.0%) | 0 (0.0%) |
| 5 to 9 Year Old | 0 (0.0%) | 0 (0.0%) |
| 10 to 14 Year Olds | 0 (0.0%) | 0 (0.0%) |
| 15 to 17 Year Olds | 0 (0.0%) | 0 (0.0%) |
| 18 to 19 Year Olds | 0 (0.0%) | 0 (0.0%) |
| 20 to 24 Year Olds | 63 (100.0%) | 0 (0.0%) |
| 25 to 34 Year Olds | 67 (100.0%) | 0 (0.0%) |
| 35 Years and over | 68 (90.7%) | 7 (9.3%) |
| Total | 198 (96.6%) | 7 (3.4%) |
Educational Attainment by Field of Study in Wabasso Beach
Business (190 | 18.9%), education (163 | 16.2%), social sciences (157 | 15.6%), science & technology (103 | 10.2%), and arts & humanities (97 | 9.7%) are the most common fields of study among 1,005 individuals in Wabasso Beach who have obtained a bachelor's degree or higher.
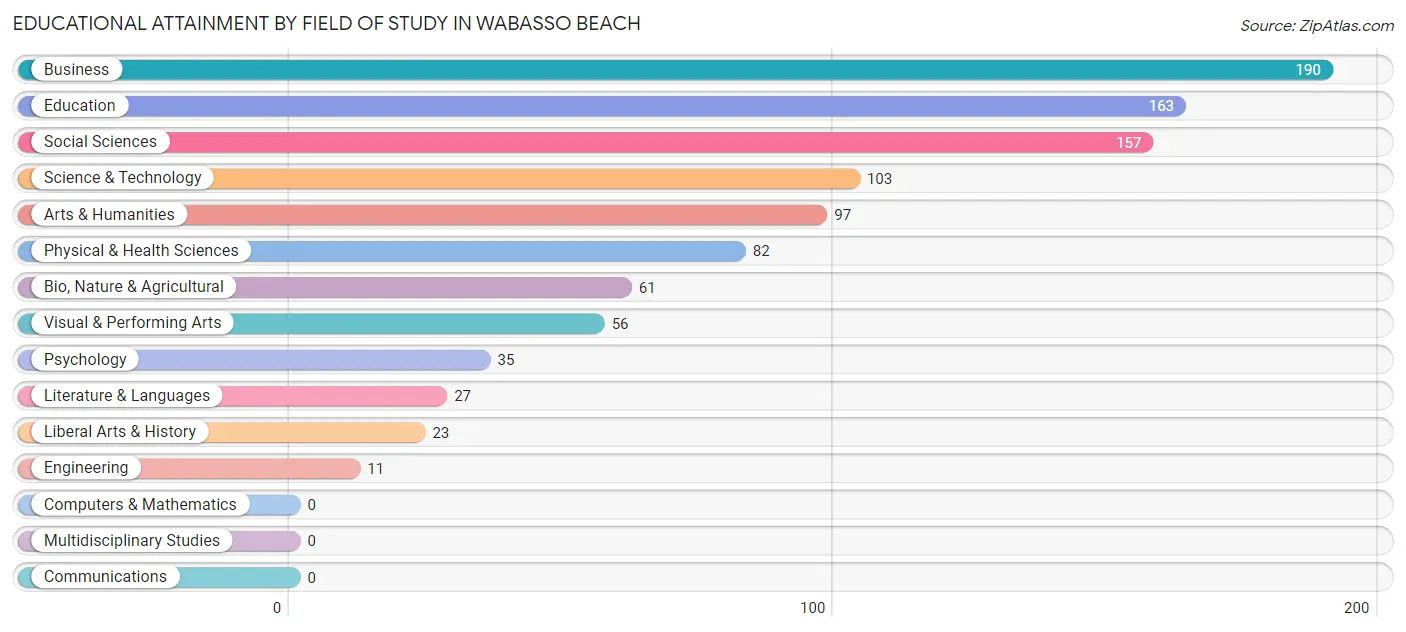
| Field of Study | # Graduates | % Graduates |
| Computers & Mathematics | 0 | 0.0% |
| Bio, Nature & Agricultural | 61 | 6.1% |
| Physical & Health Sciences | 82 | 8.2% |
| Psychology | 35 | 3.5% |
| Social Sciences | 157 | 15.6% |
| Engineering | 11 | 1.1% |
| Multidisciplinary Studies | 0 | 0.0% |
| Science & Technology | 103 | 10.2% |
| Business | 190 | 18.9% |
| Education | 163 | 16.2% |
| Literature & Languages | 27 | 2.7% |
| Liberal Arts & History | 23 | 2.3% |
| Visual & Performing Arts | 56 | 5.6% |
| Communications | 0 | 0.0% |
| Arts & Humanities | 97 | 9.7% |
| Total | 1,005 | 100.0% |
Transportation & Commute in Wabasso Beach
Vehicle Availability by Sex in Wabasso Beach
The most prevalent vehicle ownership categories in Wabasso Beach are males with 3 vehicles (268, accounting for 59.3%) and females with 3 vehicles (51, making up 165.4%).
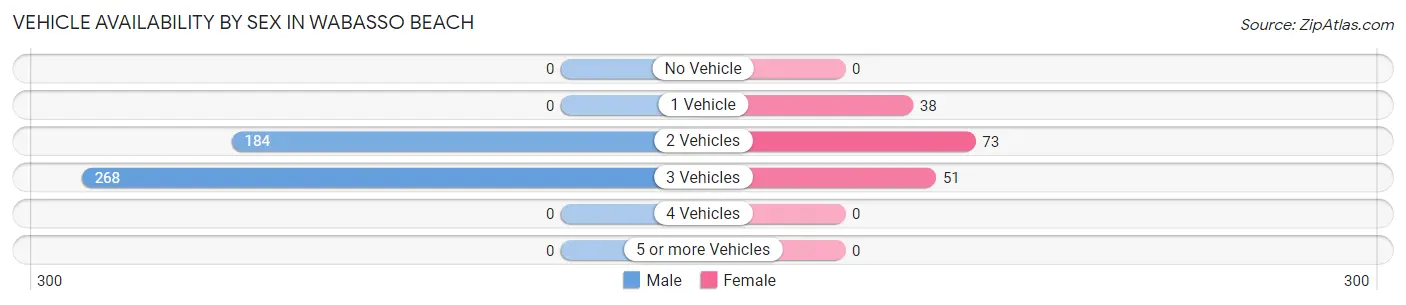
| Vehicles Available | Male | Female |
| No Vehicle | 0 (0.0%) | 0 (0.0%) |
| 1 Vehicle | 0 (0.0%) | 38 (23.5%) |
| 2 Vehicles | 184 (40.7%) | 73 (45.1%) |
| 3 Vehicles | 268 (59.3%) | 51 (31.5%) |
| 4 Vehicles | 0 (0.0%) | 0 (0.0%) |
| 5 or more Vehicles | 0 (0.0%) | 0 (0.0%) |
| Total | 452 (100.0%) | 162 (100.0%) |
Commute Time in Wabasso Beach
The most frequently occuring commute durations in Wabasso Beach are 15 to 19 minutes (215 commuters, 35.8%), 10 to 14 minutes (171 commuters, 28.5%), and 20 to 24 minutes (153 commuters, 25.5%).
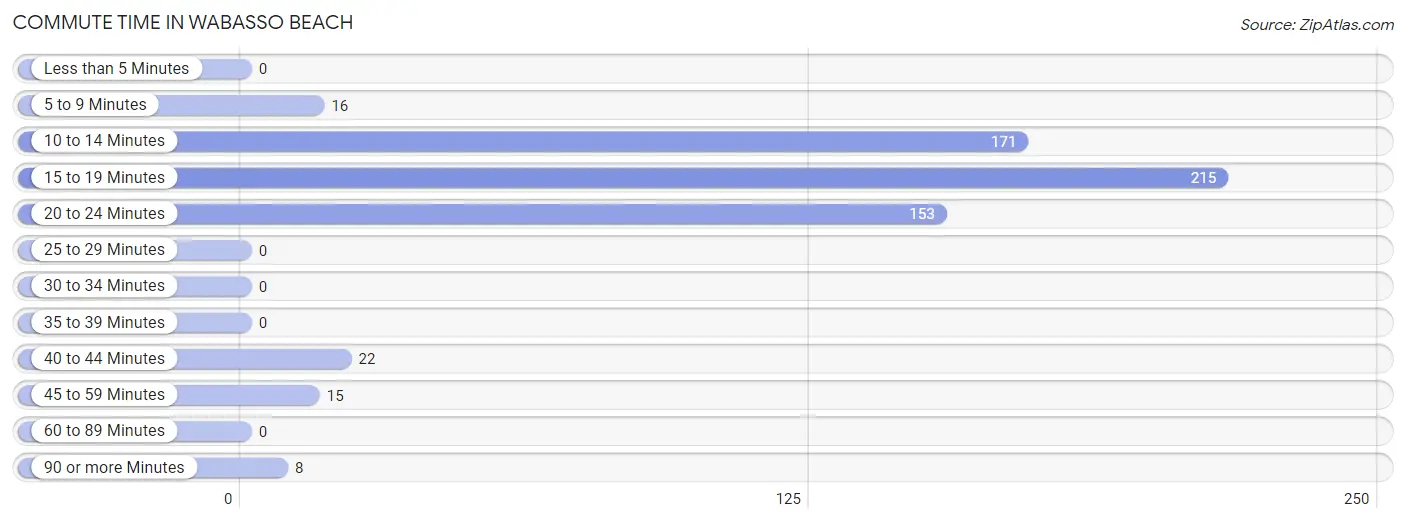
| Commute Time | # Commuters | % Commuters |
| Less than 5 Minutes | 0 | 0.0% |
| 5 to 9 Minutes | 16 | 2.7% |
| 10 to 14 Minutes | 171 | 28.5% |
| 15 to 19 Minutes | 215 | 35.8% |
| 20 to 24 Minutes | 153 | 25.5% |
| 25 to 29 Minutes | 0 | 0.0% |
| 30 to 34 Minutes | 0 | 0.0% |
| 35 to 39 Minutes | 0 | 0.0% |
| 40 to 44 Minutes | 22 | 3.7% |
| 45 to 59 Minutes | 15 | 2.5% |
| 60 to 89 Minutes | 0 | 0.0% |
| 90 or more Minutes | 8 | 1.3% |
Commute Time by Sex in Wabasso Beach
The most common commute times in Wabasso Beach are 15 to 19 minutes (215 commuters, 48.9%) for males and 10 to 14 minutes (78 commuters, 48.7%) for females.
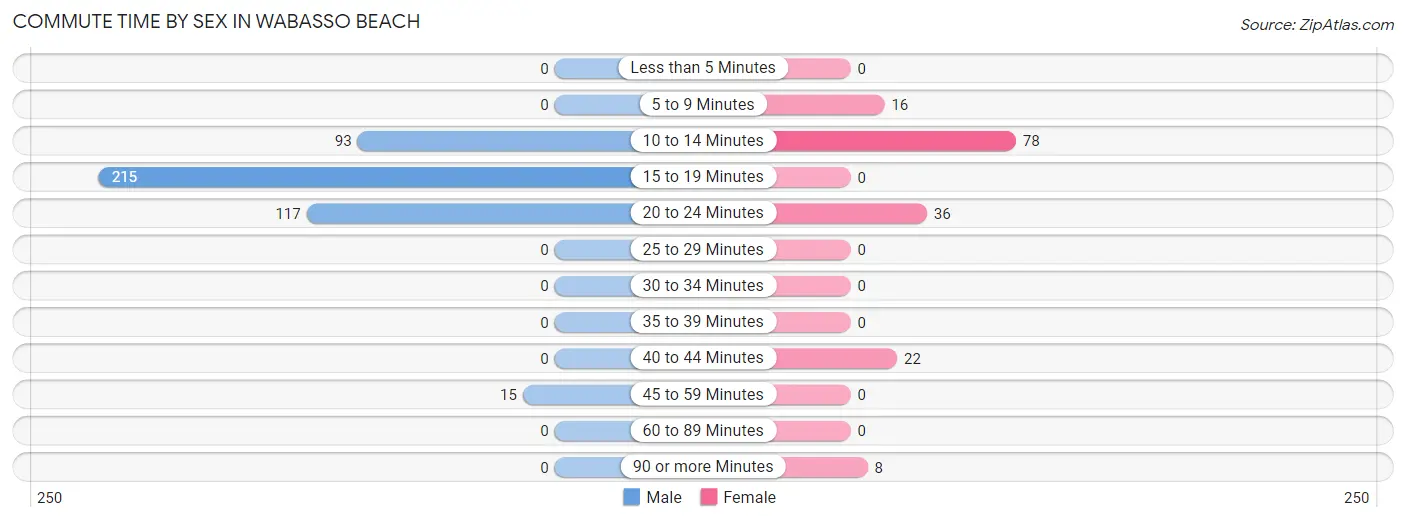
| Commute Time | Male | Female |
| Less than 5 Minutes | 0 (0.0%) | 0 (0.0%) |
| 5 to 9 Minutes | 0 (0.0%) | 16 (10.0%) |
| 10 to 14 Minutes | 93 (21.1%) | 78 (48.7%) |
| 15 to 19 Minutes | 215 (48.9%) | 0 (0.0%) |
| 20 to 24 Minutes | 117 (26.6%) | 36 (22.5%) |
| 25 to 29 Minutes | 0 (0.0%) | 0 (0.0%) |
| 30 to 34 Minutes | 0 (0.0%) | 0 (0.0%) |
| 35 to 39 Minutes | 0 (0.0%) | 0 (0.0%) |
| 40 to 44 Minutes | 0 (0.0%) | 22 (13.8%) |
| 45 to 59 Minutes | 15 (3.4%) | 0 (0.0%) |
| 60 to 89 Minutes | 0 (0.0%) | 0 (0.0%) |
| 90 or more Minutes | 0 (0.0%) | 8 (5.0%) |
Time of Departure to Work by Sex in Wabasso Beach
The most frequent times of departure to work in Wabasso Beach are 7:00 AM to 7:29 AM (130, 29.5%) for males and 12:00 PM to 3:59 PM (63, 39.4%) for females.
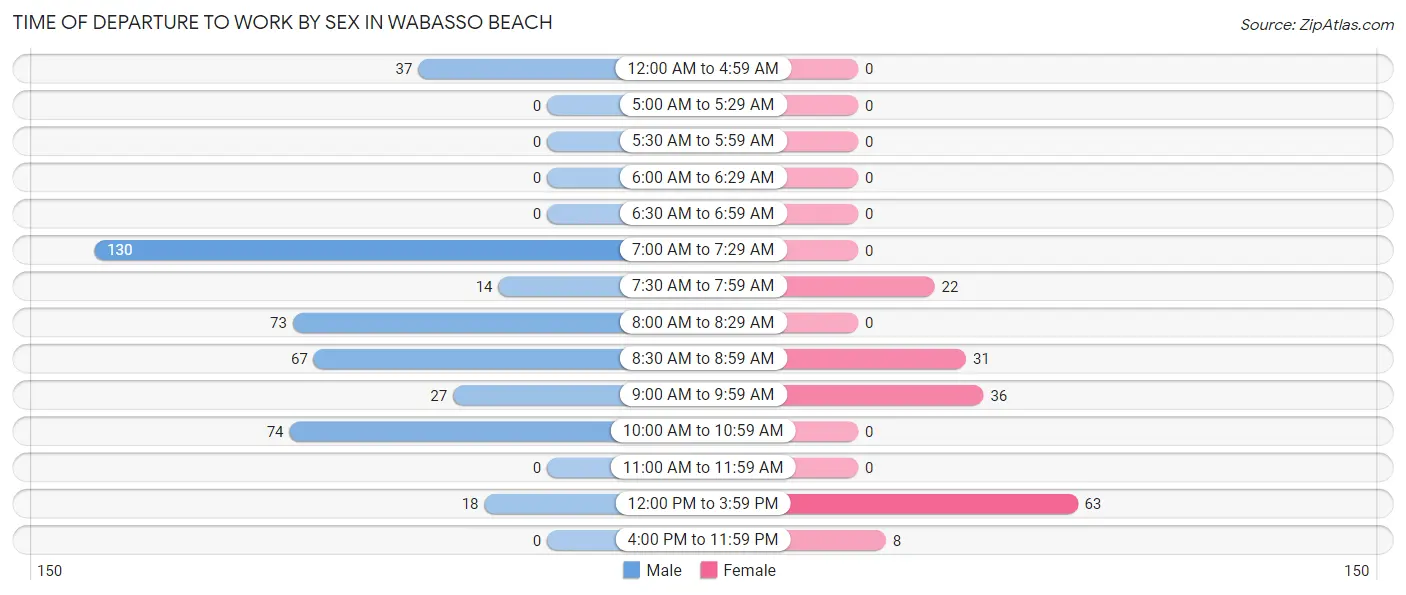
| Time of Departure | Male | Female |
| 12:00 AM to 4:59 AM | 37 (8.4%) | 0 (0.0%) |
| 5:00 AM to 5:29 AM | 0 (0.0%) | 0 (0.0%) |
| 5:30 AM to 5:59 AM | 0 (0.0%) | 0 (0.0%) |
| 6:00 AM to 6:29 AM | 0 (0.0%) | 0 (0.0%) |
| 6:30 AM to 6:59 AM | 0 (0.0%) | 0 (0.0%) |
| 7:00 AM to 7:29 AM | 130 (29.5%) | 0 (0.0%) |
| 7:30 AM to 7:59 AM | 14 (3.2%) | 22 (13.8%) |
| 8:00 AM to 8:29 AM | 73 (16.6%) | 0 (0.0%) |
| 8:30 AM to 8:59 AM | 67 (15.2%) | 31 (19.4%) |
| 9:00 AM to 9:59 AM | 27 (6.1%) | 36 (22.5%) |
| 10:00 AM to 10:59 AM | 74 (16.8%) | 0 (0.0%) |
| 11:00 AM to 11:59 AM | 0 (0.0%) | 0 (0.0%) |
| 12:00 PM to 3:59 PM | 18 (4.1%) | 63 (39.4%) |
| 4:00 PM to 11:59 PM | 0 (0.0%) | 8 (5.0%) |
| Total | 440 (100.0%) | 160 (100.0%) |
Housing Occupancy in Wabasso Beach
Occupancy by Ownership in Wabasso Beach
Of the total 953 dwellings in Wabasso Beach, owner-occupied units account for 953 (100.0%), while renter-occupied units make up 0 (0.0%).
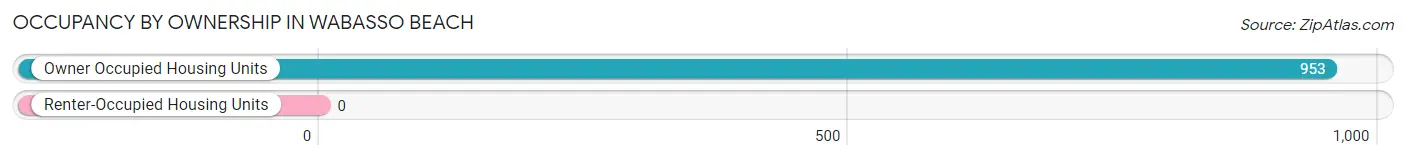
| Occupancy | # Housing Units | % Housing Units |
| Owner Occupied Housing Units | 953 | 100.0% |
| Renter-Occupied Housing Units | 0 | 0.0% |
| Total Occupied Housing Units | 953 | 100.0% |
Occupancy by Household Size in Wabasso Beach
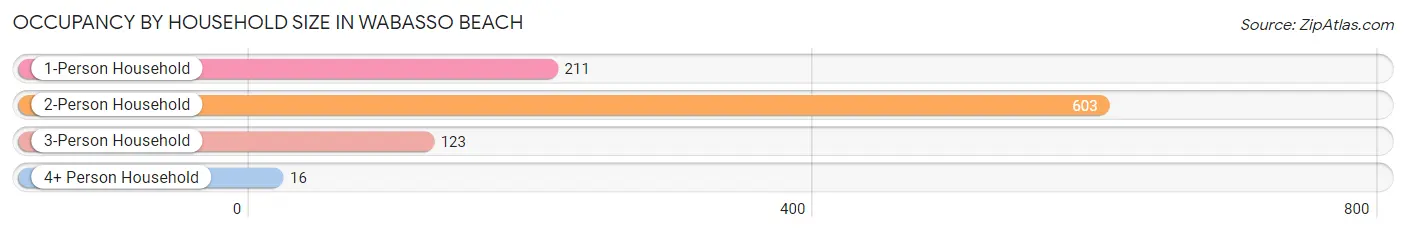
| Household Size | # Housing Units | % Housing Units |
| 1-Person Household | 211 | 22.1% |
| 2-Person Household | 603 | 63.3% |
| 3-Person Household | 123 | 12.9% |
| 4+ Person Household | 16 | 1.7% |
| Total Housing Units | 953 | 100.0% |
Occupancy by Ownership by Household Size in Wabasso Beach
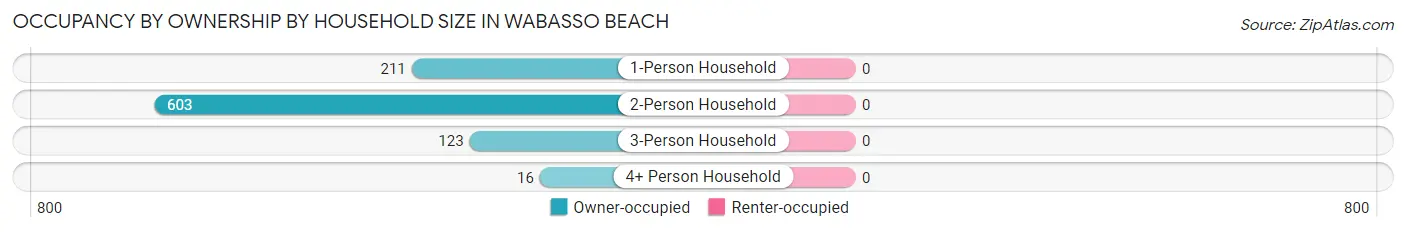
| Household Size | Owner-occupied | Renter-occupied |
| 1-Person Household | 211 (100.0%) | 0 (0.0%) |
| 2-Person Household | 603 (100.0%) | 0 (0.0%) |
| 3-Person Household | 123 (100.0%) | 0 (0.0%) |
| 4+ Person Household | 16 (100.0%) | 0 (0.0%) |
| Total Housing Units | 953 (100.0%) | 0 (0.0%) |
Occupancy by Educational Attainment in Wabasso Beach
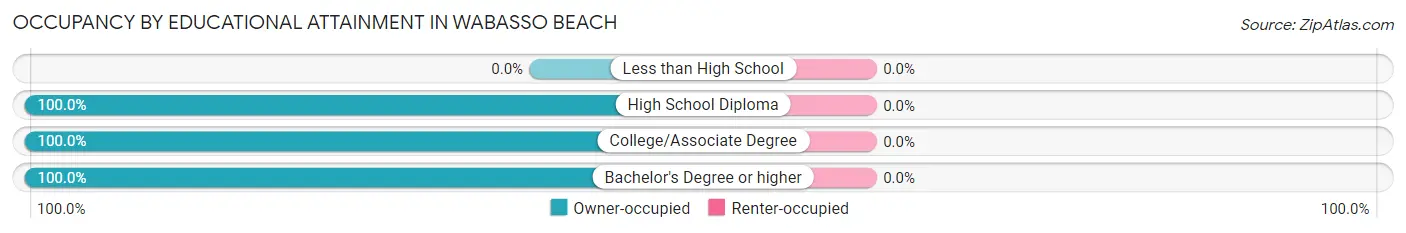
| Household Size | Owner-occupied | Renter-occupied |
| Less than High School | 0 (0.0%) | 0 (0.0%) |
| High School Diploma | 184 (100.0%) | 0 (0.0%) |
| College/Associate Degree | 161 (100.0%) | 0 (0.0%) |
| Bachelor's Degree or higher | 608 (100.0%) | 0 (0.0%) |
Occupancy by Age of Householder in Wabasso Beach
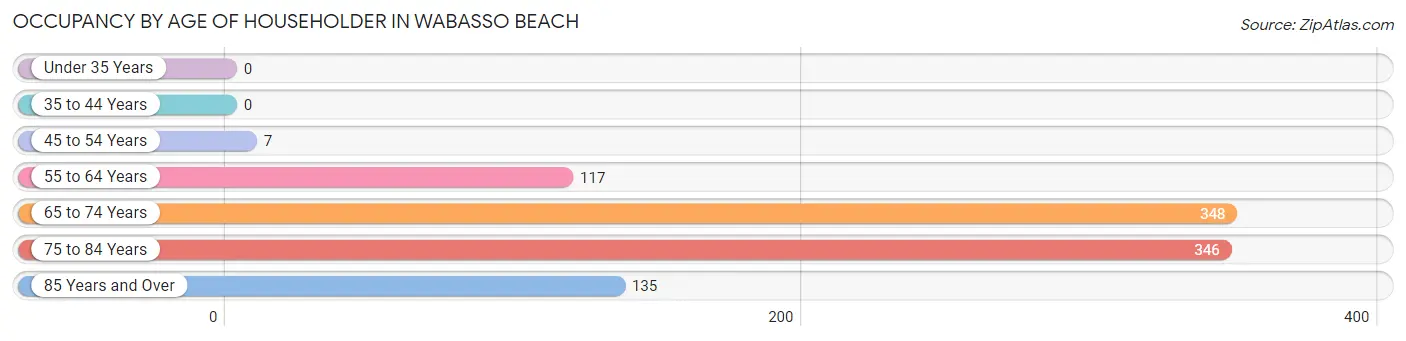
| Age Bracket | # Households | % Households |
| Under 35 Years | 0 | 0.0% |
| 35 to 44 Years | 0 | 0.0% |
| 45 to 54 Years | 7 | 0.7% |
| 55 to 64 Years | 117 | 12.3% |
| 65 to 74 Years | 348 | 36.5% |
| 75 to 84 Years | 346 | 36.3% |
| 85 Years and Over | 135 | 14.2% |
| Total | 953 | 100.0% |
Housing Finances in Wabasso Beach
Median Income by Occupancy in Wabasso Beach
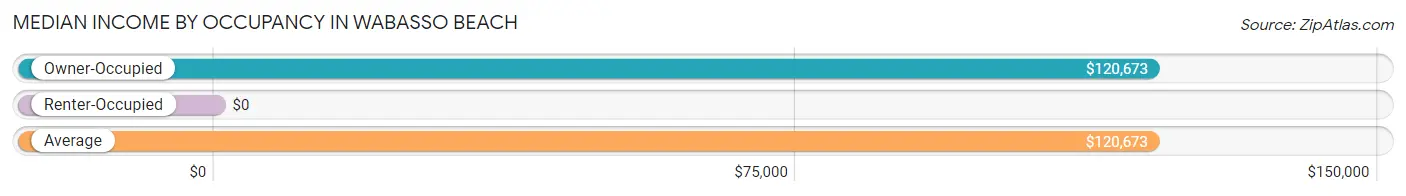
| Occupancy Type | # Households | Median Income |
| Owner-Occupied | 953 (100.0%) | $120,673 |
| Renter-Occupied | 0 (0.0%) | $0 |
| Average | 953 (100.0%) | $120,673 |
Occupancy by Householder Income Bracket in Wabasso Beach
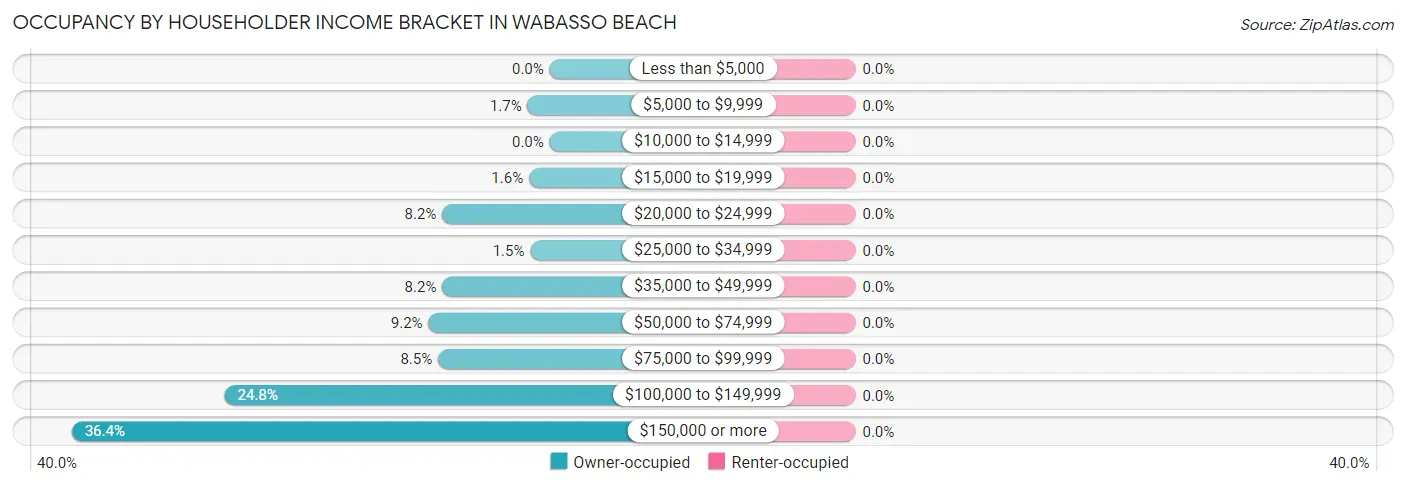
| Income Bracket | Owner-occupied | Renter-occupied |
| Less than $5,000 | 0 (0.0%) | 0 (0.0%) |
| $5,000 to $9,999 | 16 (1.7%) | 0 (0.0%) |
| $10,000 to $14,999 | 0 (0.0%) | 0 (0.0%) |
| $15,000 to $19,999 | 15 (1.6%) | 0 (0.0%) |
| $20,000 to $24,999 | 78 (8.2%) | 0 (0.0%) |
| $25,000 to $34,999 | 14 (1.5%) | 0 (0.0%) |
| $35,000 to $49,999 | 78 (8.2%) | 0 (0.0%) |
| $50,000 to $74,999 | 88 (9.2%) | 0 (0.0%) |
| $75,000 to $99,999 | 81 (8.5%) | 0 (0.0%) |
| $100,000 to $149,999 | 236 (24.8%) | 0 (0.0%) |
| $150,000 or more | 347 (36.4%) | 0 (0.0%) |
| Total | 953 (100.0%) | 0 (0.0%) |
Monthly Housing Cost Tiers in Wabasso Beach
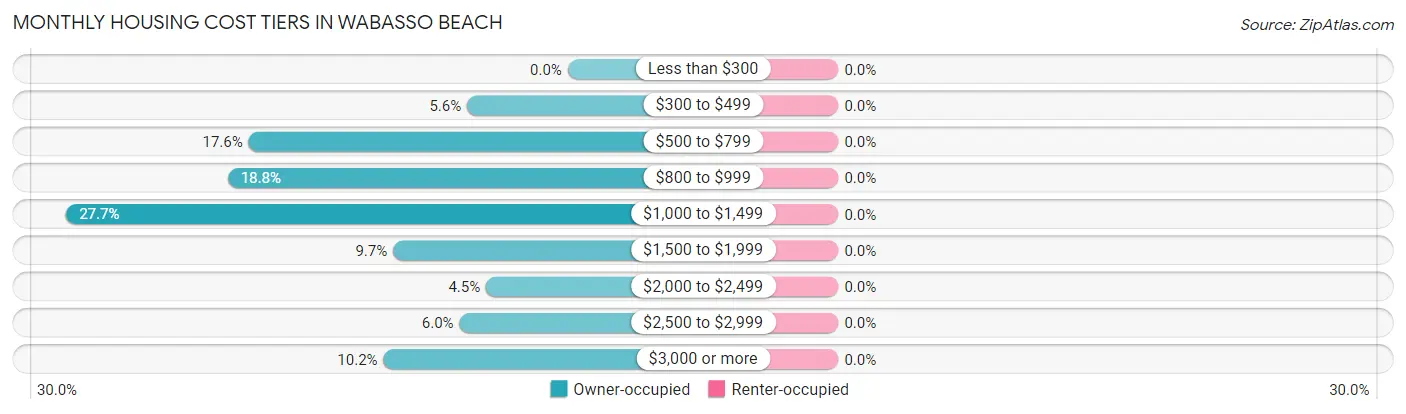
| Monthly Cost | Owner-occupied | Renter-occupied |
| Less than $300 | 0 (0.0%) | 0 (0.0%) |
| $300 to $499 | 53 (5.6%) | 0 (0.0%) |
| $500 to $799 | 168 (17.6%) | 0 (0.0%) |
| $800 to $999 | 179 (18.8%) | 0 (0.0%) |
| $1,000 to $1,499 | 264 (27.7%) | 0 (0.0%) |
| $1,500 to $1,999 | 92 (9.7%) | 0 (0.0%) |
| $2,000 to $2,499 | 43 (4.5%) | 0 (0.0%) |
| $2,500 to $2,999 | 57 (6.0%) | 0 (0.0%) |
| $3,000 or more | 97 (10.2%) | 0 (0.0%) |
| Total | 953 (100.0%) | 0 (0.0%) |
Physical Housing Characteristics in Wabasso Beach
Housing Structures in Wabasso Beach
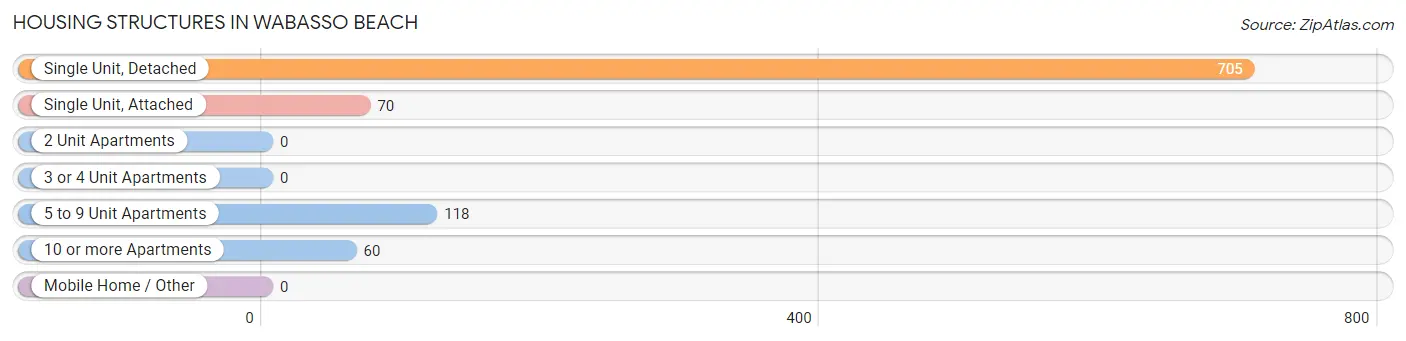
| Structure Type | # Housing Units | % Housing Units |
| Single Unit, Detached | 705 | 74.0% |
| Single Unit, Attached | 70 | 7.3% |
| 2 Unit Apartments | 0 | 0.0% |
| 3 or 4 Unit Apartments | 0 | 0.0% |
| 5 to 9 Unit Apartments | 118 | 12.4% |
| 10 or more Apartments | 60 | 6.3% |
| Mobile Home / Other | 0 | 0.0% |
| Total | 953 | 100.0% |
Housing Structures by Occupancy in Wabasso Beach
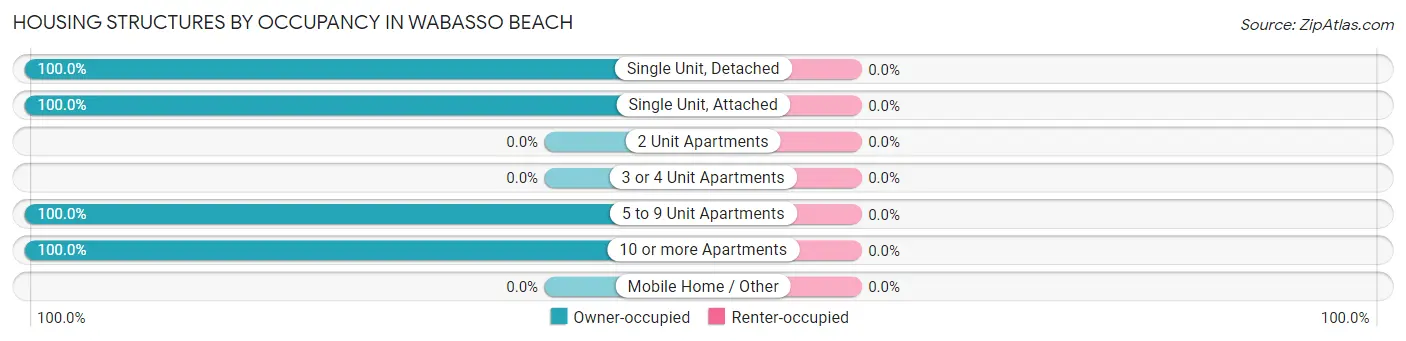
| Structure Type | Owner-occupied | Renter-occupied |
| Single Unit, Detached | 705 (100.0%) | 0 (0.0%) |
| Single Unit, Attached | 70 (100.0%) | 0 (0.0%) |
| 2 Unit Apartments | 0 (0.0%) | 0 (0.0%) |
| 3 or 4 Unit Apartments | 0 (0.0%) | 0 (0.0%) |
| 5 to 9 Unit Apartments | 118 (100.0%) | 0 (0.0%) |
| 10 or more Apartments | 60 (100.0%) | 0 (0.0%) |
| Mobile Home / Other | 0 (0.0%) | 0 (0.0%) |
| Total | 953 (100.0%) | 0 (0.0%) |
Housing Structures by Number of Rooms in Wabasso Beach
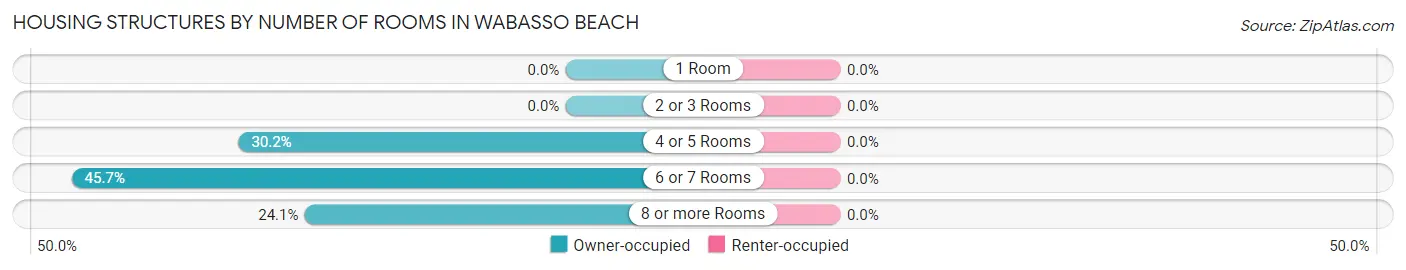
| Number of Rooms | Owner-occupied | Renter-occupied |
| 1 Room | 0 (0.0%) | 0 (0.0%) |
| 2 or 3 Rooms | 0 (0.0%) | 0 (0.0%) |
| 4 or 5 Rooms | 288 (30.2%) | 0 (0.0%) |
| 6 or 7 Rooms | 435 (45.7%) | 0 (0.0%) |
| 8 or more Rooms | 230 (24.1%) | 0 (0.0%) |
| Total | 953 (100.0%) | 0 (0.0%) |
Housing Structure by Heating Type in Wabasso Beach
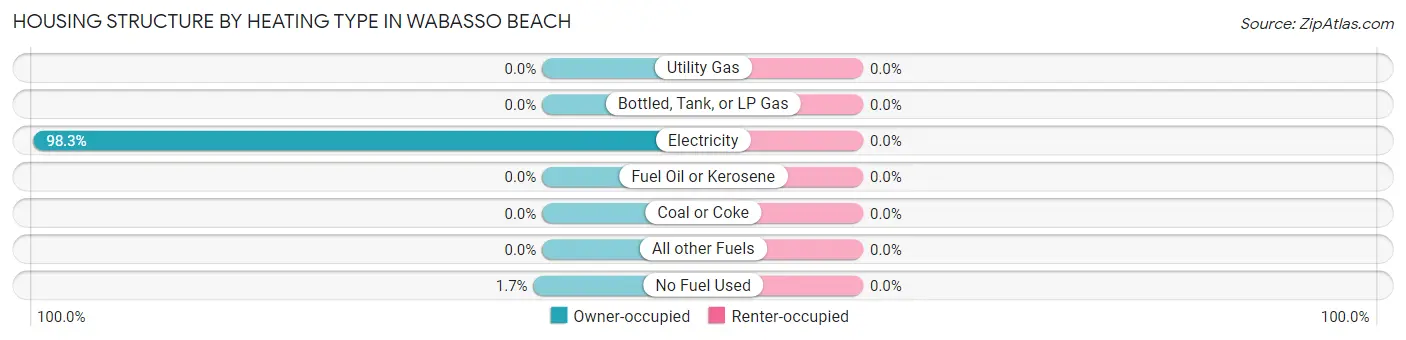
| Heating Type | Owner-occupied | Renter-occupied |
| Utility Gas | 0 (0.0%) | 0 (0.0%) |
| Bottled, Tank, or LP Gas | 0 (0.0%) | 0 (0.0%) |
| Electricity | 937 (98.3%) | 0 (0.0%) |
| Fuel Oil or Kerosene | 0 (0.0%) | 0 (0.0%) |
| Coal or Coke | 0 (0.0%) | 0 (0.0%) |
| All other Fuels | 0 (0.0%) | 0 (0.0%) |
| No Fuel Used | 16 (1.7%) | 0 (0.0%) |
| Total | 953 (100.0%) | 0 (0.0%) |
Household Vehicle Usage in Wabasso Beach
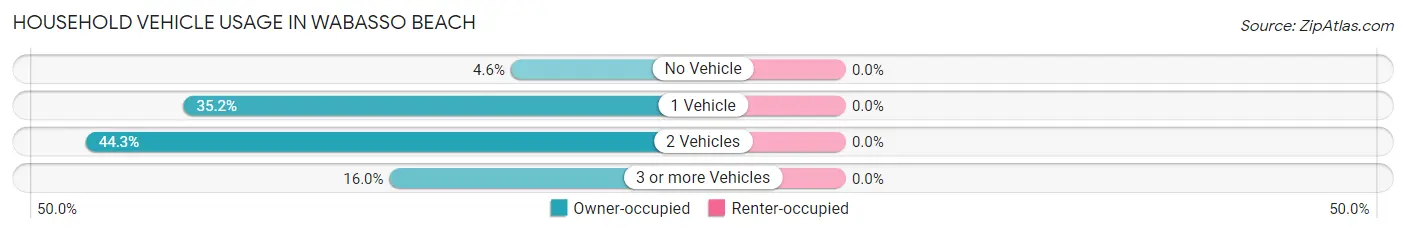
| Vehicles per Household | Owner-occupied | Renter-occupied |
| No Vehicle | 44 (4.6%) | 0 (0.0%) |
| 1 Vehicle | 335 (35.1%) | 0 (0.0%) |
| 2 Vehicles | 422 (44.3%) | 0 (0.0%) |
| 3 or more Vehicles | 152 (16.0%) | 0 (0.0%) |
| Total | 953 (100.0%) | 0 (0.0%) |
Real Estate & Mortgages in Wabasso Beach
Real Estate and Mortgage Overview in Wabasso Beach
| Characteristic | Without Mortgage | With Mortgage |
| Housing Units | 754 | 199 |
| Median Property Value | $550,600 | $671,500 |
| Median Household Income | $113,649 | $122 |
| Monthly Housing Costs | $982 | $85 |
| Real Estate Taxes | $4,189 | $0 |
Property Value by Mortgage Status in Wabasso Beach
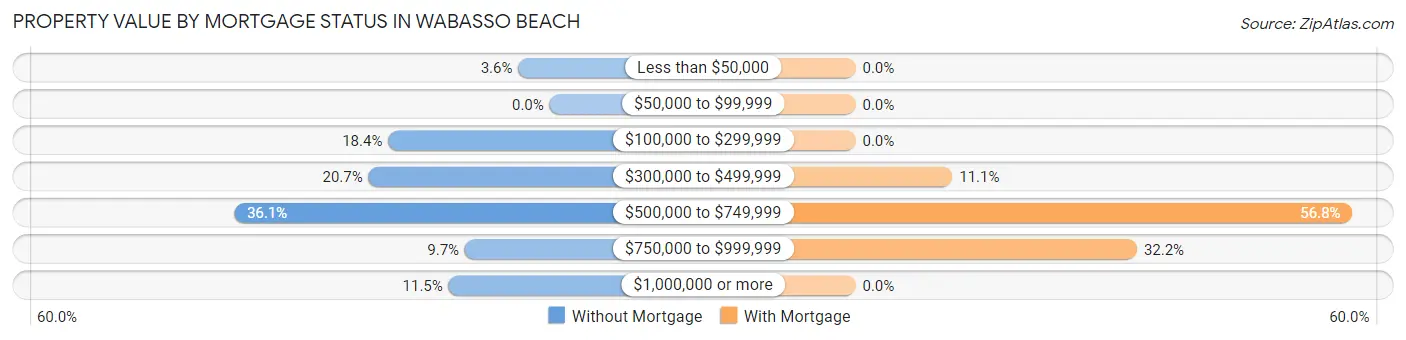
| Property Value | Without Mortgage | With Mortgage |
| Less than $50,000 | 27 (3.6%) | 0 (0.0%) |
| $50,000 to $99,999 | 0 (0.0%) | 0 (0.0%) |
| $100,000 to $299,999 | 139 (18.4%) | 0 (0.0%) |
| $300,000 to $499,999 | 156 (20.7%) | 22 (11.1%) |
| $500,000 to $749,999 | 272 (36.1%) | 113 (56.8%) |
| $750,000 to $999,999 | 73 (9.7%) | 64 (32.2%) |
| $1,000,000 or more | 87 (11.5%) | 0 (0.0%) |
| Total | 754 (100.0%) | 199 (100.0%) |
Household Income by Mortgage Status in Wabasso Beach
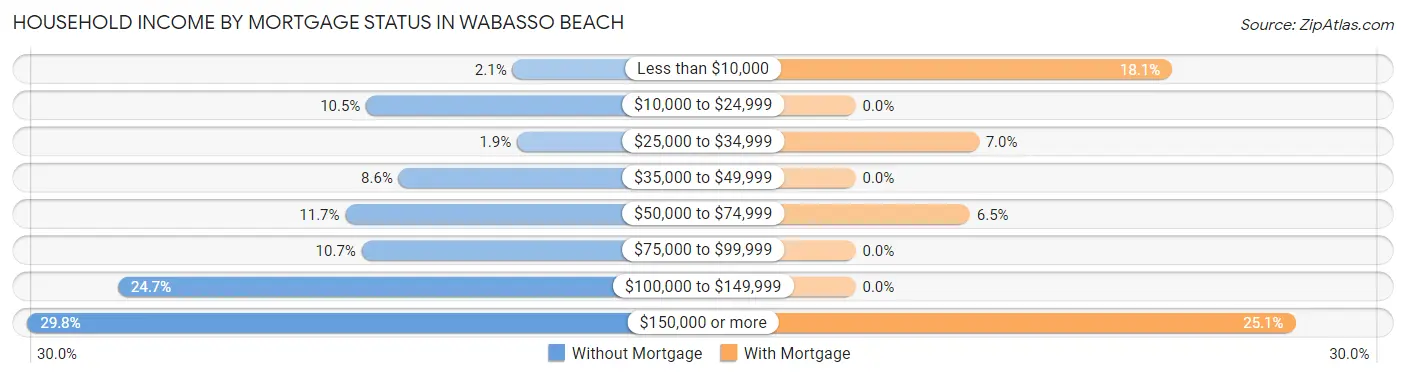
| Household Income | Without Mortgage | With Mortgage |
| Less than $10,000 | 16 (2.1%) | 36 (18.1%) |
| $10,000 to $24,999 | 79 (10.5%) | 0 (0.0%) |
| $25,000 to $34,999 | 14 (1.9%) | 14 (7.0%) |
| $35,000 to $49,999 | 65 (8.6%) | 0 (0.0%) |
| $50,000 to $74,999 | 88 (11.7%) | 13 (6.5%) |
| $75,000 to $99,999 | 81 (10.7%) | 0 (0.0%) |
| $100,000 to $149,999 | 186 (24.7%) | 0 (0.0%) |
| $150,000 or more | 225 (29.8%) | 50 (25.1%) |
| Total | 754 (100.0%) | 199 (100.0%) |
Property Value to Household Income Ratio in Wabasso Beach
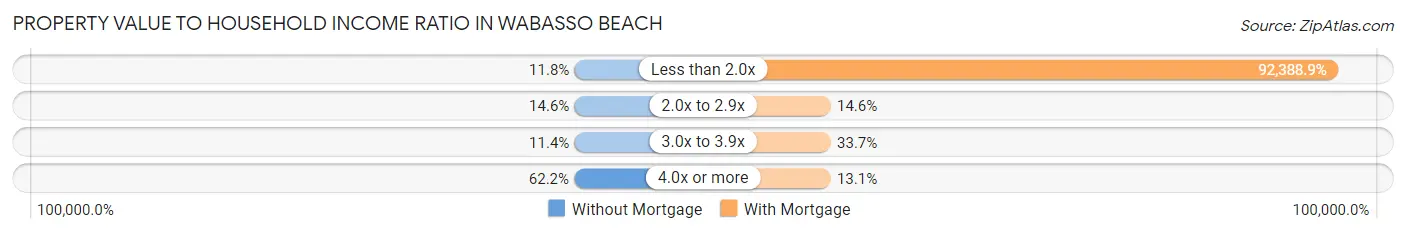
| Value-to-Income Ratio | Without Mortgage | With Mortgage |
| Less than 2.0x | 89 (11.8%) | 183,854 (92,388.9%) |
| 2.0x to 2.9x | 110 (14.6%) | 29 (14.6%) |
| 3.0x to 3.9x | 86 (11.4%) | 67 (33.7%) |
| 4.0x or more | 469 (62.2%) | 26 (13.1%) |
| Total | 754 (100.0%) | 199 (100.0%) |
Real Estate Taxes by Mortgage Status in Wabasso Beach
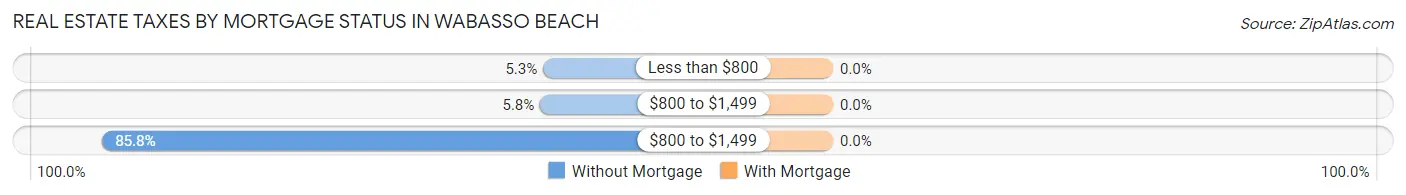
| Property Taxes | Without Mortgage | With Mortgage |
| Less than $800 | 40 (5.3%) | 0 (0.0%) |
| $800 to $1,499 | 44 (5.8%) | 0 (0.0%) |
| $800 to $1,499 | 647 (85.8%) | 0 (0.0%) |
| Total | 754 (100.0%) | 199 (100.0%) |
Health & Disability in Wabasso Beach
Health Insurance Coverage by Age in Wabasso Beach
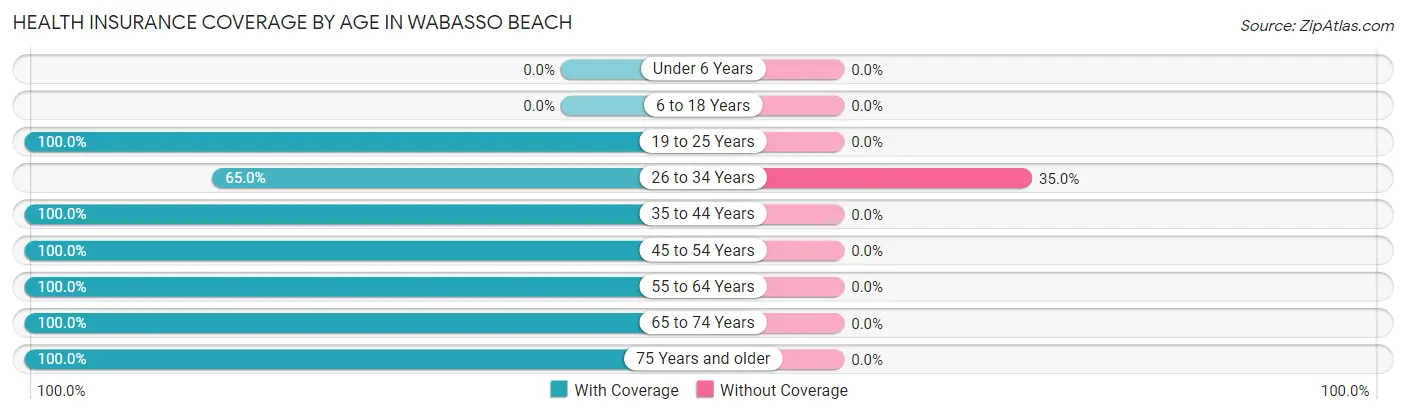
| Age Bracket | With Coverage | Without Coverage |
| Under 6 Years | 0 (0.0%) | 0 (0.0%) |
| 6 to 18 Years | 0 (0.0%) | 0 (0.0%) |
| 19 to 25 Years | 63 (100.0%) | 0 (0.0%) |
| 26 to 34 Years | 141 (65.0%) | 76 (35.0%) |
| 35 to 44 Years | 8 (100.0%) | 0 (0.0%) |
| 45 to 54 Years | 186 (100.0%) | 0 (0.0%) |
| 55 to 64 Years | 302 (100.0%) | 0 (0.0%) |
| 65 to 74 Years | 622 (100.0%) | 0 (0.0%) |
| 75 Years and older | 703 (100.0%) | 0 (0.0%) |
| Total | 2,025 (96.4%) | 76 (3.6%) |
Health Insurance Coverage by Citizenship Status in Wabasso Beach
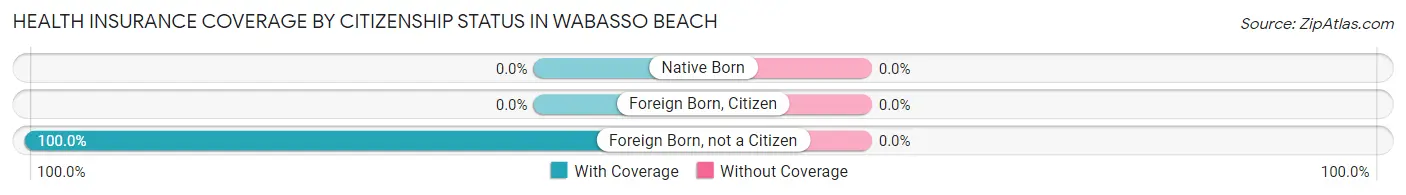
| Citizenship Status | With Coverage | Without Coverage |
| Native Born | 0 (0.0%) | 0 (0.0%) |
| Foreign Born, Citizen | 0 (0.0%) | 0 (0.0%) |
| Foreign Born, not a Citizen | 63 (100.0%) | 0 (0.0%) |
Health Insurance Coverage by Household Income in Wabasso Beach
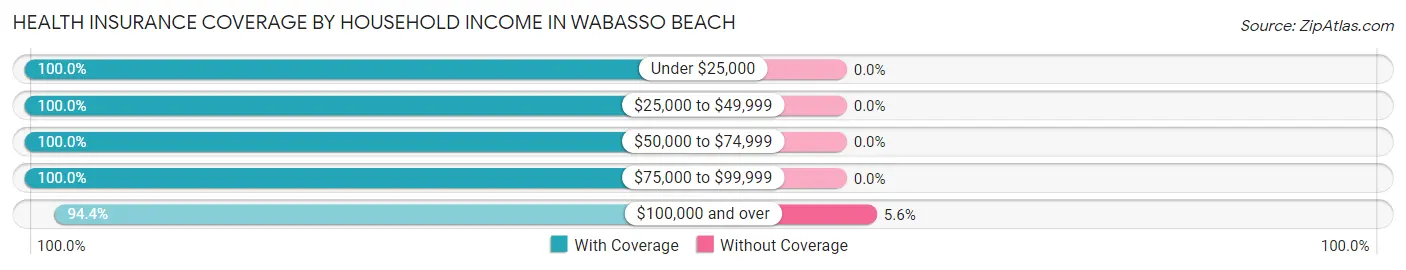
| Household Income | With Coverage | Without Coverage |
| Under $25,000 | 291 (100.0%) | 0 (0.0%) |
| $25,000 to $49,999 | 160 (100.0%) | 0 (0.0%) |
| $50,000 to $74,999 | 157 (100.0%) | 0 (0.0%) |
| $75,000 to $99,999 | 146 (100.0%) | 0 (0.0%) |
| $100,000 and over | 1,271 (94.4%) | 76 (5.6%) |
Public vs Private Health Insurance Coverage by Age in Wabasso Beach
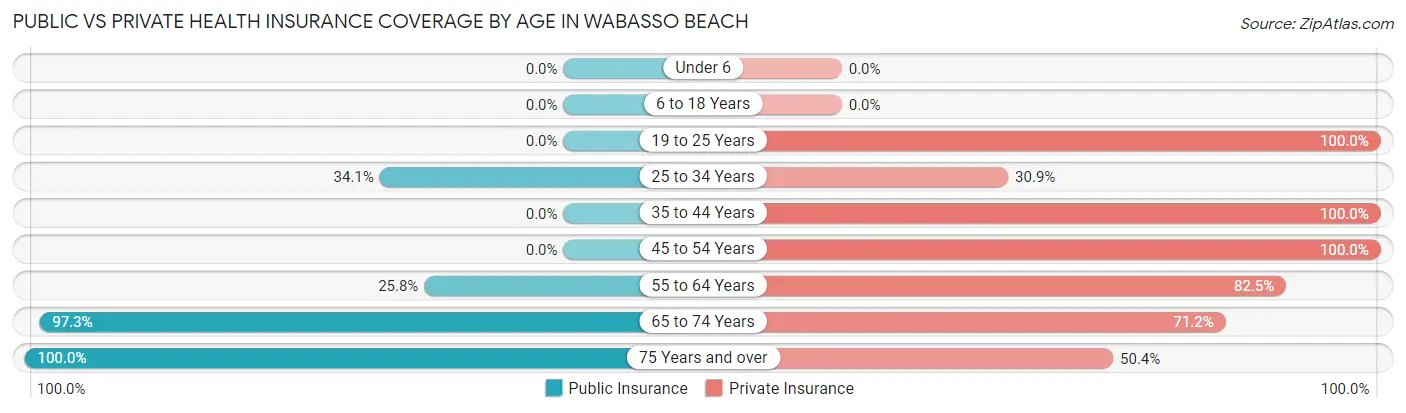
| Age Bracket | Public Insurance | Private Insurance |
| Under 6 | 0 (0.0%) | 0 (0.0%) |
| 6 to 18 Years | 0 (0.0%) | 0 (0.0%) |
| 19 to 25 Years | 0 (0.0%) | 63 (100.0%) |
| 25 to 34 Years | 74 (34.1%) | 67 (30.9%) |
| 35 to 44 Years | 0 (0.0%) | 8 (100.0%) |
| 45 to 54 Years | 0 (0.0%) | 186 (100.0%) |
| 55 to 64 Years | 78 (25.8%) | 249 (82.5%) |
| 65 to 74 Years | 605 (97.3%) | 443 (71.2%) |
| 75 Years and over | 703 (100.0%) | 354 (50.4%) |
| Total | 1,460 (69.5%) | 1,370 (65.2%) |
Disability Status by Sex by Age in Wabasso Beach
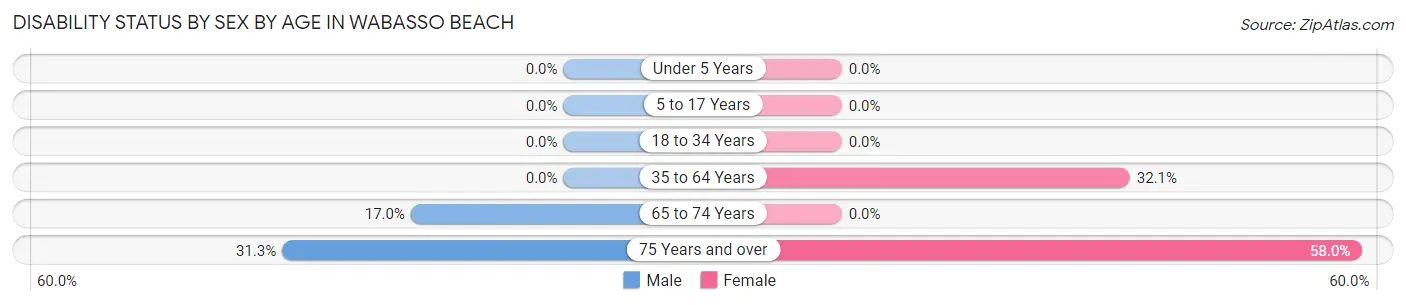
| Age Bracket | Male | Female |
| Under 5 Years | 0 (0.0%) | 0 (0.0%) |
| 5 to 17 Years | 0 (0.0%) | 0 (0.0%) |
| 18 to 34 Years | 0 (0.0%) | 0 (0.0%) |
| 35 to 64 Years | 0 (0.0%) | 111 (32.1%) |
| 65 to 74 Years | 53 (17.0%) | 0 (0.0%) |
| 75 Years and over | 104 (31.3%) | 215 (58.0%) |
Disability Class by Sex by Age in Wabasso Beach
Disability Class: Hearing Difficulty
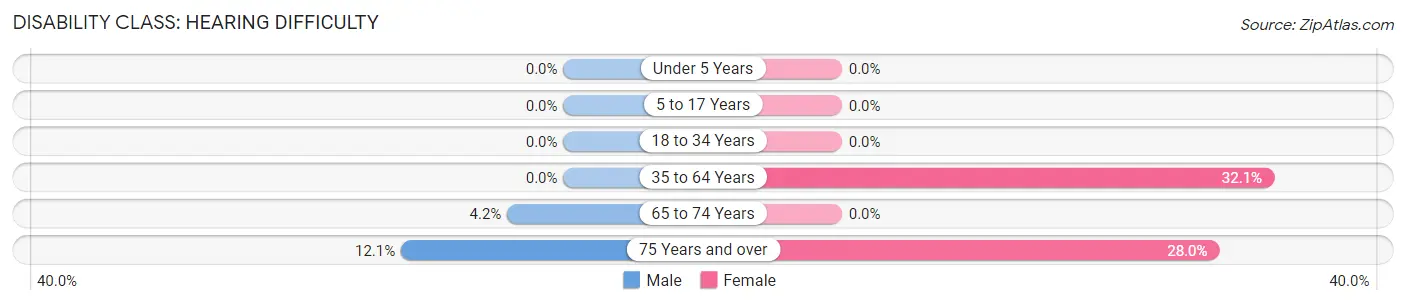
| Age Bracket | Male | Female |
| Under 5 Years | 0 (0.0%) | 0 (0.0%) |
| 5 to 17 Years | 0 (0.0%) | 0 (0.0%) |
| 18 to 34 Years | 0 (0.0%) | 0 (0.0%) |
| 35 to 64 Years | 0 (0.0%) | 111 (32.1%) |
| 65 to 74 Years | 13 (4.2%) | 0 (0.0%) |
| 75 Years and over | 40 (12.0%) | 104 (28.0%) |
Disability Class: Vision Difficulty
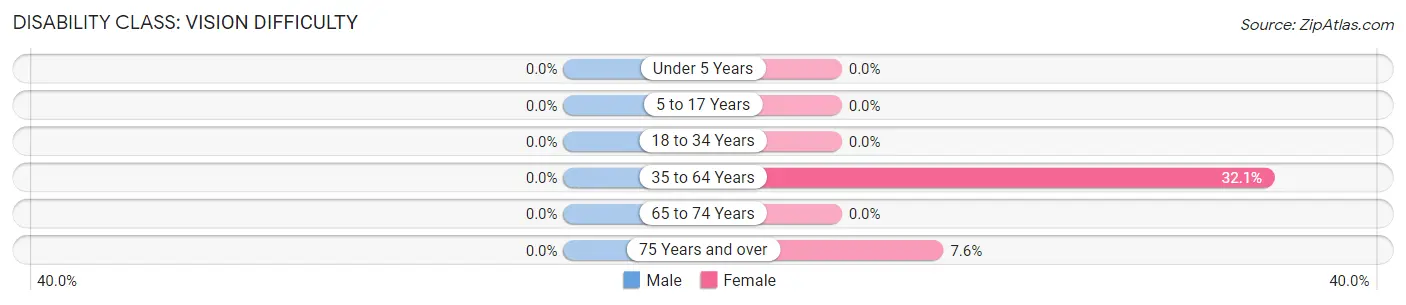
| Age Bracket | Male | Female |
| Under 5 Years | 0 (0.0%) | 0 (0.0%) |
| 5 to 17 Years | 0 (0.0%) | 0 (0.0%) |
| 18 to 34 Years | 0 (0.0%) | 0 (0.0%) |
| 35 to 64 Years | 0 (0.0%) | 111 (32.1%) |
| 65 to 74 Years | 0 (0.0%) | 0 (0.0%) |
| 75 Years and over | 0 (0.0%) | 28 (7.5%) |
Disability Class: Cognitive Difficulty
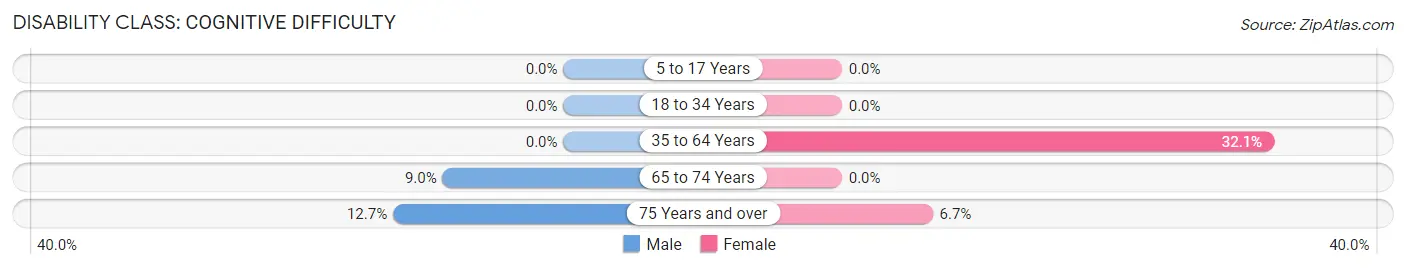
| Age Bracket | Male | Female |
| 5 to 17 Years | 0 (0.0%) | 0 (0.0%) |
| 18 to 34 Years | 0 (0.0%) | 0 (0.0%) |
| 35 to 64 Years | 0 (0.0%) | 111 (32.1%) |
| 65 to 74 Years | 28 (9.0%) | 0 (0.0%) |
| 75 Years and over | 42 (12.7%) | 25 (6.7%) |
Disability Class: Ambulatory Difficulty
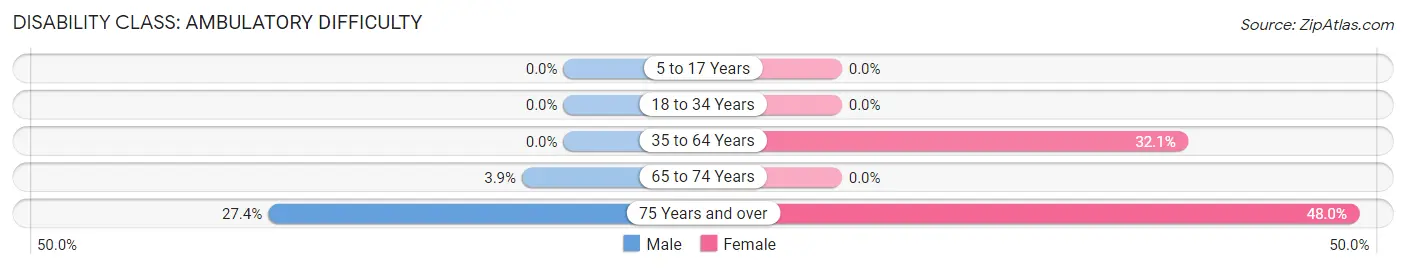
| Age Bracket | Male | Female |
| 5 to 17 Years | 0 (0.0%) | 0 (0.0%) |
| 18 to 34 Years | 0 (0.0%) | 0 (0.0%) |
| 35 to 64 Years | 0 (0.0%) | 111 (32.1%) |
| 65 to 74 Years | 12 (3.8%) | 0 (0.0%) |
| 75 Years and over | 91 (27.4%) | 178 (48.0%) |
Disability Class: Self-Care Difficulty
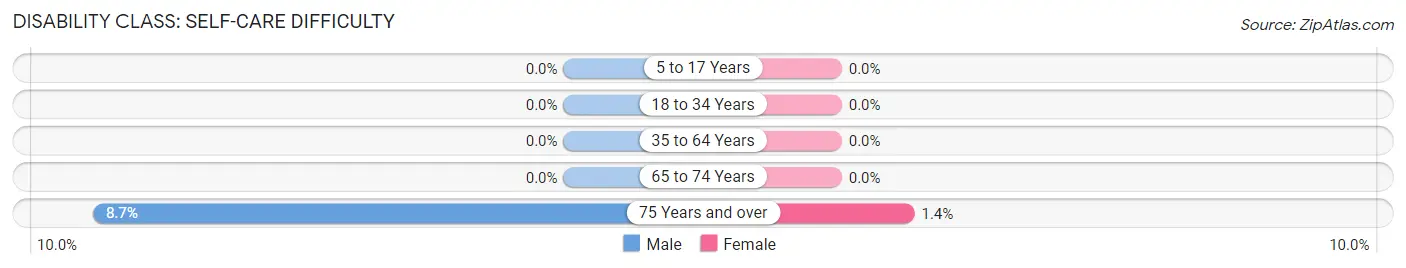
| Age Bracket | Male | Female |
| 5 to 17 Years | 0 (0.0%) | 0 (0.0%) |
| 18 to 34 Years | 0 (0.0%) | 0 (0.0%) |
| 35 to 64 Years | 0 (0.0%) | 0 (0.0%) |
| 65 to 74 Years | 0 (0.0%) | 0 (0.0%) |
| 75 Years and over | 29 (8.7%) | 5 (1.3%) |
Technology Access in Wabasso Beach
Computing Device Access in Wabasso Beach
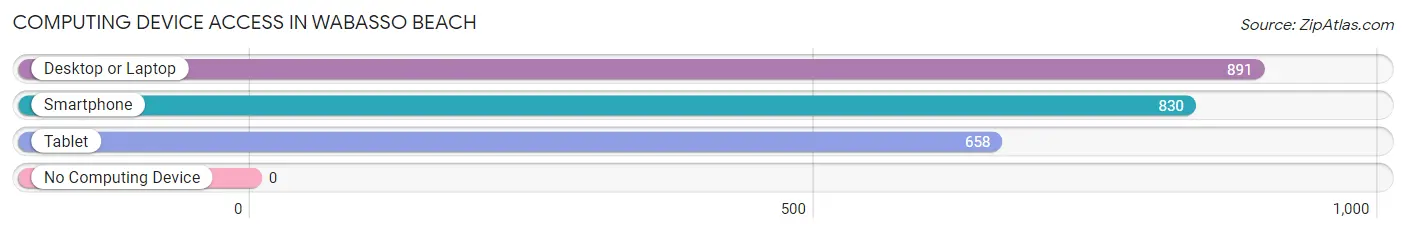
| Device Type | # Households | % Households |
| Desktop or Laptop | 891 | 93.5% |
| Smartphone | 830 | 87.1% |
| Tablet | 658 | 69.1% |
| No Computing Device | 0 | 0.0% |
| Total | 953 | 100.0% |
Internet Access in Wabasso Beach
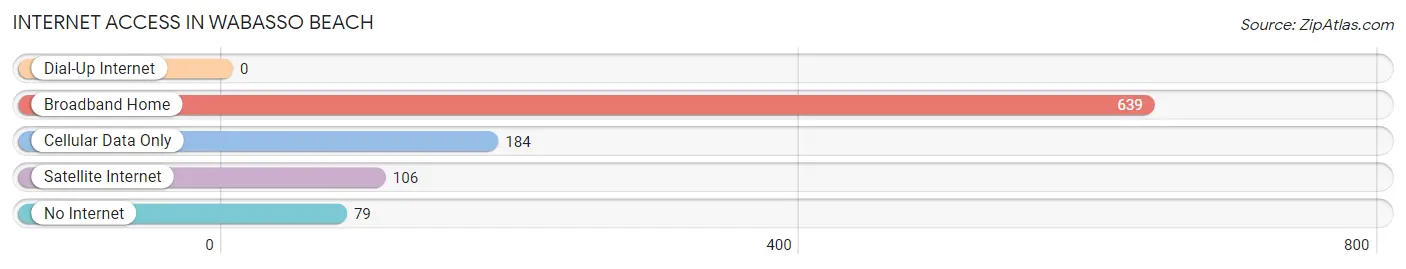
| Internet Type | # Households | % Households |
| Dial-Up Internet | 0 | 0.0% |
| Broadband Home | 639 | 67.0% |
| Cellular Data Only | 184 | 19.3% |
| Satellite Internet | 106 | 11.1% |
| No Internet | 79 | 8.3% |
| Total | 953 | 100.0% |
Wabasso Beach Summary
Wabasso Beach is a small unincorporated community located in Indian River County, Florida, United States. It is situated on the east coast of Florida, approximately 10 miles south of Vero Beach and 15 miles north of Sebastian. The community is bordered by the Indian River Lagoon to the west and the Atlantic Ocean to the east.
History
The area that is now Wabasso Beach was originally inhabited by the Ais Indians, who were part of the Seminole tribe. The Ais Indians lived in the area for centuries before the arrival of European settlers in the late 19th century. The first settlers were fishermen and farmers who established small homesteads along the Indian River Lagoon.
In the early 20th century, the area began to attract more visitors and settlers. In the 1920s, a bridge was built across the Indian River Lagoon, connecting Wabasso Beach to the mainland. This bridge allowed for easier access to the area and helped to spur development.
In the 1950s, the area began to attract more tourists and vacationers. The area was promoted as a beach resort and many new homes and businesses were built. In the 1960s, the area was incorporated as the Town of Wabasso Beach.
Geography
Wabasso Beach is located in Indian River County, Florida, on the east coast of the state. It is situated on the Indian River Lagoon, which is part of the Intracoastal Waterway. The community is bordered by the Atlantic Ocean to the east and the Indian River Lagoon to the west.
The area is characterized by its flat terrain and sandy beaches. The climate is subtropical, with hot, humid summers and mild winters. The average temperature in the summer is around 85°F (29°C) and in the winter it is around 65°F (18°C).
Economy
The economy of Wabasso Beach is largely based on tourism and fishing. The area is a popular destination for vacationers and retirees, and there are numerous hotels, restaurants, and other businesses catering to tourists.
Fishing is also an important part of the local economy. The Indian River Lagoon is home to a variety of fish, including snook, redfish, tarpon, and trout. The area is also known for its excellent sport fishing, and many anglers come to the area to fish for these species.
Demographics
As of the 2010 census, the population of Wabasso Beach was 1,845. The racial makeup of the town was 94.3% White, 2.2% African American, 0.3% Native American, 0.7% Asian, 0.1% Pacific Islander, and 2.4% from other races. Hispanic or Latino of any race were 5.2% of the population.
The median household income in Wabasso Beach was $45,938, and the median family income was $50,938. The per capita income was $25,938. About 8.3% of families and 10.2% of the population were below the poverty line, including 14.3% of those under age 18 and 5.2% of those age 65 or over.
Conclusion
Wabasso Beach is a small unincorporated community located in Indian River County, Florida. It is situated on the east coast of the state, bordered by the Indian River Lagoon and the Atlantic Ocean. The area has a long history, dating back to the Ais Indians who originally inhabited the area. Today, the economy of Wabasso Beach is largely based on tourism and fishing, and the population is predominantly White. The area is a popular destination for vacationers and retirees, and it is known for its excellent sport fishing.
Common Questions
What is Per Capita Income in Wabasso Beach?
Per Capita income in Wabasso Beach is $71,153.
What is the Median Family Income in Wabasso Beach?
Median Family Income in Wabasso Beach is $118,611.
What is the Median Household income in Wabasso Beach?
Median Household Income in Wabasso Beach is $120,673.
What is Inequality or Gini Index in Wabasso Beach?
Inequality or Gini Index in Wabasso Beach is 0.43.
What is the Total Population of Wabasso Beach?
Total Population of Wabasso Beach is 2,101.
What is the Total Male Population of Wabasso Beach?
Total Male Population of Wabasso Beach is 1,011.
What is the Total Female Population of Wabasso Beach?
Total Female Population of Wabasso Beach is 1,090.
What is the Ratio of Males per 100 Females in Wabasso Beach?
There are 92.75 Males per 100 Females in Wabasso Beach.
What is the Ratio of Females per 100 Males in Wabasso Beach?
There are 107.81 Females per 100 Males in Wabasso Beach.
What is the Median Population Age in Wabasso Beach?
Median Population Age in Wabasso Beach is 69.8 Years.
What is the Average Family Size in Wabasso Beach
Average Family Size in Wabasso Beach is 2.5 People.
What is the Average Household Size in Wabasso Beach
Average Household Size in Wabasso Beach is 2.2 People.
How Large is the Labor Force in Wabasso Beach?
There are 613 People in the Labor Forcein in Wabasso Beach.
What is the Percentage of People in the Labor Force in Wabasso Beach?
29.2% of People are in the Labor Force in Wabasso Beach.