Zip Codes with the Highest Percentage of Population Employed in Food Preparation & Serving in Cocoa, FL
RELATED REPORTS & OPTIONS
Food Preparation & Serving
Cocoa
Compare Zip Codes
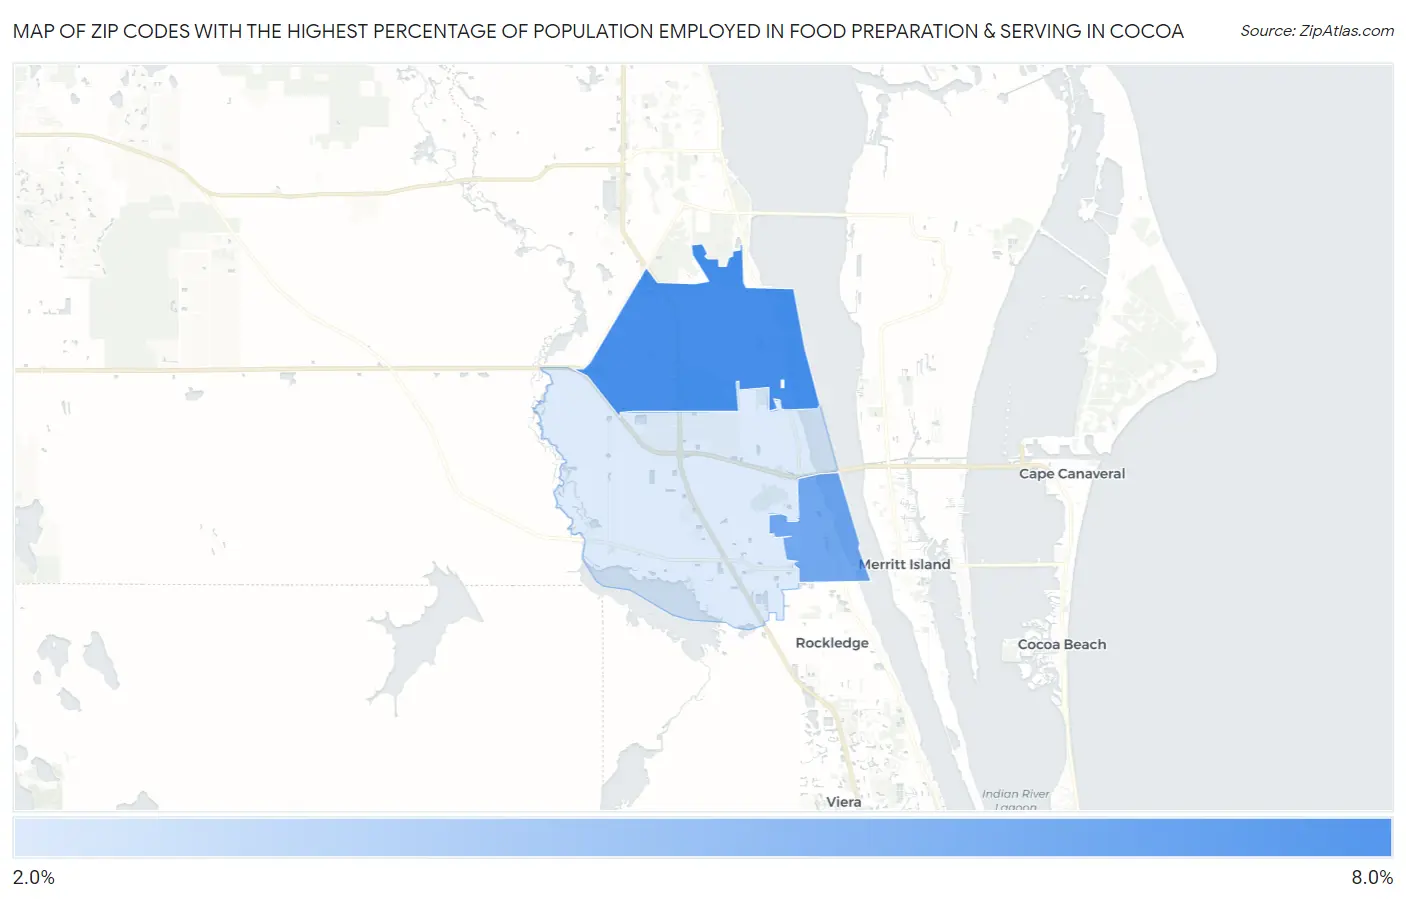
Map of Zip Codes with the Highest Percentage of Population Employed in Food Preparation & Serving in Cocoa
2.3%
7.8%
Zip Codes with the Highest Percentage of Population Employed in Food Preparation & Serving in Cocoa, FL
| Zip Code | % Employed | vs State | vs National | |
| 1. | 32927 | 7.8% | 6.1%(+1.72)#215 | 5.3%(+2.52)#5,037 |
| 2. | 32922 | 6.2% | 6.1%(+0.154)#420 | 5.3%(+0.959)#8,606 |
| 3. | 32926 | 2.3% | 6.1%(-3.77)#869 | 5.3%(-2.97)#23,726 |
1
Common Questions
What are the Top Zip Codes with the Highest Percentage of Population Employed in Food Preparation & Serving in Cocoa, FL?
Top Zip Codes with the Highest Percentage of Population Employed in Food Preparation & Serving in Cocoa, FL are:
What zip code has the Highest Percentage of Population Employed in Food Preparation & Serving in Cocoa, FL?
32927 has the Highest Percentage of Population Employed in Food Preparation & Serving in Cocoa, FL with 7.8%.
What is the Percentage of Population Employed in Food Preparation & Serving in Cocoa, FL?
Percentage of Population Employed in Food Preparation & Serving in Cocoa is 5.1%.
What is the Percentage of Population Employed in Food Preparation & Serving in Florida?
Percentage of Population Employed in Food Preparation & Serving in Florida is 6.1%.
What is the Percentage of Population Employed in Food Preparation & Serving in the United States?
Percentage of Population Employed in Food Preparation & Serving in the United States is 5.3%.