Spring Lake, FL Map & Demographics
Spring Lake Map
Spring Lake Overview
$25,996
PER CAPITA INCOME
$77,500
AVG FAMILY INCOME
$74,327
AVG HOUSEHOLD INCOME
0.35
INEQUALITY / GINI INDEX
370
TOTAL POPULATION
215
MALE POPULATION
155
FEMALE POPULATION
138.71
MALES / 100 FEMALES
72.09
FEMALES / 100 MALES
54.3
MEDIAN AGE
3.0
AVG FAMILY SIZE
2.8
AVG HOUSEHOLD SIZE
121
LABOR FORCE [ PEOPLE ]
37.8%
PERCENT IN LABOR FORCE
Income in Spring Lake
Income Overview in Spring Lake
Per Capita Income in Spring Lake is $25,996, while median incomes of families and households are $77,500 and $74,327 respectively.
| Characteristic | Number | Measure |
| Per Capita Income | 370 | $25,996 |
| Median Family Income | 122 | $77,500 |
| Mean Family Income | 122 | $72,834 |
| Median Household Income | 129 | $74,327 |
| Mean Household Income | 129 | $70,971 |
| Income Deficit | 122 | $0 |
| Wage / Income Gap (%) | 370 | 0.00% |
| Wage / Income Gap ($) | 370 | 100.00¢ per $1 |
| Gini / Inequality Index | 370 | 0.35 |
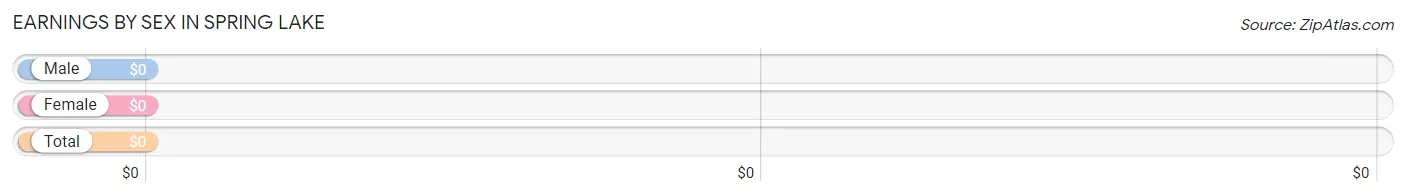
Earnings by Sex in Spring Lake
| Sex | Number | Average Earnings |
| Male | 95 (70.9%) | $0 |
| Female | 39 (29.1%) | $0 |
| Total | 134 (100.0%) | $0 |
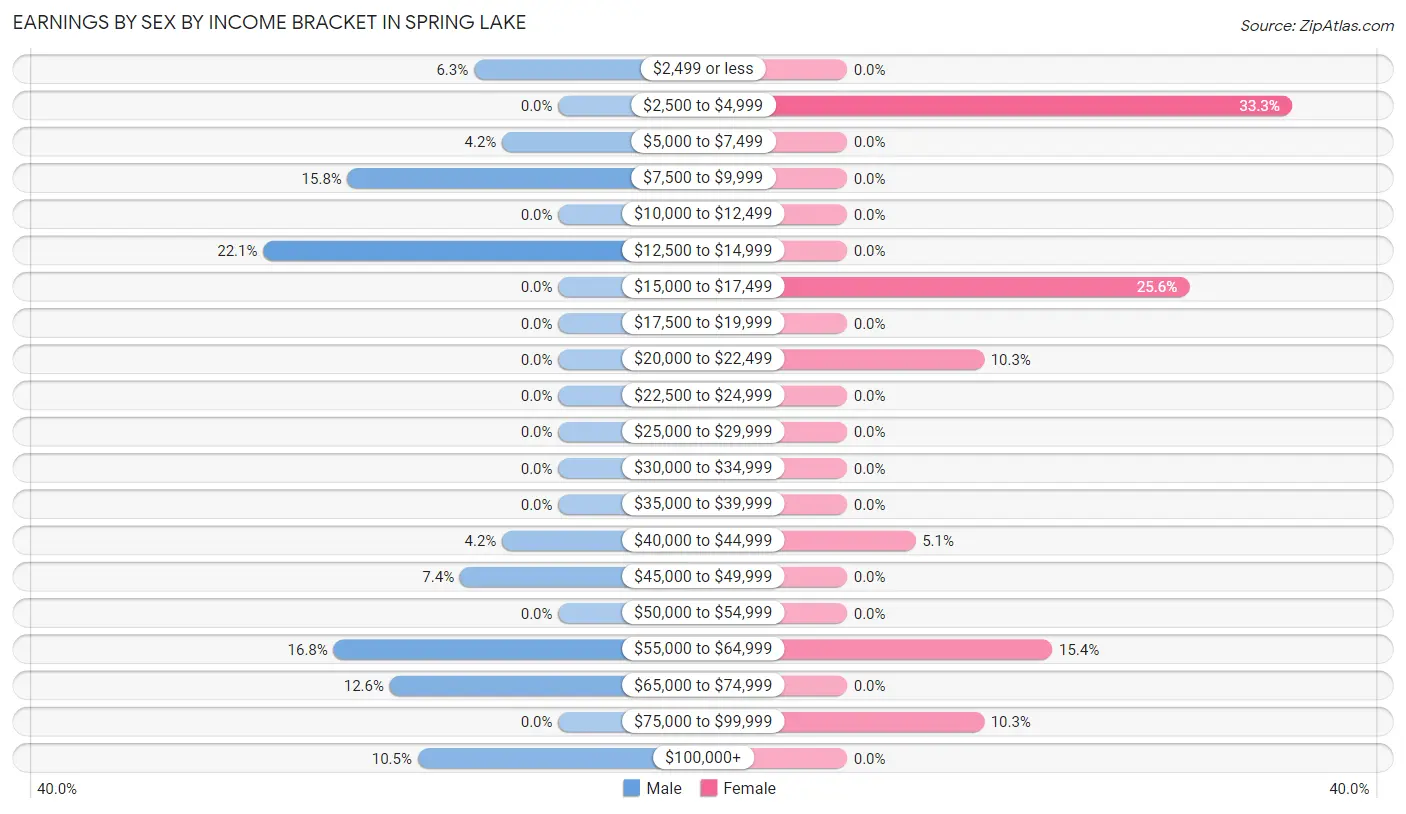
Earnings by Sex by Income Bracket in Spring Lake
The most common earnings brackets in Spring Lake are $12,500 to $14,999 for men (21 | 22.1%) and $2,500 to $4,999 for women (13 | 33.3%).
| Income | Male | Female |
| $2,499 or less | 6 (6.3%) | 0 (0.0%) |
| $2,500 to $4,999 | 0 (0.0%) | 13 (33.3%) |
| $5,000 to $7,499 | 4 (4.2%) | 0 (0.0%) |
| $7,500 to $9,999 | 15 (15.8%) | 0 (0.0%) |
| $10,000 to $12,499 | 0 (0.0%) | 0 (0.0%) |
| $12,500 to $14,999 | 21 (22.1%) | 0 (0.0%) |
| $15,000 to $17,499 | 0 (0.0%) | 10 (25.6%) |
| $17,500 to $19,999 | 0 (0.0%) | 0 (0.0%) |
| $20,000 to $22,499 | 0 (0.0%) | 4 (10.3%) |
| $22,500 to $24,999 | 0 (0.0%) | 0 (0.0%) |
| $25,000 to $29,999 | 0 (0.0%) | 0 (0.0%) |
| $30,000 to $34,999 | 0 (0.0%) | 0 (0.0%) |
| $35,000 to $39,999 | 0 (0.0%) | 0 (0.0%) |
| $40,000 to $44,999 | 4 (4.2%) | 2 (5.1%) |
| $45,000 to $49,999 | 7 (7.4%) | 0 (0.0%) |
| $50,000 to $54,999 | 0 (0.0%) | 0 (0.0%) |
| $55,000 to $64,999 | 16 (16.8%) | 6 (15.4%) |
| $65,000 to $74,999 | 12 (12.6%) | 0 (0.0%) |
| $75,000 to $99,999 | 0 (0.0%) | 4 (10.3%) |
| $100,000+ | 10 (10.5%) | 0 (0.0%) |
| Total | 95 (100.0%) | 39 (100.0%) |
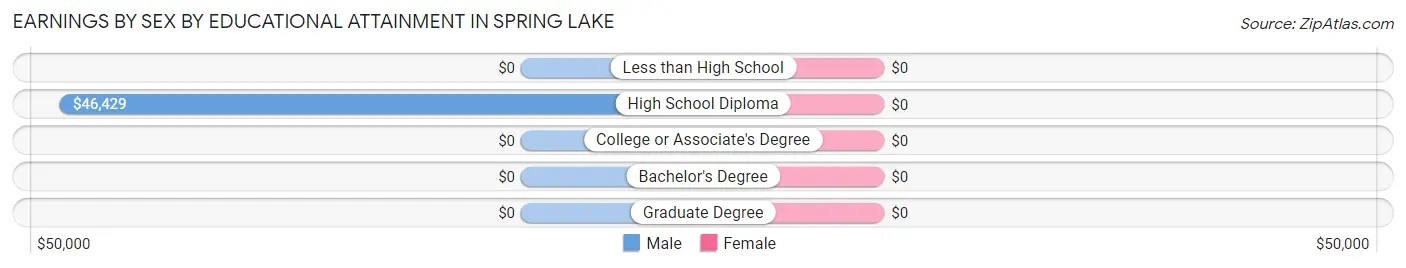
Earnings by Sex by Educational Attainment in Spring Lake
| Educational Attainment | Male Income | Female Income |
| Less than High School | - | - |
| High School Diploma | $46,429 | $0 |
| College or Associate's Degree | - | - |
| Bachelor's Degree | - | - |
| Graduate Degree | - | - |
| Total | $55,313 | $0 |
Family Income in Spring Lake
Family Income Brackets in Spring Lake
According to the Spring Lake family income data, there are 30 families falling into the $100,000 to $149,999 income range, which is the most common income bracket and makes up 24.6% of all families.
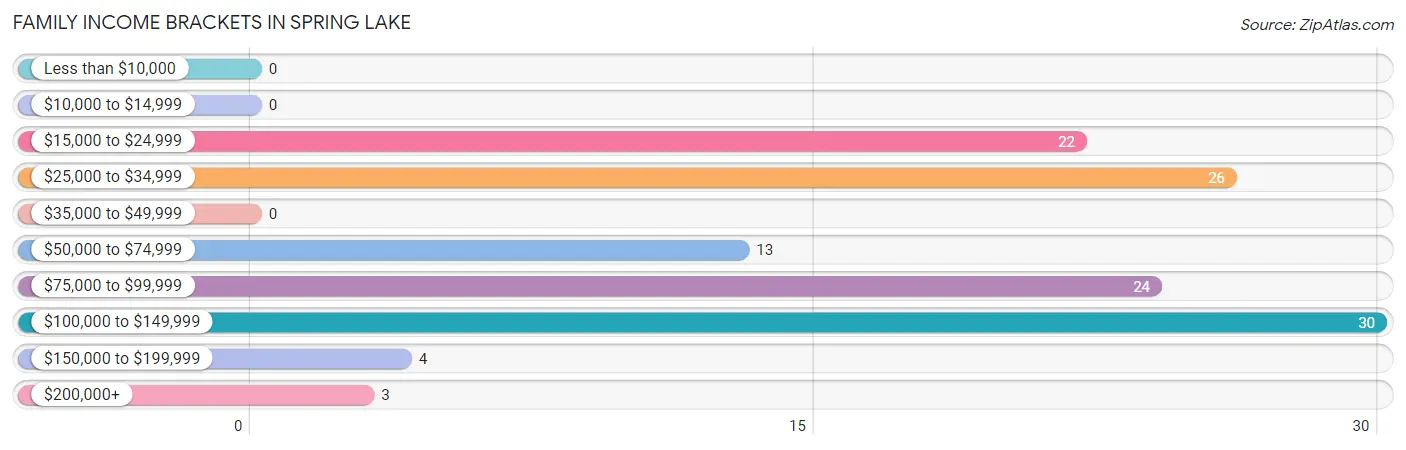
| Income Bracket | # Families | % Families |
| Less than $10,000 | 0 | 0.0% |
| $10,000 to $14,999 | 0 | 0.0% |
| $15,000 to $24,999 | 22 | 18.0% |
| $25,000 to $34,999 | 26 | 21.3% |
| $35,000 to $49,999 | 0 | 0.0% |
| $50,000 to $74,999 | 13 | 10.7% |
| $75,000 to $99,999 | 24 | 19.7% |
| $100,000 to $149,999 | 30 | 24.6% |
| $150,000 to $199,999 | 4 | 3.3% |
| $200,000+ | 3 | 2.5% |
Family Income by Famaliy Size in Spring Lake
2-person families (65 | 53.3%) account for the highest median family income in Spring Lake with $82,031 per family, while 2-person families (65 | 53.3%) have the highest median income of $41,016 per family member.
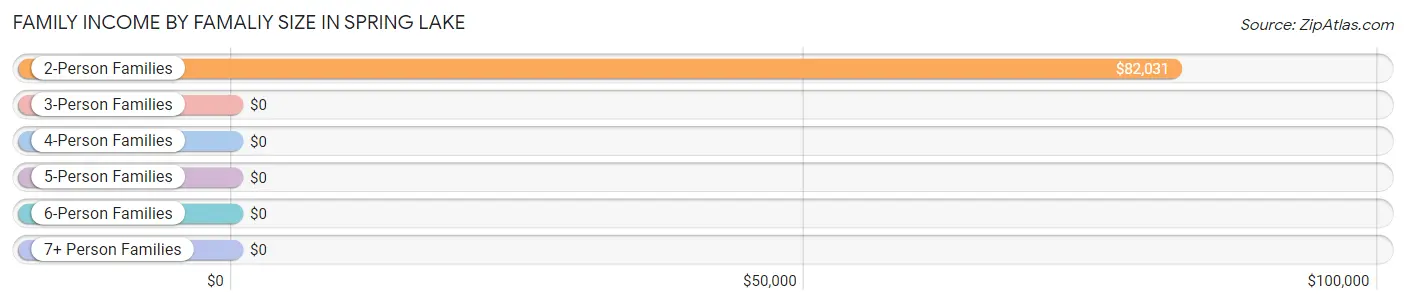
| Income Bracket | # Families | Median Income |
| 2-Person Families | 65 (53.3%) | $82,031 |
| 3-Person Families | 26 (21.3%) | $0 |
| 4-Person Families | 18 (14.7%) | $0 |
| 5-Person Families | 13 (10.7%) | $0 |
| 6-Person Families | 0 (0.0%) | $0 |
| 7+ Person Families | 0 (0.0%) | $0 |
| Total | 122 (100.0%) | $77,500 |
Family Income by Number of Earners in Spring Lake
| Number of Earners | # Families | Median Income |
| No Earners | 53 (43.4%) | $0 |
| 1 Earner | 43 (35.2%) | $0 |
| 2 Earners | 4 (3.3%) | $0 |
| 3+ Earners | 22 (18.0%) | $0 |
| Total | 122 (100.0%) | $77,500 |
Household Income in Spring Lake
Household Income Brackets in Spring Lake
With 30 households falling in the category, the $100,000 to $149,999 income range is the most frequent in Spring Lake, accounting for 23.3% of all households.
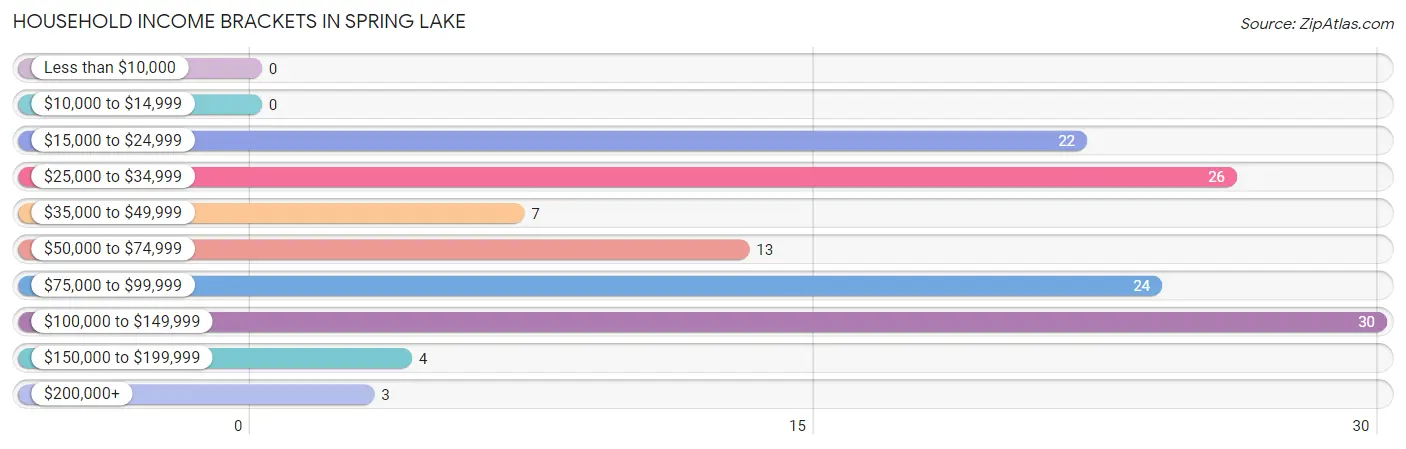
| Income Bracket | # Households | % Households |
| Less than $10,000 | 0 | 0.0% |
| $10,000 to $14,999 | 0 | 0.0% |
| $15,000 to $24,999 | 22 | 17.1% |
| $25,000 to $34,999 | 26 | 20.2% |
| $35,000 to $49,999 | 7 | 5.4% |
| $50,000 to $74,999 | 13 | 10.1% |
| $75,000 to $99,999 | 24 | 18.6% |
| $100,000 to $149,999 | 30 | 23.3% |
| $150,000 to $199,999 | 4 | 3.1% |
| $200,000+ | 3 | 2.3% |
Household Income by Householder Age in Spring Lake
The median household income in Spring Lake is $74,327, with the highest median household income of $74,327 found in the 45 to 64 years age bracket for the primary householder. A total of 43 households (33.3%) fall into this category.
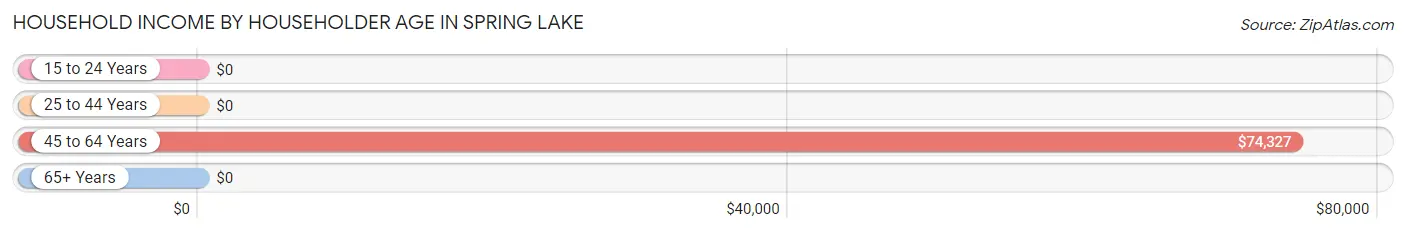
| Income Bracket | # Households | Median Income |
| 15 to 24 Years | 0 (0.0%) | $0 |
| 25 to 44 Years | 10 (7.7%) | $0 |
| 45 to 64 Years | 43 (33.3%) | $74,327 |
| 65+ Years | 76 (58.9%) | $0 |
| Total | 129 (100.0%) | $74,327 |
Poverty in Spring Lake
Income Below Poverty by Sex and Age in Spring Lake
With 23.3% poverty level for males and 23.0% for females among the residents of Spring Lake, 25 to 34 year old males and 6 to 11 year old females are the most vulnerable to poverty, with 15 males (100.0%) and 13 females (56.5%) in their respective age groups living below the poverty level.
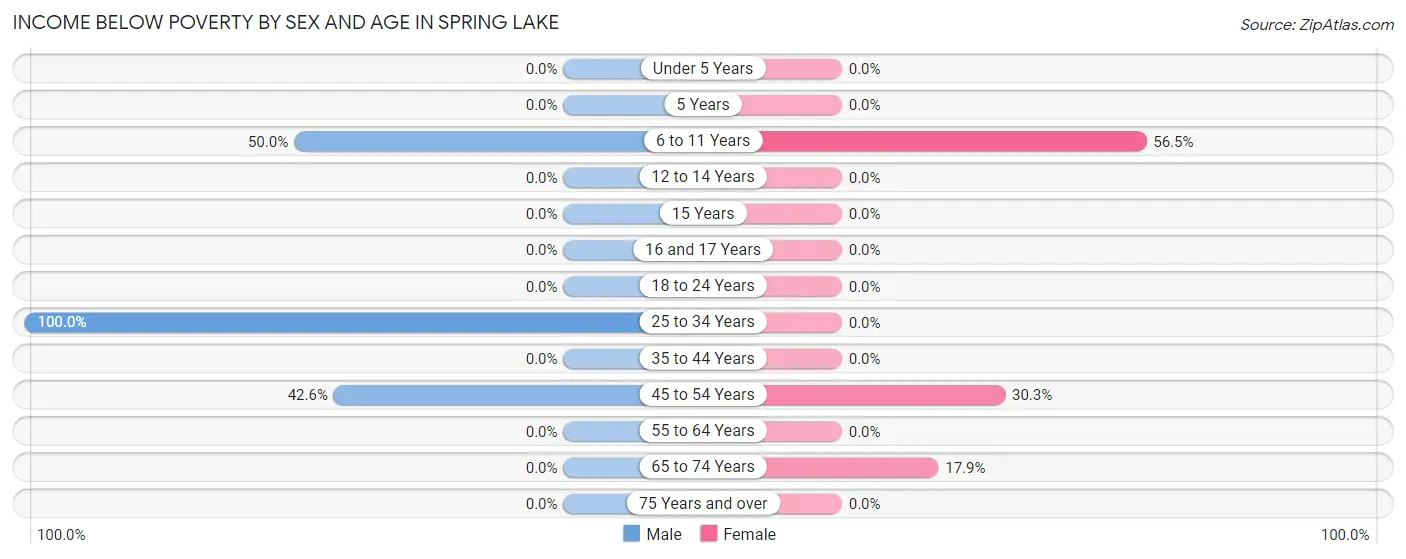
| Age Bracket | Male | Female |
| Under 5 Years | 0 (0.0%) | 0 (0.0%) |
| 5 Years | 0 (0.0%) | 0 (0.0%) |
| 6 to 11 Years | 9 (50.0%) | 13 (56.5%) |
| 12 to 14 Years | 0 (0.0%) | 0 (0.0%) |
| 15 Years | 0 (0.0%) | 0 (0.0%) |
| 16 and 17 Years | 0 (0.0%) | 0 (0.0%) |
| 18 to 24 Years | 0 (0.0%) | 0 (0.0%) |
| 25 to 34 Years | 15 (100.0%) | 0 (0.0%) |
| 35 to 44 Years | 0 (0.0%) | 0 (0.0%) |
| 45 to 54 Years | 26 (42.6%) | 10 (30.3%) |
| 55 to 64 Years | 0 (0.0%) | 0 (0.0%) |
| 65 to 74 Years | 0 (0.0%) | 12 (17.9%) |
| 75 Years and over | 0 (0.0%) | 0 (0.0%) |
| Total | 50 (23.3%) | 35 (23.0%) |
Income Above Poverty by Sex and Age in Spring Lake
According to the poverty statistics in Spring Lake, males aged 12 to 14 years and females aged 35 to 44 years are the age groups that are most secure financially, with 100.0% of males and 100.0% of females in these age groups living above the poverty line.
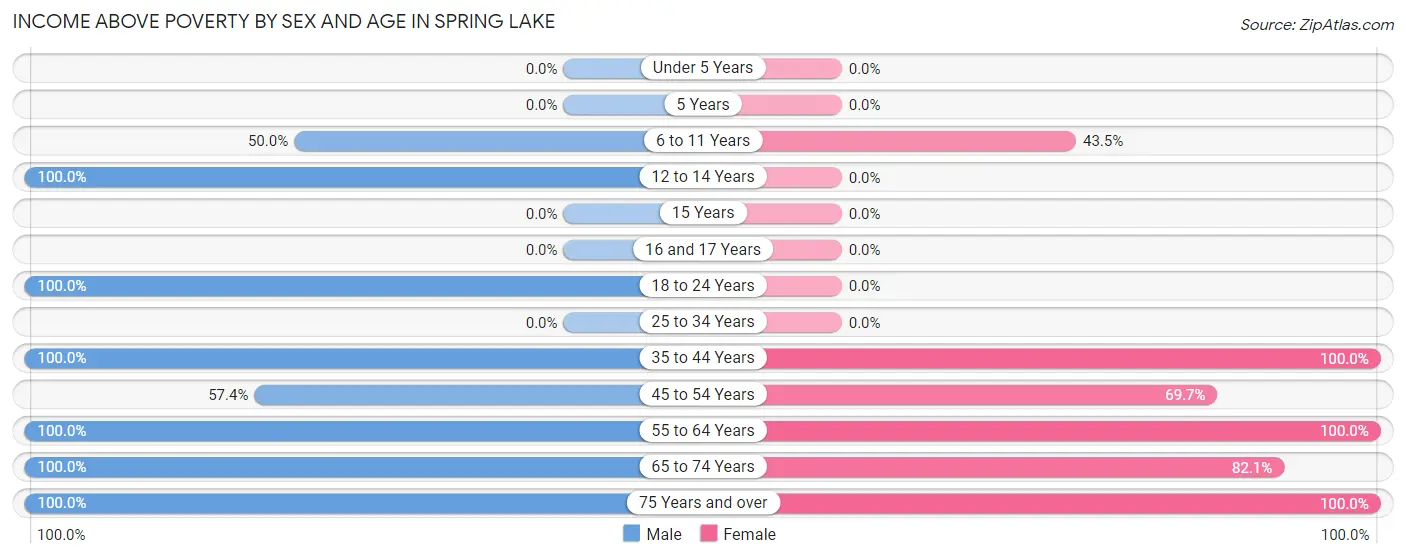
| Age Bracket | Male | Female |
| Under 5 Years | 0 (0.0%) | 0 (0.0%) |
| 5 Years | 0 (0.0%) | 0 (0.0%) |
| 6 to 11 Years | 9 (50.0%) | 10 (43.5%) |
| 12 to 14 Years | 9 (100.0%) | 0 (0.0%) |
| 15 Years | 0 (0.0%) | 0 (0.0%) |
| 16 and 17 Years | 0 (0.0%) | 0 (0.0%) |
| 18 to 24 Years | 23 (100.0%) | 0 (0.0%) |
| 25 to 34 Years | 0 (0.0%) | 0 (0.0%) |
| 35 to 44 Years | 10 (100.0%) | 10 (100.0%) |
| 45 to 54 Years | 35 (57.4%) | 23 (69.7%) |
| 55 to 64 Years | 12 (100.0%) | 6 (100.0%) |
| 65 to 74 Years | 38 (100.0%) | 55 (82.1%) |
| 75 Years and over | 29 (100.0%) | 13 (100.0%) |
| Total | 165 (76.7%) | 117 (77.0%) |
Income Below Poverty Among Married-Couple Families in Spring Lake
The poverty statistics for married-couple families in Spring Lake show that 9.1% or 10 of the total 110 families live below the poverty line. Families with 1 or 2 children have the highest poverty rate of 100.0%, comprising of 10 families. On the other hand, families with no children have the lowest poverty rate of 0.0%, which includes 0 families.
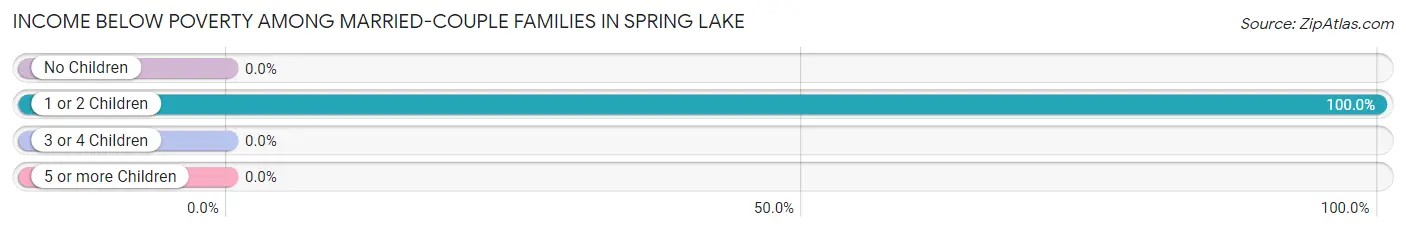
| Children | Above Poverty | Below Poverty |
| No Children | 90 (100.0%) | 0 (0.0%) |
| 1 or 2 Children | 0 (0.0%) | 10 (100.0%) |
| 3 or 4 Children | 10 (100.0%) | 0 (0.0%) |
| 5 or more Children | 0 (0.0%) | 0 (0.0%) |
| Total | 100 (90.9%) | 10 (9.1%) |
Income Below Poverty Among Single-Parent Households in Spring Lake
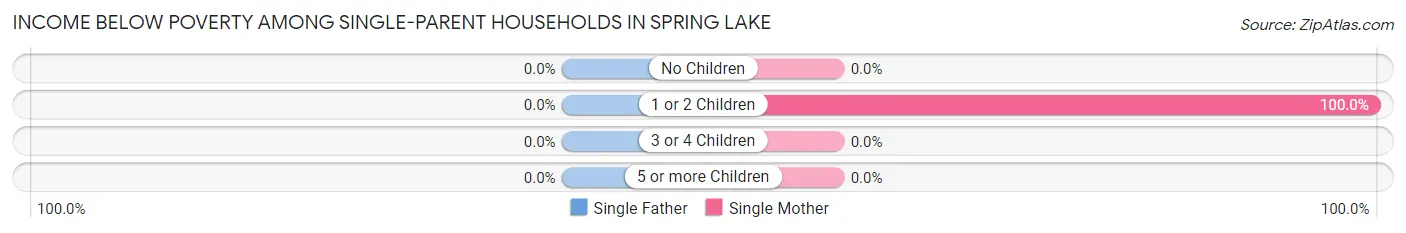
| Children | Single Father | Single Mother |
| No Children | 0 (0.0%) | 0 (0.0%) |
| 1 or 2 Children | 0 (0.0%) | 12 (100.0%) |
| 3 or 4 Children | 0 (0.0%) | 0 (0.0%) |
| 5 or more Children | 0 (0.0%) | 0 (0.0%) |
| Total | 0 (0.0%) | 12 (100.0%) |
Income Below Poverty Among Married-Couple vs Single-Parent Households in Spring Lake
The poverty data for Spring Lake shows that 10 of the married-couple family households (9.1%) and 12 of the single-parent households (100.0%) are living below the poverty level. Within the married-couple family households, those with 1 or 2 children have the highest poverty rate, with 10 households (100.0%) falling below the poverty line. Among the single-parent households, those with 1 or 2 children have the highest poverty rate, with 12 household (100.0%) living below poverty.
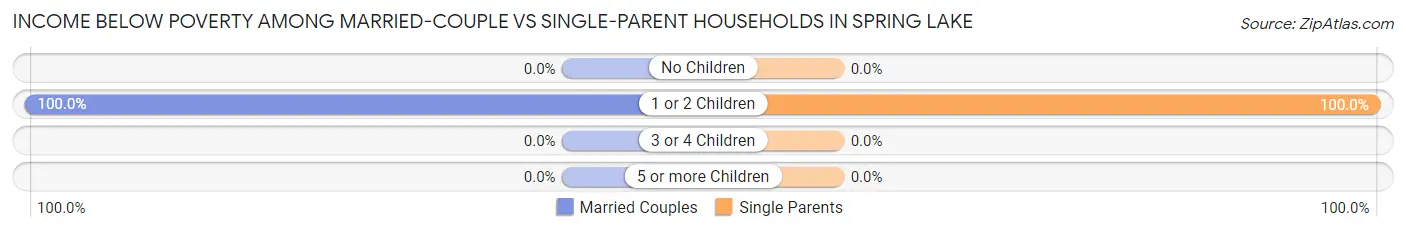
| Children | Married-Couple Families | Single-Parent Households |
| No Children | 0 (0.0%) | 0 (0.0%) |
| 1 or 2 Children | 10 (100.0%) | 12 (100.0%) |
| 3 or 4 Children | 0 (0.0%) | 0 (0.0%) |
| 5 or more Children | 0 (0.0%) | 0 (0.0%) |
| Total | 10 (9.1%) | 12 (100.0%) |
Race in Spring Lake
The most populous races in Spring Lake are White / Caucasian (368 | 99.5%), Hispanic or Latino (10 | 2.7%), and Native / Alaskan (2 | 0.5%).
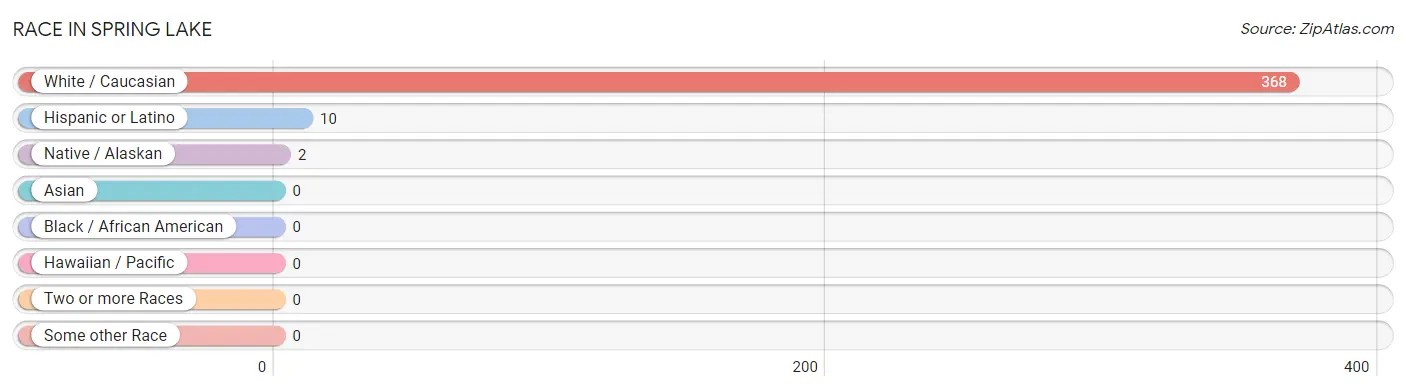
| Race | # Population | % Population |
| Asian | 0 | 0.0% |
| Black / African American | 0 | 0.0% |
| Hawaiian / Pacific | 0 | 0.0% |
| Hispanic or Latino | 10 | 2.7% |
| Native / Alaskan | 2 | 0.5% |
| White / Caucasian | 368 | 99.5% |
| Two or more Races | 0 | 0.0% |
| Some other Race | 0 | 0.0% |
| Total | 370 | 100.0% |
Ancestry in Spring Lake
The most populous ancestries reported in Spring Lake are American (48 | 13.0%), German (47 | 12.7%), Polish (41 | 11.1%), English (40 | 10.8%), and Irish (37 | 10.0%), together accounting for 57.6% of all Spring Lake residents.
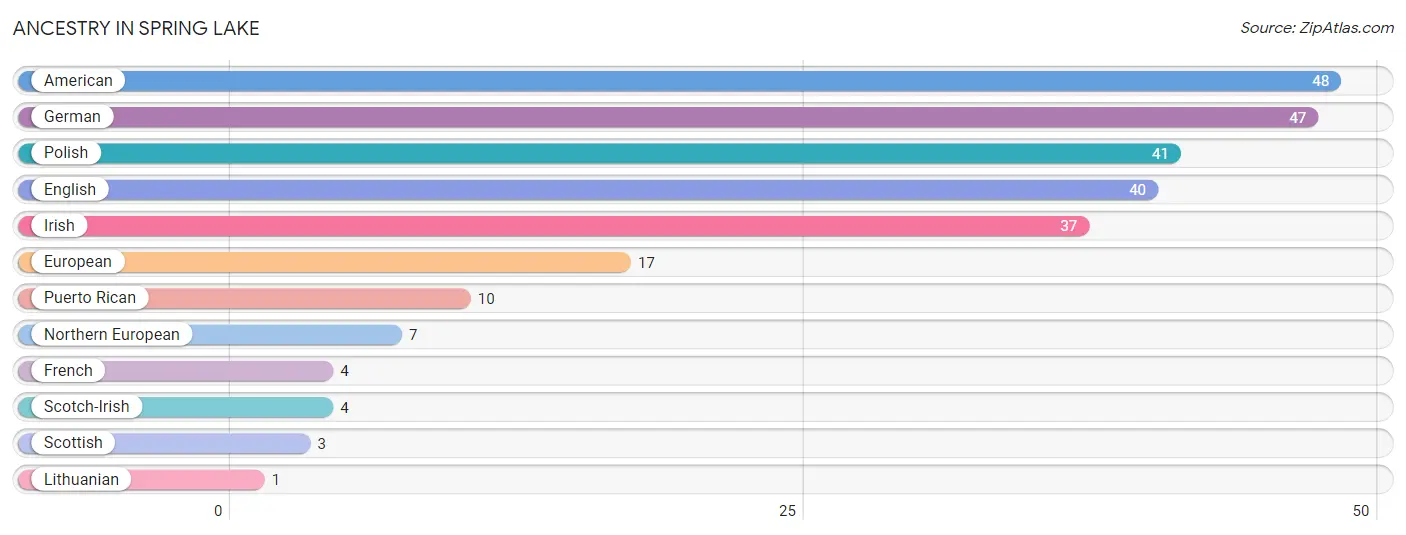
| Ancestry | # Population | % Population |
| American | 48 | 13.0% |
| English | 40 | 10.8% |
| European | 17 | 4.6% |
| French | 4 | 1.1% |
| German | 47 | 12.7% |
| Irish | 37 | 10.0% |
| Lithuanian | 1 | 0.3% |
| Northern European | 7 | 1.9% |
| Polish | 41 | 11.1% |
| Puerto Rican | 10 | 2.7% |
| Scotch-Irish | 4 | 1.1% |
| Scottish | 3 | 0.8% | View All 12 Rows |
Immigrants in Spring Lake

| Immigration Origin | # Population | % Population | View All 0 Rows |
Sex and Age in Spring Lake
Sex and Age in Spring Lake
The most populous age groups in Spring Lake are 50 to 54 Years (53 | 24.6%) for men and 65 to 69 Years (45 | 29.0%) for women.
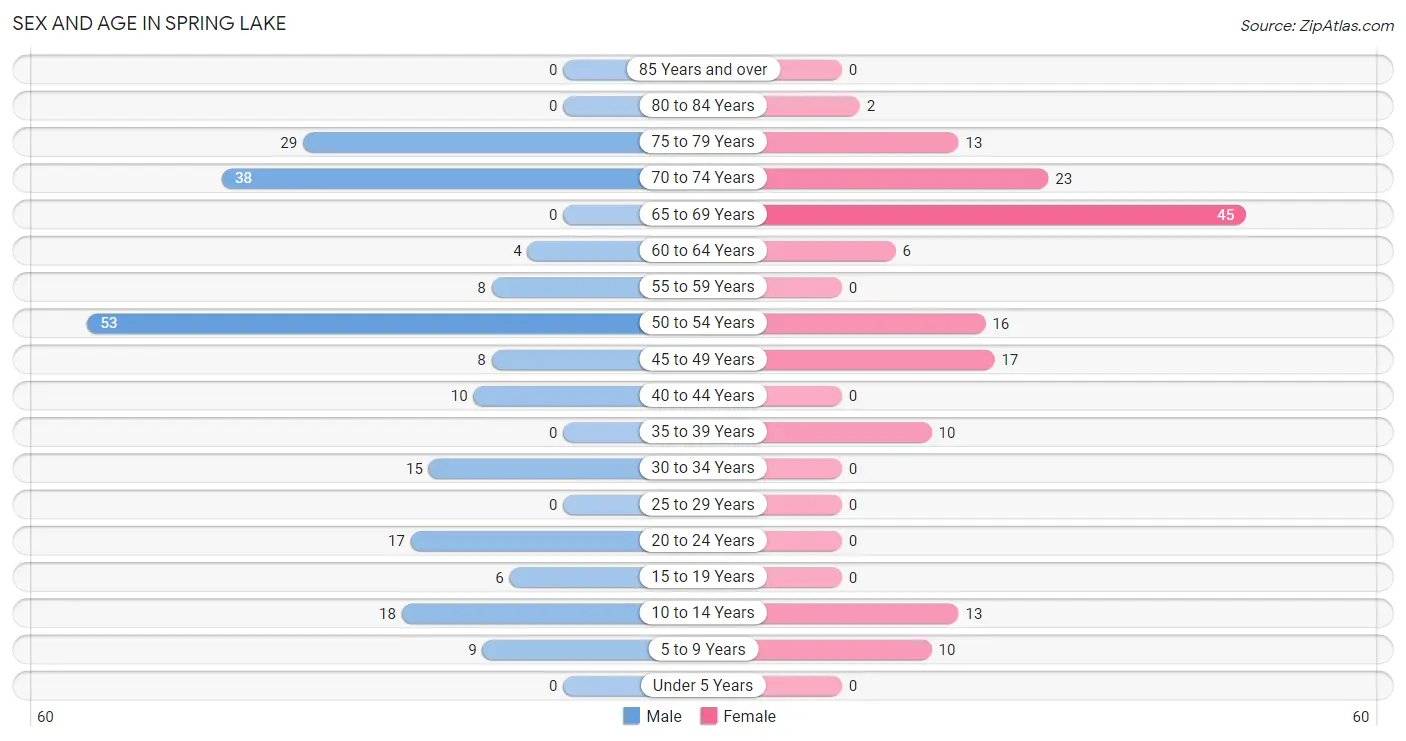
| Age Bracket | Male | Female |
| Under 5 Years | 0 (0.0%) | 0 (0.0%) |
| 5 to 9 Years | 9 (4.2%) | 10 (6.5%) |
| 10 to 14 Years | 18 (8.4%) | 13 (8.4%) |
| 15 to 19 Years | 6 (2.8%) | 0 (0.0%) |
| 20 to 24 Years | 17 (7.9%) | 0 (0.0%) |
| 25 to 29 Years | 0 (0.0%) | 0 (0.0%) |
| 30 to 34 Years | 15 (7.0%) | 0 (0.0%) |
| 35 to 39 Years | 0 (0.0%) | 10 (6.5%) |
| 40 to 44 Years | 10 (4.6%) | 0 (0.0%) |
| 45 to 49 Years | 8 (3.7%) | 17 (11.0%) |
| 50 to 54 Years | 53 (24.6%) | 16 (10.3%) |
| 55 to 59 Years | 8 (3.7%) | 0 (0.0%) |
| 60 to 64 Years | 4 (1.9%) | 6 (3.9%) |
| 65 to 69 Years | 0 (0.0%) | 45 (29.0%) |
| 70 to 74 Years | 38 (17.7%) | 23 (14.8%) |
| 75 to 79 Years | 29 (13.5%) | 13 (8.4%) |
| 80 to 84 Years | 0 (0.0%) | 2 (1.3%) |
| 85 Years and over | 0 (0.0%) | 0 (0.0%) |
| Total | 215 (100.0%) | 155 (100.0%) |
Families and Households in Spring Lake
Median Family Size in Spring Lake
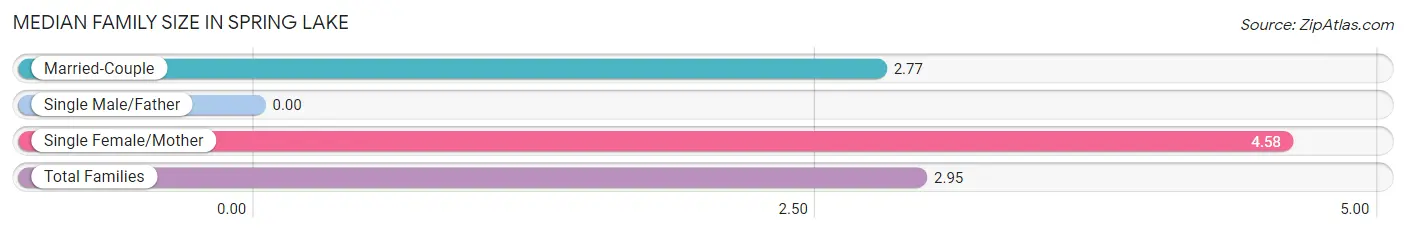
| Family Type | # Families | Family Size |
| Married-Couple | 110 (90.2%) | 2.77 |
| Single Male/Father | 0 (0.0%) | - |
| Single Female/Mother | 12 (9.8%) | 4.58 |
| Total Families | 122 (100.0%) | 2.95 |
Median Household Size in Spring Lake
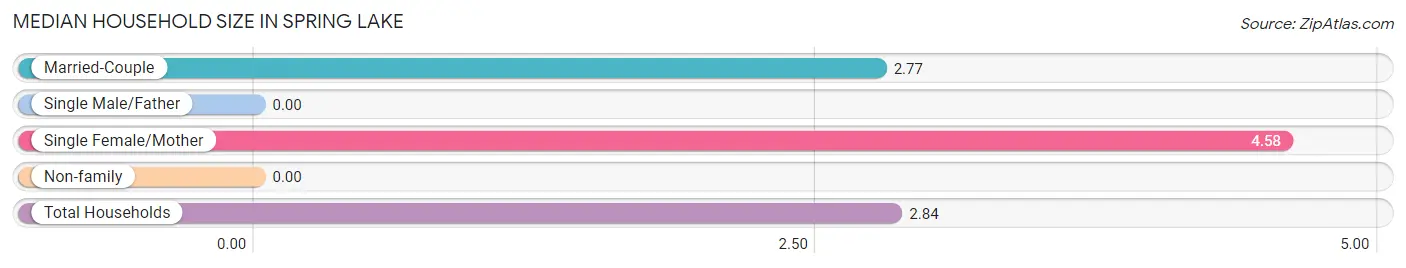
| Household Type | # Households | Household Size |
| Married-Couple | 110 (85.3%) | 2.77 |
| Single Male/Father | 0 (0.0%) | - |
| Single Female/Mother | 12 (9.3%) | 4.58 |
| Non-family | 7 (5.4%) | - |
| Total Households | 129 (100.0%) | 2.84 |
Household Size by Marriage Status in Spring Lake
Out of a total of 129 households in Spring Lake, 122 (94.6%) are family households, while 7 (5.4%) are nonfamily households. The most numerous type of family households are 2-person households, comprising 65, and the most common type of nonfamily households are 1-person households, comprising 7.
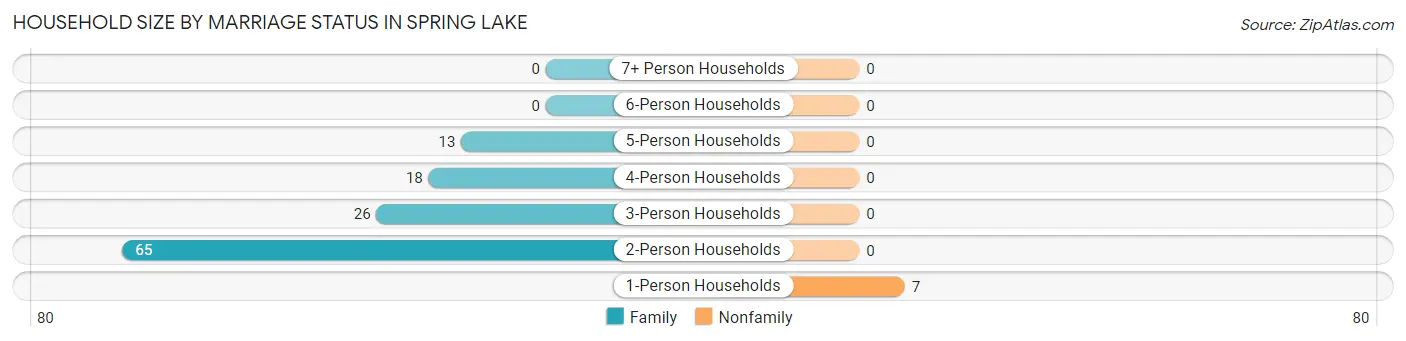
| Household Size | Family Households | Nonfamily Households |
| 1-Person Households | - | 7 (5.4%) |
| 2-Person Households | 65 (50.4%) | 0 (0.0%) |
| 3-Person Households | 26 (20.2%) | 0 (0.0%) |
| 4-Person Households | 18 (14.0%) | 0 (0.0%) |
| 5-Person Households | 13 (10.1%) | 0 (0.0%) |
| 6-Person Households | 0 (0.0%) | 0 (0.0%) |
| 7+ Person Households | 0 (0.0%) | 0 (0.0%) |
| Total | 122 (94.6%) | 7 (5.4%) |
Female Fertility in Spring Lake
Fertility by Age in Spring Lake
| Age Bracket | Women with Births | Births / 1,000 Women |
| 15 to 19 years | 0 (0.0%) | 0.0 |
| 20 to 34 years | 0 (0.0%) | 0.0 |
| 35 to 50 years | 0 (0.0%) | 0.0 |
| Total | 0 (0.0%) | 0.0 |
Fertility by Age by Marriage Status in Spring Lake
| Age Bracket | Married | Unmarried |
| 15 to 19 years | 0 (0.0%) | 0 (0.0%) |
| 20 to 34 years | 0 (0.0%) | 0 (0.0%) |
| 35 to 50 years | 0 (0.0%) | 0 (0.0%) |
| Total | 0 (0.0%) | 0 (0.0%) |
Fertility by Education in Spring Lake
| Educational Attainment | Women with Births | Births / 1,000 Women |
| Less than High School | 0 (0.0%) | 0.0 |
| High School Diploma | 0 (0.0%) | 0.0 |
| College or Associate's Degree | 0 (0.0%) | 0.0 |
| Bachelor's Degree | 0 (0.0%) | 0.0 |
| Graduate Degree | 0 (0.0%) | 0.0 |
| Total | 0 (0.0%) | 0.0 |
Fertility by Education by Marriage Status in Spring Lake
| Educational Attainment | Married | Unmarried |
| Less than High School | 0 (0.0%) | 0 (0.0%) |
| High School Diploma | 0 (0.0%) | 0 (0.0%) |
| College or Associate's Degree | 0 (0.0%) | 0 (0.0%) |
| Bachelor's Degree | 0 (0.0%) | 0 (0.0%) |
| Graduate Degree | 0 (0.0%) | 0 (0.0%) |
| Total | 0 (0.0%) | 0 (0.0%) |
Employment Characteristics in Spring Lake
Employment by Class of Employer in Spring Lake
Among the 115 employed individuals in Spring Lake, private company employees (47 | 40.9%), state government employees (33 | 28.7%), and local government employees (28 | 24.3%) make up the most common classes of employment.
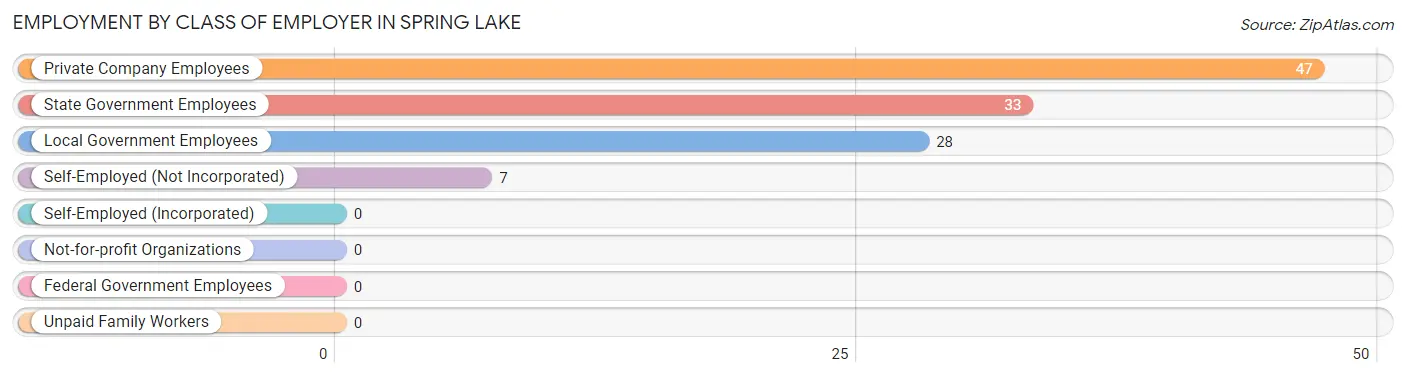
| Employer Class | # Employees | % Employees |
| Private Company Employees | 47 | 40.9% |
| Self-Employed (Incorporated) | 0 | 0.0% |
| Self-Employed (Not Incorporated) | 7 | 6.1% |
| Not-for-profit Organizations | 0 | 0.0% |
| Local Government Employees | 28 | 24.3% |
| State Government Employees | 33 | 28.7% |
| Federal Government Employees | 0 | 0.0% |
| Unpaid Family Workers | 0 | 0.0% |
| Total | 115 | 100.0% |
Employment Status by Age in Spring Lake
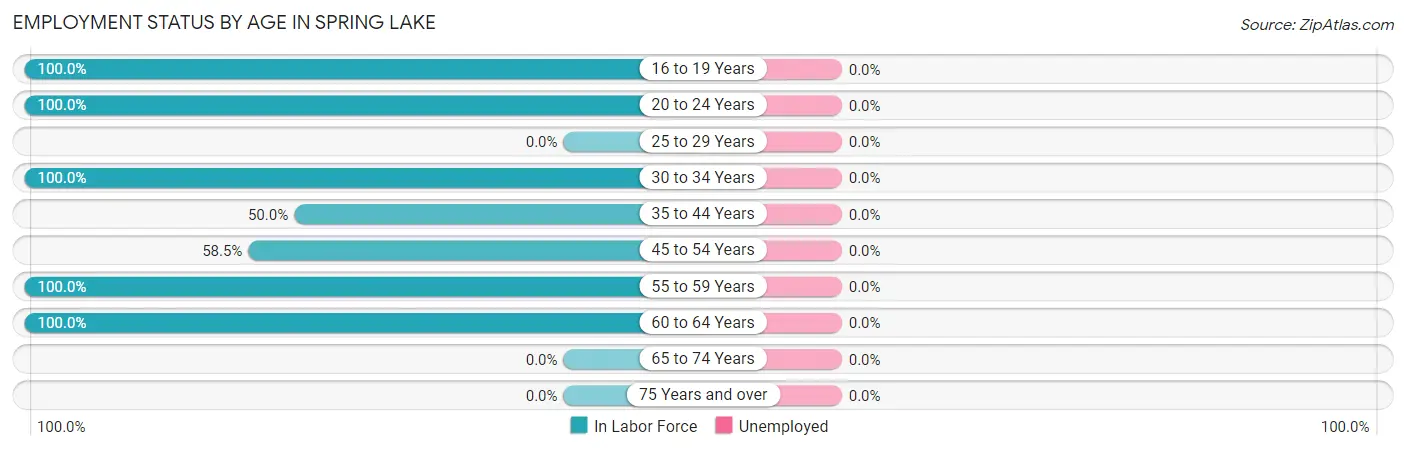
| Age Bracket | In Labor Force | Unemployed |
| 16 to 19 Years | 6 (100.0%) | 0 (0.0%) |
| 20 to 24 Years | 17 (100.0%) | 0 (0.0%) |
| 25 to 29 Years | 0 (0.0%) | 0 (0.0%) |
| 30 to 34 Years | 15 (100.0%) | 0 (0.0%) |
| 35 to 44 Years | 10 (50.0%) | 0 (0.0%) |
| 45 to 54 Years | 55 (58.5%) | 0 (0.0%) |
| 55 to 59 Years | 8 (100.0%) | 0 (0.0%) |
| 60 to 64 Years | 10 (100.0%) | 0 (0.0%) |
| 65 to 74 Years | 0 (0.0%) | 0 (0.0%) |
| 75 Years and over | 0 (0.0%) | 0 (0.0%) |
| Total | 121 (37.8%) | 0 (0.0%) |
Employment Status by Educational Attainment in Spring Lake
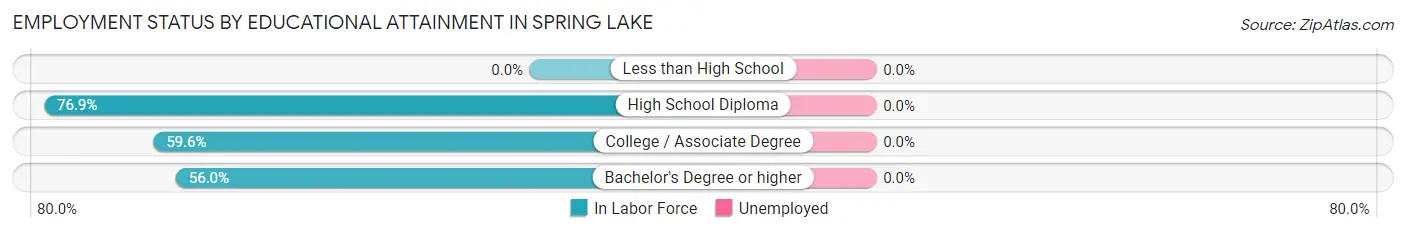
| Educational Attainment | In Labor Force | Unemployed |
| Less than High School | 0 (0.0%) | 0 (0.0%) |
| High School Diploma | 50 (76.9%) | 0 (0.0%) |
| College / Associate Degree | 34 (59.6%) | 0 (0.0%) |
| Bachelor's Degree or higher | 14 (56.0%) | 0 (0.0%) |
| Total | 98 (66.7%) | 0 (0.0%) |
Employment Occupations by Sex in Spring Lake
Management, Business, Science and Arts Occupations
The most common Management, Business, Science and Arts occupations in Spring Lake are Community & Social Service (28 | 23.1%), Education Instruction & Library (28 | 23.1%), Computers, Engineering & Science (17 | 14.1%), Computers & Mathematics (10 | 8.3%), and Architecture & Engineering (7 | 5.8%).
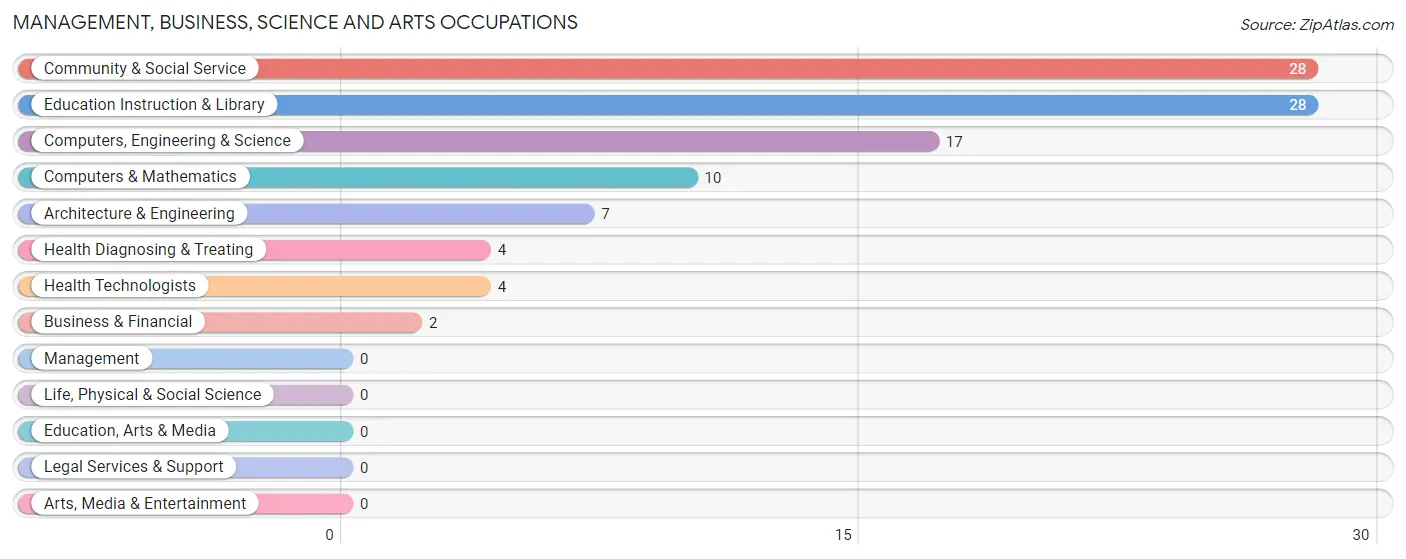
Management, Business, Science and Arts Occupations by Sex
Within the Management, Business, Science and Arts occupations in Spring Lake, the most male-oriented occupations are Computers, Engineering & Science (100.0%), Computers & Mathematics (100.0%), and Architecture & Engineering (100.0%), while the most female-oriented occupations are Business & Financial (100.0%), Health Diagnosing & Treating (100.0%), and Health Technologists (100.0%).
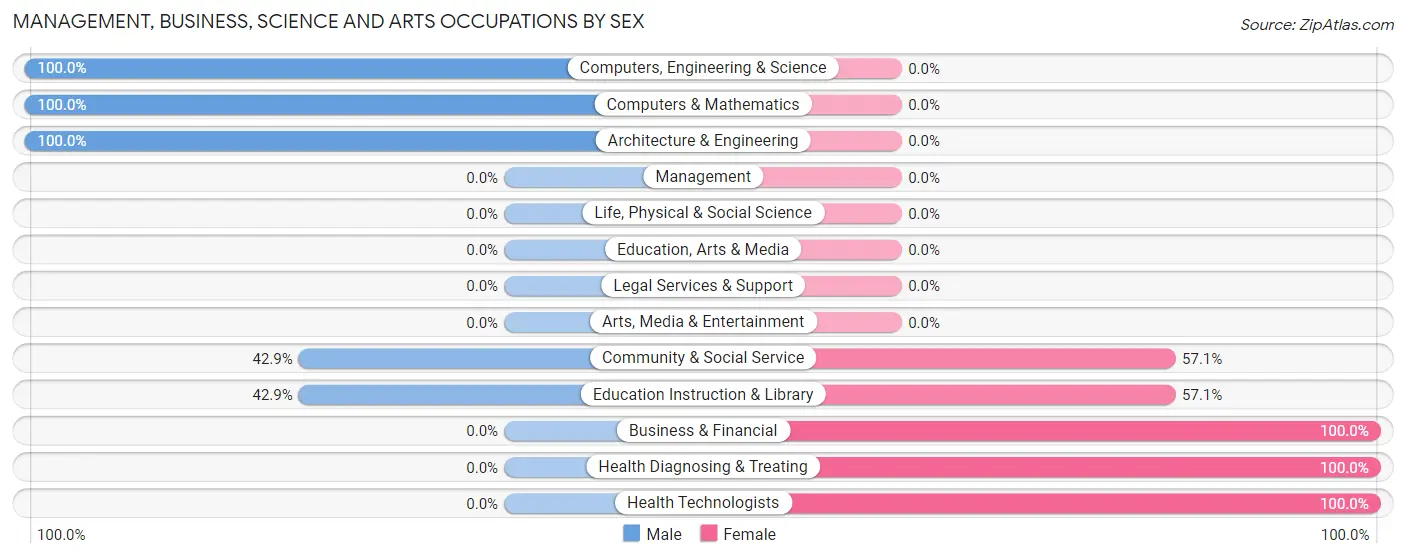
| Occupation | Male | Female |
| Management | 0 (0.0%) | 0 (0.0%) |
| Business & Financial | 0 (0.0%) | 2 (100.0%) |
| Computers, Engineering & Science | 17 (100.0%) | 0 (0.0%) |
| Computers & Mathematics | 10 (100.0%) | 0 (0.0%) |
| Architecture & Engineering | 7 (100.0%) | 0 (0.0%) |
| Life, Physical & Social Science | 0 (0.0%) | 0 (0.0%) |
| Community & Social Service | 12 (42.9%) | 16 (57.1%) |
| Education, Arts & Media | 0 (0.0%) | 0 (0.0%) |
| Legal Services & Support | 0 (0.0%) | 0 (0.0%) |
| Education Instruction & Library | 12 (42.9%) | 16 (57.1%) |
| Arts, Media & Entertainment | 0 (0.0%) | 0 (0.0%) |
| Health Diagnosing & Treating | 0 (0.0%) | 4 (100.0%) |
| Health Technologists | 0 (0.0%) | 4 (100.0%) |
| Total (Category) | 29 (56.9%) | 22 (43.1%) |
| Total (Overall) | 95 (78.5%) | 26 (21.5%) |
Services Occupations
The most common Services occupations in Spring Lake are , and Food Preparation & Serving (15 | 12.4%).
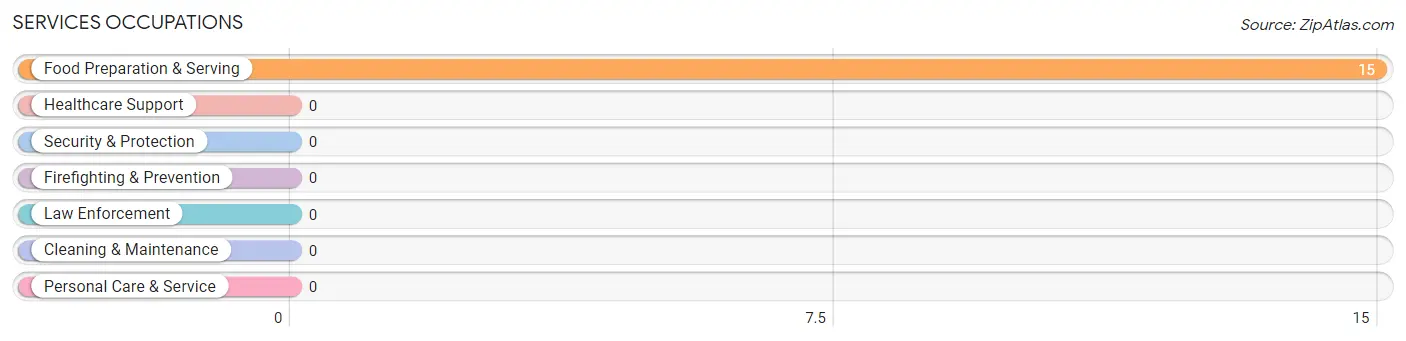
Services Occupations by Sex
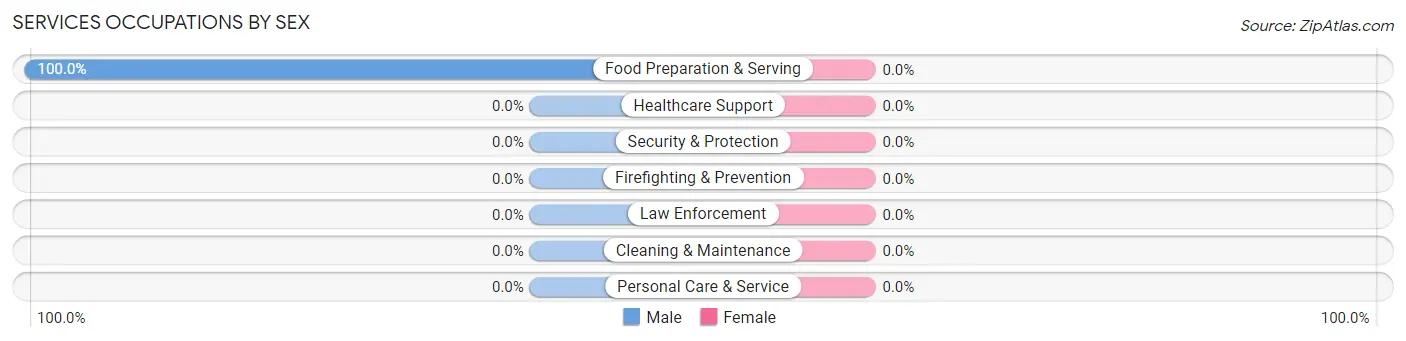
| Occupation | Male | Female |
| Healthcare Support | 0 (0.0%) | 0 (0.0%) |
| Security & Protection | 0 (0.0%) | 0 (0.0%) |
| Firefighting & Prevention | 0 (0.0%) | 0 (0.0%) |
| Law Enforcement | 0 (0.0%) | 0 (0.0%) |
| Food Preparation & Serving | 15 (100.0%) | 0 (0.0%) |
| Cleaning & Maintenance | 0 (0.0%) | 0 (0.0%) |
| Personal Care & Service | 0 (0.0%) | 0 (0.0%) |
| Total (Category) | 15 (100.0%) | 0 (0.0%) |
| Total (Overall) | 95 (78.5%) | 26 (21.5%) |
Sales and Office Occupations
The most common Sales and Office occupations in Spring Lake are , and Office & Administration (4 | 3.3%).
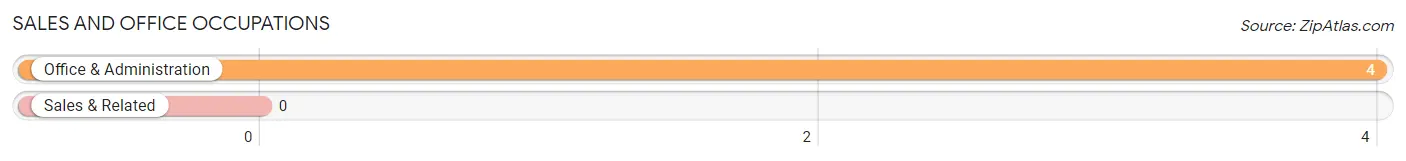
Sales and Office Occupations by Sex
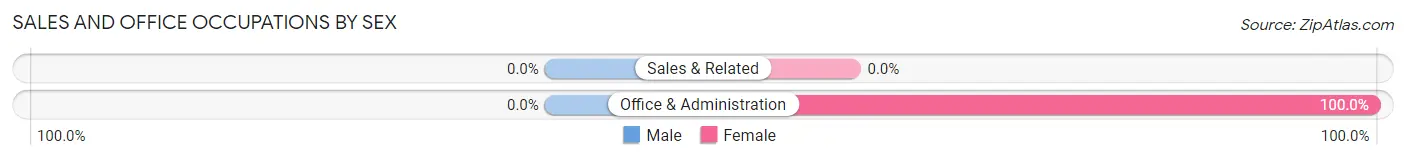
| Occupation | Male | Female |
| Sales & Related | 0 (0.0%) | 0 (0.0%) |
| Office & Administration | 0 (0.0%) | 4 (100.0%) |
| Total (Category) | 0 (0.0%) | 4 (100.0%) |
| Total (Overall) | 95 (78.5%) | 26 (21.5%) |
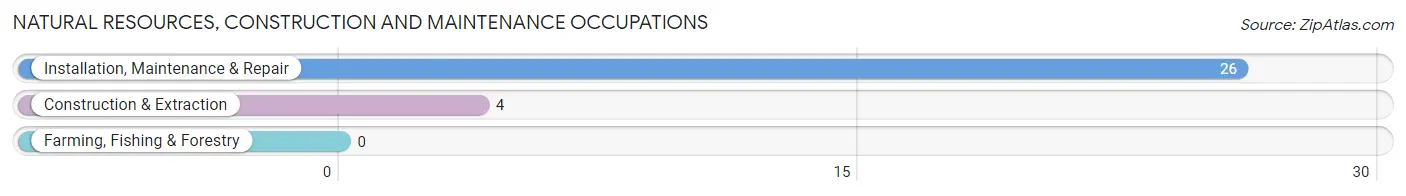
Natural Resources, Construction and Maintenance Occupations
The most common Natural Resources, Construction and Maintenance occupations in Spring Lake are Installation, Maintenance & Repair (26 | 21.5%), and Construction & Extraction (4 | 3.3%).
Natural Resources, Construction and Maintenance Occupations by Sex
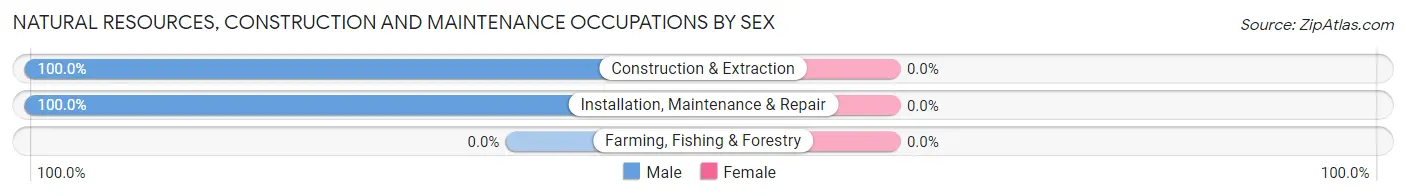
| Occupation | Male | Female |
| Farming, Fishing & Forestry | 0 (0.0%) | 0 (0.0%) |
| Construction & Extraction | 4 (100.0%) | 0 (0.0%) |
| Installation, Maintenance & Repair | 26 (100.0%) | 0 (0.0%) |
| Total (Category) | 30 (100.0%) | 0 (0.0%) |
| Total (Overall) | 95 (78.5%) | 26 (21.5%) |
Production, Transportation and Moving Occupations
The most common Production, Transportation and Moving occupations in Spring Lake are Material Moving (17 | 14.1%), and Transportation (4 | 3.3%).
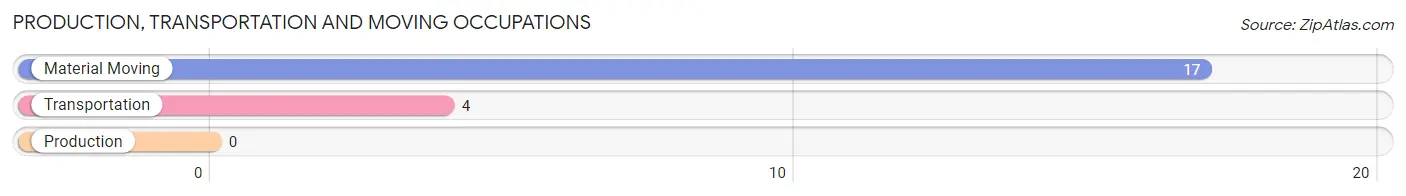
Production, Transportation and Moving Occupations by Sex
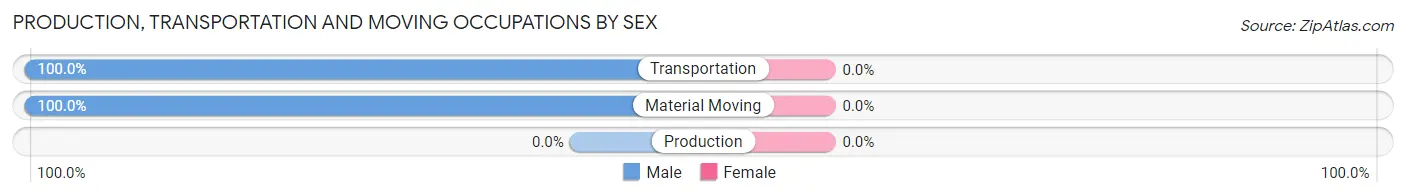
| Occupation | Male | Female |
| Production | 0 (0.0%) | 0 (0.0%) |
| Transportation | 4 (100.0%) | 0 (0.0%) |
| Material Moving | 17 (100.0%) | 0 (0.0%) |
| Total (Category) | 21 (100.0%) | 0 (0.0%) |
| Total (Overall) | 95 (78.5%) | 26 (21.5%) |
Employment Industries by Sex in Spring Lake
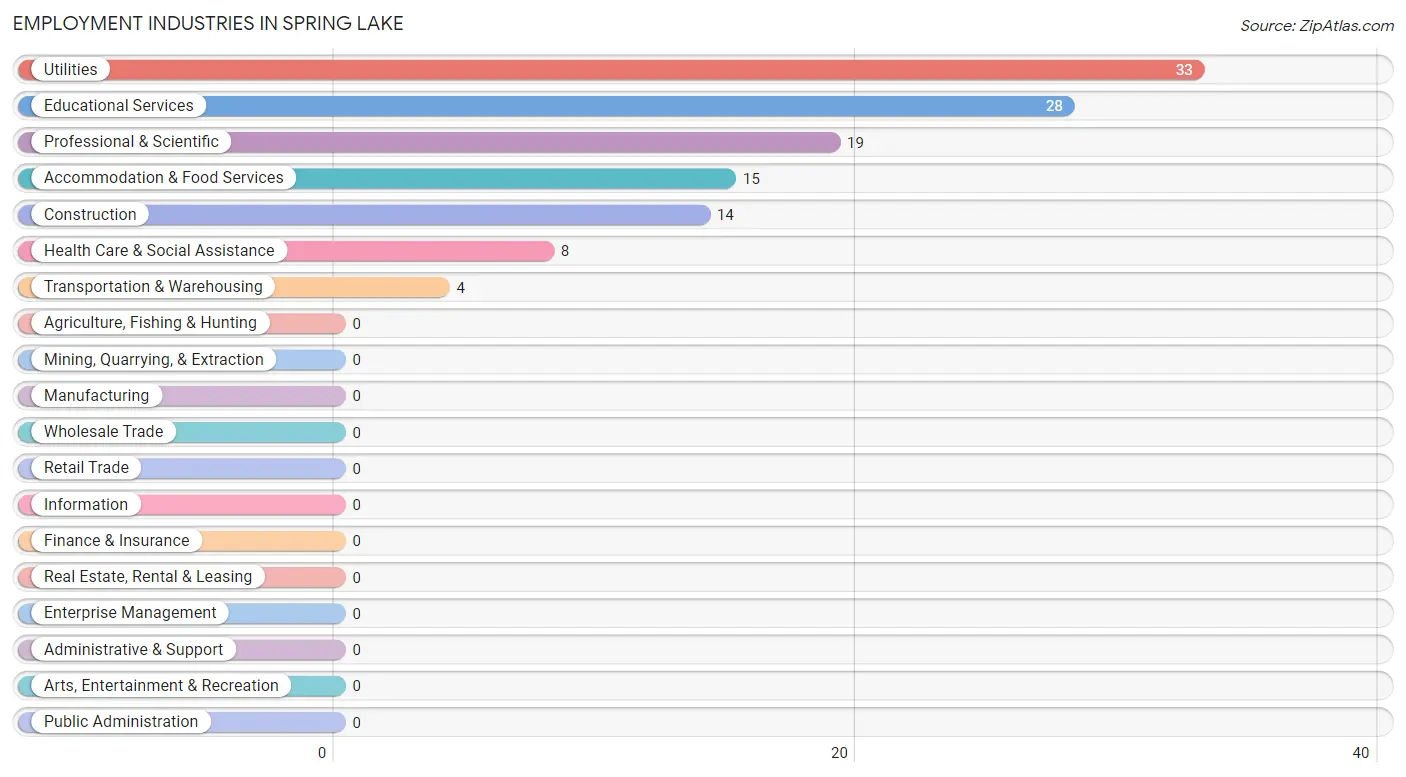
Employment Industries in Spring Lake
The major employment industries in Spring Lake include Utilities (33 | 27.3%), Educational Services (28 | 23.1%), Professional & Scientific (19 | 15.7%), Accommodation & Food Services (15 | 12.4%), and Construction (14 | 11.6%).
Employment Industries by Sex in Spring Lake
The Spring Lake industries that see more men than women are Construction (100.0%), Transportation & Warehousing (100.0%), and Utilities (100.0%), whereas the industries that tend to have a higher number of women are Health Care & Social Assistance (100.0%), Educational Services (57.1%), and Professional & Scientific (10.5%).
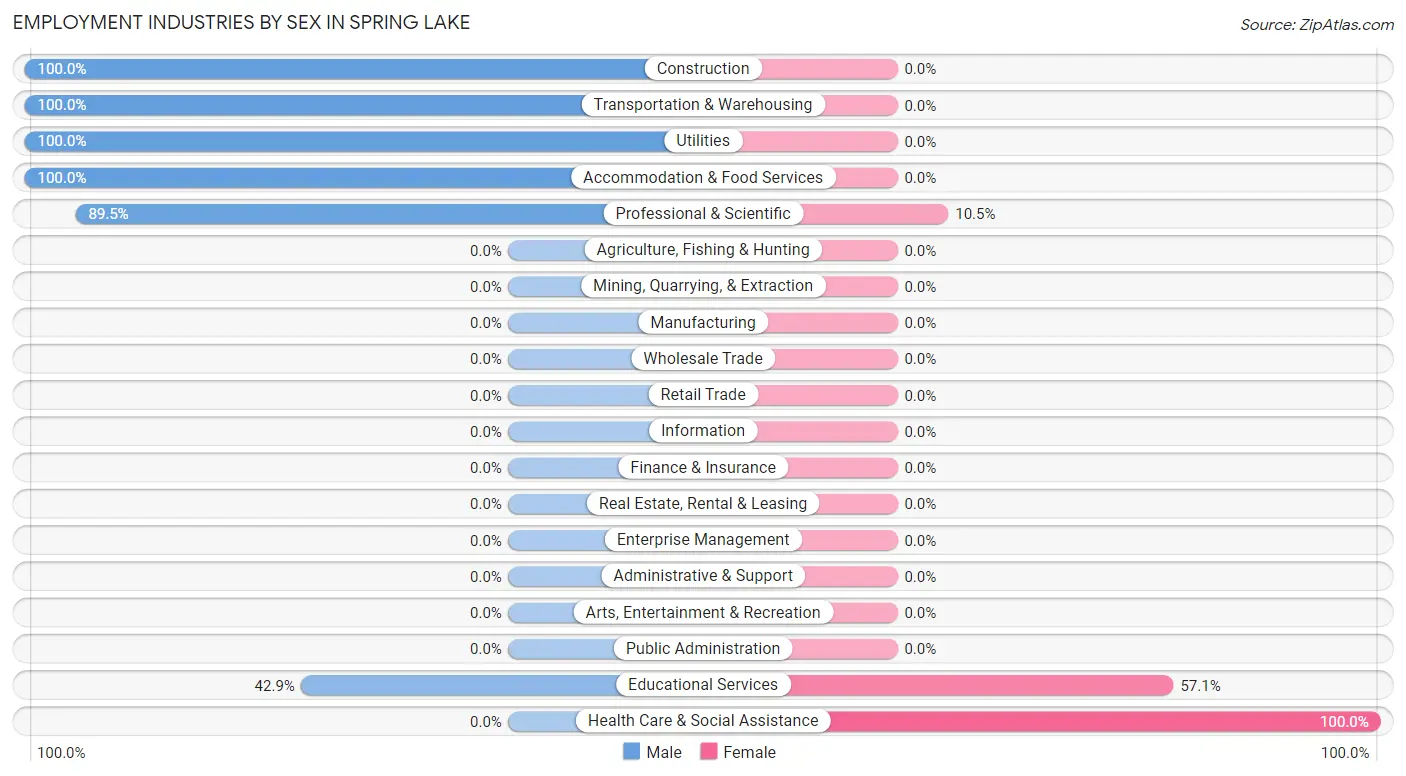
| Industry | Male | Female |
| Agriculture, Fishing & Hunting | 0 (0.0%) | 0 (0.0%) |
| Mining, Quarrying, & Extraction | 0 (0.0%) | 0 (0.0%) |
| Construction | 14 (100.0%) | 0 (0.0%) |
| Manufacturing | 0 (0.0%) | 0 (0.0%) |
| Wholesale Trade | 0 (0.0%) | 0 (0.0%) |
| Retail Trade | 0 (0.0%) | 0 (0.0%) |
| Transportation & Warehousing | 4 (100.0%) | 0 (0.0%) |
| Utilities | 33 (100.0%) | 0 (0.0%) |
| Information | 0 (0.0%) | 0 (0.0%) |
| Finance & Insurance | 0 (0.0%) | 0 (0.0%) |
| Real Estate, Rental & Leasing | 0 (0.0%) | 0 (0.0%) |
| Professional & Scientific | 17 (89.5%) | 2 (10.5%) |
| Enterprise Management | 0 (0.0%) | 0 (0.0%) |
| Administrative & Support | 0 (0.0%) | 0 (0.0%) |
| Educational Services | 12 (42.9%) | 16 (57.1%) |
| Health Care & Social Assistance | 0 (0.0%) | 8 (100.0%) |
| Arts, Entertainment & Recreation | 0 (0.0%) | 0 (0.0%) |
| Accommodation & Food Services | 15 (100.0%) | 0 (0.0%) |
| Public Administration | 0 (0.0%) | 0 (0.0%) |
| Total | 95 (78.5%) | 26 (21.5%) |
Education in Spring Lake
School Enrollment in Spring Lake
The most common levels of schooling among the 67 students in Spring Lake are middle school (31 | 46.3%), college / undergraduate (17 | 25.4%), and kindergarten (10 | 14.9%).
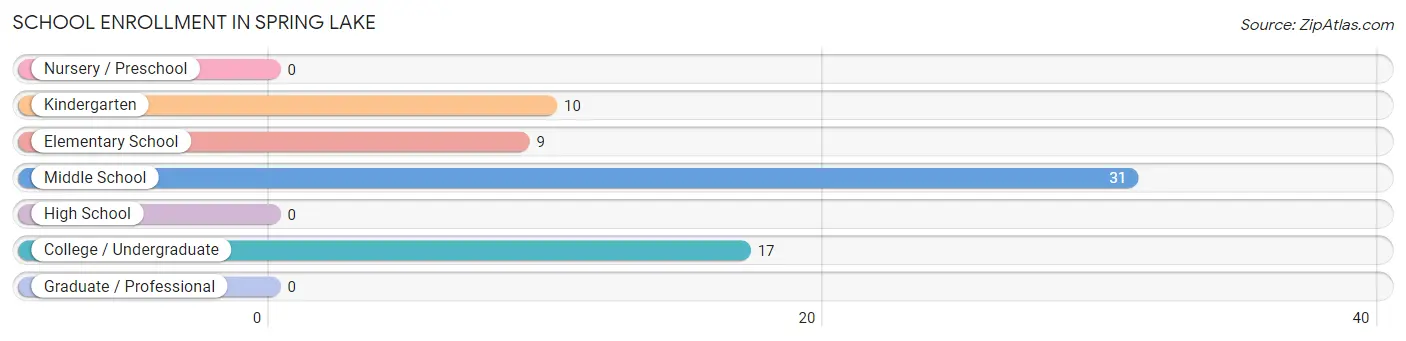
| School Level | # Students | % Students |
| Nursery / Preschool | 0 | 0.0% |
| Kindergarten | 10 | 14.9% |
| Elementary School | 9 | 13.4% |
| Middle School | 31 | 46.3% |
| High School | 0 | 0.0% |
| College / Undergraduate | 17 | 25.4% |
| Graduate / Professional | 0 | 0.0% |
| Total | 67 | 100.0% |
School Enrollment by Age by Funding Source in Spring Lake
Out of a total of 67 students who are enrolled in schools in Spring Lake, 28 (41.8%) attend a private institution, while the remaining 39 (58.2%) are enrolled in public schools. The age group of 5 to 9 year old has the highest likelihood of being enrolled in private schools, with 19 (100.0% in the age bracket) enrolled. Conversely, the age group of 20 to 24 year olds has the lowest likelihood of being enrolled in a private school, with 17 (100.0% in the age bracket) attending a public institution.
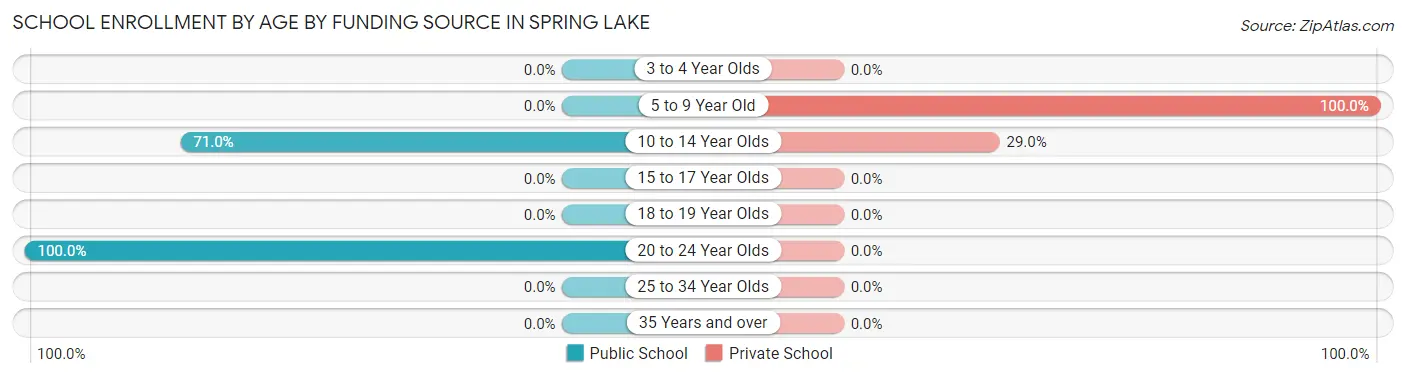
| Age Bracket | Public School | Private School |
| 3 to 4 Year Olds | 0 (0.0%) | 0 (0.0%) |
| 5 to 9 Year Old | 0 (0.0%) | 19 (100.0%) |
| 10 to 14 Year Olds | 22 (71.0%) | 9 (29.0%) |
| 15 to 17 Year Olds | 0 (0.0%) | 0 (0.0%) |
| 18 to 19 Year Olds | 0 (0.0%) | 0 (0.0%) |
| 20 to 24 Year Olds | 17 (100.0%) | 0 (0.0%) |
| 25 to 34 Year Olds | 0 (0.0%) | 0 (0.0%) |
| 35 Years and over | 0 (0.0%) | 0 (0.0%) |
| Total | 39 (58.2%) | 28 (41.8%) |
Educational Attainment by Field of Study in Spring Lake
Arts & humanities (21 | 21.6%), engineering (14 | 14.4%), business (13 | 13.4%), multidisciplinary studies (11 | 11.3%), and education (11 | 11.3%) are the most common fields of study among 97 individuals in Spring Lake who have obtained a bachelor's degree or higher.
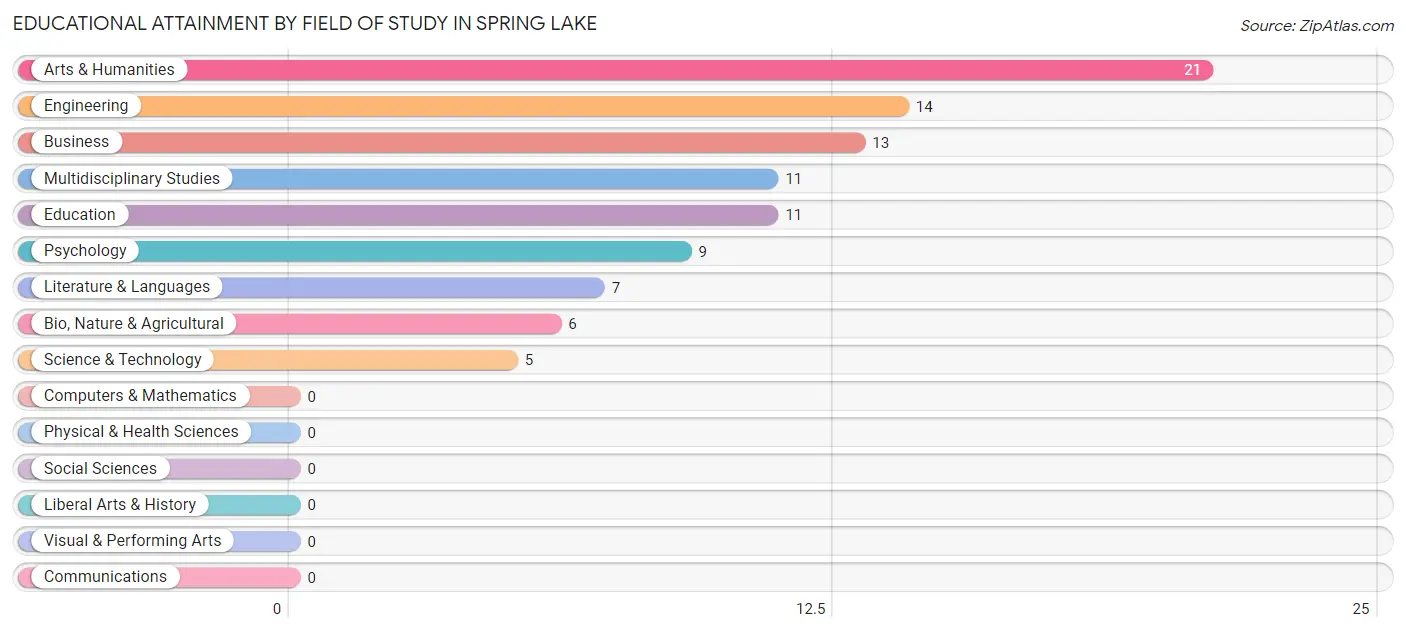
| Field of Study | # Graduates | % Graduates |
| Computers & Mathematics | 0 | 0.0% |
| Bio, Nature & Agricultural | 6 | 6.2% |
| Physical & Health Sciences | 0 | 0.0% |
| Psychology | 9 | 9.3% |
| Social Sciences | 0 | 0.0% |
| Engineering | 14 | 14.4% |
| Multidisciplinary Studies | 11 | 11.3% |
| Science & Technology | 5 | 5.1% |
| Business | 13 | 13.4% |
| Education | 11 | 11.3% |
| Literature & Languages | 7 | 7.2% |
| Liberal Arts & History | 0 | 0.0% |
| Visual & Performing Arts | 0 | 0.0% |
| Communications | 0 | 0.0% |
| Arts & Humanities | 21 | 21.6% |
| Total | 97 | 100.0% |
Transportation & Commute in Spring Lake
Vehicle Availability by Sex in Spring Lake
The most prevalent vehicle ownership categories in Spring Lake are males with 2 vehicles (37, accounting for 40.7%) and females with 2 vehicles (10, making up 154.2%).
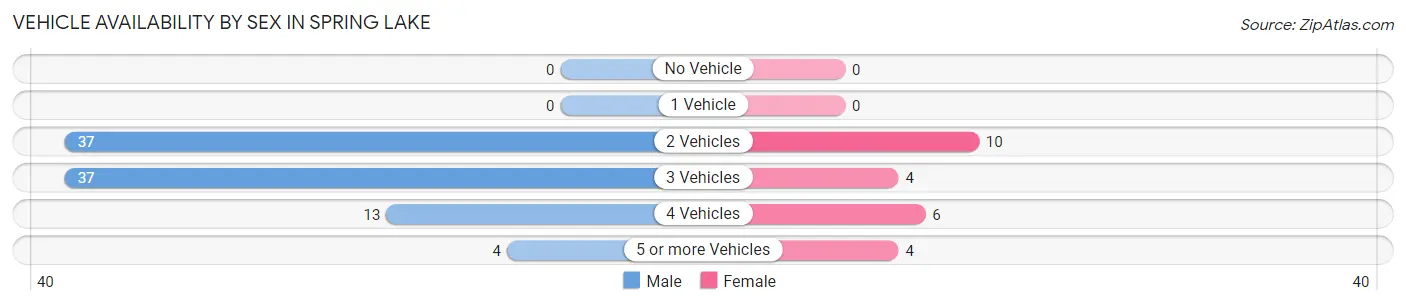
| Vehicles Available | Male | Female |
| No Vehicle | 0 (0.0%) | 0 (0.0%) |
| 1 Vehicle | 0 (0.0%) | 0 (0.0%) |
| 2 Vehicles | 37 (40.7%) | 10 (41.7%) |
| 3 Vehicles | 37 (40.7%) | 4 (16.7%) |
| 4 Vehicles | 13 (14.3%) | 6 (25.0%) |
| 5 or more Vehicles | 4 (4.4%) | 4 (16.7%) |
| Total | 91 (100.0%) | 24 (100.0%) |
Commute Time in Spring Lake
The most frequently occuring commute durations in Spring Lake are 15 to 19 minutes (41 commuters, 41.8%), 30 to 34 minutes (15 commuters, 15.3%), and 40 to 44 minutes (10 commuters, 10.2%).
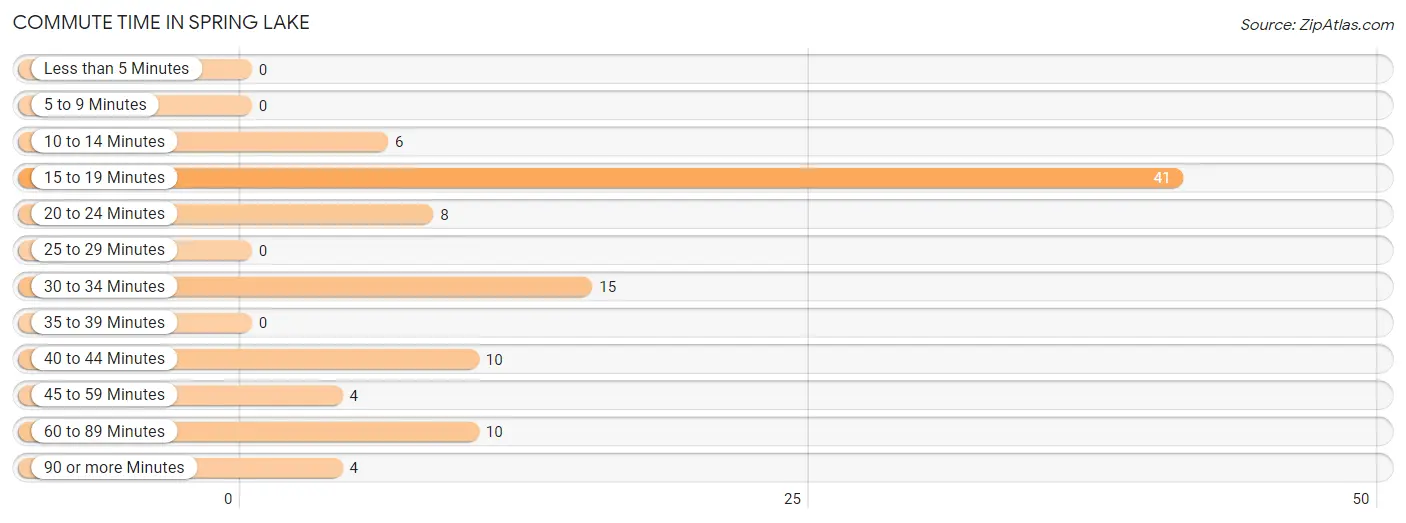
| Commute Time | # Commuters | % Commuters |
| Less than 5 Minutes | 0 | 0.0% |
| 5 to 9 Minutes | 0 | 0.0% |
| 10 to 14 Minutes | 6 | 6.1% |
| 15 to 19 Minutes | 41 | 41.8% |
| 20 to 24 Minutes | 8 | 8.2% |
| 25 to 29 Minutes | 0 | 0.0% |
| 30 to 34 Minutes | 15 | 15.3% |
| 35 to 39 Minutes | 0 | 0.0% |
| 40 to 44 Minutes | 10 | 10.2% |
| 45 to 59 Minutes | 4 | 4.1% |
| 60 to 89 Minutes | 10 | 10.2% |
| 90 or more Minutes | 4 | 4.1% |
Commute Time by Sex in Spring Lake
The most common commute times in Spring Lake are 15 to 19 minutes (37 commuters, 50.0%) for males and 40 to 44 minutes (10 commuters, 41.7%) for females.
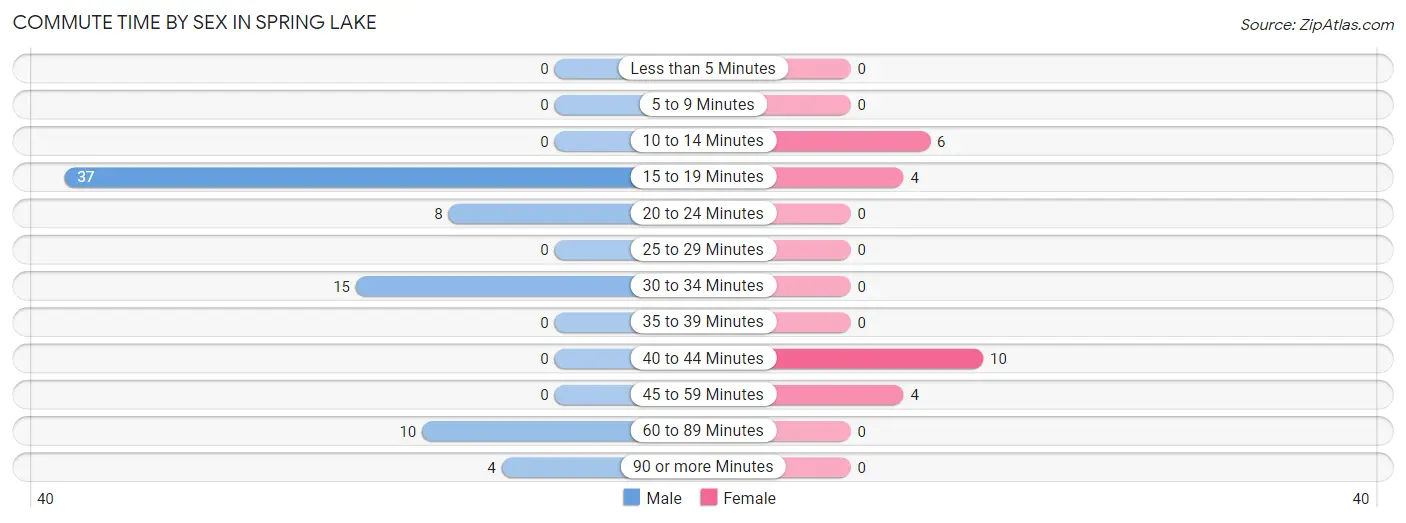
| Commute Time | Male | Female |
| Less than 5 Minutes | 0 (0.0%) | 0 (0.0%) |
| 5 to 9 Minutes | 0 (0.0%) | 0 (0.0%) |
| 10 to 14 Minutes | 0 (0.0%) | 6 (25.0%) |
| 15 to 19 Minutes | 37 (50.0%) | 4 (16.7%) |
| 20 to 24 Minutes | 8 (10.8%) | 0 (0.0%) |
| 25 to 29 Minutes | 0 (0.0%) | 0 (0.0%) |
| 30 to 34 Minutes | 15 (20.3%) | 0 (0.0%) |
| 35 to 39 Minutes | 0 (0.0%) | 0 (0.0%) |
| 40 to 44 Minutes | 0 (0.0%) | 10 (41.7%) |
| 45 to 59 Minutes | 0 (0.0%) | 4 (16.7%) |
| 60 to 89 Minutes | 10 (13.5%) | 0 (0.0%) |
| 90 or more Minutes | 4 (5.4%) | 0 (0.0%) |
Time of Departure to Work by Sex in Spring Lake
The most frequent times of departure to work in Spring Lake are 5:00 AM to 5:29 AM (17, 23.0%) for males and 6:30 AM to 6:59 AM (10, 41.7%) for females.
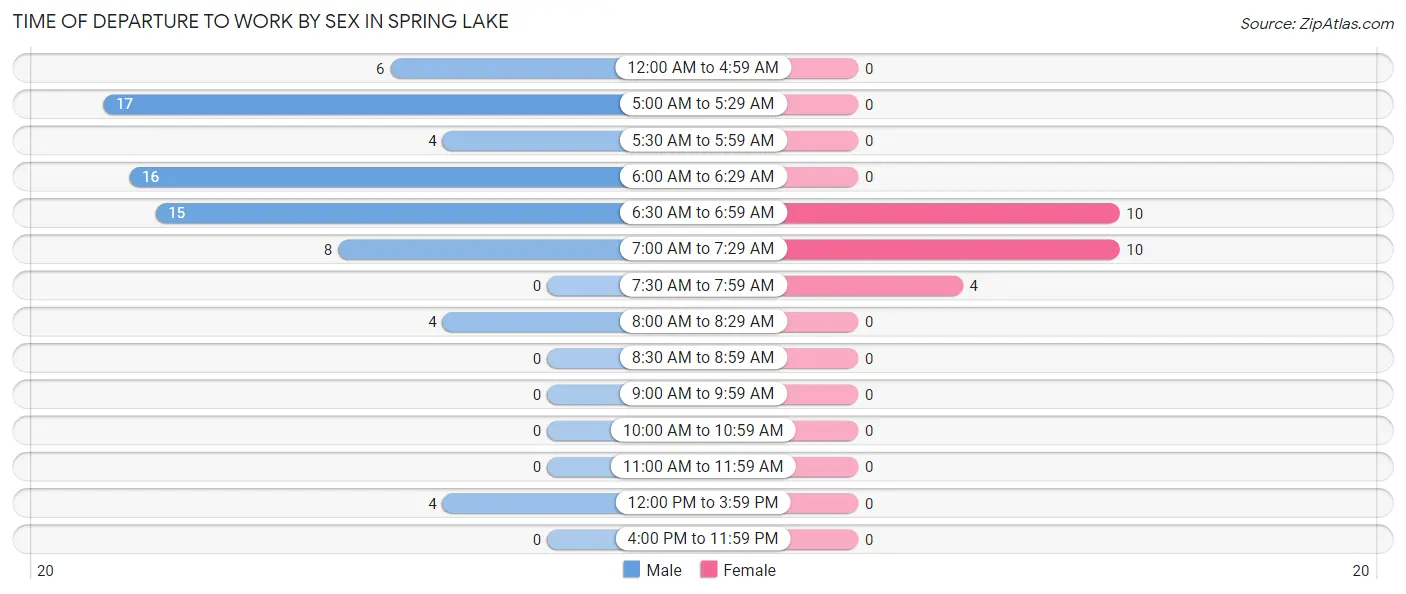
| Time of Departure | Male | Female |
| 12:00 AM to 4:59 AM | 6 (8.1%) | 0 (0.0%) |
| 5:00 AM to 5:29 AM | 17 (23.0%) | 0 (0.0%) |
| 5:30 AM to 5:59 AM | 4 (5.4%) | 0 (0.0%) |
| 6:00 AM to 6:29 AM | 16 (21.6%) | 0 (0.0%) |
| 6:30 AM to 6:59 AM | 15 (20.3%) | 10 (41.7%) |
| 7:00 AM to 7:29 AM | 8 (10.8%) | 10 (41.7%) |
| 7:30 AM to 7:59 AM | 0 (0.0%) | 4 (16.7%) |
| 8:00 AM to 8:29 AM | 4 (5.4%) | 0 (0.0%) |
| 8:30 AM to 8:59 AM | 0 (0.0%) | 0 (0.0%) |
| 9:00 AM to 9:59 AM | 0 (0.0%) | 0 (0.0%) |
| 10:00 AM to 10:59 AM | 0 (0.0%) | 0 (0.0%) |
| 11:00 AM to 11:59 AM | 0 (0.0%) | 0 (0.0%) |
| 12:00 PM to 3:59 PM | 4 (5.4%) | 0 (0.0%) |
| 4:00 PM to 11:59 PM | 0 (0.0%) | 0 (0.0%) |
| Total | 74 (100.0%) | 24 (100.0%) |
Housing Occupancy in Spring Lake
Occupancy by Ownership in Spring Lake
Of the total 129 dwellings in Spring Lake, owner-occupied units account for 129 (100.0%), while renter-occupied units make up 0 (0.0%).
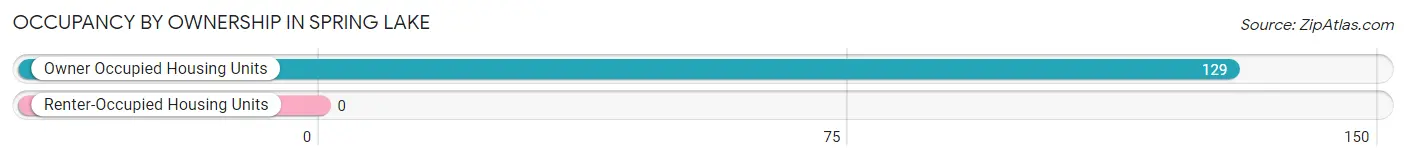
| Occupancy | # Housing Units | % Housing Units |
| Owner Occupied Housing Units | 129 | 100.0% |
| Renter-Occupied Housing Units | 0 | 0.0% |
| Total Occupied Housing Units | 129 | 100.0% |
Occupancy by Household Size in Spring Lake
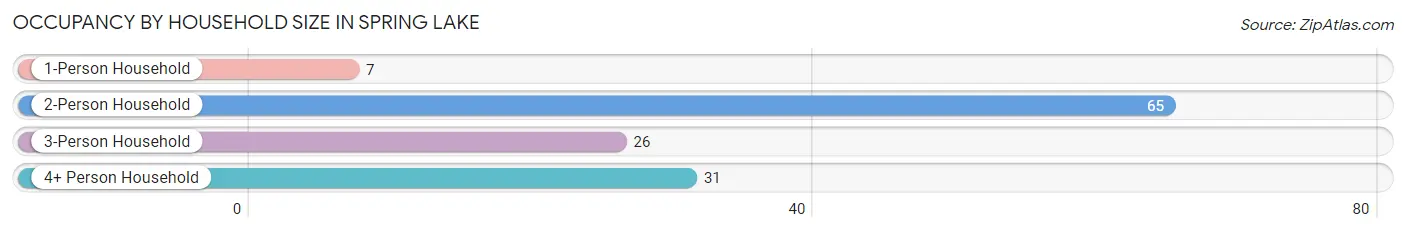
| Household Size | # Housing Units | % Housing Units |
| 1-Person Household | 7 | 5.4% |
| 2-Person Household | 65 | 50.4% |
| 3-Person Household | 26 | 20.2% |
| 4+ Person Household | 31 | 24.0% |
| Total Housing Units | 129 | 100.0% |
Occupancy by Ownership by Household Size in Spring Lake
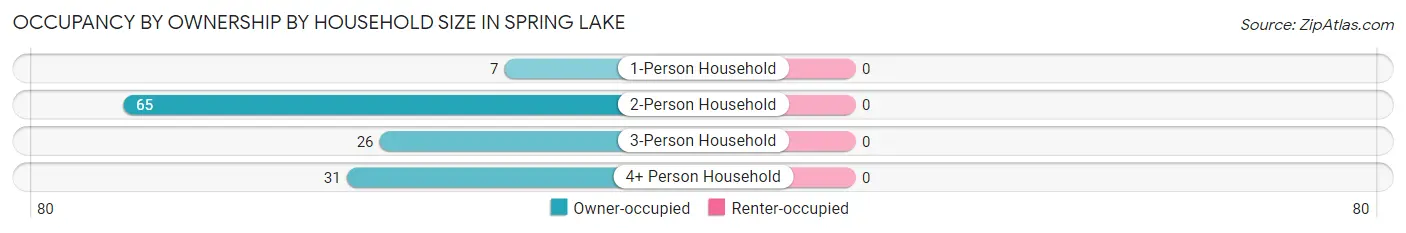
| Household Size | Owner-occupied | Renter-occupied |
| 1-Person Household | 7 (100.0%) | 0 (0.0%) |
| 2-Person Household | 65 (100.0%) | 0 (0.0%) |
| 3-Person Household | 26 (100.0%) | 0 (0.0%) |
| 4+ Person Household | 31 (100.0%) | 0 (0.0%) |
| Total Housing Units | 129 (100.0%) | 0 (0.0%) |
Occupancy by Educational Attainment in Spring Lake
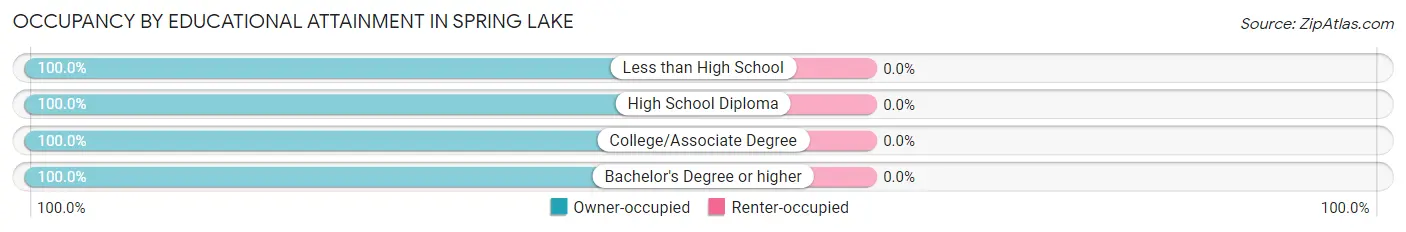
| Household Size | Owner-occupied | Renter-occupied |
| Less than High School | 12 (100.0%) | 0 (0.0%) |
| High School Diploma | 4 (100.0%) | 0 (0.0%) |
| College/Associate Degree | 61 (100.0%) | 0 (0.0%) |
| Bachelor's Degree or higher | 52 (100.0%) | 0 (0.0%) |
Occupancy by Age of Householder in Spring Lake
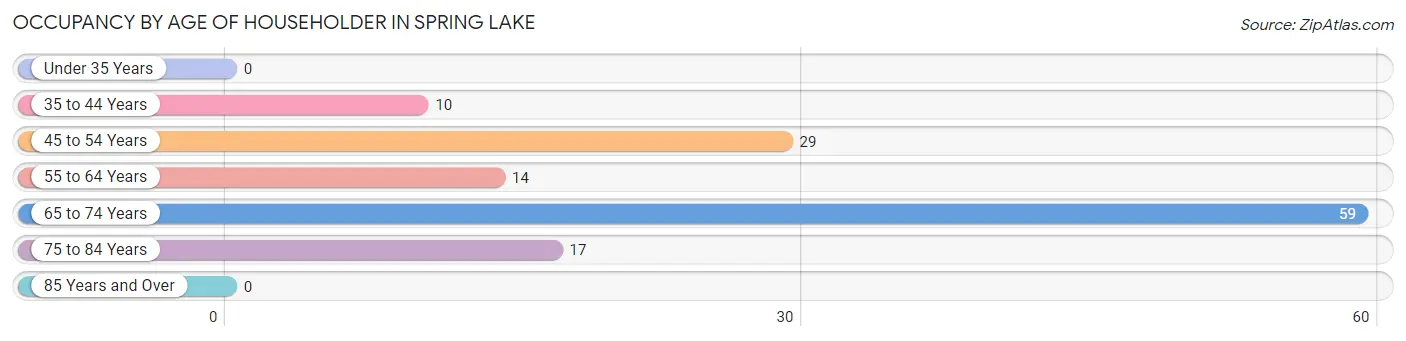
| Age Bracket | # Households | % Households |
| Under 35 Years | 0 | 0.0% |
| 35 to 44 Years | 10 | 7.7% |
| 45 to 54 Years | 29 | 22.5% |
| 55 to 64 Years | 14 | 10.8% |
| 65 to 74 Years | 59 | 45.7% |
| 75 to 84 Years | 17 | 13.2% |
| 85 Years and Over | 0 | 0.0% |
| Total | 129 | 100.0% |
Housing Finances in Spring Lake
Median Income by Occupancy in Spring Lake
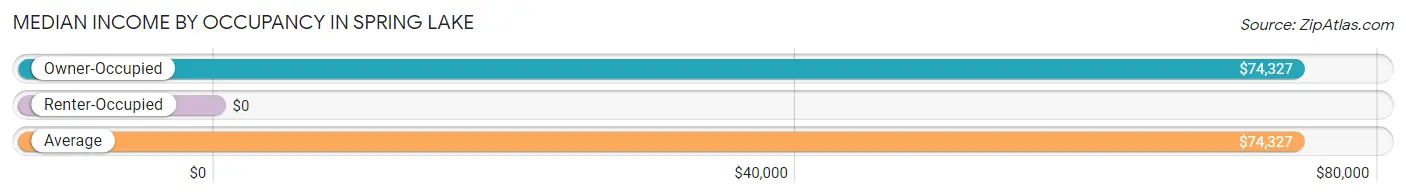
| Occupancy Type | # Households | Median Income |
| Owner-Occupied | 129 (100.0%) | $74,327 |
| Renter-Occupied | 0 (0.0%) | $0 |
| Average | 129 (100.0%) | $74,327 |
Occupancy by Householder Income Bracket in Spring Lake
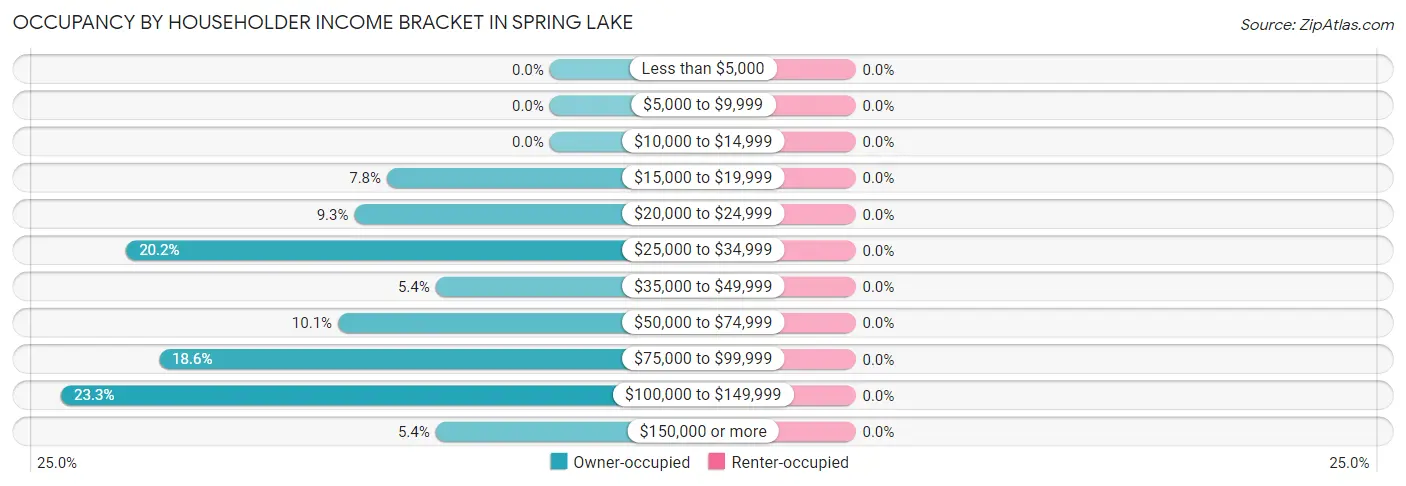
| Income Bracket | Owner-occupied | Renter-occupied |
| Less than $5,000 | 0 (0.0%) | 0 (0.0%) |
| $5,000 to $9,999 | 0 (0.0%) | 0 (0.0%) |
| $10,000 to $14,999 | 0 (0.0%) | 0 (0.0%) |
| $15,000 to $19,999 | 10 (7.7%) | 0 (0.0%) |
| $20,000 to $24,999 | 12 (9.3%) | 0 (0.0%) |
| $25,000 to $34,999 | 26 (20.2%) | 0 (0.0%) |
| $35,000 to $49,999 | 7 (5.4%) | 0 (0.0%) |
| $50,000 to $74,999 | 13 (10.1%) | 0 (0.0%) |
| $75,000 to $99,999 | 24 (18.6%) | 0 (0.0%) |
| $100,000 to $149,999 | 30 (23.3%) | 0 (0.0%) |
| $150,000 or more | 7 (5.4%) | 0 (0.0%) |
| Total | 129 (100.0%) | 0 (0.0%) |
Monthly Housing Cost Tiers in Spring Lake
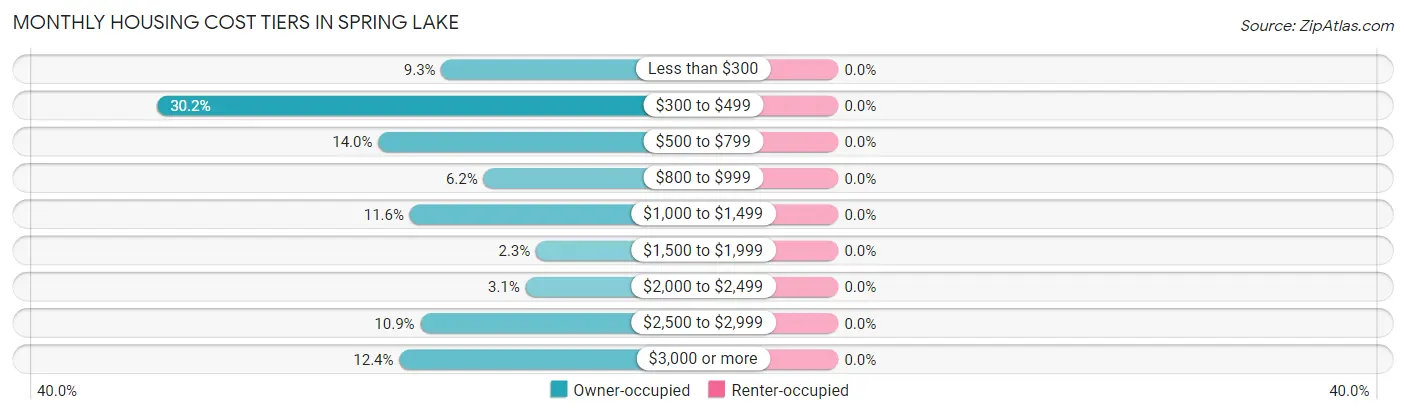
| Monthly Cost | Owner-occupied | Renter-occupied |
| Less than $300 | 12 (9.3%) | 0 (0.0%) |
| $300 to $499 | 39 (30.2%) | 0 (0.0%) |
| $500 to $799 | 18 (14.0%) | 0 (0.0%) |
| $800 to $999 | 8 (6.2%) | 0 (0.0%) |
| $1,000 to $1,499 | 15 (11.6%) | 0 (0.0%) |
| $1,500 to $1,999 | 3 (2.3%) | 0 (0.0%) |
| $2,000 to $2,499 | 4 (3.1%) | 0 (0.0%) |
| $2,500 to $2,999 | 14 (10.8%) | 0 (0.0%) |
| $3,000 or more | 16 (12.4%) | 0 (0.0%) |
| Total | 129 (100.0%) | 0 (0.0%) |
Physical Housing Characteristics in Spring Lake
Housing Structures in Spring Lake
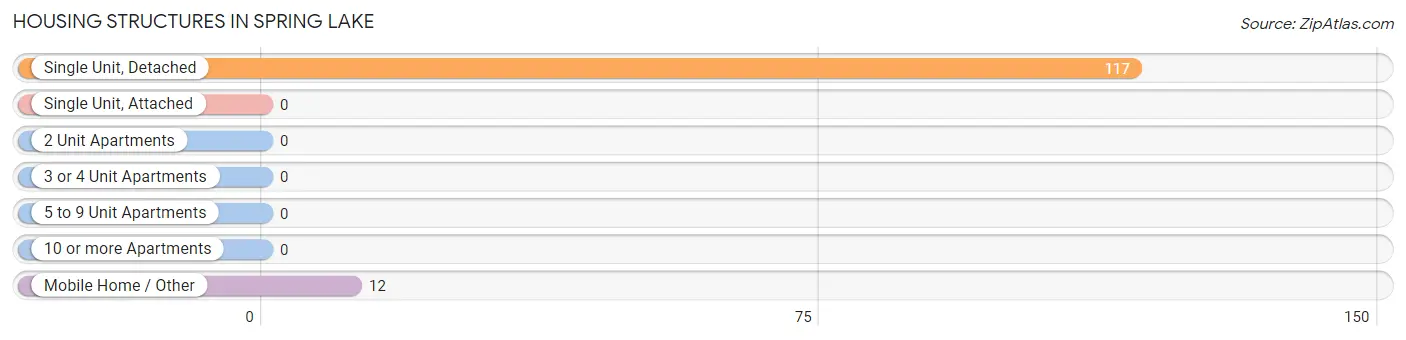
| Structure Type | # Housing Units | % Housing Units |
| Single Unit, Detached | 117 | 90.7% |
| Single Unit, Attached | 0 | 0.0% |
| 2 Unit Apartments | 0 | 0.0% |
| 3 or 4 Unit Apartments | 0 | 0.0% |
| 5 to 9 Unit Apartments | 0 | 0.0% |
| 10 or more Apartments | 0 | 0.0% |
| Mobile Home / Other | 12 | 9.3% |
| Total | 129 | 100.0% |
Housing Structures by Occupancy in Spring Lake
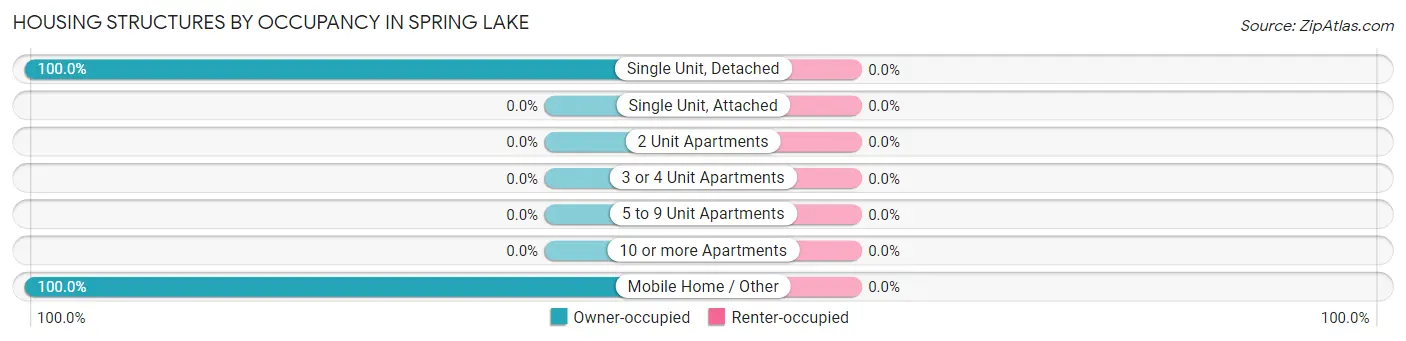
| Structure Type | Owner-occupied | Renter-occupied |
| Single Unit, Detached | 117 (100.0%) | 0 (0.0%) |
| Single Unit, Attached | 0 (0.0%) | 0 (0.0%) |
| 2 Unit Apartments | 0 (0.0%) | 0 (0.0%) |
| 3 or 4 Unit Apartments | 0 (0.0%) | 0 (0.0%) |
| 5 to 9 Unit Apartments | 0 (0.0%) | 0 (0.0%) |
| 10 or more Apartments | 0 (0.0%) | 0 (0.0%) |
| Mobile Home / Other | 12 (100.0%) | 0 (0.0%) |
| Total | 129 (100.0%) | 0 (0.0%) |
Housing Structures by Number of Rooms in Spring Lake
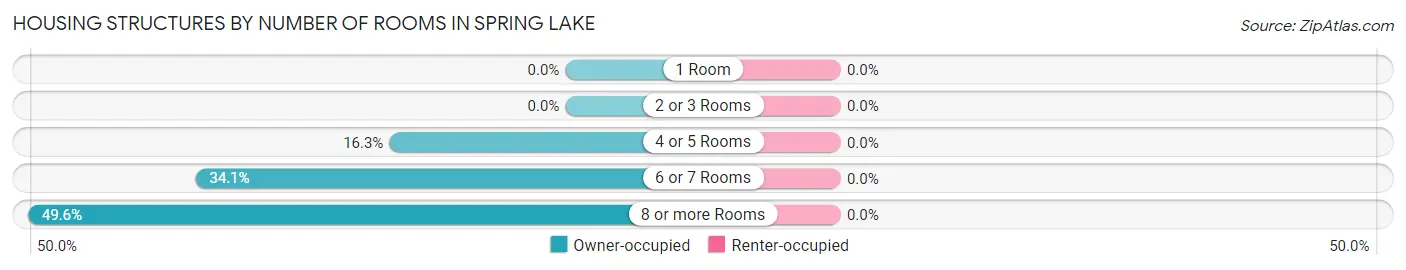
| Number of Rooms | Owner-occupied | Renter-occupied |
| 1 Room | 0 (0.0%) | 0 (0.0%) |
| 2 or 3 Rooms | 0 (0.0%) | 0 (0.0%) |
| 4 or 5 Rooms | 21 (16.3%) | 0 (0.0%) |
| 6 or 7 Rooms | 44 (34.1%) | 0 (0.0%) |
| 8 or more Rooms | 64 (49.6%) | 0 (0.0%) |
| Total | 129 (100.0%) | 0 (0.0%) |
Housing Structure by Heating Type in Spring Lake
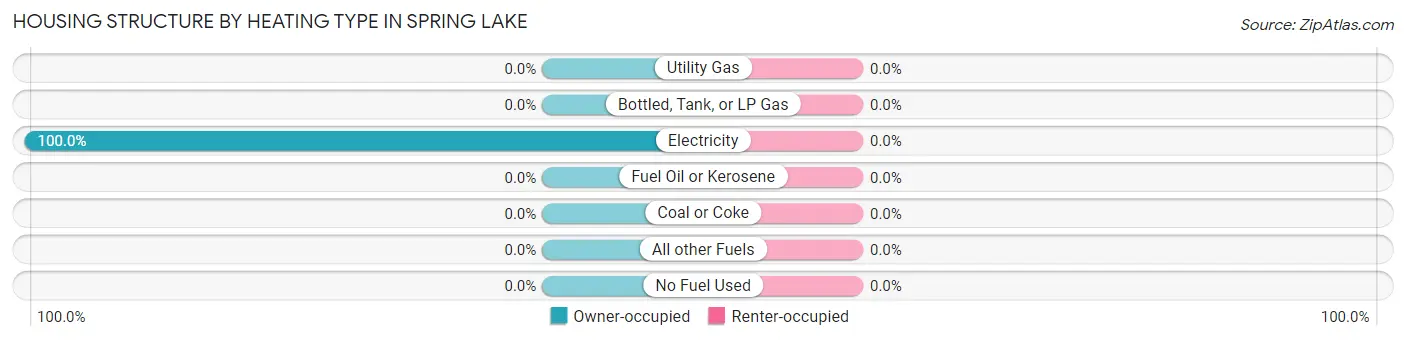
| Heating Type | Owner-occupied | Renter-occupied |
| Utility Gas | 0 (0.0%) | 0 (0.0%) |
| Bottled, Tank, or LP Gas | 0 (0.0%) | 0 (0.0%) |
| Electricity | 129 (100.0%) | 0 (0.0%) |
| Fuel Oil or Kerosene | 0 (0.0%) | 0 (0.0%) |
| Coal or Coke | 0 (0.0%) | 0 (0.0%) |
| All other Fuels | 0 (0.0%) | 0 (0.0%) |
| No Fuel Used | 0 (0.0%) | 0 (0.0%) |
| Total | 129 (100.0%) | 0 (0.0%) |
Household Vehicle Usage in Spring Lake
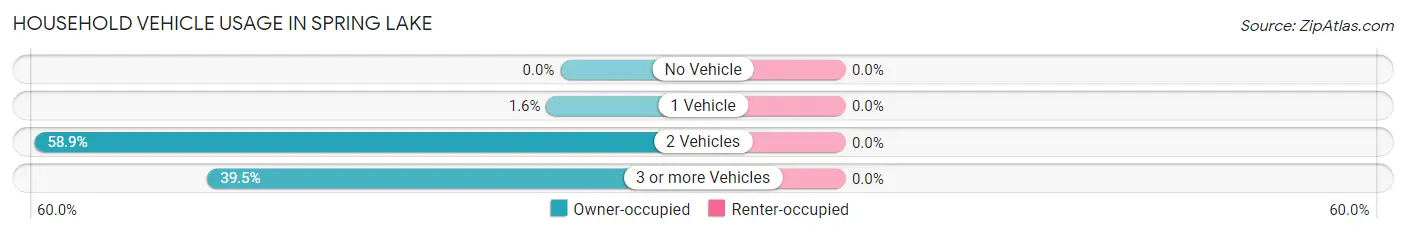
| Vehicles per Household | Owner-occupied | Renter-occupied |
| No Vehicle | 0 (0.0%) | 0 (0.0%) |
| 1 Vehicle | 2 (1.5%) | 0 (0.0%) |
| 2 Vehicles | 76 (58.9%) | 0 (0.0%) |
| 3 or more Vehicles | 51 (39.5%) | 0 (0.0%) |
| Total | 129 (100.0%) | 0 (0.0%) |
Real Estate & Mortgages in Spring Lake
Real Estate and Mortgage Overview in Spring Lake
| Characteristic | Without Mortgage | With Mortgage |
| Housing Units | 77 | 52 |
| Median Property Value | $230,400 | $500,000 |
| Median Household Income | - | - |
| Monthly Housing Costs | $411 | $16 |
| Real Estate Taxes | $1,708 | $0 |
Property Value by Mortgage Status in Spring Lake
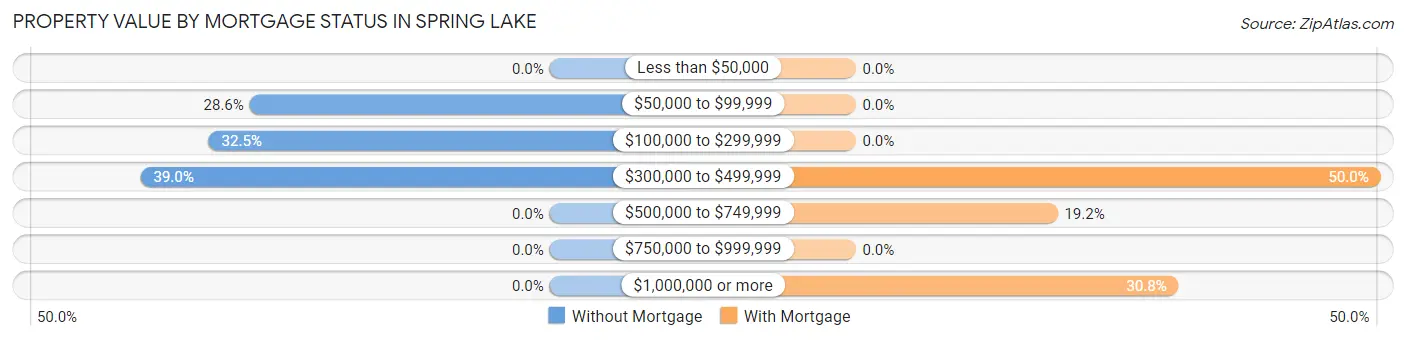
| Property Value | Without Mortgage | With Mortgage |
| Less than $50,000 | 0 (0.0%) | 0 (0.0%) |
| $50,000 to $99,999 | 22 (28.6%) | 0 (0.0%) |
| $100,000 to $299,999 | 25 (32.5%) | 0 (0.0%) |
| $300,000 to $499,999 | 30 (39.0%) | 26 (50.0%) |
| $500,000 to $749,999 | 0 (0.0%) | 10 (19.2%) |
| $750,000 to $999,999 | 0 (0.0%) | 0 (0.0%) |
| $1,000,000 or more | 0 (0.0%) | 16 (30.8%) |
| Total | 77 (100.0%) | 52 (100.0%) |
Household Income by Mortgage Status in Spring Lake
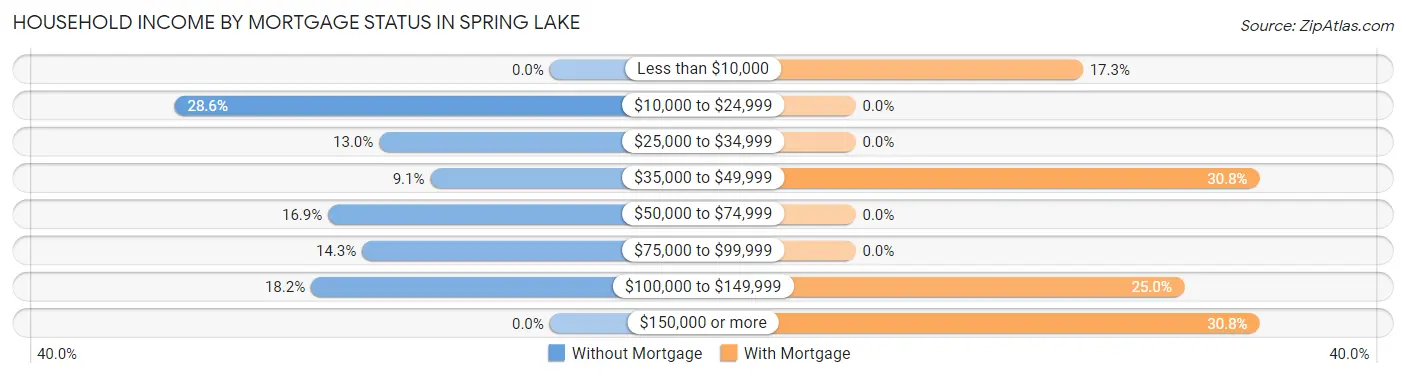
| Household Income | Without Mortgage | With Mortgage |
| Less than $10,000 | 0 (0.0%) | 9 (17.3%) |
| $10,000 to $24,999 | 22 (28.6%) | 0 (0.0%) |
| $25,000 to $34,999 | 10 (13.0%) | 0 (0.0%) |
| $35,000 to $49,999 | 7 (9.1%) | 16 (30.8%) |
| $50,000 to $74,999 | 13 (16.9%) | 0 (0.0%) |
| $75,000 to $99,999 | 11 (14.3%) | 0 (0.0%) |
| $100,000 to $149,999 | 14 (18.2%) | 13 (25.0%) |
| $150,000 or more | 0 (0.0%) | 16 (30.8%) |
| Total | 77 (100.0%) | 52 (100.0%) |
Property Value to Household Income Ratio in Spring Lake
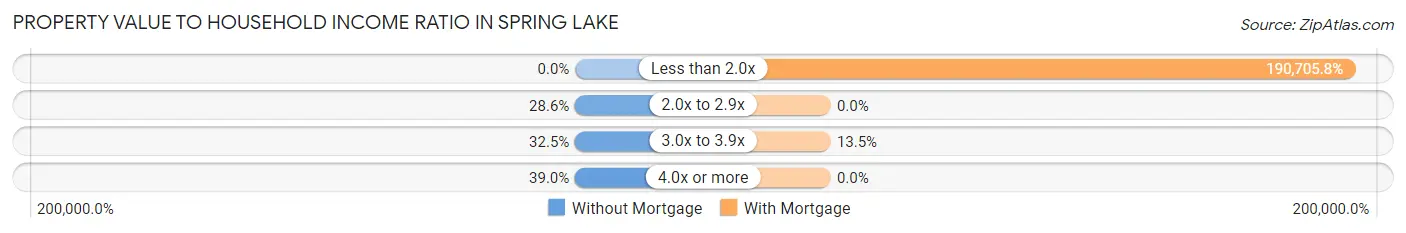
| Value-to-Income Ratio | Without Mortgage | With Mortgage |
| Less than 2.0x | 0 (0.0%) | 99,167 (190,705.8%) |
| 2.0x to 2.9x | 22 (28.6%) | 0 (0.0%) |
| 3.0x to 3.9x | 25 (32.5%) | 7 (13.5%) |
| 4.0x or more | 30 (39.0%) | 0 (0.0%) |
| Total | 77 (100.0%) | 52 (100.0%) |
Real Estate Taxes by Mortgage Status in Spring Lake
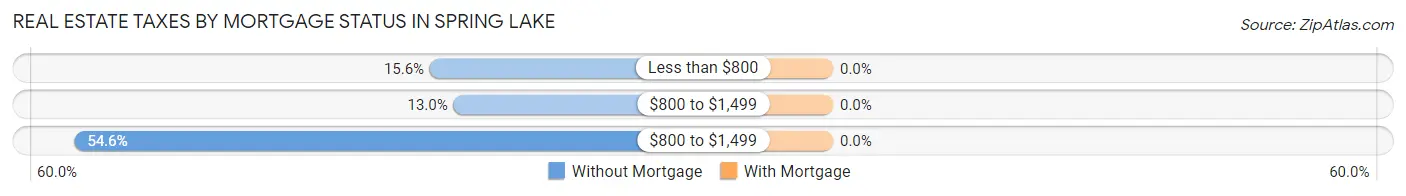
| Property Taxes | Without Mortgage | With Mortgage |
| Less than $800 | 12 (15.6%) | 0 (0.0%) |
| $800 to $1,499 | 10 (13.0%) | 0 (0.0%) |
| $800 to $1,499 | 42 (54.5%) | 0 (0.0%) |
| Total | 77 (100.0%) | 52 (100.0%) |
Health & Disability in Spring Lake
Health Insurance Coverage by Age in Spring Lake
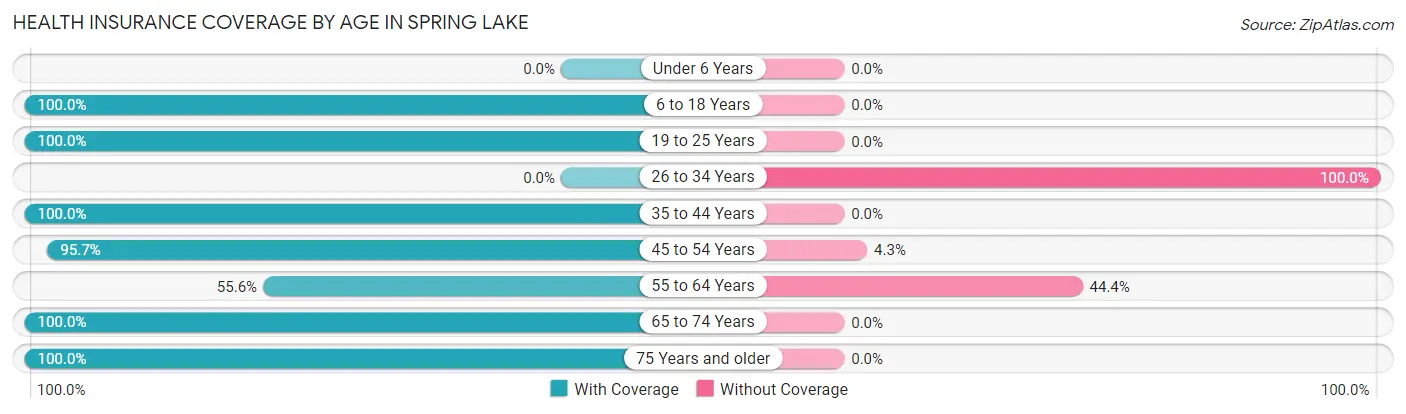
| Age Bracket | With Coverage | Without Coverage |
| Under 6 Years | 0 (0.0%) | 0 (0.0%) |
| 6 to 18 Years | 50 (100.0%) | 0 (0.0%) |
| 19 to 25 Years | 23 (100.0%) | 0 (0.0%) |
| 26 to 34 Years | 0 (0.0%) | 15 (100.0%) |
| 35 to 44 Years | 20 (100.0%) | 0 (0.0%) |
| 45 to 54 Years | 90 (95.7%) | 4 (4.3%) |
| 55 to 64 Years | 10 (55.6%) | 8 (44.4%) |
| 65 to 74 Years | 105 (100.0%) | 0 (0.0%) |
| 75 Years and older | 42 (100.0%) | 0 (0.0%) |
| Total | 340 (92.6%) | 27 (7.4%) |
Health Insurance Coverage by Citizenship Status in Spring Lake
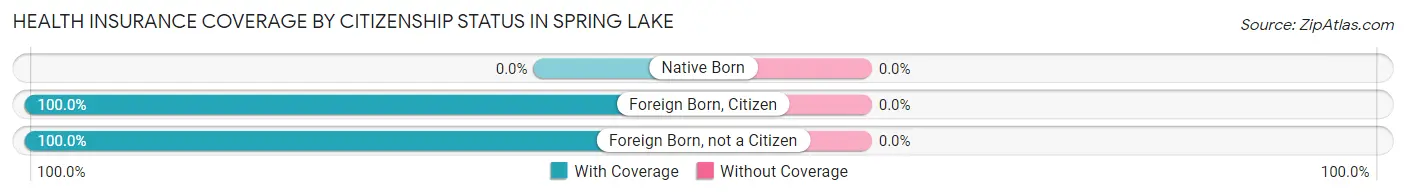
| Citizenship Status | With Coverage | Without Coverage |
| Native Born | 0 (0.0%) | 0 (0.0%) |
| Foreign Born, Citizen | 50 (100.0%) | 0 (0.0%) |
| Foreign Born, not a Citizen | 23 (100.0%) | 0 (0.0%) |
Health Insurance Coverage by Household Income in Spring Lake
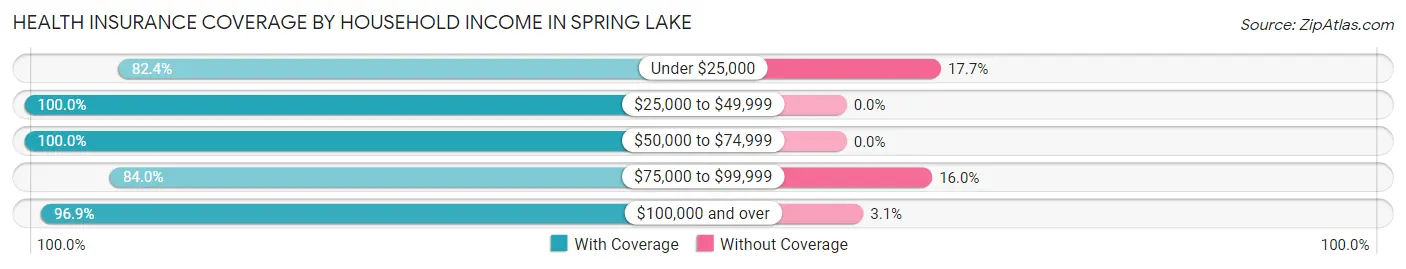
| Household Income | With Coverage | Without Coverage |
| Under $25,000 | 70 (82.4%) | 15 (17.6%) |
| $25,000 to $49,999 | 57 (100.0%) | 0 (0.0%) |
| $50,000 to $74,999 | 46 (100.0%) | 0 (0.0%) |
| $75,000 to $99,999 | 42 (84.0%) | 8 (16.0%) |
| $100,000 and over | 125 (96.9%) | 4 (3.1%) |
Public vs Private Health Insurance Coverage by Age in Spring Lake
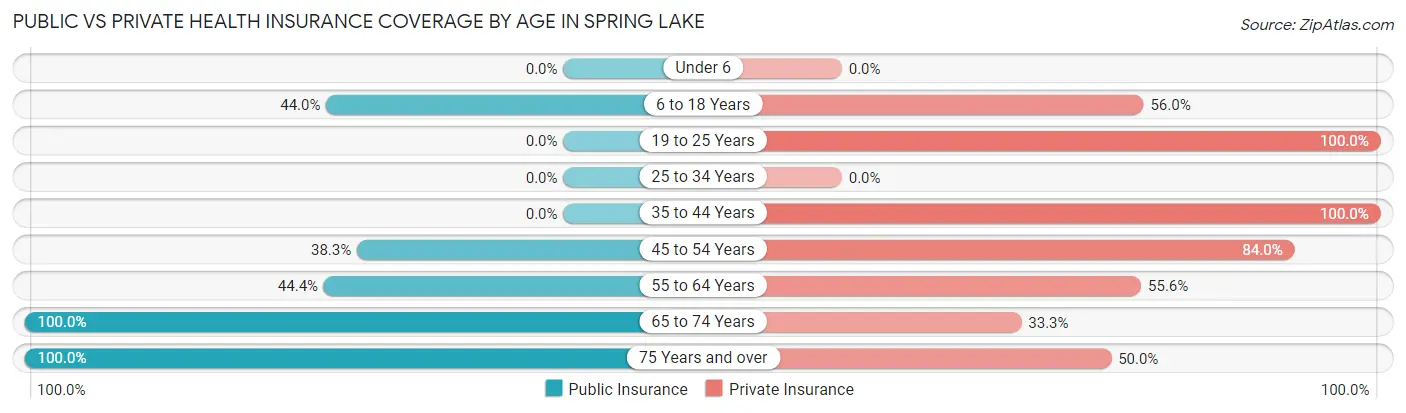
| Age Bracket | Public Insurance | Private Insurance |
| Under 6 | 0 (0.0%) | 0 (0.0%) |
| 6 to 18 Years | 22 (44.0%) | 28 (56.0%) |
| 19 to 25 Years | 0 (0.0%) | 23 (100.0%) |
| 25 to 34 Years | 0 (0.0%) | 0 (0.0%) |
| 35 to 44 Years | 0 (0.0%) | 20 (100.0%) |
| 45 to 54 Years | 36 (38.3%) | 79 (84.0%) |
| 55 to 64 Years | 8 (44.4%) | 10 (55.6%) |
| 65 to 74 Years | 105 (100.0%) | 35 (33.3%) |
| 75 Years and over | 42 (100.0%) | 21 (50.0%) |
| Total | 213 (58.0%) | 216 (58.9%) |
Disability Status by Sex by Age in Spring Lake
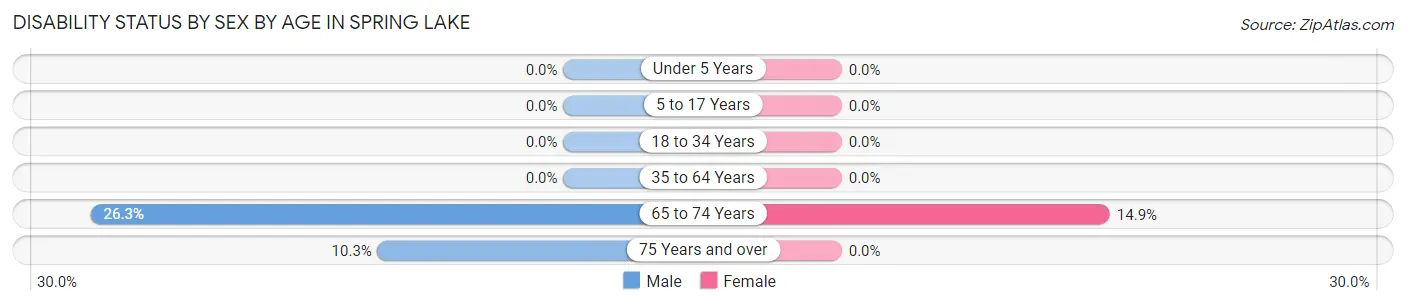
| Age Bracket | Male | Female |
| Under 5 Years | 0 (0.0%) | 0 (0.0%) |
| 5 to 17 Years | 0 (0.0%) | 0 (0.0%) |
| 18 to 34 Years | 0 (0.0%) | 0 (0.0%) |
| 35 to 64 Years | 0 (0.0%) | 0 (0.0%) |
| 65 to 74 Years | 10 (26.3%) | 10 (14.9%) |
| 75 Years and over | 3 (10.3%) | 0 (0.0%) |
Disability Class by Sex by Age in Spring Lake
Disability Class: Hearing Difficulty
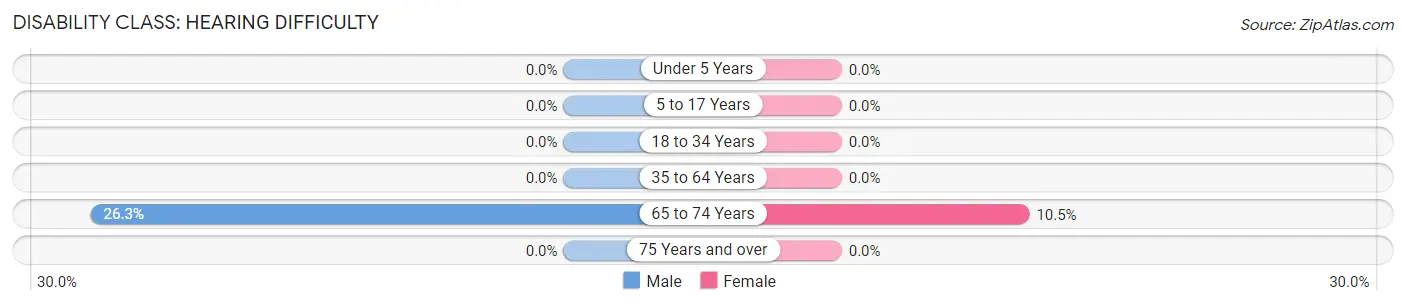
| Age Bracket | Male | Female |
| Under 5 Years | 0 (0.0%) | 0 (0.0%) |
| 5 to 17 Years | 0 (0.0%) | 0 (0.0%) |
| 18 to 34 Years | 0 (0.0%) | 0 (0.0%) |
| 35 to 64 Years | 0 (0.0%) | 0 (0.0%) |
| 65 to 74 Years | 10 (26.3%) | 7 (10.4%) |
| 75 Years and over | 0 (0.0%) | 0 (0.0%) |
Disability Class: Vision Difficulty
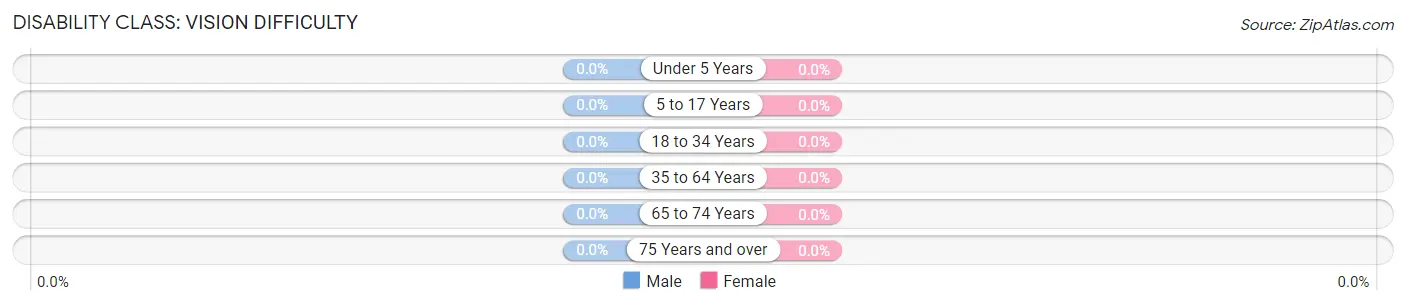
| Age Bracket | Male | Female |
| Under 5 Years | 0 (0.0%) | 0 (0.0%) |
| 5 to 17 Years | 0 (0.0%) | 0 (0.0%) |
| 18 to 34 Years | 0 (0.0%) | 0 (0.0%) |
| 35 to 64 Years | 0 (0.0%) | 0 (0.0%) |
| 65 to 74 Years | 0 (0.0%) | 0 (0.0%) |
| 75 Years and over | 0 (0.0%) | 0 (0.0%) |
Disability Class: Cognitive Difficulty
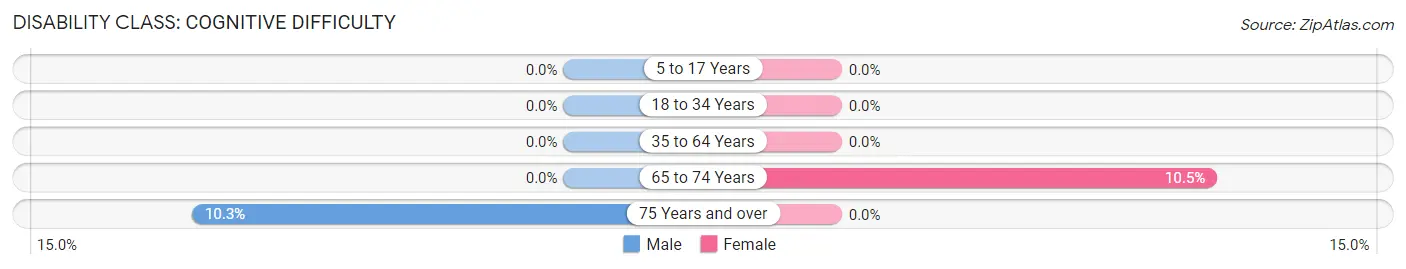
| Age Bracket | Male | Female |
| 5 to 17 Years | 0 (0.0%) | 0 (0.0%) |
| 18 to 34 Years | 0 (0.0%) | 0 (0.0%) |
| 35 to 64 Years | 0 (0.0%) | 0 (0.0%) |
| 65 to 74 Years | 0 (0.0%) | 7 (10.4%) |
| 75 Years and over | 3 (10.3%) | 0 (0.0%) |
Disability Class: Ambulatory Difficulty
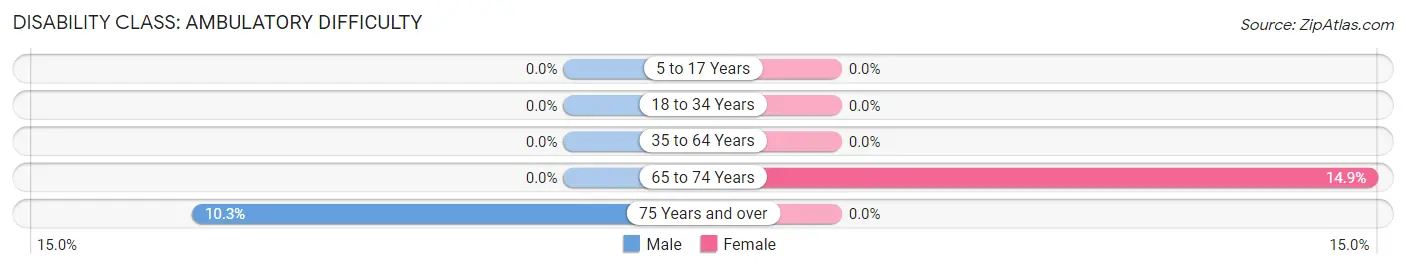
| Age Bracket | Male | Female |
| 5 to 17 Years | 0 (0.0%) | 0 (0.0%) |
| 18 to 34 Years | 0 (0.0%) | 0 (0.0%) |
| 35 to 64 Years | 0 (0.0%) | 0 (0.0%) |
| 65 to 74 Years | 0 (0.0%) | 10 (14.9%) |
| 75 Years and over | 3 (10.3%) | 0 (0.0%) |
Disability Class: Self-Care Difficulty
| Age Bracket | Male | Female |
| 5 to 17 Years | 0 (0.0%) | 0 (0.0%) |
| 18 to 34 Years | 0 (0.0%) | 0 (0.0%) |
| 35 to 64 Years | 0 (0.0%) | 0 (0.0%) |
| 65 to 74 Years | 0 (0.0%) | 0 (0.0%) |
| 75 Years and over | 0 (0.0%) | 0 (0.0%) |
Technology Access in Spring Lake
Computing Device Access in Spring Lake
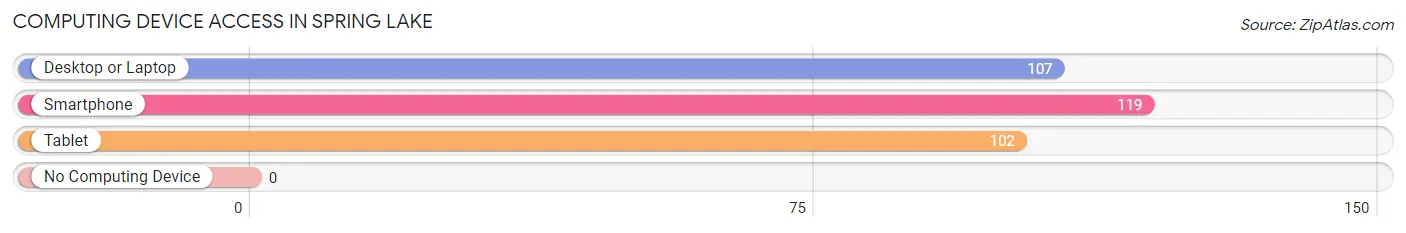
| Device Type | # Households | % Households |
| Desktop or Laptop | 107 | 83.0% |
| Smartphone | 119 | 92.2% |
| Tablet | 102 | 79.1% |
| No Computing Device | 0 | 0.0% |
| Total | 129 | 100.0% |
Internet Access in Spring Lake
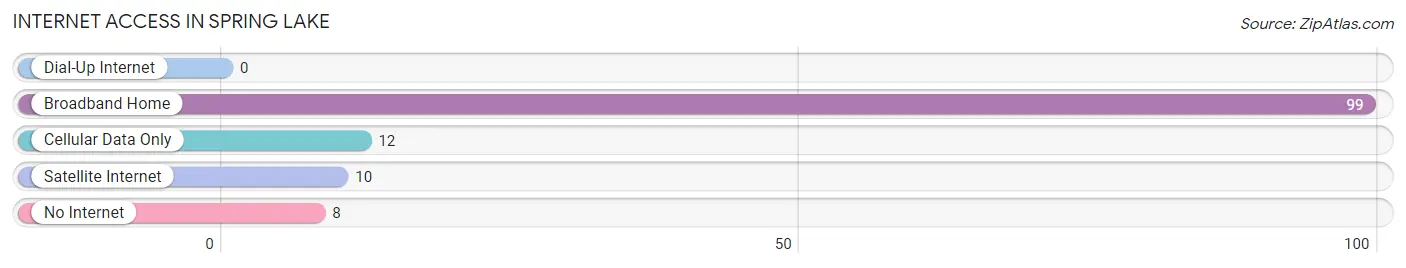
| Internet Type | # Households | % Households |
| Dial-Up Internet | 0 | 0.0% |
| Broadband Home | 99 | 76.7% |
| Cellular Data Only | 12 | 9.3% |
| Satellite Internet | 10 | 7.7% |
| No Internet | 8 | 6.2% |
| Total | 129 | 100.0% |
Spring Lake Summary
History
Spring Lake is a small unincorporated community located in Hernando County, Florida. It is situated on the western shore of the Withlacoochee River, approximately 25 miles north of Tampa. The area was first settled in the late 1800s by a group of settlers from Georgia. The settlers were attracted to the area due to its abundance of natural resources, including timber, fish, and game. The community was originally known as “Spring Lake Settlement” and was later shortened to “Spring Lake”.
The area was primarily a farming community until the early 1900s when the phosphate industry began to boom in the area. The phosphate industry brought jobs and economic growth to the area, and the population of Spring Lake began to grow. The town was officially incorporated in 1925 and the first mayor was elected in 1926.
In the 1950s, the phosphate industry began to decline and the population of Spring Lake began to decline as well. The town was eventually disincorporated in the 1970s. Despite the decline in population, Spring Lake remains a popular destination for fishing, boating, and other outdoor activities.
Geography
Spring Lake is located in Hernando County, Florida, on the western shore of the Withlacoochee River. The town is situated approximately 25 miles north of Tampa and is bordered by the cities of Brooksville and Weeki Wachee. The town is located in a rural area and is surrounded by forests and wetlands. The area is known for its abundance of wildlife, including deer, wild turkeys, and alligators.
The town is located at an elevation of approximately 30 feet above sea level. The average temperature in the area is around 70 degrees Fahrenheit, with temperatures ranging from the mid-50s in the winter to the mid-90s in the summer. The area receives an average of 50 inches of rain per year.
Economy
The economy of Spring Lake is largely based on tourism and outdoor recreation. The town is a popular destination for fishing, boating, and other outdoor activities. The town is also home to several small businesses, including restaurants, convenience stores, and gas stations.
The town is also home to several phosphate mining operations. The phosphate industry has been a major source of employment and economic growth in the area for many years.
Demographics
As of the 2010 census, the population of Spring Lake was 1,845. The population is predominantly white (90.3%) and the median age is 44. The median household income is $41,944 and the median home value is $117,000. The town has a poverty rate of 15.3%.
Conclusion
Spring Lake is a small unincorporated community located in Hernando County, Florida. It is situated on the western shore of the Withlacoochee River, approximately 25 miles north of Tampa. The area was first settled in the late 1800s and was primarily a farming community until the early 1900s when the phosphate industry began to boom in the area. The town was officially incorporated in 1925 and the population of Spring Lake began to grow. The economy of Spring Lake is largely based on tourism and outdoor recreation, as well as phosphate mining operations. As of the 2010 census, the population of Spring Lake was 1,845. The population is predominantly white and the median age is 44. The median household income is $41,944 and the median home value is $117,000.
Common Questions
What is Per Capita Income in Spring Lake?
Per Capita income in Spring Lake is $25,996.
What is the Median Family Income in Spring Lake?
Median Family Income in Spring Lake is $77,500.
What is the Median Household income in Spring Lake?
Median Household Income in Spring Lake is $74,327.
What is Inequality or Gini Index in Spring Lake?
Inequality or Gini Index in Spring Lake is 0.35.
What is the Total Population of Spring Lake?
Total Population of Spring Lake is 370.
What is the Total Male Population of Spring Lake?
Total Male Population of Spring Lake is 215.
What is the Total Female Population of Spring Lake?
Total Female Population of Spring Lake is 155.
What is the Ratio of Males per 100 Females in Spring Lake?
There are 138.71 Males per 100 Females in Spring Lake.
What is the Ratio of Females per 100 Males in Spring Lake?
There are 72.09 Females per 100 Males in Spring Lake.
What is the Median Population Age in Spring Lake?
Median Population Age in Spring Lake is 54.3 Years.
What is the Average Family Size in Spring Lake
Average Family Size in Spring Lake is 3.0 People.
What is the Average Household Size in Spring Lake
Average Household Size in Spring Lake is 2.8 People.
How Large is the Labor Force in Spring Lake?
There are 121 People in the Labor Forcein in Spring Lake.
What is the Percentage of People in the Labor Force in Spring Lake?
37.8% of People are in the Labor Force in Spring Lake.