Zip Codes with the Highest Percentage of Population Employed in Food Preparation & Serving in Panama City, FL
RELATED REPORTS & OPTIONS
Food Preparation & Serving
Panama City
Compare Zip Codes
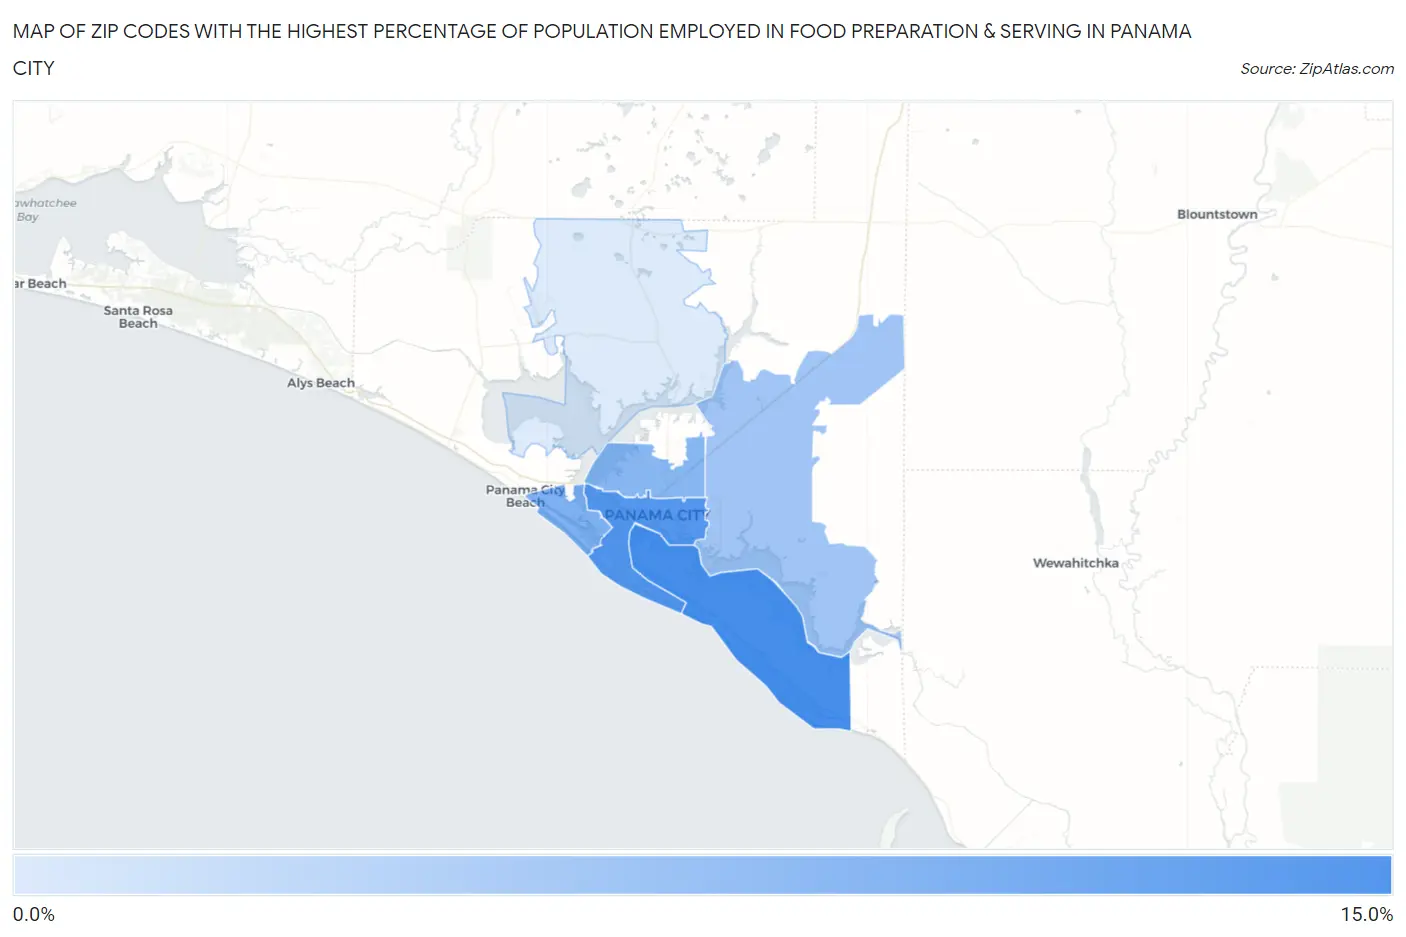
Map of Zip Codes with the Highest Percentage of Population Employed in Food Preparation & Serving in Panama City
2.1%
10.9%
Zip Codes with the Highest Percentage of Population Employed in Food Preparation & Serving in Panama City, FL
| Zip Code | % Employed | vs State | vs National | |
| 1. | 32403 | 10.9% | 6.1%(+4.78)#61 | 5.3%(+5.58)#2,123 |
| 2. | 32401 | 10.0% | 6.1%(+3.87)#89 | 5.3%(+4.68)#2,663 |
| 3. | 32408 | 7.5% | 6.1%(+1.41)#260 | 5.3%(+2.22)#5,562 |
| 4. | 32405 | 7.0% | 6.1%(+0.958)#305 | 5.3%(+1.76)#6,440 |
| 5. | 32404 | 5.4% | 6.1%(-0.660)#543 | 5.3%(+0.144)#11,302 |
| 6. | 32409 | 2.1% | 6.1%(-4.03)#889 | 5.3%(-3.23)#24,524 |
1
Common Questions
What are the Top 5 Zip Codes with the Highest Percentage of Population Employed in Food Preparation & Serving in Panama City, FL?
Top 5 Zip Codes with the Highest Percentage of Population Employed in Food Preparation & Serving in Panama City, FL are:
What zip code has the Highest Percentage of Population Employed in Food Preparation & Serving in Panama City, FL?
32403 has the Highest Percentage of Population Employed in Food Preparation & Serving in Panama City, FL with 10.9%.
What is the Percentage of Population Employed in Food Preparation & Serving in Panama City, FL?
Percentage of Population Employed in Food Preparation & Serving in Panama City is 8.4%.
What is the Percentage of Population Employed in Food Preparation & Serving in Florida?
Percentage of Population Employed in Food Preparation & Serving in Florida is 6.1%.
What is the Percentage of Population Employed in Food Preparation & Serving in the United States?
Percentage of Population Employed in Food Preparation & Serving in the United States is 5.3%.