Zip Codes with the Highest Percentage of Population Employed in Food Preparation & Serving in Port Charlotte, FL
RELATED REPORTS & OPTIONS
Food Preparation & Serving
Port Charlotte
Compare Zip Codes
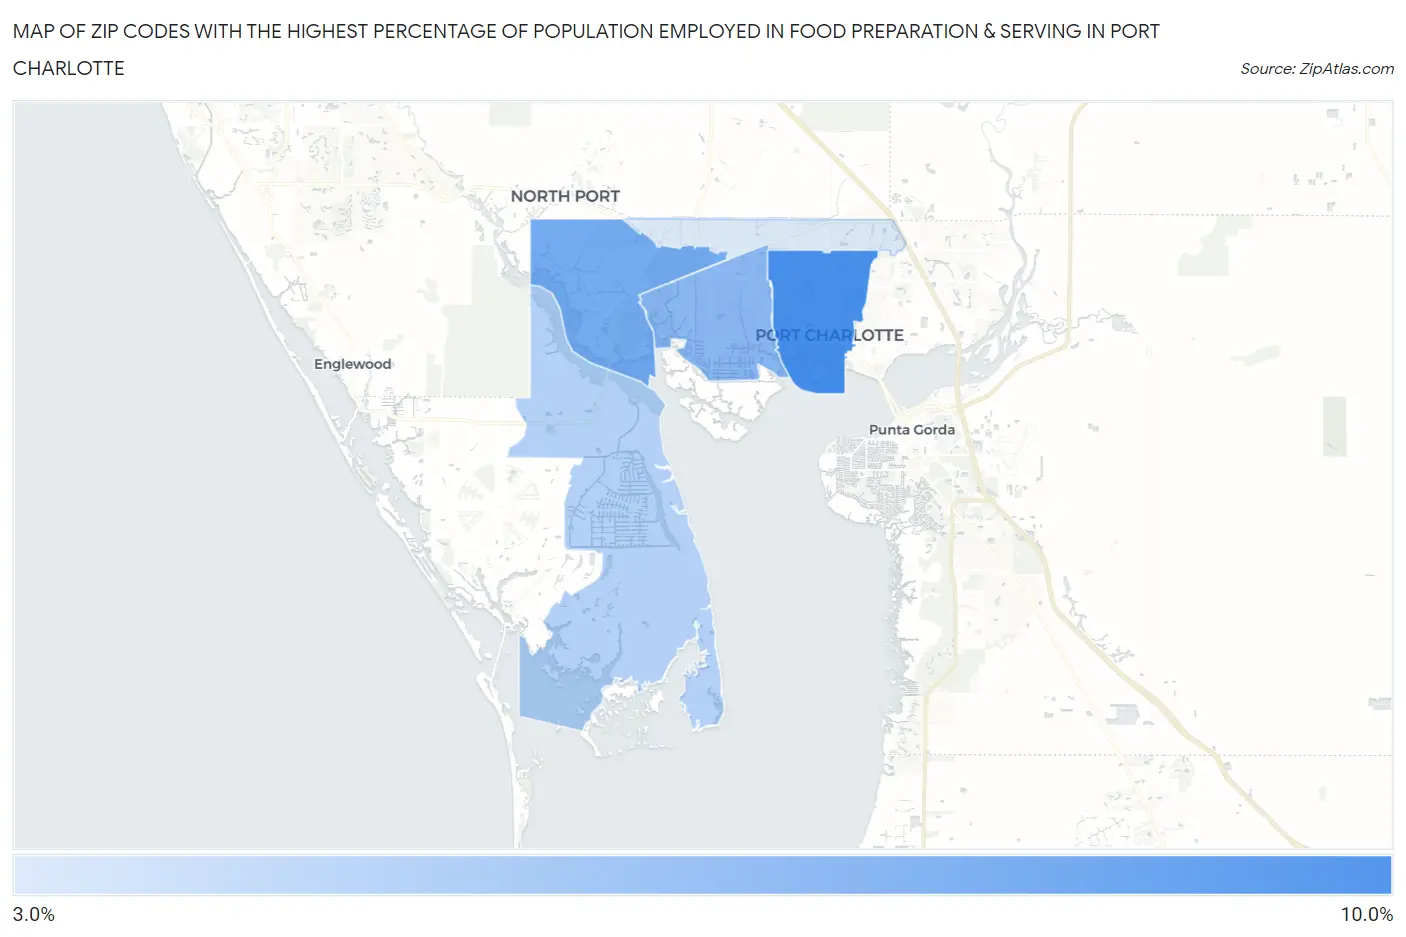
Map of Zip Codes with the Highest Percentage of Population Employed in Food Preparation & Serving in Port Charlotte
3.4%
9.7%
Zip Codes with the Highest Percentage of Population Employed in Food Preparation & Serving in Port Charlotte, FL
| Zip Code | % Employed | vs State | vs National | |
| 1. | 33952 | 9.7% | 6.1%(+3.59)#103 | 5.3%(+4.40)#2,896 |
| 2. | 33953 | 7.7% | 6.1%(+1.65)#227 | 5.3%(+2.45)#5,153 |
| 3. | 33948 | 6.8% | 6.1%(+0.730)#340 | 5.3%(+1.54)#7,014 |
| 4. | 33981 | 5.1% | 6.1%(-0.979)#585 | 5.3%(-0.174)#12,494 |
| 5. | 33954 | 3.4% | 6.1%(-2.74)#795 | 5.3%(-1.93)#19,802 |
1
Common Questions
What are the Top 3 Zip Codes with the Highest Percentage of Population Employed in Food Preparation & Serving in Port Charlotte, FL?
Top 3 Zip Codes with the Highest Percentage of Population Employed in Food Preparation & Serving in Port Charlotte, FL are:
What zip code has the Highest Percentage of Population Employed in Food Preparation & Serving in Port Charlotte, FL?
33952 has the Highest Percentage of Population Employed in Food Preparation & Serving in Port Charlotte, FL with 9.7%.
What is the Percentage of Population Employed in Food Preparation & Serving in Port Charlotte, FL?
Percentage of Population Employed in Food Preparation & Serving in Port Charlotte is 8.5%.
What is the Percentage of Population Employed in Food Preparation & Serving in Florida?
Percentage of Population Employed in Food Preparation & Serving in Florida is 6.1%.
What is the Percentage of Population Employed in Food Preparation & Serving in the United States?
Percentage of Population Employed in Food Preparation & Serving in the United States is 5.3%.