Yankeetown, FL Map & Demographics
Yankeetown Map
Yankeetown Overview
$34,819
PER CAPITA INCOME
$52,500
AVG FAMILY INCOME
$49,833
AVG HOUSEHOLD INCOME
$23,490
FAMILY INCOME DEFICIT
0.48
INEQUALITY / GINI INDEX
629
TOTAL POPULATION
326
MALE POPULATION
303
FEMALE POPULATION
107.59
MALES / 100 FEMALES
92.94
FEMALES / 100 MALES
60.1
MEDIAN AGE
2.3
AVG FAMILY SIZE
2.1
AVG HOUSEHOLD SIZE
172
LABOR FORCE [ PEOPLE ]
33.5%
PERCENT IN LABOR FORCE
9.3%
UNEMPLOYMENT RATE
Yankeetown Zip Codes
Yankeetown Area Codes
Income in Yankeetown
Income Overview in Yankeetown
Per Capita Income in Yankeetown is $34,819, while median incomes of families and households are $52,500 and $49,833 respectively.
| Characteristic | Number | Measure |
| Per Capita Income | 629 | $34,819 |
| Median Family Income | 218 | $52,500 |
| Mean Family Income | 218 | $69,087 |
| Median Household Income | 302 | $49,833 |
| Mean Household Income | 302 | $73,838 |
| Income Deficit | 218 | $23,490 |
| Wage / Income Gap (%) | 629 | 0.00% |
| Wage / Income Gap ($) | 629 | 100.00¢ per $1 |
| Gini / Inequality Index | 629 | 0.48 |
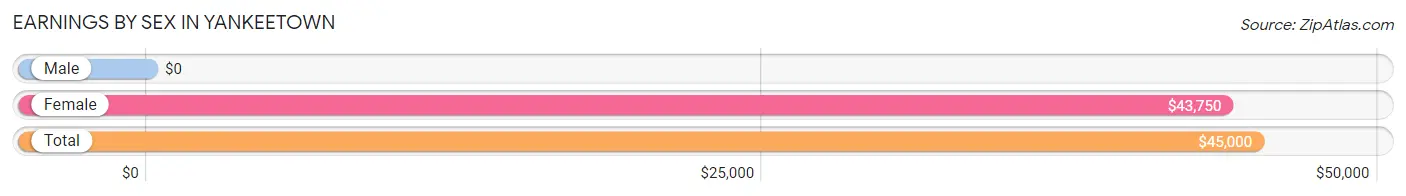
Earnings by Sex in Yankeetown
| Sex | Number | Average Earnings |
| Male | 105 (60.3%) | $0 |
| Female | 69 (39.7%) | $43,750 |
| Total | 174 (100.0%) | $45,000 |
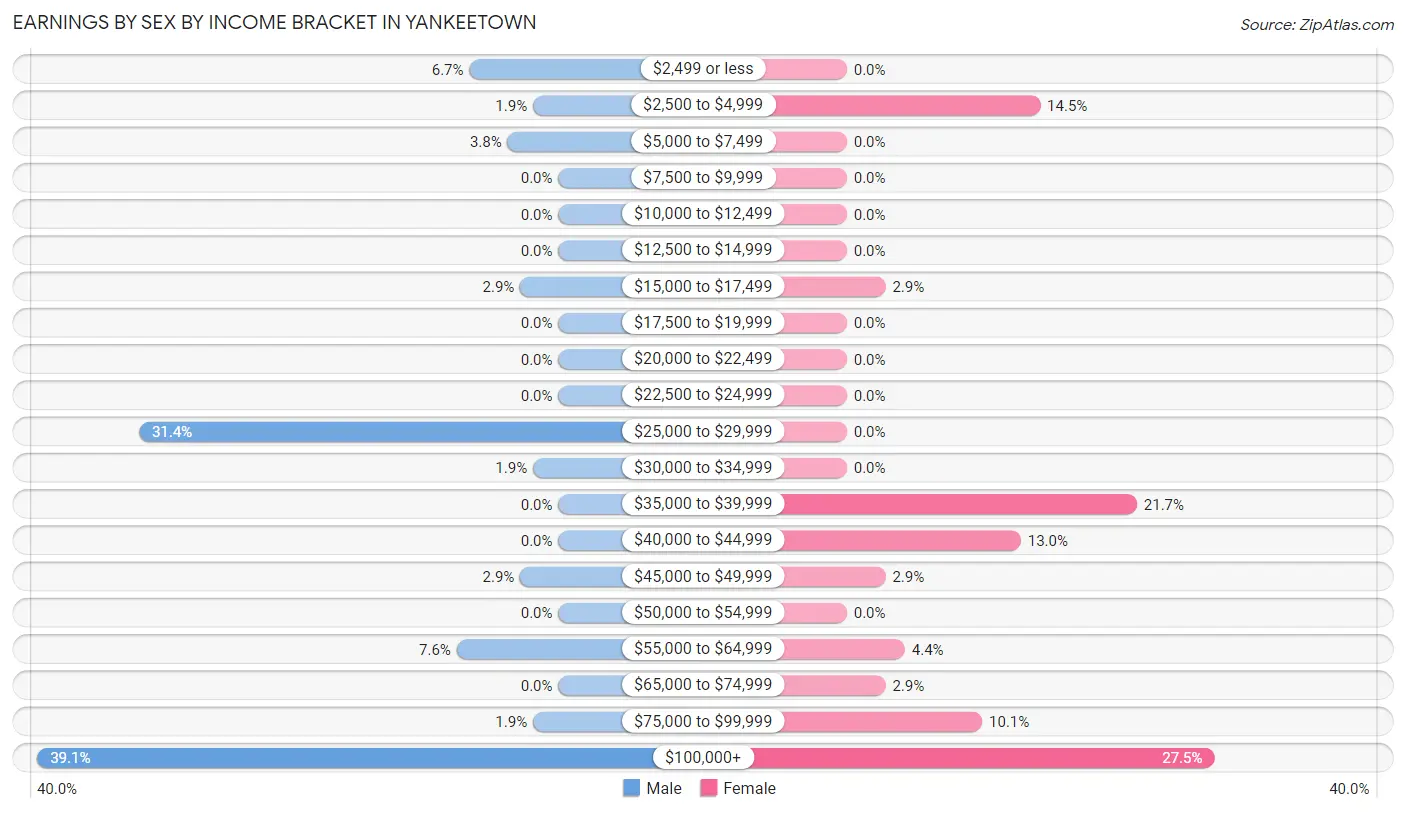
Earnings by Sex by Income Bracket in Yankeetown
The most common earnings brackets in Yankeetown are $100,000+ for men (41 | 39.1%) and $100,000+ for women (19 | 27.5%).
| Income | Male | Female |
| $2,499 or less | 7 (6.7%) | 0 (0.0%) |
| $2,500 to $4,999 | 2 (1.9%) | 10 (14.5%) |
| $5,000 to $7,499 | 4 (3.8%) | 0 (0.0%) |
| $7,500 to $9,999 | 0 (0.0%) | 0 (0.0%) |
| $10,000 to $12,499 | 0 (0.0%) | 0 (0.0%) |
| $12,500 to $14,999 | 0 (0.0%) | 0 (0.0%) |
| $15,000 to $17,499 | 3 (2.9%) | 2 (2.9%) |
| $17,500 to $19,999 | 0 (0.0%) | 0 (0.0%) |
| $20,000 to $22,499 | 0 (0.0%) | 0 (0.0%) |
| $22,500 to $24,999 | 0 (0.0%) | 0 (0.0%) |
| $25,000 to $29,999 | 33 (31.4%) | 0 (0.0%) |
| $30,000 to $34,999 | 2 (1.9%) | 0 (0.0%) |
| $35,000 to $39,999 | 0 (0.0%) | 15 (21.7%) |
| $40,000 to $44,999 | 0 (0.0%) | 9 (13.0%) |
| $45,000 to $49,999 | 3 (2.9%) | 2 (2.9%) |
| $50,000 to $54,999 | 0 (0.0%) | 0 (0.0%) |
| $55,000 to $64,999 | 8 (7.6%) | 3 (4.3%) |
| $65,000 to $74,999 | 0 (0.0%) | 2 (2.9%) |
| $75,000 to $99,999 | 2 (1.9%) | 7 (10.1%) |
| $100,000+ | 41 (39.1%) | 19 (27.5%) |
| Total | 105 (100.0%) | 69 (100.0%) |
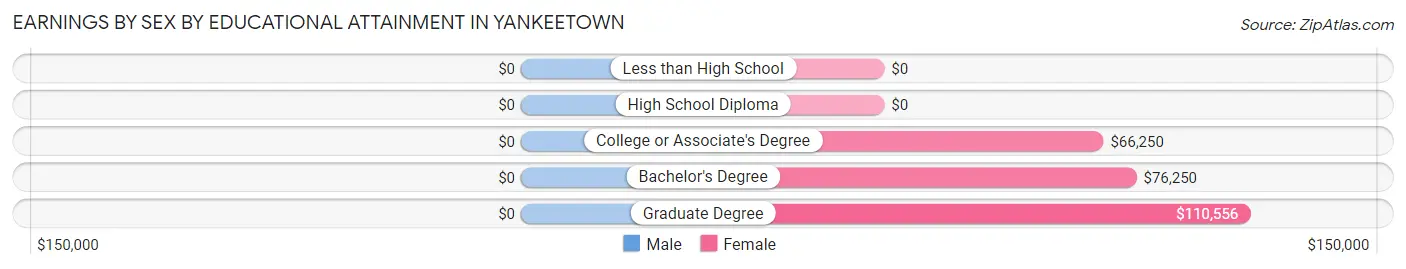
Earnings by Sex by Educational Attainment in Yankeetown
| Educational Attainment | Male Income | Female Income |
| Less than High School | - | - |
| High School Diploma | - | - |
| College or Associate's Degree | - | - |
| Bachelor's Degree | - | - |
| Graduate Degree | - | - |
| Total | $106,250 | $43,750 |
Family Income in Yankeetown
Family Income Brackets in Yankeetown
According to the Yankeetown family income data, there are 41 families falling into the $50,000 to $74,999 income range, which is the most common income bracket and makes up 18.8% of all families. Conversely, the $200,000+ income bracket is the least frequent group with only 7 families (3.2%) belonging to this category.
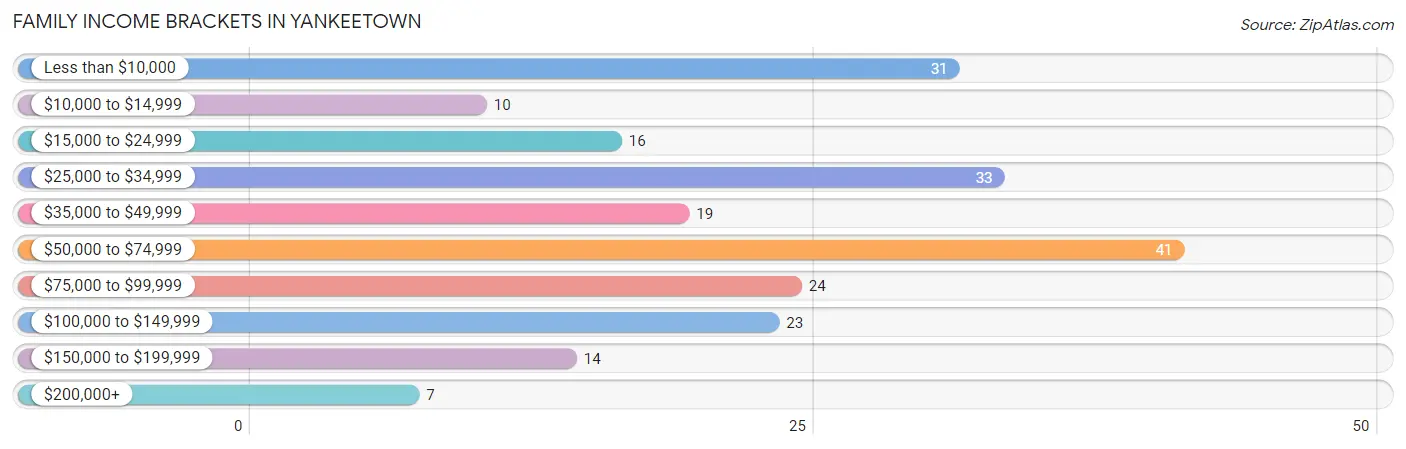
| Income Bracket | # Families | % Families |
| Less than $10,000 | 31 | 14.2% |
| $10,000 to $14,999 | 10 | 4.6% |
| $15,000 to $24,999 | 16 | 7.3% |
| $25,000 to $34,999 | 33 | 15.1% |
| $35,000 to $49,999 | 19 | 8.7% |
| $50,000 to $74,999 | 41 | 18.8% |
| $75,000 to $99,999 | 24 | 11.0% |
| $100,000 to $149,999 | 23 | 10.6% |
| $150,000 to $199,999 | 14 | 6.4% |
| $200,000+ | 7 | 3.2% |
Family Income by Famaliy Size in Yankeetown
2-person families (159 | 72.9%) account for the highest median family income in Yankeetown with $72,604 per family, while 2-person families (159 | 72.9%) have the highest median income of $36,302 per family member.
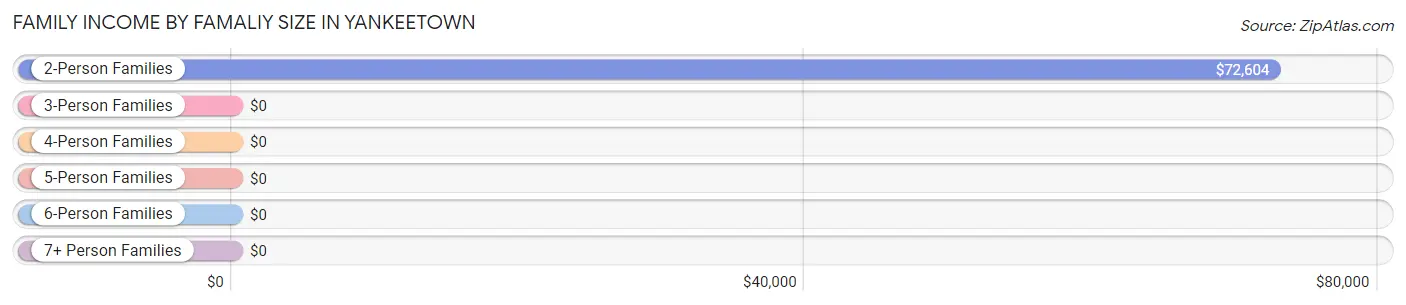
| Income Bracket | # Families | Median Income |
| 2-Person Families | 159 (72.9%) | $72,604 |
| 3-Person Families | 19 (8.7%) | $0 |
| 4-Person Families | 32 (14.7%) | $0 |
| 5-Person Families | 0 (0.0%) | $0 |
| 6-Person Families | 8 (3.7%) | $0 |
| 7+ Person Families | 0 (0.0%) | $0 |
| Total | 218 (100.0%) | $52,500 |
Family Income by Number of Earners in Yankeetown
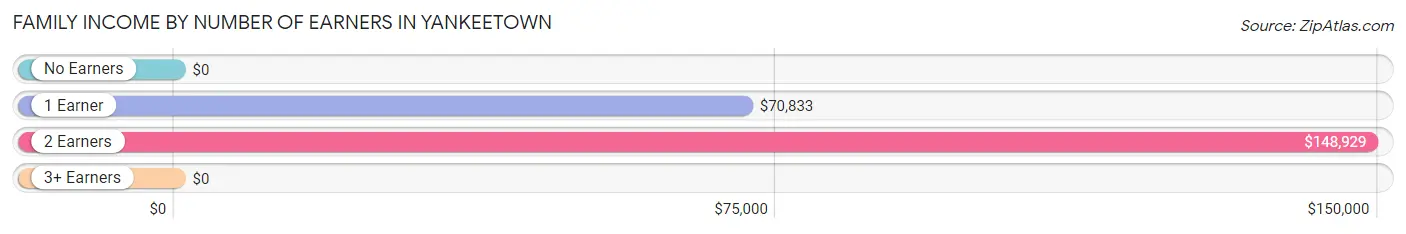
| Number of Earners | # Families | Median Income |
| No Earners | 122 (56.0%) | $0 |
| 1 Earner | 68 (31.2%) | $70,833 |
| 2 Earners | 28 (12.8%) | $148,929 |
| 3+ Earners | 0 (0.0%) | $0 |
| Total | 218 (100.0%) | $52,500 |
Household Income in Yankeetown
Household Income Brackets in Yankeetown
With 60 households falling in the category, the $25,000 to $34,999 income range is the most frequent in Yankeetown, accounting for 19.9% of all households. In contrast, only 14 households (4.6%) fall into the $150,000 to $199,999 income bracket, making it the least populous group.
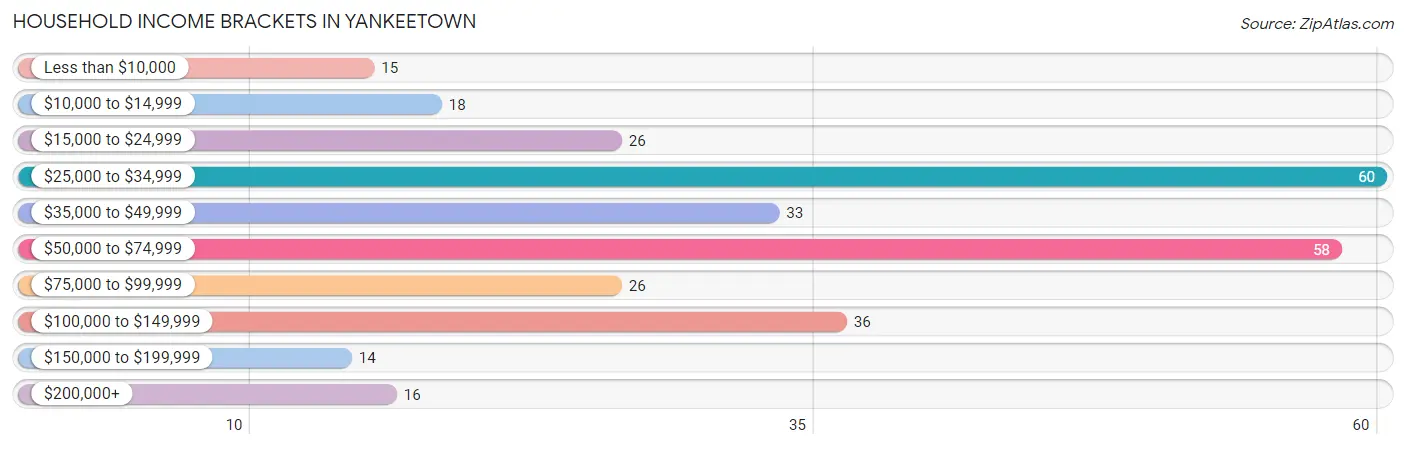
| Income Bracket | # Households | % Households |
| Less than $10,000 | 15 | 5.0% |
| $10,000 to $14,999 | 18 | 6.0% |
| $15,000 to $24,999 | 26 | 8.6% |
| $25,000 to $34,999 | 60 | 19.9% |
| $35,000 to $49,999 | 33 | 10.9% |
| $50,000 to $74,999 | 58 | 19.2% |
| $75,000 to $99,999 | 26 | 8.6% |
| $100,000 to $149,999 | 36 | 11.9% |
| $150,000 to $199,999 | 14 | 4.6% |
| $200,000+ | 16 | 5.3% |
Household Income by Householder Age in Yankeetown
The median household income in Yankeetown is $49,833, with the highest median household income of $90,417 found in the 45 to 64 years age bracket for the primary householder. A total of 117 households (38.7%) fall into this category.
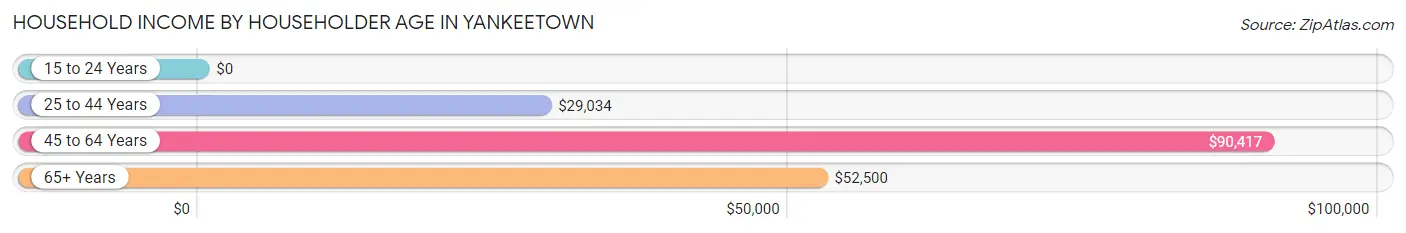
| Income Bracket | # Households | Median Income |
| 15 to 24 Years | 0 (0.0%) | $0 |
| 25 to 44 Years | 45 (14.9%) | $29,034 |
| 45 to 64 Years | 117 (38.7%) | $90,417 |
| 65+ Years | 140 (46.4%) | $52,500 |
| Total | 302 (100.0%) | $49,833 |
Poverty in Yankeetown
Income Below Poverty by Sex and Age in Yankeetown
With 18.0% poverty level for males and 30.3% for females among the residents of Yankeetown, under 5 year old males and under 5 year old females are the most vulnerable to poverty, with 23 males (85.2%) and 17 females (100.0%) in their respective age groups living below the poverty level.
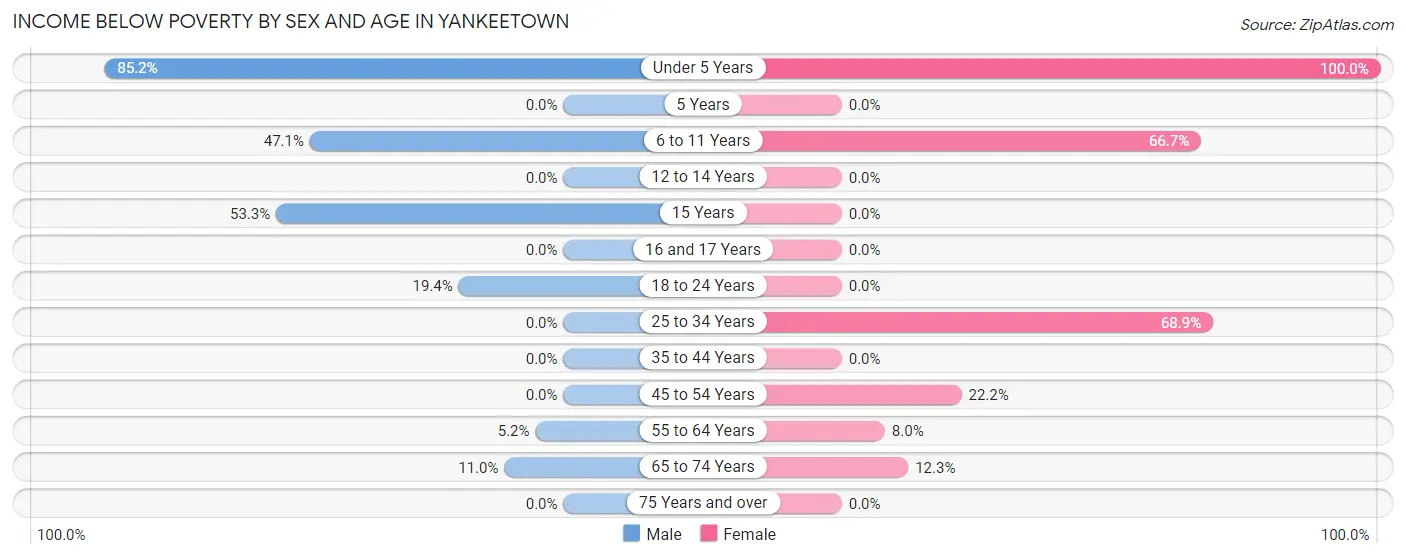
| Age Bracket | Male | Female |
| Under 5 Years | 23 (85.2%) | 17 (100.0%) |
| 5 Years | 0 (0.0%) | 0 (0.0%) |
| 6 to 11 Years | 8 (47.1%) | 18 (66.7%) |
| 12 to 14 Years | 0 (0.0%) | 0 (0.0%) |
| 15 Years | 8 (53.3%) | 0 (0.0%) |
| 16 and 17 Years | 0 (0.0%) | 0 (0.0%) |
| 18 to 24 Years | 7 (19.4%) | 0 (0.0%) |
| 25 to 34 Years | 0 (0.0%) | 31 (68.9%) |
| 35 to 44 Years | 0 (0.0%) | 0 (0.0%) |
| 45 to 54 Years | 0 (0.0%) | 12 (22.2%) |
| 55 to 64 Years | 4 (5.2%) | 4 (8.0%) |
| 65 to 74 Years | 8 (11.0%) | 9 (12.3%) |
| 75 Years and over | 0 (0.0%) | 0 (0.0%) |
| Total | 58 (18.0%) | 91 (30.3%) |
Income Above Poverty by Sex and Age in Yankeetown
According to the poverty statistics in Yankeetown, males aged 25 to 34 years and females aged 12 to 14 years are the age groups that are most secure financially, with 100.0% of males and 100.0% of females in these age groups living above the poverty line.
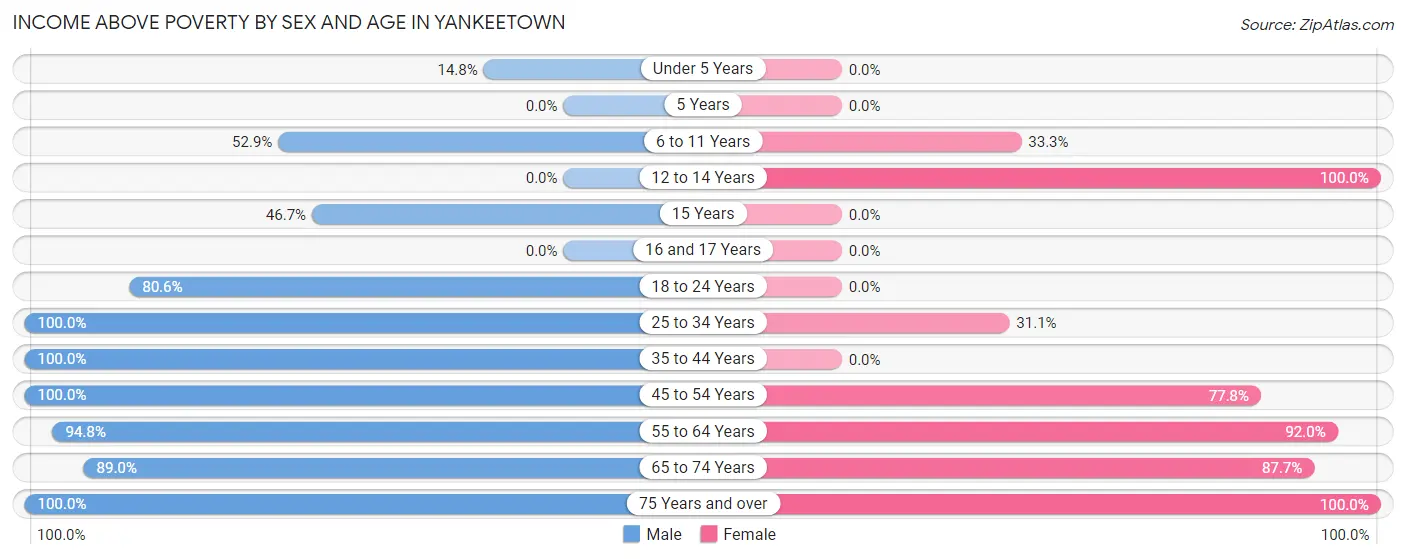
| Age Bracket | Male | Female |
| Under 5 Years | 4 (14.8%) | 0 (0.0%) |
| 5 Years | 0 (0.0%) | 0 (0.0%) |
| 6 to 11 Years | 9 (52.9%) | 9 (33.3%) |
| 12 to 14 Years | 0 (0.0%) | 9 (100.0%) |
| 15 Years | 7 (46.7%) | 0 (0.0%) |
| 16 and 17 Years | 0 (0.0%) | 0 (0.0%) |
| 18 to 24 Years | 29 (80.6%) | 0 (0.0%) |
| 25 to 34 Years | 4 (100.0%) | 14 (31.1%) |
| 35 to 44 Years | 16 (100.0%) | 0 (0.0%) |
| 45 to 54 Years | 13 (100.0%) | 42 (77.8%) |
| 55 to 64 Years | 73 (94.8%) | 46 (92.0%) |
| 65 to 74 Years | 65 (89.0%) | 64 (87.7%) |
| 75 Years and over | 45 (100.0%) | 25 (100.0%) |
| Total | 265 (82.0%) | 209 (69.7%) |
Income Below Poverty Among Married-Couple Families in Yankeetown
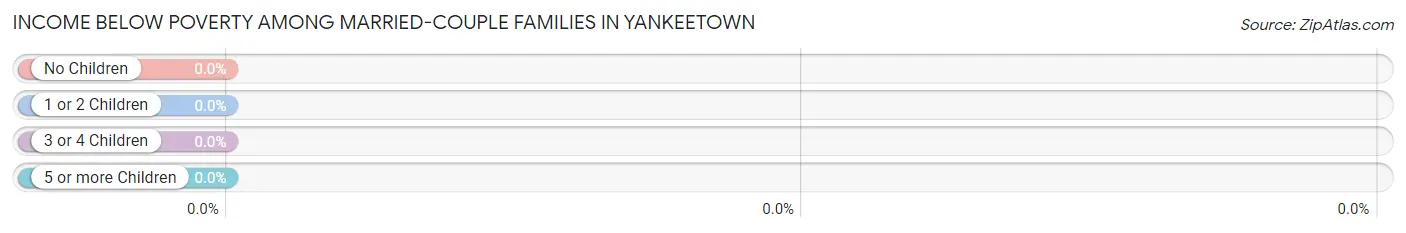
| Children | Above Poverty | Below Poverty |
| No Children | 136 (100.0%) | 0 (0.0%) |
| 1 or 2 Children | 14 (100.0%) | 0 (0.0%) |
| 3 or 4 Children | 0 (0.0%) | 0 (0.0%) |
| 5 or more Children | 0 (0.0%) | 0 (0.0%) |
| Total | 150 (100.0%) | 0 (0.0%) |
Income Below Poverty Among Single-Parent Households in Yankeetown
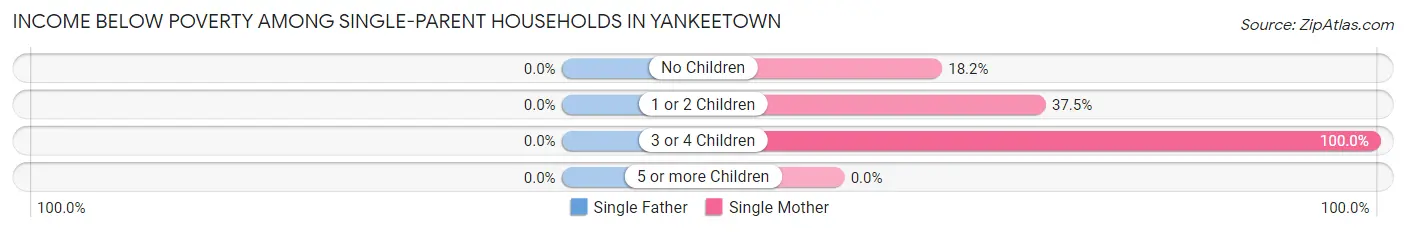
| Children | Single Father | Single Mother |
| No Children | 0 (0.0%) | 2 (18.2%) |
| 1 or 2 Children | 0 (0.0%) | 9 (37.5%) |
| 3 or 4 Children | 0 (0.0%) | 30 (100.0%) |
| 5 or more Children | 0 (0.0%) | 0 (0.0%) |
| Total | 0 (0.0%) | 41 (63.1%) |
Income Below Poverty Among Married-Couple vs Single-Parent Households in Yankeetown
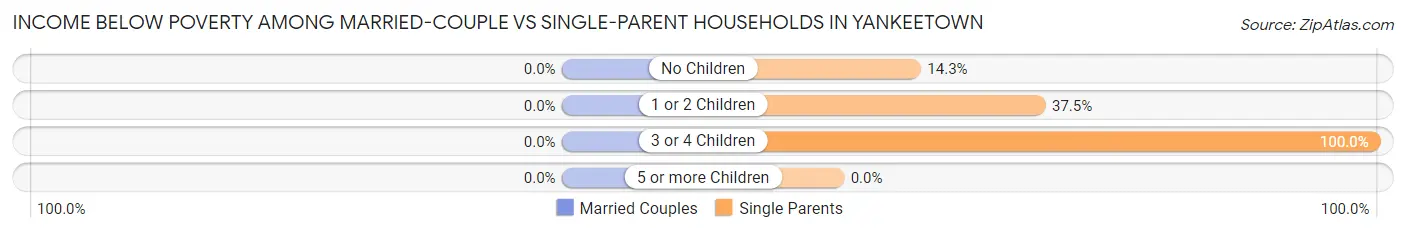
| Children | Married-Couple Families | Single-Parent Households |
| No Children | 0 (0.0%) | 2 (14.3%) |
| 1 or 2 Children | 0 (0.0%) | 9 (37.5%) |
| 3 or 4 Children | 0 (0.0%) | 30 (100.0%) |
| 5 or more Children | 0 (0.0%) | 0 (0.0%) |
| Total | 0 (0.0%) | 41 (60.3%) |
Race in Yankeetown
The most populous races in Yankeetown are White / Caucasian (626 | 99.5%), and Two or more Races (3 | 0.5%).
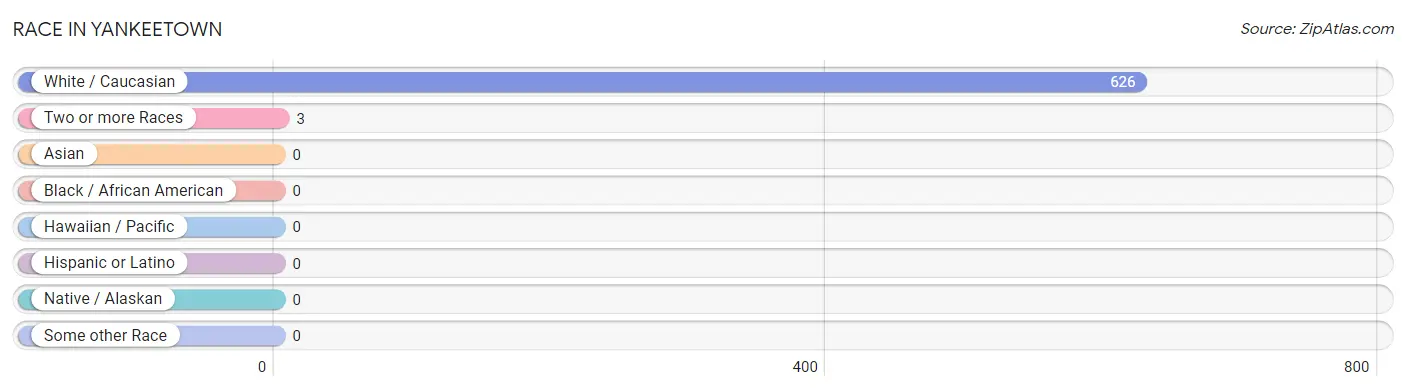
| Race | # Population | % Population |
| Asian | 0 | 0.0% |
| Black / African American | 0 | 0.0% |
| Hawaiian / Pacific | 0 | 0.0% |
| Hispanic or Latino | 0 | 0.0% |
| Native / Alaskan | 0 | 0.0% |
| White / Caucasian | 626 | 99.5% |
| Two or more Races | 3 | 0.5% |
| Some other Race | 0 | 0.0% |
| Total | 629 | 100.0% |
Ancestry in Yankeetown
The most populous ancestries reported in Yankeetown are English (202 | 32.1%), Irish (131 | 20.8%), German (98 | 15.6%), French (47 | 7.5%), and American (33 | 5.2%), together accounting for 81.2% of all Yankeetown residents.
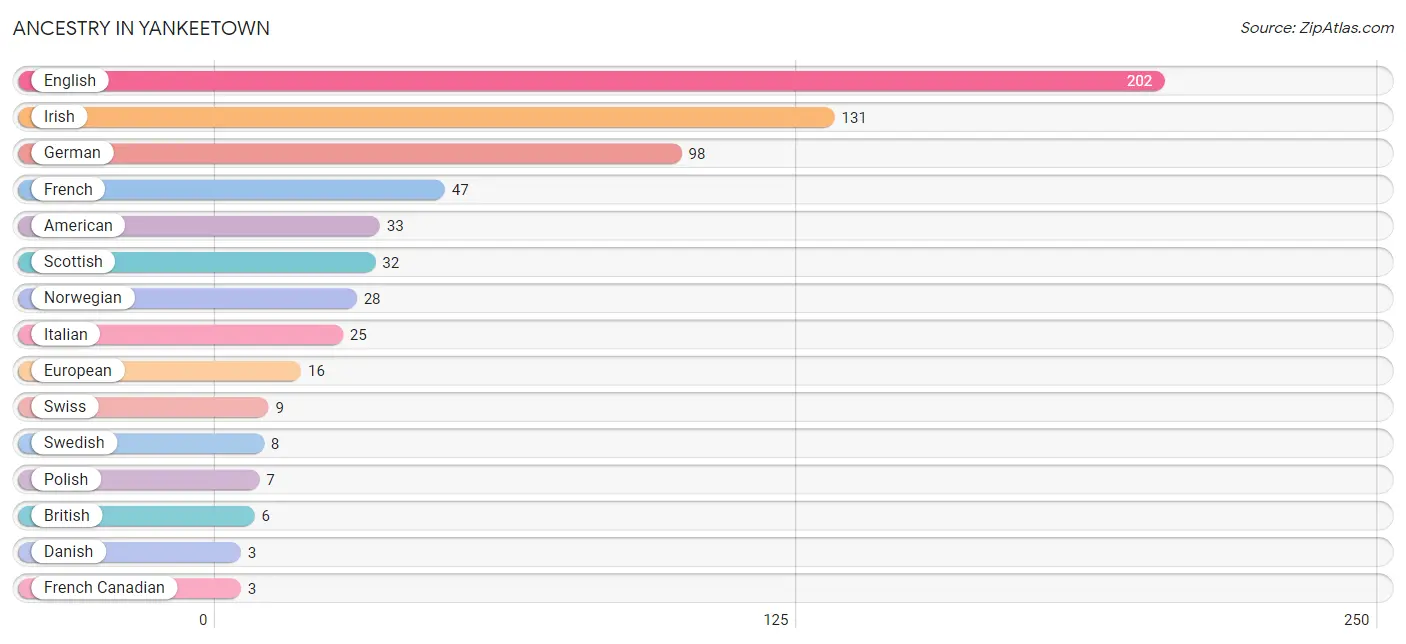
| Ancestry | # Population | % Population |
| American | 33 | 5.2% |
| Belgian | 2 | 0.3% |
| British | 6 | 0.9% |
| Danish | 3 | 0.5% |
| Eastern European | 2 | 0.3% |
| English | 202 | 32.1% |
| European | 16 | 2.5% |
| French | 47 | 7.5% |
| French Canadian | 3 | 0.5% |
| German | 98 | 15.6% |
| Irish | 131 | 20.8% |
| Italian | 25 | 4.0% |
| Norwegian | 28 | 4.4% |
| Polish | 7 | 1.1% |
| Portuguese | 2 | 0.3% |
| Scotch-Irish | 2 | 0.3% |
| Scottish | 32 | 5.1% |
| Serbian | 3 | 0.5% |
| Swedish | 8 | 1.3% |
| Swiss | 9 | 1.4% |
| Ukrainian | 2 | 0.3% |
| Welsh | 3 | 0.5% |
| Yugoslavian | 3 | 0.5% | View All 23 Rows |
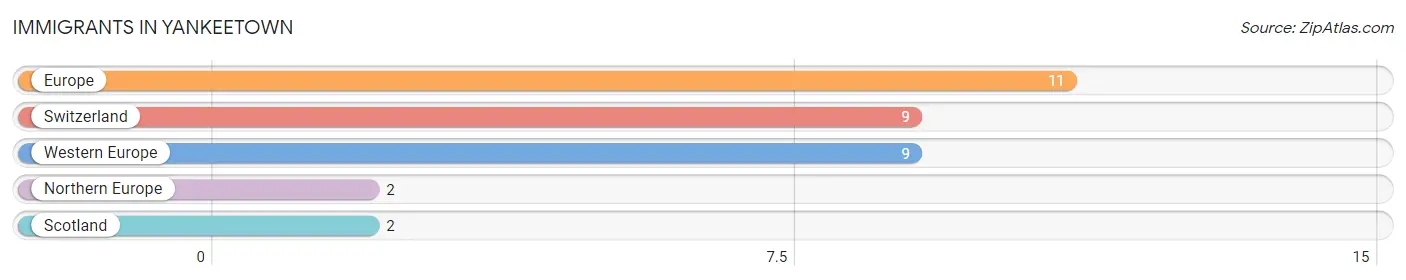
Immigrants in Yankeetown
The most numerous immigrant groups reported in Yankeetown came from Europe (11 | 1.8%), Switzerland (9 | 1.4%), Western Europe (9 | 1.4%), Northern Europe (2 | 0.3%), and Scotland (2 | 0.3%), together accounting for 5.3% of all Yankeetown residents.
| Immigration Origin | # Population | % Population |
| Europe | 11 | 1.8% |
| Northern Europe | 2 | 0.3% |
| Scotland | 2 | 0.3% |
| Switzerland | 9 | 1.4% |
| Western Europe | 9 | 1.4% | View All 5 Rows |
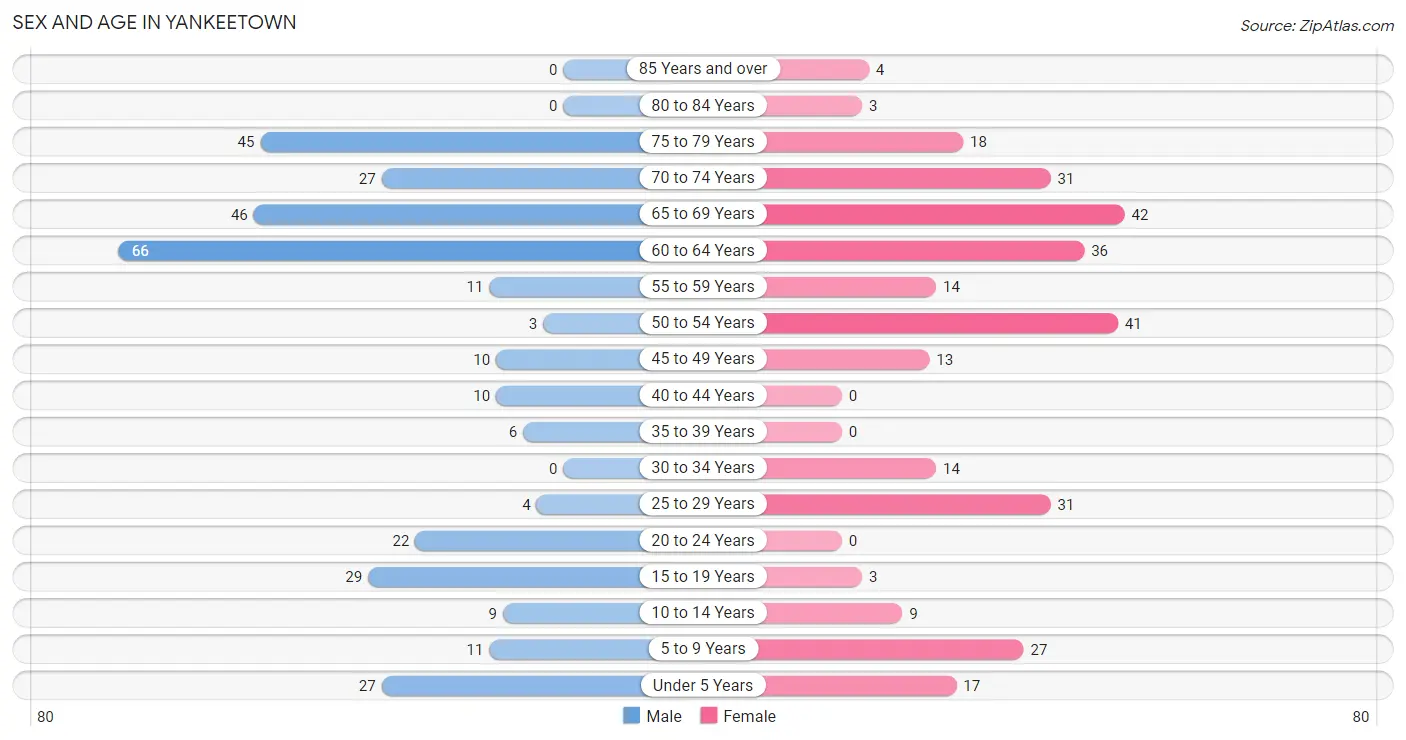
Sex and Age in Yankeetown
Sex and Age in Yankeetown
The most populous age groups in Yankeetown are 60 to 64 Years (66 | 20.3%) for men and 65 to 69 Years (42 | 13.9%) for women.
| Age Bracket | Male | Female |
| Under 5 Years | 27 (8.3%) | 17 (5.6%) |
| 5 to 9 Years | 11 (3.4%) | 27 (8.9%) |
| 10 to 14 Years | 9 (2.8%) | 9 (3.0%) |
| 15 to 19 Years | 29 (8.9%) | 3 (1.0%) |
| 20 to 24 Years | 22 (6.8%) | 0 (0.0%) |
| 25 to 29 Years | 4 (1.2%) | 31 (10.2%) |
| 30 to 34 Years | 0 (0.0%) | 14 (4.6%) |
| 35 to 39 Years | 6 (1.8%) | 0 (0.0%) |
| 40 to 44 Years | 10 (3.1%) | 0 (0.0%) |
| 45 to 49 Years | 10 (3.1%) | 13 (4.3%) |
| 50 to 54 Years | 3 (0.9%) | 41 (13.5%) |
| 55 to 59 Years | 11 (3.4%) | 14 (4.6%) |
| 60 to 64 Years | 66 (20.3%) | 36 (11.9%) |
| 65 to 69 Years | 46 (14.1%) | 42 (13.9%) |
| 70 to 74 Years | 27 (8.3%) | 31 (10.2%) |
| 75 to 79 Years | 45 (13.8%) | 18 (5.9%) |
| 80 to 84 Years | 0 (0.0%) | 3 (1.0%) |
| 85 Years and over | 0 (0.0%) | 4 (1.3%) |
| Total | 326 (100.0%) | 303 (100.0%) |
Families and Households in Yankeetown
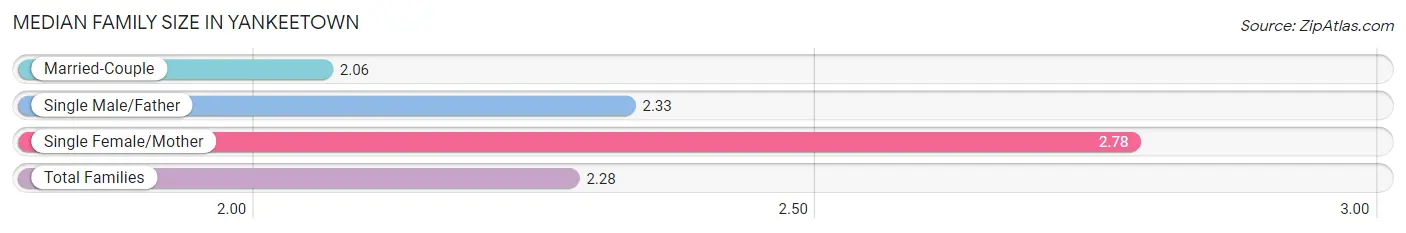
Median Family Size in Yankeetown
The median family size in Yankeetown is 2.28 persons per family, with single female/mother families (65 | 29.8%) accounting for the largest median family size of 2.78 persons per family. On the other hand, married-couple families (150 | 68.8%) represent the smallest median family size with 2.06 persons per family.
| Family Type | # Families | Family Size |
| Married-Couple | 150 (68.8%) | 2.06 |
| Single Male/Father | 3 (1.4%) | 2.33 |
| Single Female/Mother | 65 (29.8%) | 2.78 |
| Total Families | 218 (100.0%) | 2.28 |
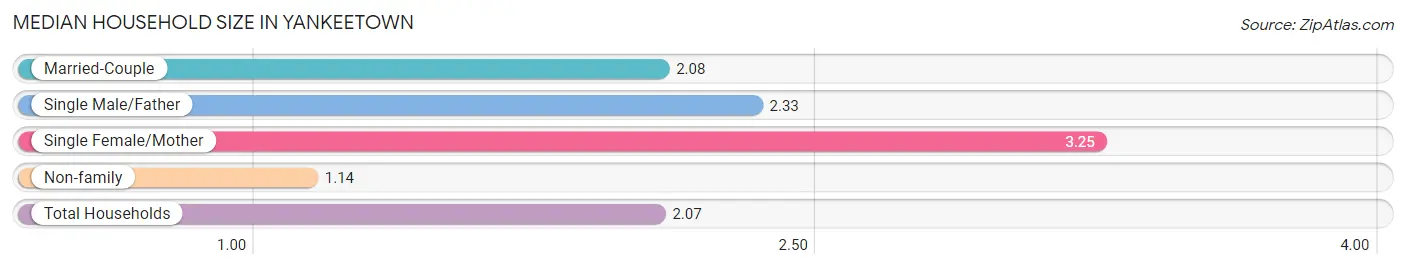
Median Household Size in Yankeetown
The median household size in Yankeetown is 2.07 persons per household, with single female/mother households (65 | 21.5%) accounting for the largest median household size of 3.25 persons per household. non-family households (84 | 27.8%) represent the smallest median household size with 1.14 persons per household.
| Household Type | # Households | Household Size |
| Married-Couple | 150 (49.7%) | 2.08 |
| Single Male/Father | 3 (1.0%) | 2.33 |
| Single Female/Mother | 65 (21.5%) | 3.25 |
| Non-family | 84 (27.8%) | 1.14 |
| Total Households | 302 (100.0%) | 2.07 |
Household Size by Marriage Status in Yankeetown
Out of a total of 302 households in Yankeetown, 218 (72.2%) are family households, while 84 (27.8%) are nonfamily households. The most numerous type of family households are 2-person households, comprising 147, and the most common type of nonfamily households are 1-person households, comprising 72.
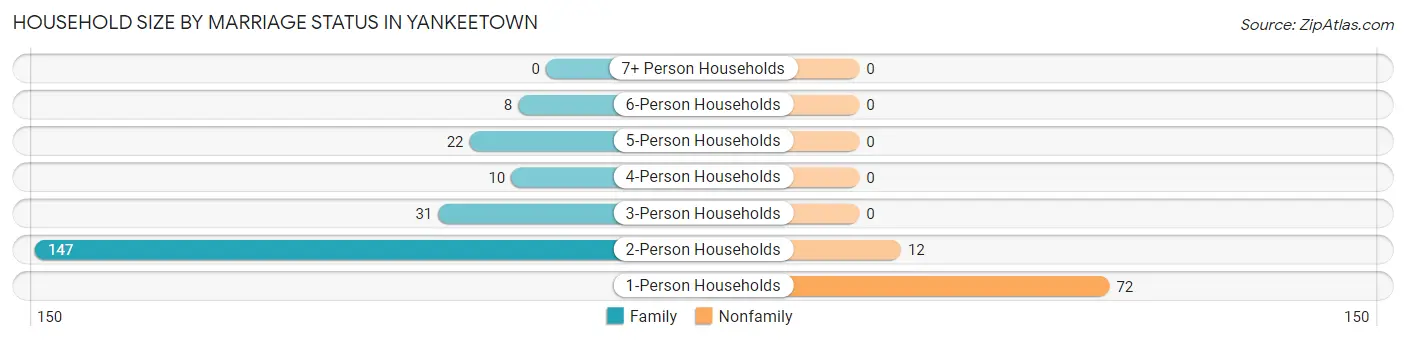
| Household Size | Family Households | Nonfamily Households |
| 1-Person Households | - | 72 (23.8%) |
| 2-Person Households | 147 (48.7%) | 12 (4.0%) |
| 3-Person Households | 31 (10.3%) | 0 (0.0%) |
| 4-Person Households | 10 (3.3%) | 0 (0.0%) |
| 5-Person Households | 22 (7.3%) | 0 (0.0%) |
| 6-Person Households | 8 (2.6%) | 0 (0.0%) |
| 7+ Person Households | 0 (0.0%) | 0 (0.0%) |
| Total | 218 (72.2%) | 84 (27.8%) |
Female Fertility in Yankeetown
Fertility by Age in Yankeetown
Average fertility rate in Yankeetown is 178.0 births per 1,000 women. Women in the age bracket of 20 to 34 years have the highest fertility rate with 289.0 births per 1,000 women. Women in the age bracket of 20 to 34 years acount for 100.0% of all women with births.
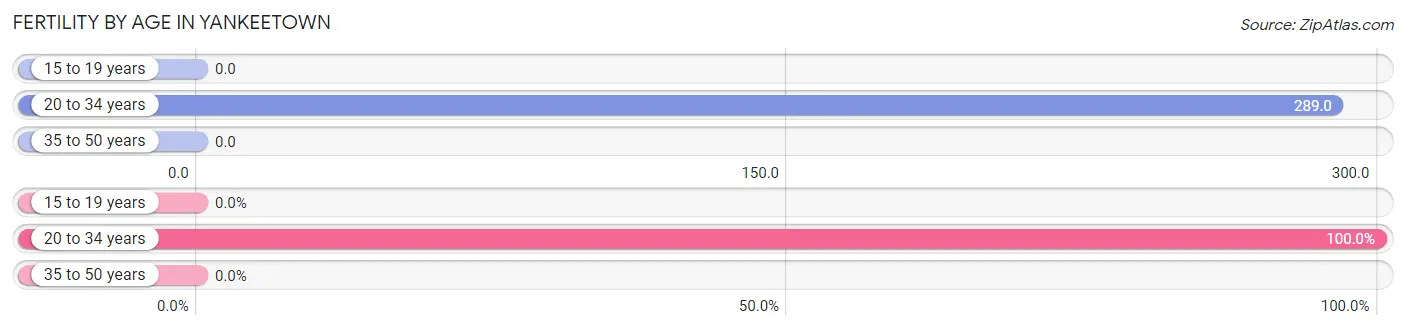
| Age Bracket | Women with Births | Births / 1,000 Women |
| 15 to 19 years | 0 (0.0%) | 0.0 |
| 20 to 34 years | 13 (100.0%) | 289.0 |
| 35 to 50 years | 0 (0.0%) | 0.0 |
| Total | 13 (100.0%) | 178.0 |
Fertility by Age by Marriage Status in Yankeetown
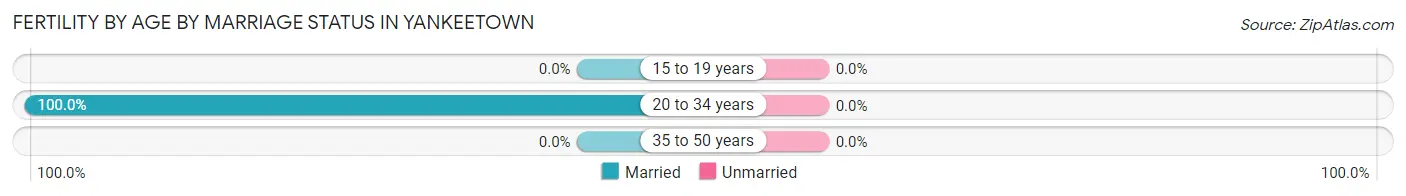
| Age Bracket | Married | Unmarried |
| 15 to 19 years | 0 (0.0%) | 0 (0.0%) |
| 20 to 34 years | 13 (100.0%) | 0 (0.0%) |
| 35 to 50 years | 0 (0.0%) | 0 (0.0%) |
| Total | 13 (100.0%) | 0 (0.0%) |
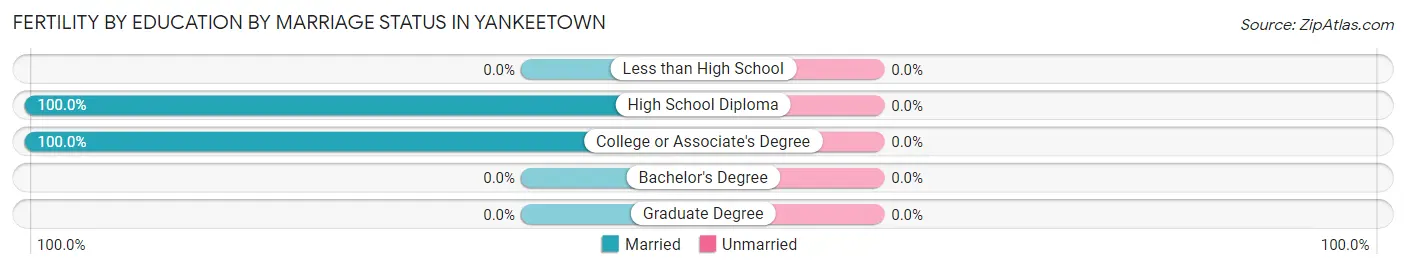
Fertility by Education in Yankeetown
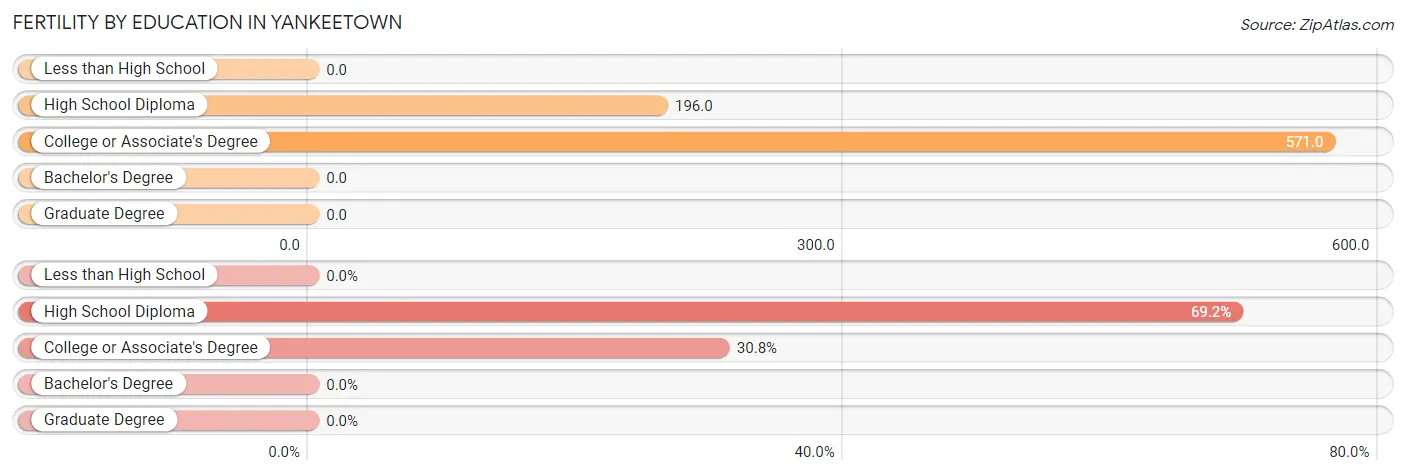
| Educational Attainment | Women with Births | Births / 1,000 Women |
| Less than High School | 0 (0.0%) | 0.0 |
| High School Diploma | 9 (69.2%) | 196.0 |
| College or Associate's Degree | 4 (30.8%) | 571.0 |
| Bachelor's Degree | 0 (0.0%) | 0.0 |
| Graduate Degree | 0 (0.0%) | 0.0 |
| Total | 13 (100.0%) | 178.0 |
Fertility by Education by Marriage Status in Yankeetown
| Educational Attainment | Married | Unmarried |
| Less than High School | 0 (0.0%) | 0 (0.0%) |
| High School Diploma | 9 (100.0%) | 0 (0.0%) |
| College or Associate's Degree | 4 (100.0%) | 0 (0.0%) |
| Bachelor's Degree | 0 (0.0%) | 0 (0.0%) |
| Graduate Degree | 0 (0.0%) | 0 (0.0%) |
| Total | 13 (100.0%) | 0 (0.0%) |
Employment Characteristics in Yankeetown
Employment by Class of Employer in Yankeetown
Among the 156 employed individuals in Yankeetown, private company employees (89 | 57.1%), self-employed (incorporated) (23 | 14.7%), and self-employed (not incorporated) (13 | 8.3%) make up the most common classes of employment.
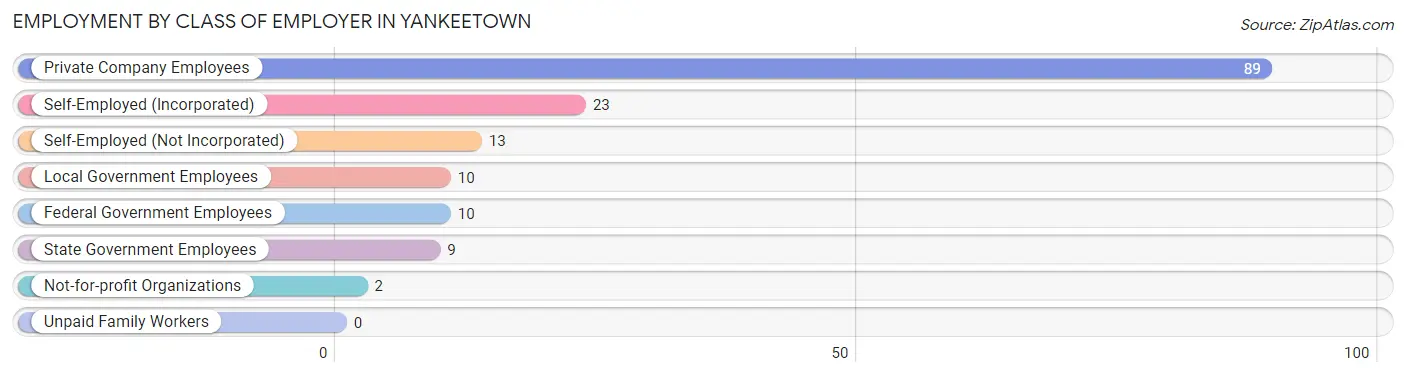
| Employer Class | # Employees | % Employees |
| Private Company Employees | 89 | 57.1% |
| Self-Employed (Incorporated) | 23 | 14.7% |
| Self-Employed (Not Incorporated) | 13 | 8.3% |
| Not-for-profit Organizations | 2 | 1.3% |
| Local Government Employees | 10 | 6.4% |
| State Government Employees | 9 | 5.8% |
| Federal Government Employees | 10 | 6.4% |
| Unpaid Family Workers | 0 | 0.0% |
| Total | 156 | 100.0% |
Employment Status by Age in Yankeetown
According to the labor force statistics for Yankeetown, out of the total population over 16 years of age (514), 33.5% or 172 individuals are in the labor force, with 9.3% or 16 of them unemployed. The age group with the highest labor force participation rate is 20 to 24 years, with 100.0% or 22 individuals in the labor force. Within the labor force, the 25 to 29 years age range has the highest percentage of unemployed individuals, with 100.0% or 13 of them being unemployed.
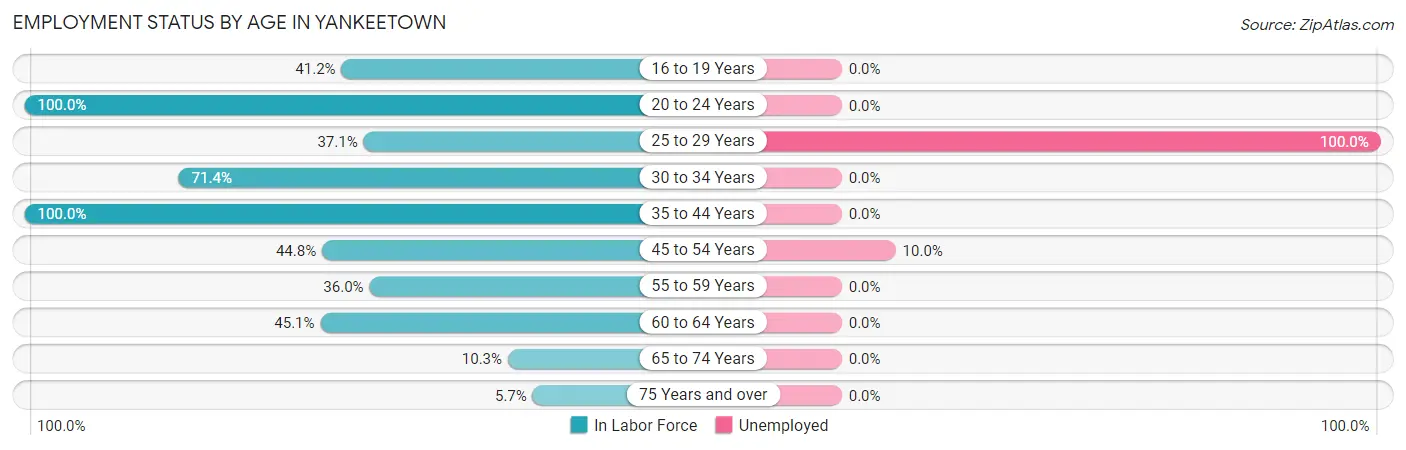
| Age Bracket | In Labor Force | Unemployed |
| 16 to 19 Years | 7 (41.2%) | 0 (0.0%) |
| 20 to 24 Years | 22 (100.0%) | 0 (0.0%) |
| 25 to 29 Years | 13 (37.1%) | 13 (100.0%) |
| 30 to 34 Years | 10 (71.4%) | 0 (0.0%) |
| 35 to 44 Years | 16 (100.0%) | 0 (0.0%) |
| 45 to 54 Years | 30 (44.8%) | 3 (10.0%) |
| 55 to 59 Years | 9 (36.0%) | 0 (0.0%) |
| 60 to 64 Years | 46 (45.1%) | 0 (0.0%) |
| 65 to 74 Years | 15 (10.3%) | 0 (0.0%) |
| 75 Years and over | 4 (5.7%) | 0 (0.0%) |
| Total | 172 (33.5%) | 16 (9.3%) |
Employment Status by Educational Attainment in Yankeetown
According to labor force statistics for Yankeetown, 47.9% of individuals (124) out of the total population between 25 and 64 years of age (259) are in the labor force, with 12.9% or 16 of them being unemployed. The group with the highest labor force participation rate are those with the educational attainment of less than high school, with 60.0% or 3 individuals in the labor force. Within the labor force, individuals with bachelor's degree or higher education have the highest percentage of unemployment, with 18.4% or 7 of them being unemployed.
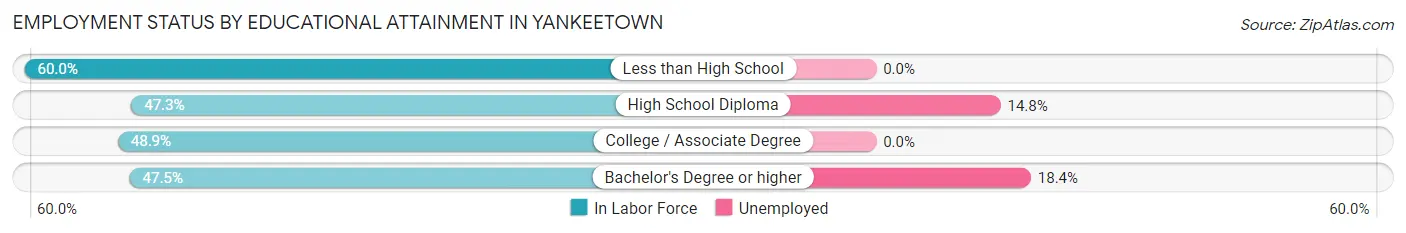
| Educational Attainment | In Labor Force | Unemployed |
| Less than High School | 3 (60.0%) | 0 (0.0%) |
| High School Diploma | 61 (47.3%) | 19 (14.8%) |
| College / Associate Degree | 22 (48.9%) | 0 (0.0%) |
| Bachelor's Degree or higher | 38 (47.5%) | 15 (18.4%) |
| Total | 124 (47.9%) | 33 (12.9%) |
Employment Occupations by Sex in Yankeetown
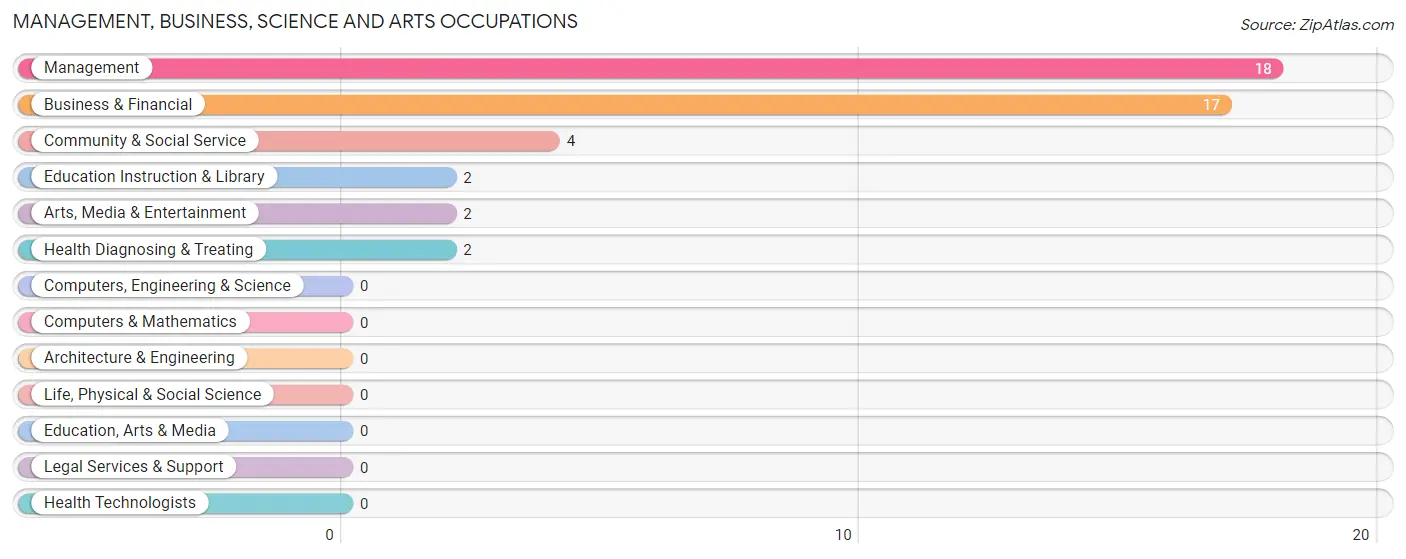
Management, Business, Science and Arts Occupations
The most common Management, Business, Science and Arts occupations in Yankeetown are Management (18 | 11.5%), Business & Financial (17 | 10.9%), Community & Social Service (4 | 2.6%), Education Instruction & Library (2 | 1.3%), and Arts, Media & Entertainment (2 | 1.3%).
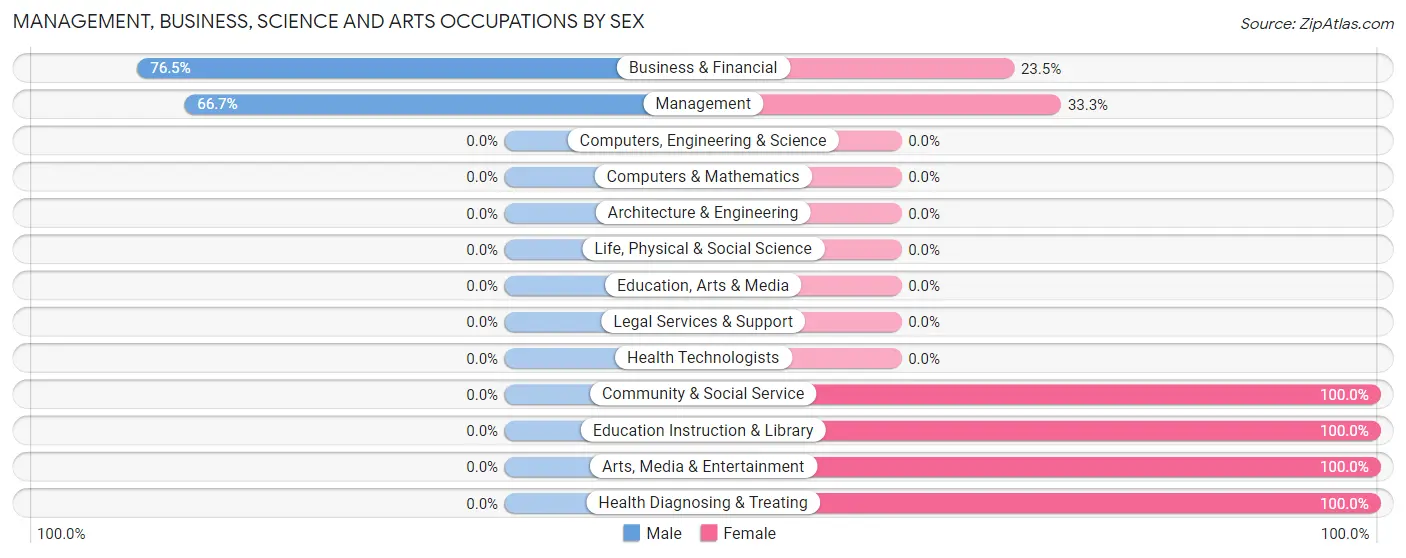
Management, Business, Science and Arts Occupations by Sex
Within the Management, Business, Science and Arts occupations in Yankeetown, the most male-oriented occupations are Business & Financial (76.5%), and Management (66.7%), while the most female-oriented occupations are Community & Social Service (100.0%), Education Instruction & Library (100.0%), and Arts, Media & Entertainment (100.0%).
| Occupation | Male | Female |
| Management | 12 (66.7%) | 6 (33.3%) |
| Business & Financial | 13 (76.5%) | 4 (23.5%) |
| Computers, Engineering & Science | 0 (0.0%) | 0 (0.0%) |
| Computers & Mathematics | 0 (0.0%) | 0 (0.0%) |
| Architecture & Engineering | 0 (0.0%) | 0 (0.0%) |
| Life, Physical & Social Science | 0 (0.0%) | 0 (0.0%) |
| Community & Social Service | 0 (0.0%) | 4 (100.0%) |
| Education, Arts & Media | 0 (0.0%) | 0 (0.0%) |
| Legal Services & Support | 0 (0.0%) | 0 (0.0%) |
| Education Instruction & Library | 0 (0.0%) | 2 (100.0%) |
| Arts, Media & Entertainment | 0 (0.0%) | 2 (100.0%) |
| Health Diagnosing & Treating | 0 (0.0%) | 2 (100.0%) |
| Health Technologists | 0 (0.0%) | 0 (0.0%) |
| Total (Category) | 25 (61.0%) | 16 (39.0%) |
| Total (Overall) | 105 (67.3%) | 51 (32.7%) |
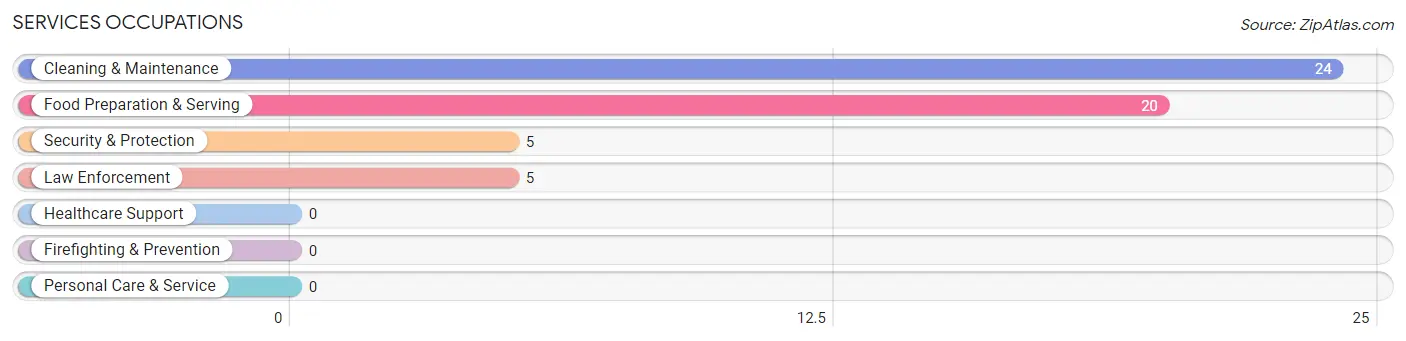
Services Occupations
The most common Services occupations in Yankeetown are Cleaning & Maintenance (24 | 15.4%), Food Preparation & Serving (20 | 12.8%), Security & Protection (5 | 3.2%), and Law Enforcement (5 | 3.2%).
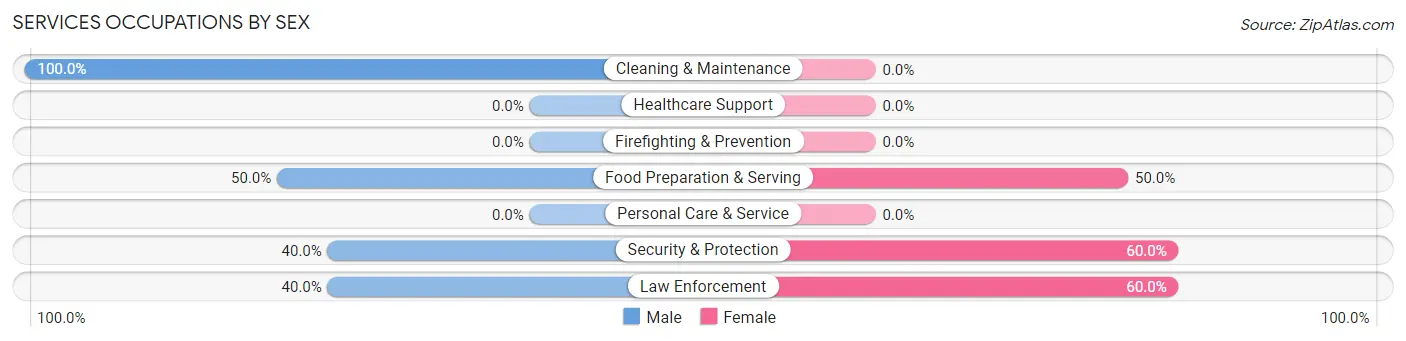
Services Occupations by Sex
Within the Services occupations in Yankeetown, the most male-oriented occupations are Cleaning & Maintenance (100.0%), Food Preparation & Serving (50.0%), and Security & Protection (40.0%), while the most female-oriented occupations are Security & Protection (60.0%), Law Enforcement (60.0%), and Food Preparation & Serving (50.0%).
| Occupation | Male | Female |
| Healthcare Support | 0 (0.0%) | 0 (0.0%) |
| Security & Protection | 2 (40.0%) | 3 (60.0%) |
| Firefighting & Prevention | 0 (0.0%) | 0 (0.0%) |
| Law Enforcement | 2 (40.0%) | 3 (60.0%) |
| Food Preparation & Serving | 10 (50.0%) | 10 (50.0%) |
| Cleaning & Maintenance | 24 (100.0%) | 0 (0.0%) |
| Personal Care & Service | 0 (0.0%) | 0 (0.0%) |
| Total (Category) | 36 (73.5%) | 13 (26.5%) |
| Total (Overall) | 105 (67.3%) | 51 (32.7%) |
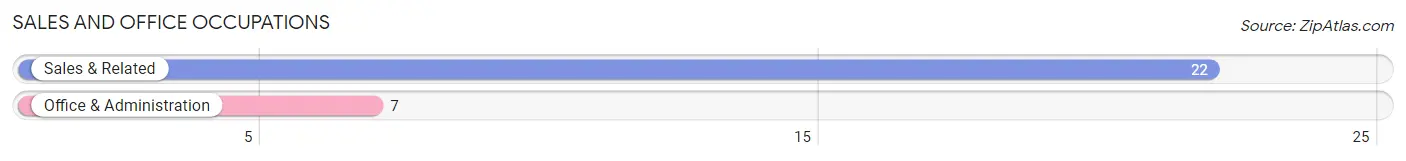
Sales and Office Occupations
The most common Sales and Office occupations in Yankeetown are Sales & Related (22 | 14.1%), and Office & Administration (7 | 4.5%).
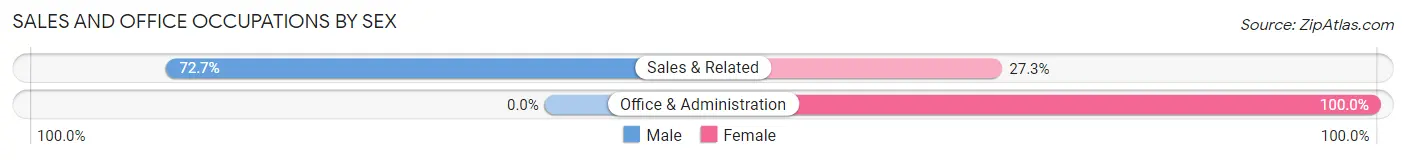
Sales and Office Occupations by Sex
| Occupation | Male | Female |
| Sales & Related | 16 (72.7%) | 6 (27.3%) |
| Office & Administration | 0 (0.0%) | 7 (100.0%) |
| Total (Category) | 16 (55.2%) | 13 (44.8%) |
| Total (Overall) | 105 (67.3%) | 51 (32.7%) |
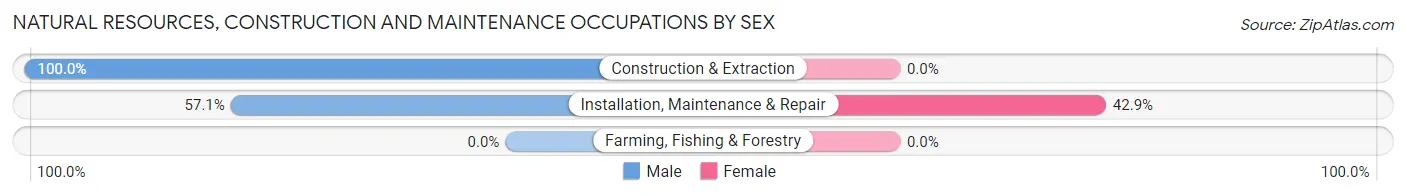
Natural Resources, Construction and Maintenance Occupations
The most common Natural Resources, Construction and Maintenance occupations in Yankeetown are Installation, Maintenance & Repair (21 | 13.5%), and Construction & Extraction (12 | 7.7%).

Natural Resources, Construction and Maintenance Occupations by Sex
| Occupation | Male | Female |
| Farming, Fishing & Forestry | 0 (0.0%) | 0 (0.0%) |
| Construction & Extraction | 12 (100.0%) | 0 (0.0%) |
| Installation, Maintenance & Repair | 12 (57.1%) | 9 (42.9%) |
| Total (Category) | 24 (72.7%) | 9 (27.3%) |
| Total (Overall) | 105 (67.3%) | 51 (32.7%) |
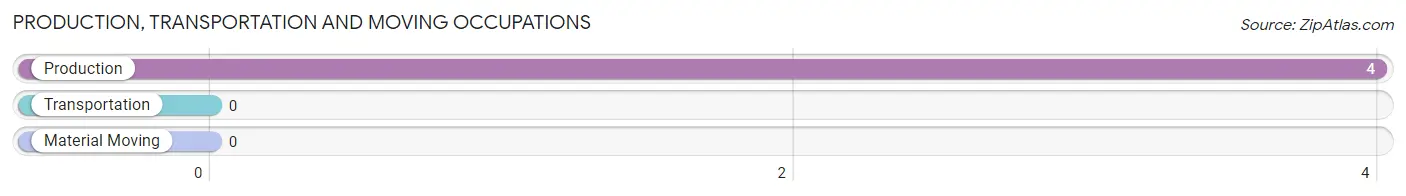
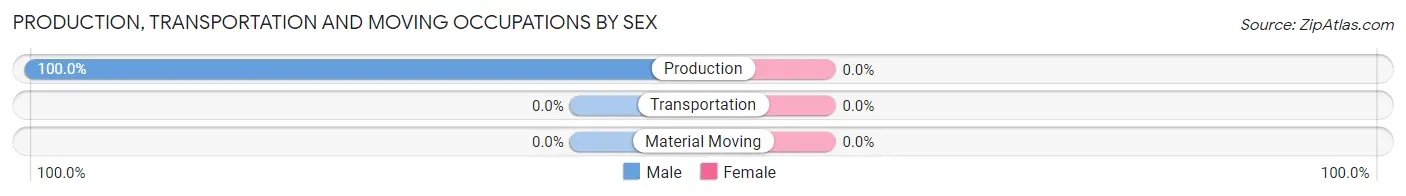
Production, Transportation and Moving Occupations
The most common Production, Transportation and Moving occupations in Yankeetown are , and Production (4 | 2.6%).
Production, Transportation and Moving Occupations by Sex
| Occupation | Male | Female |
| Production | 4 (100.0%) | 0 (0.0%) |
| Transportation | 0 (0.0%) | 0 (0.0%) |
| Material Moving | 0 (0.0%) | 0 (0.0%) |
| Total (Category) | 4 (100.0%) | 0 (0.0%) |
| Total (Overall) | 105 (67.3%) | 51 (32.7%) |
Employment Industries by Sex in Yankeetown
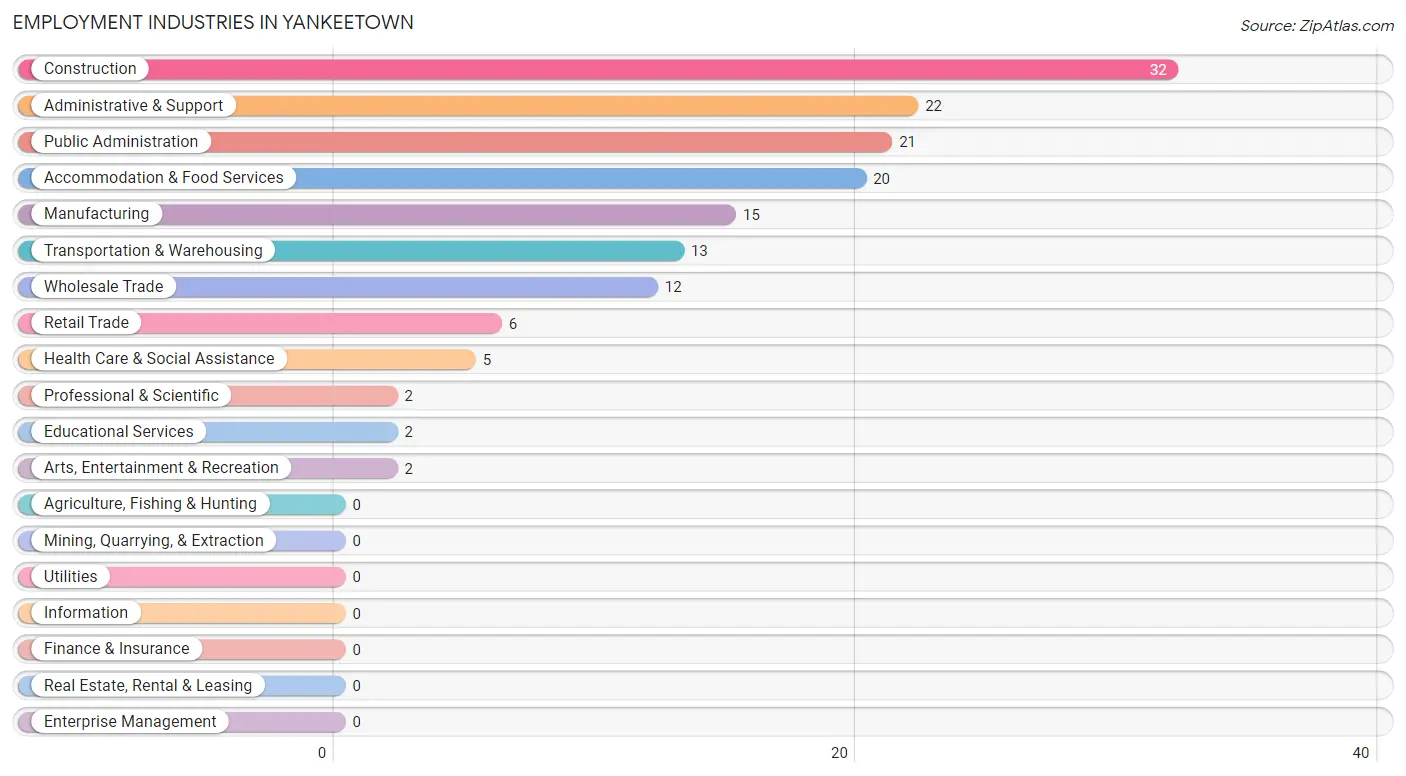
Employment Industries in Yankeetown
The major employment industries in Yankeetown include Construction (32 | 20.5%), Administrative & Support (22 | 14.1%), Public Administration (21 | 13.5%), Accommodation & Food Services (20 | 12.8%), and Manufacturing (15 | 9.6%).
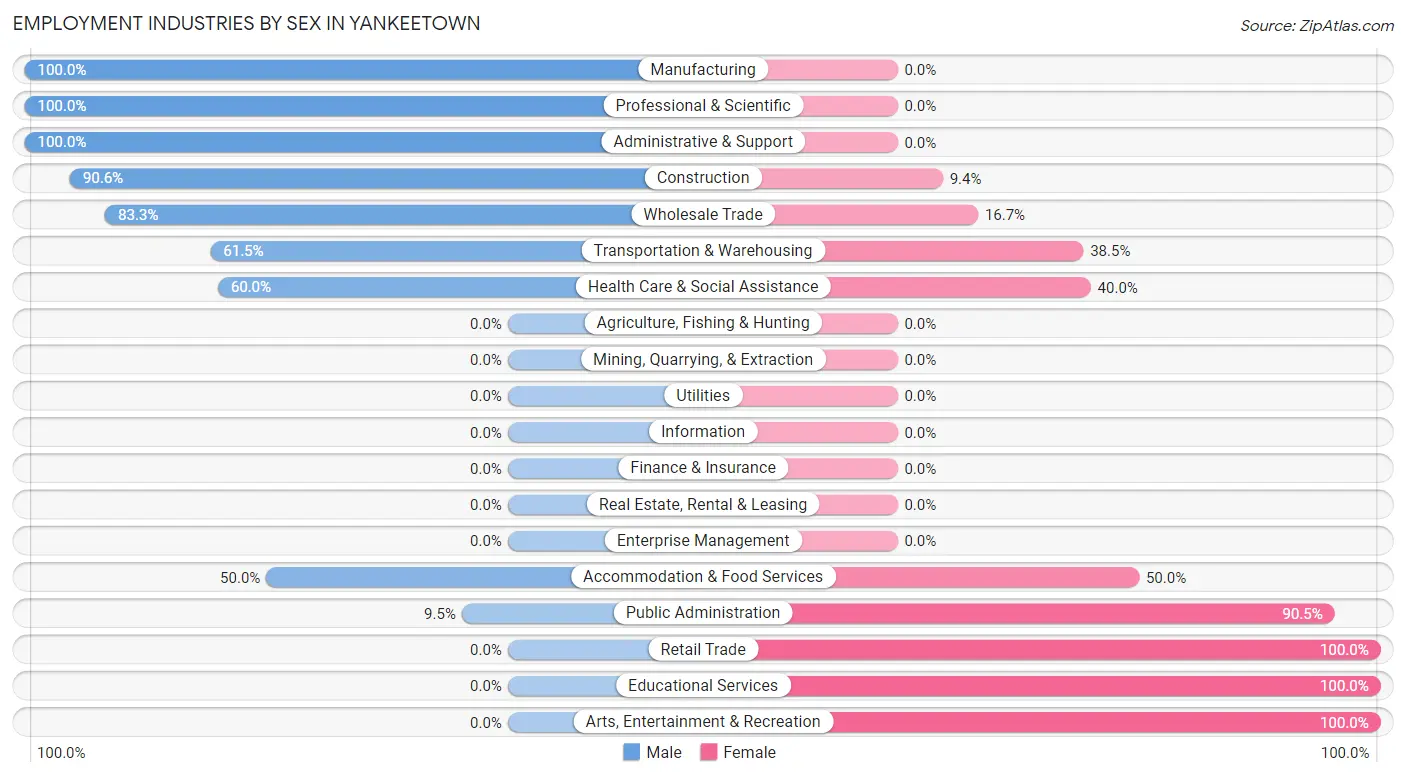
Employment Industries by Sex in Yankeetown
The Yankeetown industries that see more men than women are Manufacturing (100.0%), Professional & Scientific (100.0%), and Administrative & Support (100.0%), whereas the industries that tend to have a higher number of women are Retail Trade (100.0%), Educational Services (100.0%), and Arts, Entertainment & Recreation (100.0%).
| Industry | Male | Female |
| Agriculture, Fishing & Hunting | 0 (0.0%) | 0 (0.0%) |
| Mining, Quarrying, & Extraction | 0 (0.0%) | 0 (0.0%) |
| Construction | 29 (90.6%) | 3 (9.4%) |
| Manufacturing | 15 (100.0%) | 0 (0.0%) |
| Wholesale Trade | 10 (83.3%) | 2 (16.7%) |
| Retail Trade | 0 (0.0%) | 6 (100.0%) |
| Transportation & Warehousing | 8 (61.5%) | 5 (38.5%) |
| Utilities | 0 (0.0%) | 0 (0.0%) |
| Information | 0 (0.0%) | 0 (0.0%) |
| Finance & Insurance | 0 (0.0%) | 0 (0.0%) |
| Real Estate, Rental & Leasing | 0 (0.0%) | 0 (0.0%) |
| Professional & Scientific | 2 (100.0%) | 0 (0.0%) |
| Enterprise Management | 0 (0.0%) | 0 (0.0%) |
| Administrative & Support | 22 (100.0%) | 0 (0.0%) |
| Educational Services | 0 (0.0%) | 2 (100.0%) |
| Health Care & Social Assistance | 3 (60.0%) | 2 (40.0%) |
| Arts, Entertainment & Recreation | 0 (0.0%) | 2 (100.0%) |
| Accommodation & Food Services | 10 (50.0%) | 10 (50.0%) |
| Public Administration | 2 (9.5%) | 19 (90.5%) |
| Total | 105 (67.3%) | 51 (32.7%) |
Education in Yankeetown
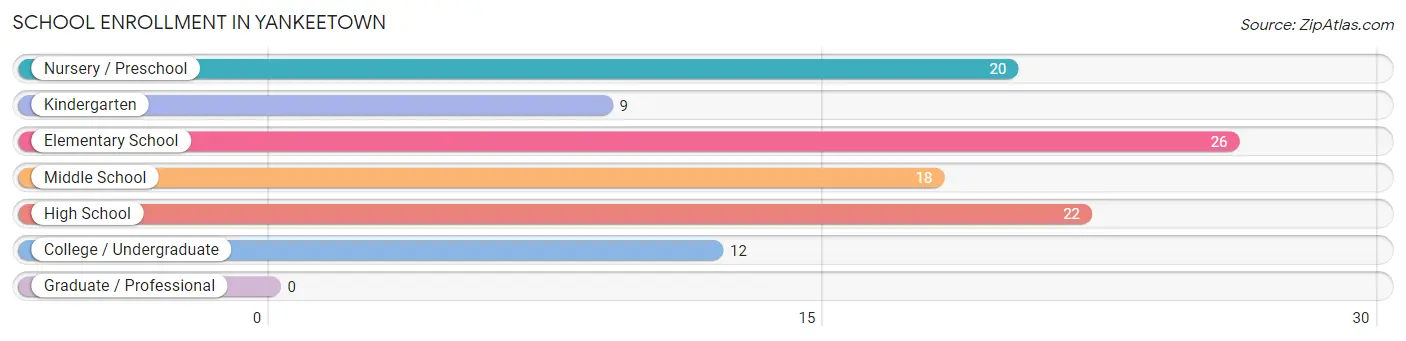
School Enrollment in Yankeetown
The most common levels of schooling among the 107 students in Yankeetown are elementary school (26 | 24.3%), high school (22 | 20.6%), and nursery / preschool (20 | 18.7%).
| School Level | # Students | % Students |
| Nursery / Preschool | 20 | 18.7% |
| Kindergarten | 9 | 8.4% |
| Elementary School | 26 | 24.3% |
| Middle School | 18 | 16.8% |
| High School | 22 | 20.6% |
| College / Undergraduate | 12 | 11.2% |
| Graduate / Professional | 0 | 0.0% |
| Total | 107 | 100.0% |
School Enrollment by Age by Funding Source in Yankeetown
Out of a total of 107 students who are enrolled in schools in Yankeetown, 18 (16.8%) attend a private institution, while the remaining 89 (83.2%) are enrolled in public schools. The age group of 25 to 34 year olds has the highest likelihood of being enrolled in private schools, with 4 (100.0% in the age bracket) enrolled. Conversely, the age group of 3 to 4 year olds has the lowest likelihood of being enrolled in a private school, with 17 (100.0% in the age bracket) attending a public institution.
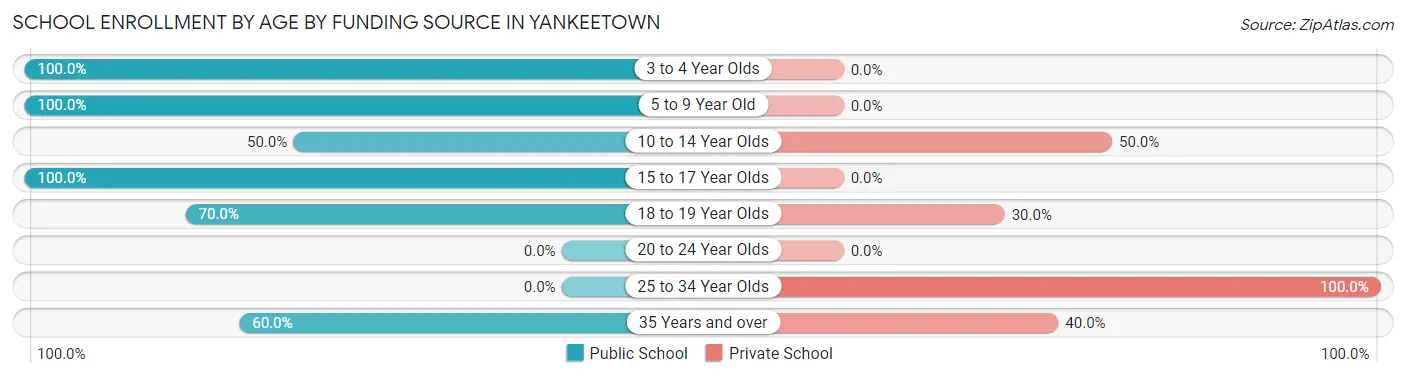
| Age Bracket | Public School | Private School |
| 3 to 4 Year Olds | 17 (100.0%) | 0 (0.0%) |
| 5 to 9 Year Old | 38 (100.0%) | 0 (0.0%) |
| 10 to 14 Year Olds | 9 (50.0%) | 9 (50.0%) |
| 15 to 17 Year Olds | 15 (100.0%) | 0 (0.0%) |
| 18 to 19 Year Olds | 7 (70.0%) | 3 (30.0%) |
| 20 to 24 Year Olds | 0 (0.0%) | 0 (0.0%) |
| 25 to 34 Year Olds | 0 (0.0%) | 4 (100.0%) |
| 35 Years and over | 3 (60.0%) | 2 (40.0%) |
| Total | 89 (83.2%) | 18 (16.8%) |
Educational Attainment by Field of Study in Yankeetown
Business (39 | 24.2%), social sciences (31 | 19.3%), arts & humanities (19 | 11.8%), engineering (16 | 9.9%), and physical & health sciences (14 | 8.7%) are the most common fields of study among 161 individuals in Yankeetown who have obtained a bachelor's degree or higher.
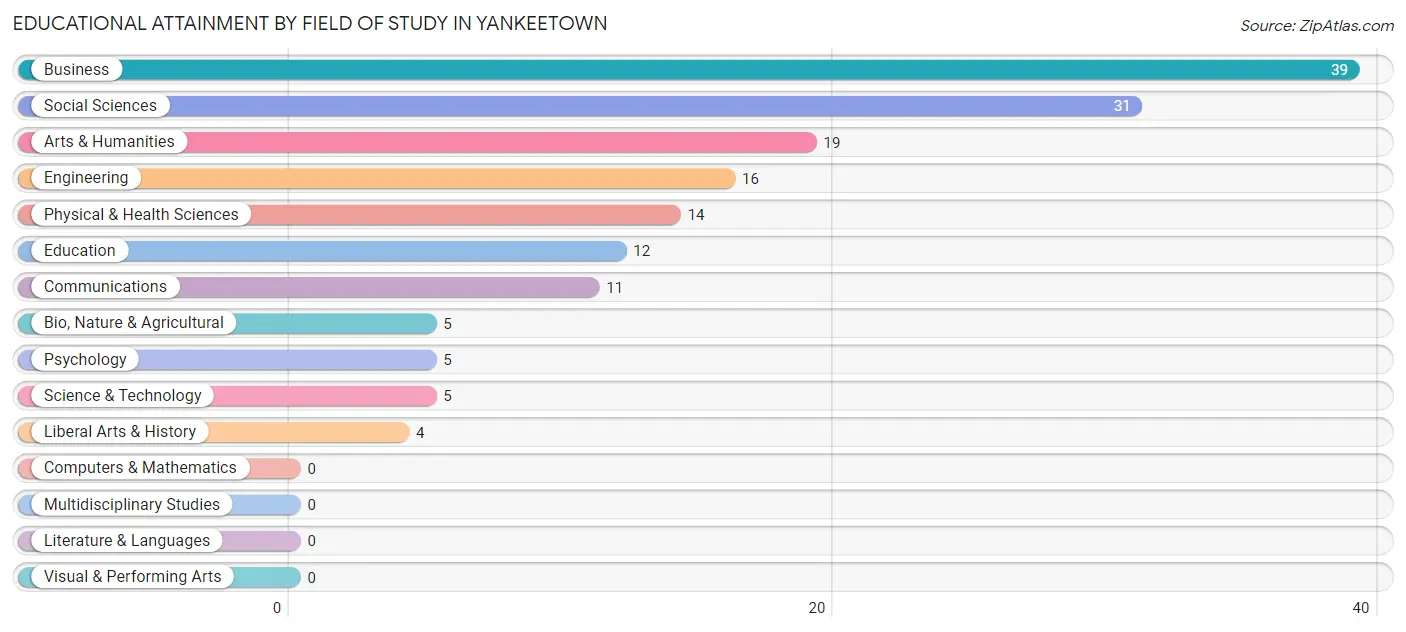
| Field of Study | # Graduates | % Graduates |
| Computers & Mathematics | 0 | 0.0% |
| Bio, Nature & Agricultural | 5 | 3.1% |
| Physical & Health Sciences | 14 | 8.7% |
| Psychology | 5 | 3.1% |
| Social Sciences | 31 | 19.3% |
| Engineering | 16 | 9.9% |
| Multidisciplinary Studies | 0 | 0.0% |
| Science & Technology | 5 | 3.1% |
| Business | 39 | 24.2% |
| Education | 12 | 7.4% |
| Literature & Languages | 0 | 0.0% |
| Liberal Arts & History | 4 | 2.5% |
| Visual & Performing Arts | 0 | 0.0% |
| Communications | 11 | 6.8% |
| Arts & Humanities | 19 | 11.8% |
| Total | 161 | 100.0% |
Transportation & Commute in Yankeetown
Vehicle Availability by Sex in Yankeetown
The most prevalent vehicle ownership categories in Yankeetown are males with 1 vehicle (58, accounting for 55.2%) and females with 1 vehicle (19, making up 113.7%).
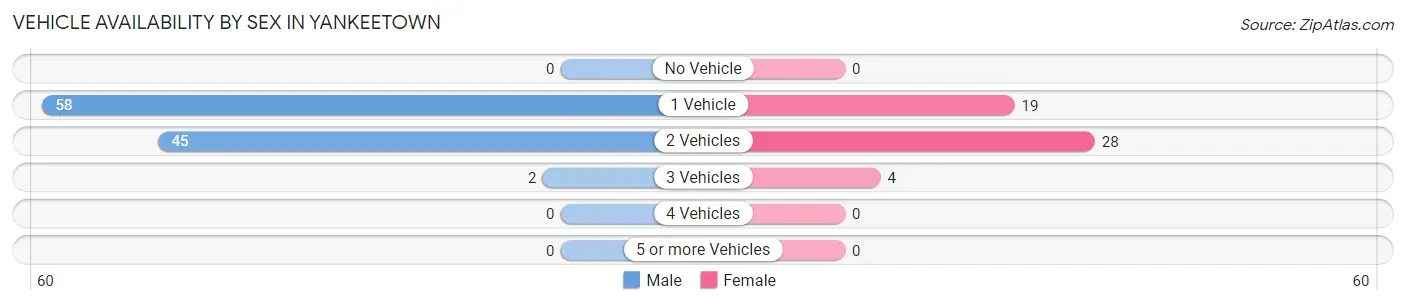
| Vehicles Available | Male | Female |
| No Vehicle | 0 (0.0%) | 0 (0.0%) |
| 1 Vehicle | 58 (55.2%) | 19 (37.2%) |
| 2 Vehicles | 45 (42.9%) | 28 (54.9%) |
| 3 Vehicles | 2 (1.9%) | 4 (7.8%) |
| 4 Vehicles | 0 (0.0%) | 0 (0.0%) |
| 5 or more Vehicles | 0 (0.0%) | 0 (0.0%) |
| Total | 105 (100.0%) | 51 (100.0%) |
Commute Time in Yankeetown
The most frequently occuring commute durations in Yankeetown are 90 or more minutes (28 commuters, 21.0%), 35 to 39 minutes (22 commuters, 16.5%), and 5 to 9 minutes (18 commuters, 13.5%).
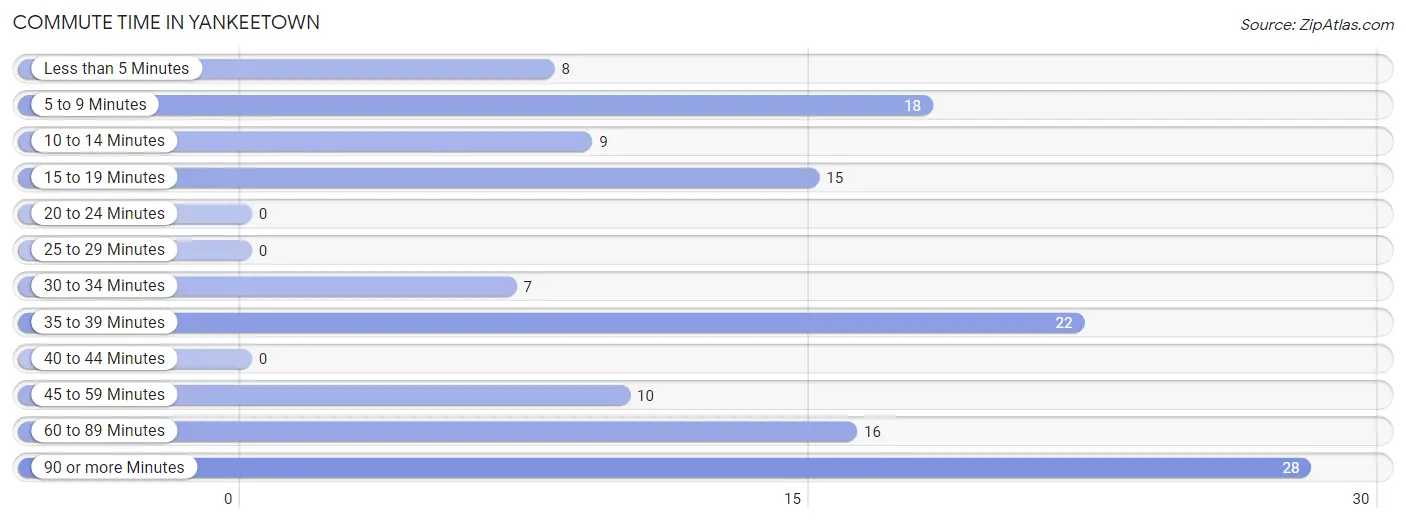
| Commute Time | # Commuters | % Commuters |
| Less than 5 Minutes | 8 | 6.0% |
| 5 to 9 Minutes | 18 | 13.5% |
| 10 to 14 Minutes | 9 | 6.8% |
| 15 to 19 Minutes | 15 | 11.3% |
| 20 to 24 Minutes | 0 | 0.0% |
| 25 to 29 Minutes | 0 | 0.0% |
| 30 to 34 Minutes | 7 | 5.3% |
| 35 to 39 Minutes | 22 | 16.5% |
| 40 to 44 Minutes | 0 | 0.0% |
| 45 to 59 Minutes | 10 | 7.5% |
| 60 to 89 Minutes | 16 | 12.0% |
| 90 or more Minutes | 28 | 21.0% |
Commute Time by Sex in Yankeetown
The most common commute times in Yankeetown are 35 to 39 minutes (22 commuters, 25.3%) for males and 90 or more minutes (24 commuters, 52.2%) for females.
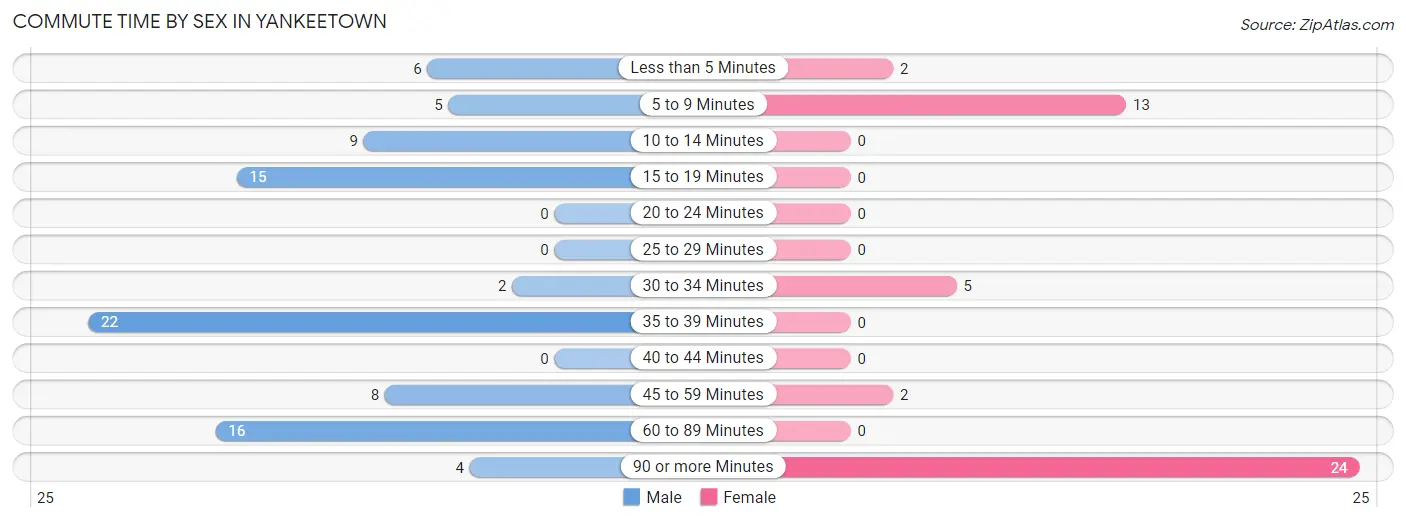
| Commute Time | Male | Female |
| Less than 5 Minutes | 6 (6.9%) | 2 (4.3%) |
| 5 to 9 Minutes | 5 (5.8%) | 13 (28.3%) |
| 10 to 14 Minutes | 9 (10.3%) | 0 (0.0%) |
| 15 to 19 Minutes | 15 (17.2%) | 0 (0.0%) |
| 20 to 24 Minutes | 0 (0.0%) | 0 (0.0%) |
| 25 to 29 Minutes | 0 (0.0%) | 0 (0.0%) |
| 30 to 34 Minutes | 2 (2.3%) | 5 (10.9%) |
| 35 to 39 Minutes | 22 (25.3%) | 0 (0.0%) |
| 40 to 44 Minutes | 0 (0.0%) | 0 (0.0%) |
| 45 to 59 Minutes | 8 (9.2%) | 2 (4.3%) |
| 60 to 89 Minutes | 16 (18.4%) | 0 (0.0%) |
| 90 or more Minutes | 4 (4.6%) | 24 (52.2%) |
Time of Departure to Work by Sex in Yankeetown
The most frequent times of departure to work in Yankeetown are 7:00 AM to 7:29 AM (26, 29.9%) for males and 7:30 AM to 7:59 AM (18, 39.1%) for females.
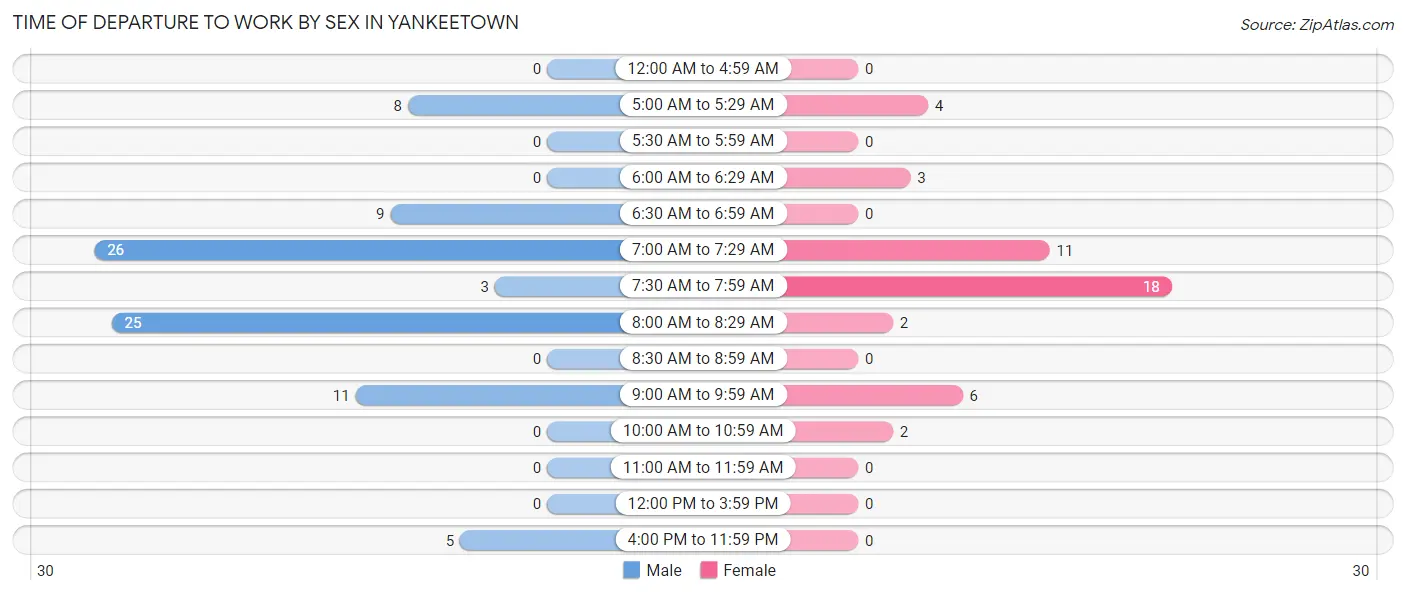
| Time of Departure | Male | Female |
| 12:00 AM to 4:59 AM | 0 (0.0%) | 0 (0.0%) |
| 5:00 AM to 5:29 AM | 8 (9.2%) | 4 (8.7%) |
| 5:30 AM to 5:59 AM | 0 (0.0%) | 0 (0.0%) |
| 6:00 AM to 6:29 AM | 0 (0.0%) | 3 (6.5%) |
| 6:30 AM to 6:59 AM | 9 (10.3%) | 0 (0.0%) |
| 7:00 AM to 7:29 AM | 26 (29.9%) | 11 (23.9%) |
| 7:30 AM to 7:59 AM | 3 (3.5%) | 18 (39.1%) |
| 8:00 AM to 8:29 AM | 25 (28.7%) | 2 (4.3%) |
| 8:30 AM to 8:59 AM | 0 (0.0%) | 0 (0.0%) |
| 9:00 AM to 9:59 AM | 11 (12.6%) | 6 (13.0%) |
| 10:00 AM to 10:59 AM | 0 (0.0%) | 2 (4.3%) |
| 11:00 AM to 11:59 AM | 0 (0.0%) | 0 (0.0%) |
| 12:00 PM to 3:59 PM | 0 (0.0%) | 0 (0.0%) |
| 4:00 PM to 11:59 PM | 5 (5.8%) | 0 (0.0%) |
| Total | 87 (100.0%) | 46 (100.0%) |
Housing Occupancy in Yankeetown
Occupancy by Ownership in Yankeetown
Of the total 302 dwellings in Yankeetown, owner-occupied units account for 246 (81.5%), while renter-occupied units make up 56 (18.5%).
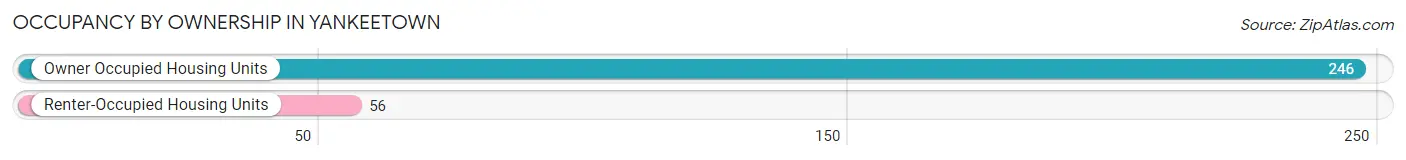
| Occupancy | # Housing Units | % Housing Units |
| Owner Occupied Housing Units | 246 | 81.5% |
| Renter-Occupied Housing Units | 56 | 18.5% |
| Total Occupied Housing Units | 302 | 100.0% |
Occupancy by Household Size in Yankeetown
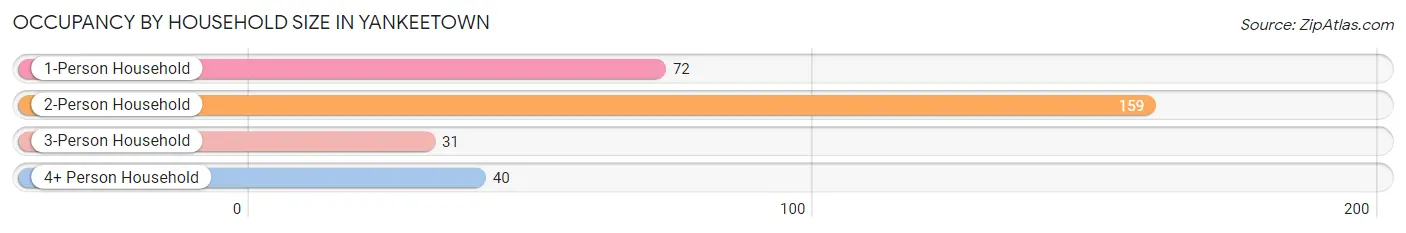
| Household Size | # Housing Units | % Housing Units |
| 1-Person Household | 72 | 23.8% |
| 2-Person Household | 159 | 52.6% |
| 3-Person Household | 31 | 10.3% |
| 4+ Person Household | 40 | 13.3% |
| Total Housing Units | 302 | 100.0% |
Occupancy by Ownership by Household Size in Yankeetown
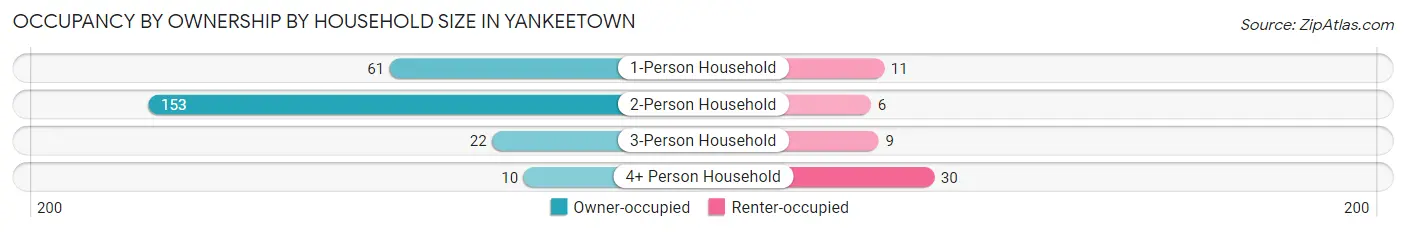
| Household Size | Owner-occupied | Renter-occupied |
| 1-Person Household | 61 (84.7%) | 11 (15.3%) |
| 2-Person Household | 153 (96.2%) | 6 (3.8%) |
| 3-Person Household | 22 (71.0%) | 9 (29.0%) |
| 4+ Person Household | 10 (25.0%) | 30 (75.0%) |
| Total Housing Units | 246 (81.5%) | 56 (18.5%) |
Occupancy by Educational Attainment in Yankeetown
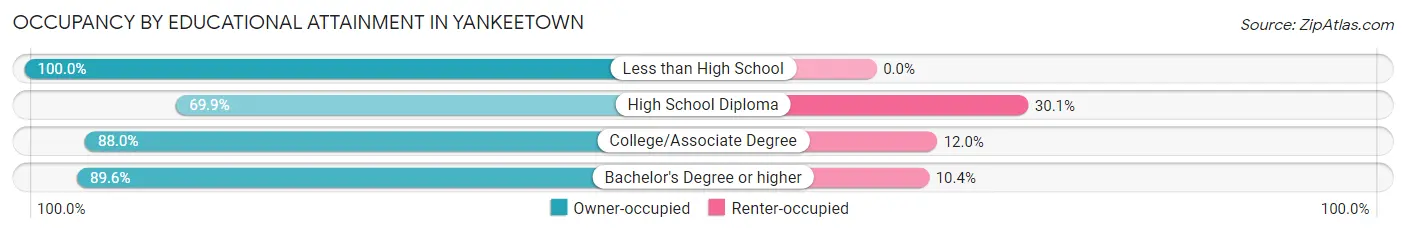
| Household Size | Owner-occupied | Renter-occupied |
| Less than High School | 8 (100.0%) | 0 (0.0%) |
| High School Diploma | 86 (69.9%) | 37 (30.1%) |
| College/Associate Degree | 66 (88.0%) | 9 (12.0%) |
| Bachelor's Degree or higher | 86 (89.6%) | 10 (10.4%) |
Occupancy by Age of Householder in Yankeetown
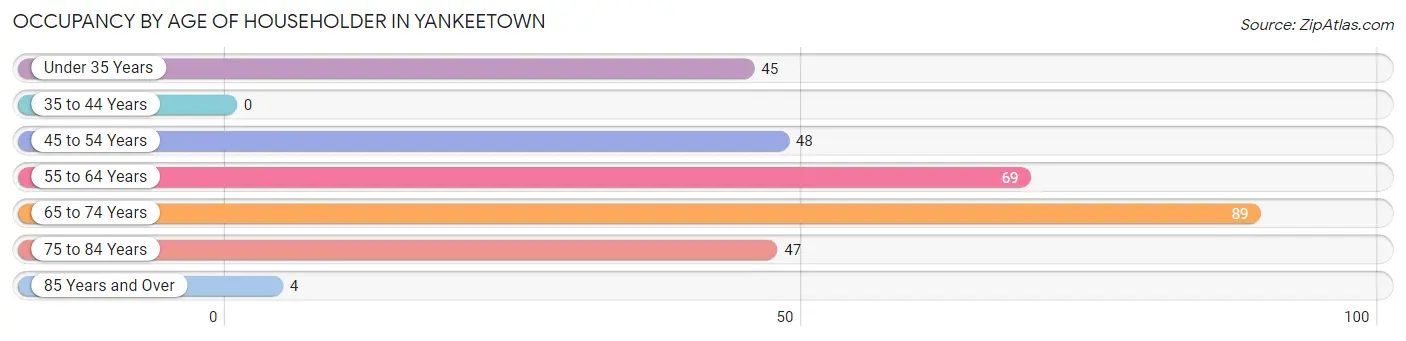
| Age Bracket | # Households | % Households |
| Under 35 Years | 45 | 14.9% |
| 35 to 44 Years | 0 | 0.0% |
| 45 to 54 Years | 48 | 15.9% |
| 55 to 64 Years | 69 | 22.9% |
| 65 to 74 Years | 89 | 29.5% |
| 75 to 84 Years | 47 | 15.6% |
| 85 Years and Over | 4 | 1.3% |
| Total | 302 | 100.0% |
Housing Finances in Yankeetown
Median Income by Occupancy in Yankeetown
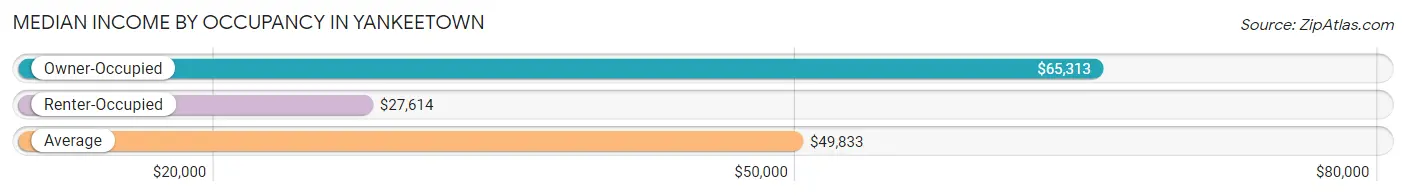
| Occupancy Type | # Households | Median Income |
| Owner-Occupied | 246 (81.5%) | $65,313 |
| Renter-Occupied | 56 (18.5%) | $27,614 |
| Average | 302 (100.0%) | $49,833 |
Occupancy by Householder Income Bracket in Yankeetown
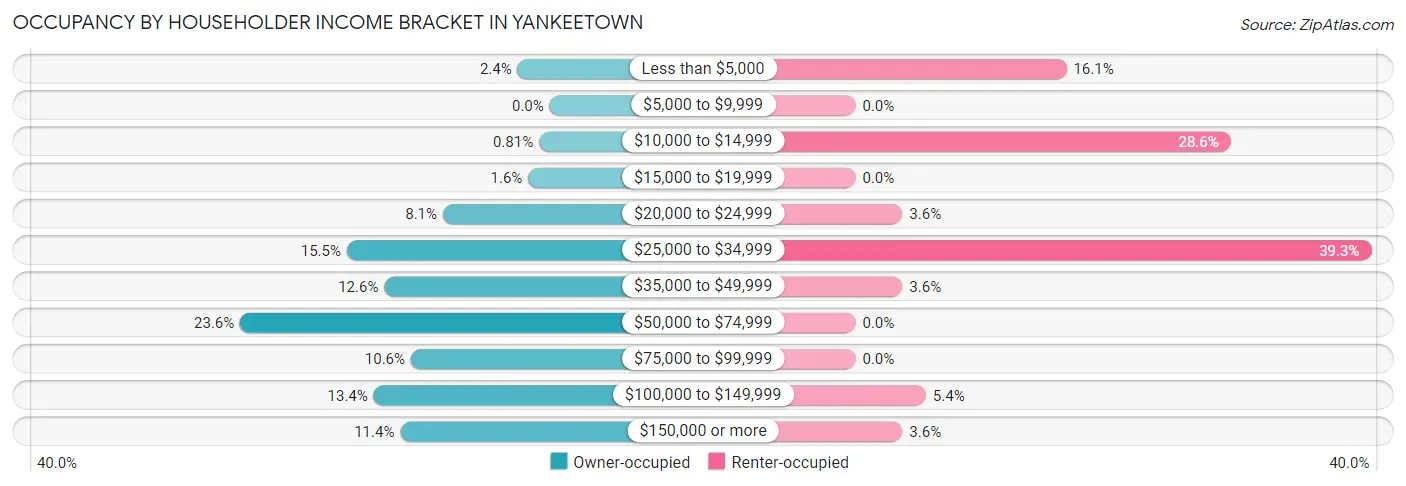
| Income Bracket | Owner-occupied | Renter-occupied |
| Less than $5,000 | 6 (2.4%) | 9 (16.1%) |
| $5,000 to $9,999 | 0 (0.0%) | 0 (0.0%) |
| $10,000 to $14,999 | 2 (0.8%) | 16 (28.6%) |
| $15,000 to $19,999 | 4 (1.6%) | 0 (0.0%) |
| $20,000 to $24,999 | 20 (8.1%) | 2 (3.6%) |
| $25,000 to $34,999 | 38 (15.4%) | 22 (39.3%) |
| $35,000 to $49,999 | 31 (12.6%) | 2 (3.6%) |
| $50,000 to $74,999 | 58 (23.6%) | 0 (0.0%) |
| $75,000 to $99,999 | 26 (10.6%) | 0 (0.0%) |
| $100,000 to $149,999 | 33 (13.4%) | 3 (5.4%) |
| $150,000 or more | 28 (11.4%) | 2 (3.6%) |
| Total | 246 (100.0%) | 56 (100.0%) |
Monthly Housing Cost Tiers in Yankeetown
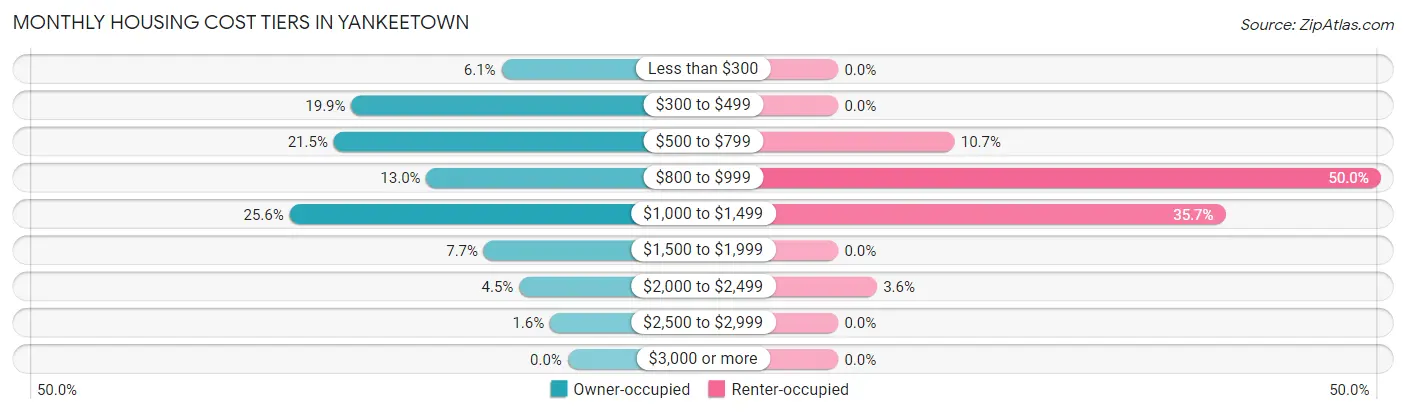
| Monthly Cost | Owner-occupied | Renter-occupied |
| Less than $300 | 15 (6.1%) | 0 (0.0%) |
| $300 to $499 | 49 (19.9%) | 0 (0.0%) |
| $500 to $799 | 53 (21.5%) | 6 (10.7%) |
| $800 to $999 | 32 (13.0%) | 28 (50.0%) |
| $1,000 to $1,499 | 63 (25.6%) | 20 (35.7%) |
| $1,500 to $1,999 | 19 (7.7%) | 0 (0.0%) |
| $2,000 to $2,499 | 11 (4.5%) | 2 (3.6%) |
| $2,500 to $2,999 | 4 (1.6%) | 0 (0.0%) |
| $3,000 or more | 0 (0.0%) | 0 (0.0%) |
| Total | 246 (100.0%) | 56 (100.0%) |
Physical Housing Characteristics in Yankeetown
Housing Structures in Yankeetown
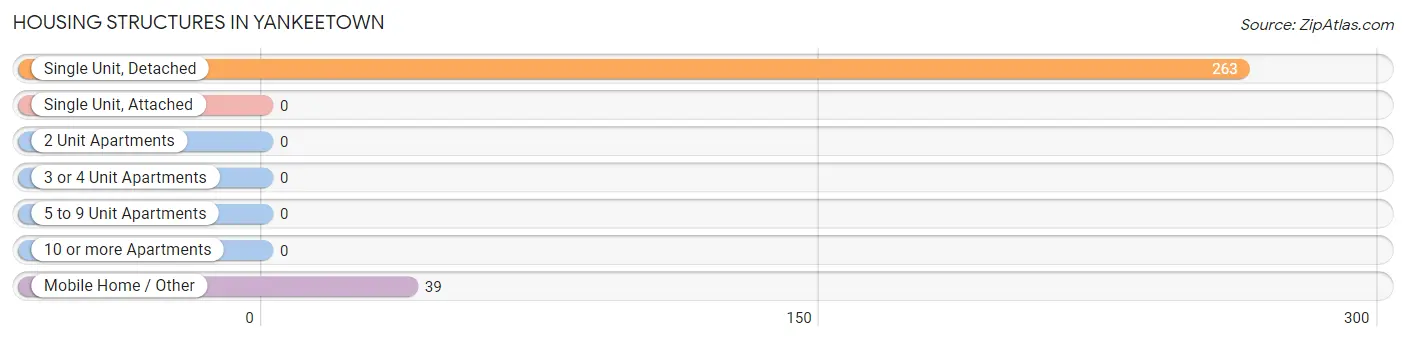
| Structure Type | # Housing Units | % Housing Units |
| Single Unit, Detached | 263 | 87.1% |
| Single Unit, Attached | 0 | 0.0% |
| 2 Unit Apartments | 0 | 0.0% |
| 3 or 4 Unit Apartments | 0 | 0.0% |
| 5 to 9 Unit Apartments | 0 | 0.0% |
| 10 or more Apartments | 0 | 0.0% |
| Mobile Home / Other | 39 | 12.9% |
| Total | 302 | 100.0% |
Housing Structures by Occupancy in Yankeetown
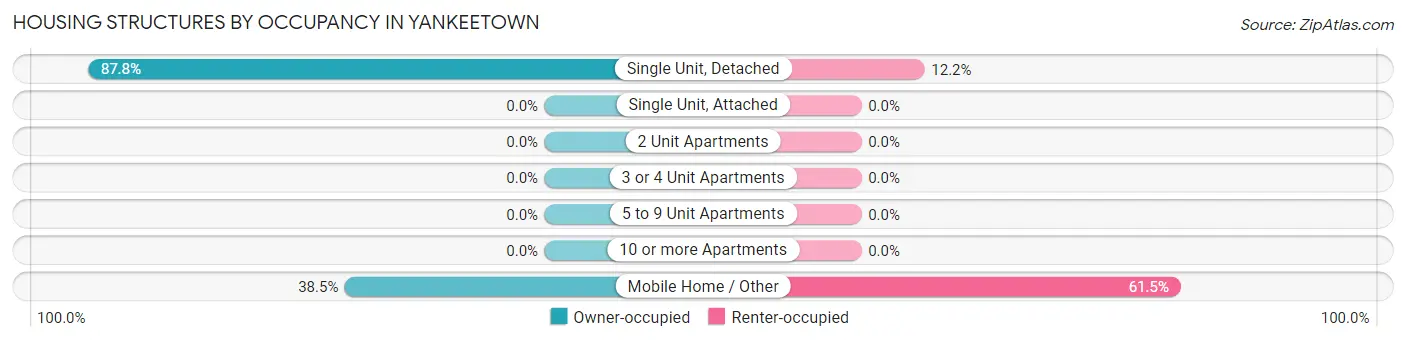
| Structure Type | Owner-occupied | Renter-occupied |
| Single Unit, Detached | 231 (87.8%) | 32 (12.2%) |
| Single Unit, Attached | 0 (0.0%) | 0 (0.0%) |
| 2 Unit Apartments | 0 (0.0%) | 0 (0.0%) |
| 3 or 4 Unit Apartments | 0 (0.0%) | 0 (0.0%) |
| 5 to 9 Unit Apartments | 0 (0.0%) | 0 (0.0%) |
| 10 or more Apartments | 0 (0.0%) | 0 (0.0%) |
| Mobile Home / Other | 15 (38.5%) | 24 (61.5%) |
| Total | 246 (81.5%) | 56 (18.5%) |
Housing Structures by Number of Rooms in Yankeetown
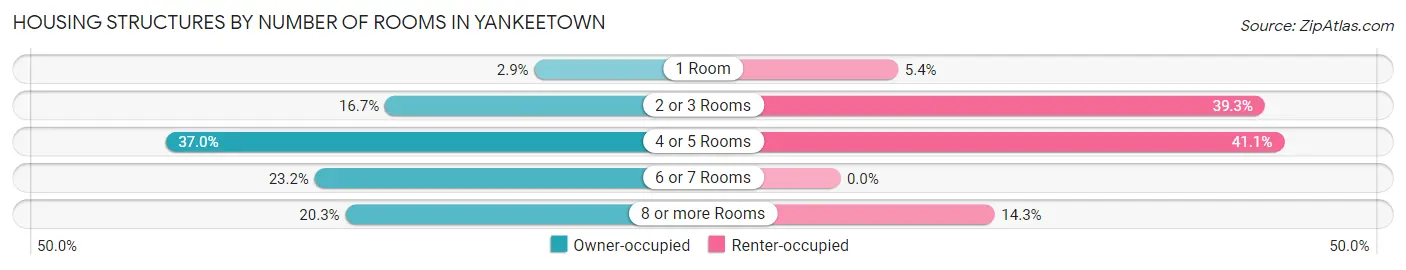
| Number of Rooms | Owner-occupied | Renter-occupied |
| 1 Room | 7 (2.9%) | 3 (5.4%) |
| 2 or 3 Rooms | 41 (16.7%) | 22 (39.3%) |
| 4 or 5 Rooms | 91 (37.0%) | 23 (41.1%) |
| 6 or 7 Rooms | 57 (23.2%) | 0 (0.0%) |
| 8 or more Rooms | 50 (20.3%) | 8 (14.3%) |
| Total | 246 (100.0%) | 56 (100.0%) |
Housing Structure by Heating Type in Yankeetown
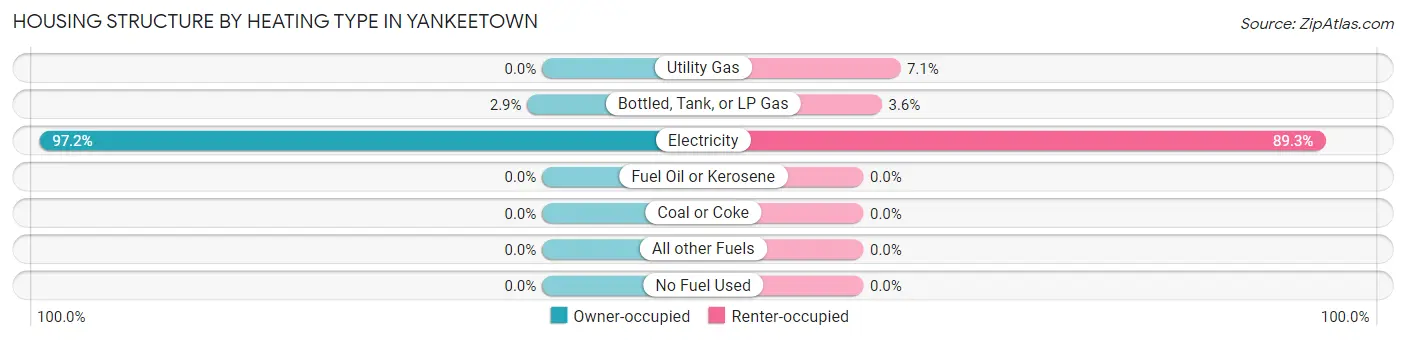
| Heating Type | Owner-occupied | Renter-occupied |
| Utility Gas | 0 (0.0%) | 4 (7.1%) |
| Bottled, Tank, or LP Gas | 7 (2.9%) | 2 (3.6%) |
| Electricity | 239 (97.2%) | 50 (89.3%) |
| Fuel Oil or Kerosene | 0 (0.0%) | 0 (0.0%) |
| Coal or Coke | 0 (0.0%) | 0 (0.0%) |
| All other Fuels | 0 (0.0%) | 0 (0.0%) |
| No Fuel Used | 0 (0.0%) | 0 (0.0%) |
| Total | 246 (100.0%) | 56 (100.0%) |
Household Vehicle Usage in Yankeetown
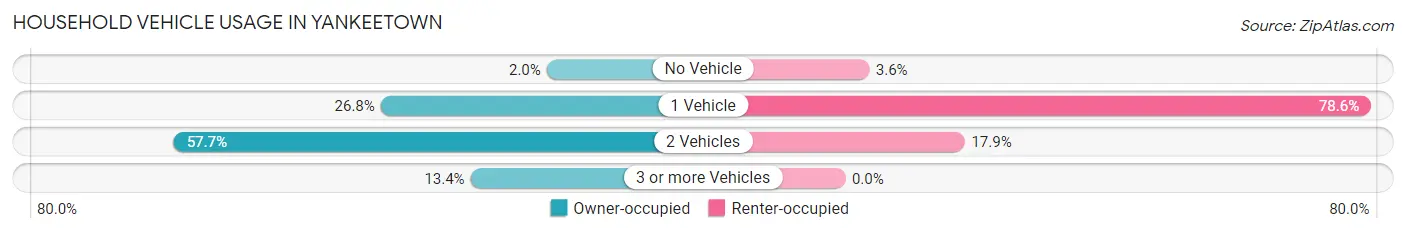
| Vehicles per Household | Owner-occupied | Renter-occupied |
| No Vehicle | 5 (2.0%) | 2 (3.6%) |
| 1 Vehicle | 66 (26.8%) | 44 (78.6%) |
| 2 Vehicles | 142 (57.7%) | 10 (17.9%) |
| 3 or more Vehicles | 33 (13.4%) | 0 (0.0%) |
| Total | 246 (100.0%) | 56 (100.0%) |
Real Estate & Mortgages in Yankeetown
Real Estate and Mortgage Overview in Yankeetown
| Characteristic | Without Mortgage | With Mortgage |
| Housing Units | 151 | 95 |
| Median Property Value | $326,600 | $201,300 |
| Median Household Income | $55,938 | $12 |
| Monthly Housing Costs | $548 | $0 |
| Real Estate Taxes | $2,534 | $0 |
Property Value by Mortgage Status in Yankeetown
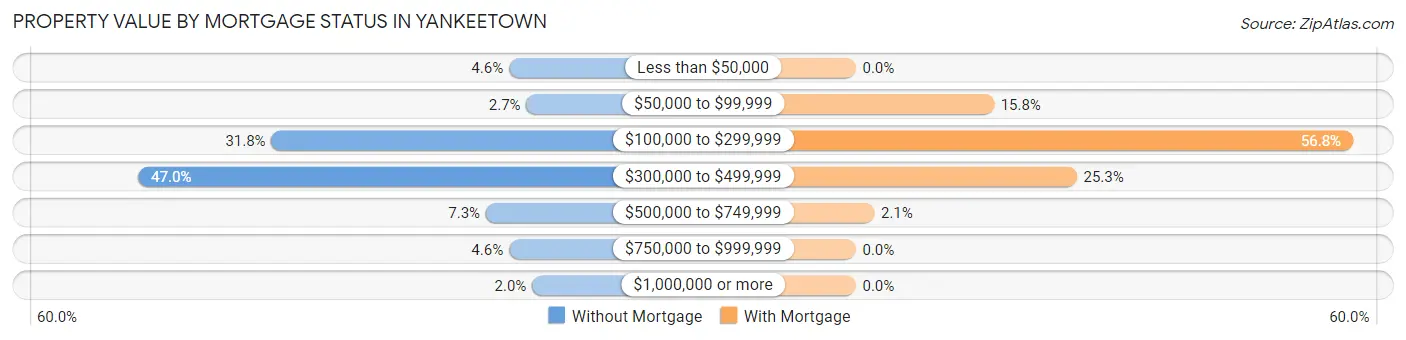
| Property Value | Without Mortgage | With Mortgage |
| Less than $50,000 | 7 (4.6%) | 0 (0.0%) |
| $50,000 to $99,999 | 4 (2.6%) | 15 (15.8%) |
| $100,000 to $299,999 | 48 (31.8%) | 54 (56.8%) |
| $300,000 to $499,999 | 71 (47.0%) | 24 (25.3%) |
| $500,000 to $749,999 | 11 (7.3%) | 2 (2.1%) |
| $750,000 to $999,999 | 7 (4.6%) | 0 (0.0%) |
| $1,000,000 or more | 3 (2.0%) | 0 (0.0%) |
| Total | 151 (100.0%) | 95 (100.0%) |
Household Income by Mortgage Status in Yankeetown
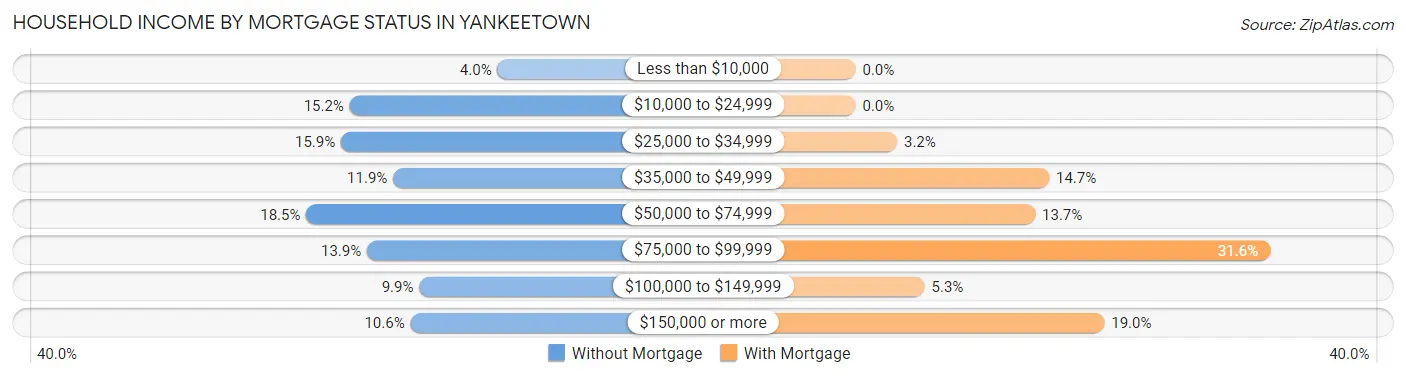
| Household Income | Without Mortgage | With Mortgage |
| Less than $10,000 | 6 (4.0%) | 0 (0.0%) |
| $10,000 to $24,999 | 23 (15.2%) | 0 (0.0%) |
| $25,000 to $34,999 | 24 (15.9%) | 3 (3.2%) |
| $35,000 to $49,999 | 18 (11.9%) | 14 (14.7%) |
| $50,000 to $74,999 | 28 (18.5%) | 13 (13.7%) |
| $75,000 to $99,999 | 21 (13.9%) | 30 (31.6%) |
| $100,000 to $149,999 | 15 (9.9%) | 5 (5.3%) |
| $150,000 or more | 16 (10.6%) | 18 (19.0%) |
| Total | 151 (100.0%) | 95 (100.0%) |
Property Value to Household Income Ratio in Yankeetown
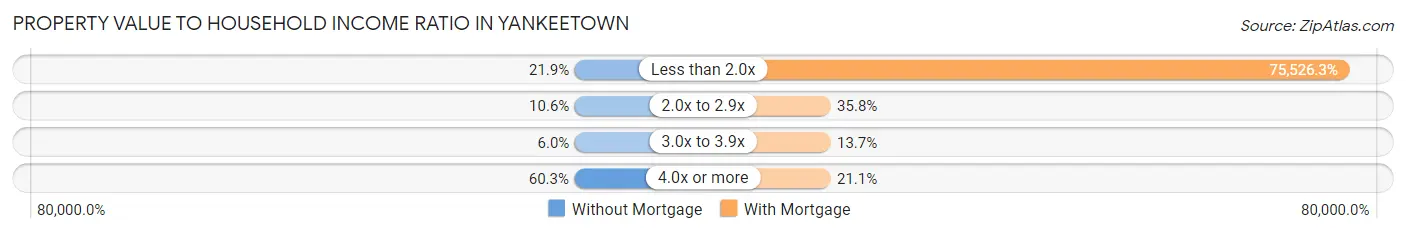
| Value-to-Income Ratio | Without Mortgage | With Mortgage |
| Less than 2.0x | 33 (21.8%) | 71,750 (75,526.3%) |
| 2.0x to 2.9x | 16 (10.6%) | 34 (35.8%) |
| 3.0x to 3.9x | 9 (6.0%) | 13 (13.7%) |
| 4.0x or more | 91 (60.3%) | 20 (21.0%) |
| Total | 151 (100.0%) | 95 (100.0%) |
Real Estate Taxes by Mortgage Status in Yankeetown
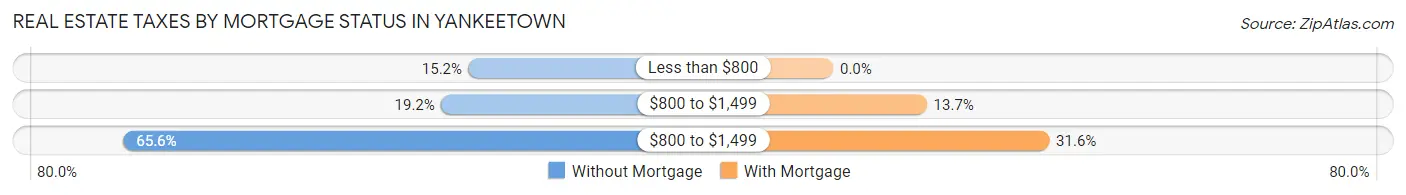
| Property Taxes | Without Mortgage | With Mortgage |
| Less than $800 | 23 (15.2%) | 0 (0.0%) |
| $800 to $1,499 | 29 (19.2%) | 13 (13.7%) |
| $800 to $1,499 | 99 (65.6%) | 30 (31.6%) |
| Total | 151 (100.0%) | 95 (100.0%) |
Health & Disability in Yankeetown
Health Insurance Coverage by Age in Yankeetown
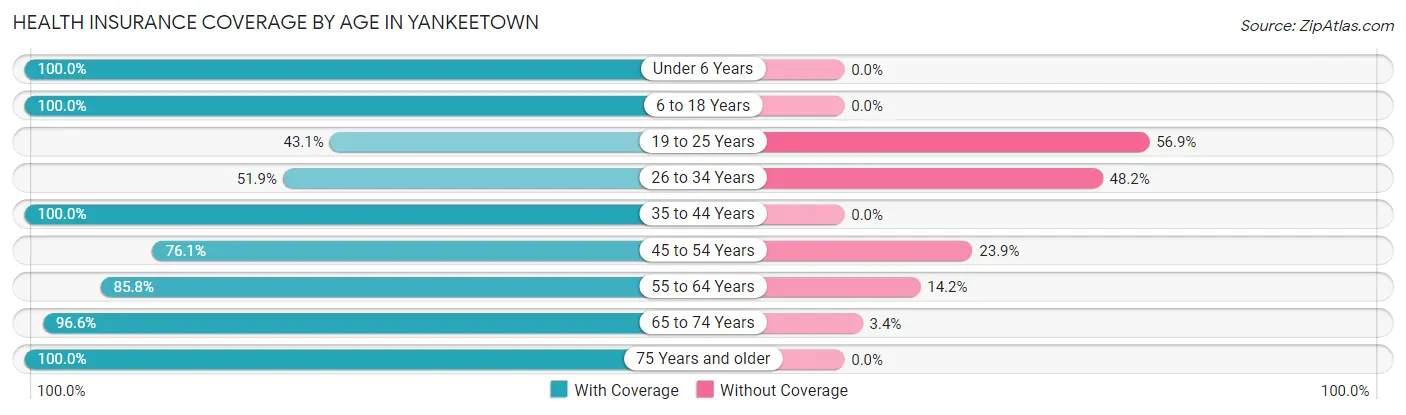
| Age Bracket | With Coverage | Without Coverage |
| Under 6 Years | 47 (100.0%) | 0 (0.0%) |
| 6 to 18 Years | 78 (100.0%) | 0 (0.0%) |
| 19 to 25 Years | 22 (43.1%) | 29 (56.9%) |
| 26 to 34 Years | 14 (51.8%) | 13 (48.1%) |
| 35 to 44 Years | 16 (100.0%) | 0 (0.0%) |
| 45 to 54 Years | 51 (76.1%) | 16 (23.9%) |
| 55 to 64 Years | 109 (85.8%) | 18 (14.2%) |
| 65 to 74 Years | 141 (96.6%) | 5 (3.4%) |
| 75 Years and older | 70 (100.0%) | 0 (0.0%) |
| Total | 548 (87.1%) | 81 (12.9%) |
Health Insurance Coverage by Citizenship Status in Yankeetown
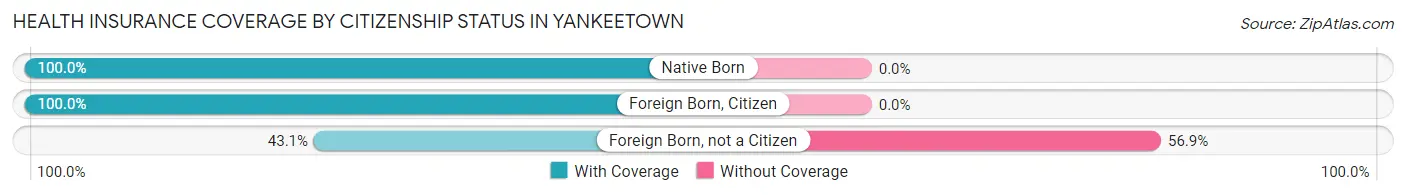
| Citizenship Status | With Coverage | Without Coverage |
| Native Born | 47 (100.0%) | 0 (0.0%) |
| Foreign Born, Citizen | 78 (100.0%) | 0 (0.0%) |
| Foreign Born, not a Citizen | 22 (43.1%) | 29 (56.9%) |
Health Insurance Coverage by Household Income in Yankeetown
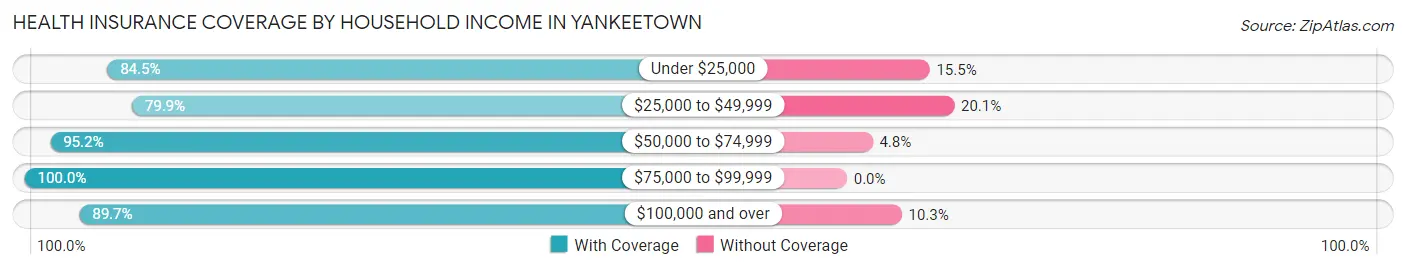
| Household Income | With Coverage | Without Coverage |
| Under $25,000 | 120 (84.5%) | 22 (15.5%) |
| $25,000 to $49,999 | 167 (79.9%) | 42 (20.1%) |
| $50,000 to $74,999 | 99 (95.2%) | 5 (4.8%) |
| $75,000 to $99,999 | 54 (100.0%) | 0 (0.0%) |
| $100,000 and over | 105 (89.7%) | 12 (10.3%) |
Public vs Private Health Insurance Coverage by Age in Yankeetown
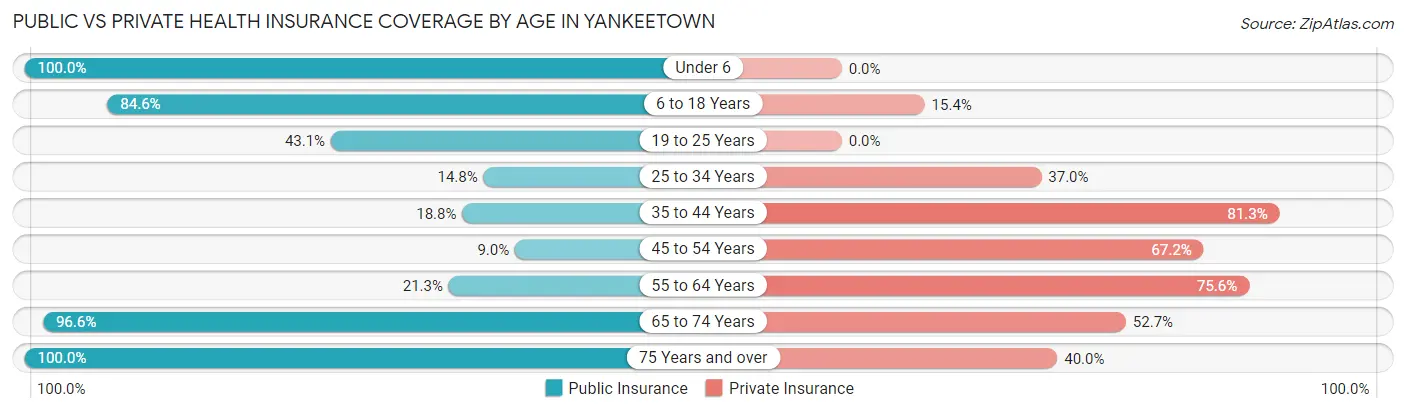
| Age Bracket | Public Insurance | Private Insurance |
| Under 6 | 47 (100.0%) | 0 (0.0%) |
| 6 to 18 Years | 66 (84.6%) | 12 (15.4%) |
| 19 to 25 Years | 22 (43.1%) | 0 (0.0%) |
| 25 to 34 Years | 4 (14.8%) | 10 (37.0%) |
| 35 to 44 Years | 3 (18.8%) | 13 (81.2%) |
| 45 to 54 Years | 6 (9.0%) | 45 (67.2%) |
| 55 to 64 Years | 27 (21.3%) | 96 (75.6%) |
| 65 to 74 Years | 141 (96.6%) | 77 (52.7%) |
| 75 Years and over | 70 (100.0%) | 28 (40.0%) |
| Total | 386 (61.4%) | 281 (44.7%) |
Disability Status by Sex by Age in Yankeetown
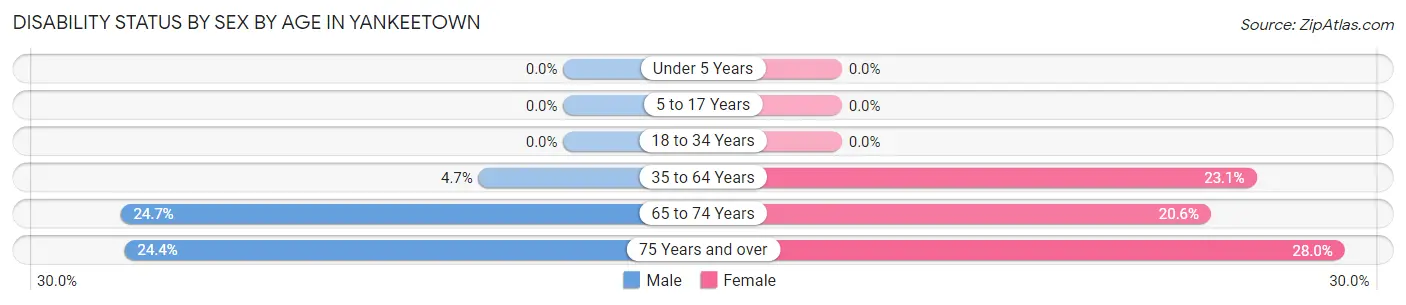
| Age Bracket | Male | Female |
| Under 5 Years | 0 (0.0%) | 0 (0.0%) |
| 5 to 17 Years | 0 (0.0%) | 0 (0.0%) |
| 18 to 34 Years | 0 (0.0%) | 0 (0.0%) |
| 35 to 64 Years | 5 (4.7%) | 24 (23.1%) |
| 65 to 74 Years | 18 (24.7%) | 15 (20.5%) |
| 75 Years and over | 11 (24.4%) | 7 (28.0%) |
Disability Class by Sex by Age in Yankeetown
Disability Class: Hearing Difficulty
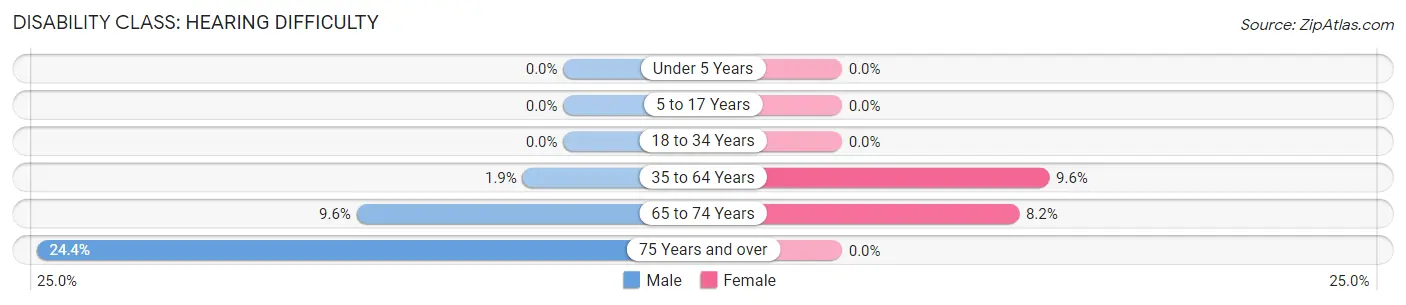
| Age Bracket | Male | Female |
| Under 5 Years | 0 (0.0%) | 0 (0.0%) |
| 5 to 17 Years | 0 (0.0%) | 0 (0.0%) |
| 18 to 34 Years | 0 (0.0%) | 0 (0.0%) |
| 35 to 64 Years | 2 (1.9%) | 10 (9.6%) |
| 65 to 74 Years | 7 (9.6%) | 6 (8.2%) |
| 75 Years and over | 11 (24.4%) | 0 (0.0%) |
Disability Class: Vision Difficulty
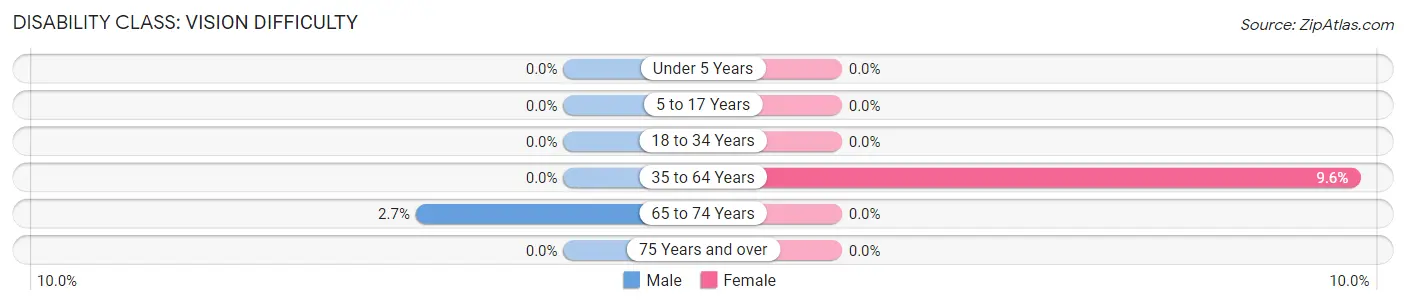
| Age Bracket | Male | Female |
| Under 5 Years | 0 (0.0%) | 0 (0.0%) |
| 5 to 17 Years | 0 (0.0%) | 0 (0.0%) |
| 18 to 34 Years | 0 (0.0%) | 0 (0.0%) |
| 35 to 64 Years | 0 (0.0%) | 10 (9.6%) |
| 65 to 74 Years | 2 (2.7%) | 0 (0.0%) |
| 75 Years and over | 0 (0.0%) | 0 (0.0%) |
Disability Class: Cognitive Difficulty
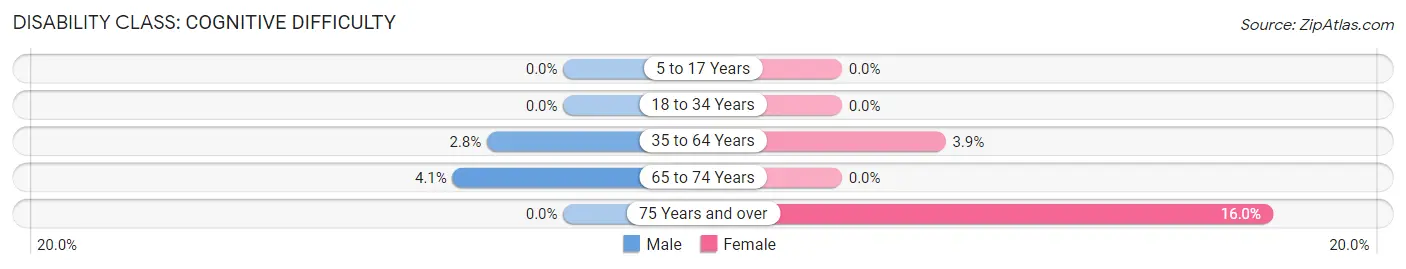
| Age Bracket | Male | Female |
| 5 to 17 Years | 0 (0.0%) | 0 (0.0%) |
| 18 to 34 Years | 0 (0.0%) | 0 (0.0%) |
| 35 to 64 Years | 3 (2.8%) | 4 (3.8%) |
| 65 to 74 Years | 3 (4.1%) | 0 (0.0%) |
| 75 Years and over | 0 (0.0%) | 4 (16.0%) |
Disability Class: Ambulatory Difficulty
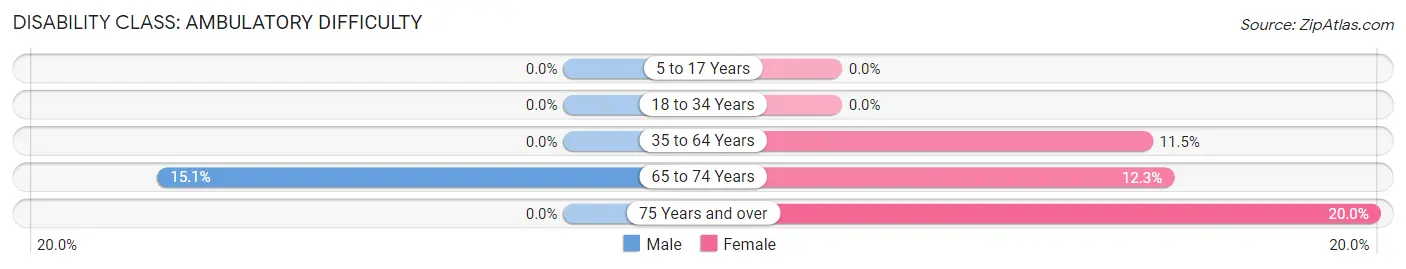
| Age Bracket | Male | Female |
| 5 to 17 Years | 0 (0.0%) | 0 (0.0%) |
| 18 to 34 Years | 0 (0.0%) | 0 (0.0%) |
| 35 to 64 Years | 0 (0.0%) | 12 (11.5%) |
| 65 to 74 Years | 11 (15.1%) | 9 (12.3%) |
| 75 Years and over | 0 (0.0%) | 5 (20.0%) |
Disability Class: Self-Care Difficulty
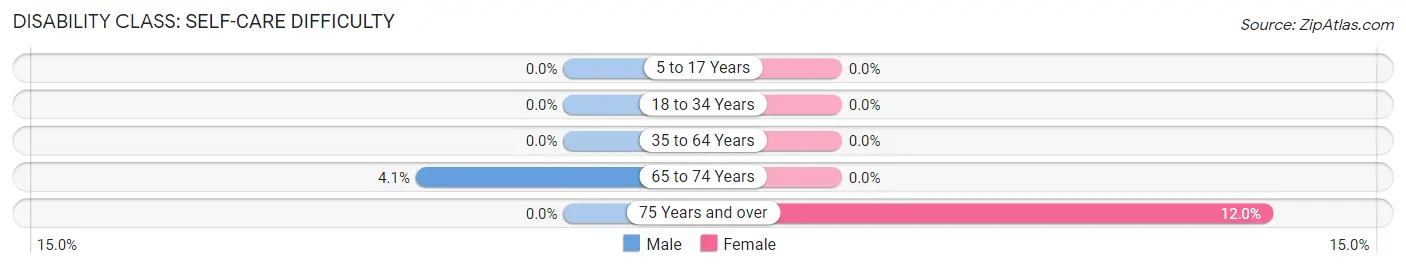
| Age Bracket | Male | Female |
| 5 to 17 Years | 0 (0.0%) | 0 (0.0%) |
| 18 to 34 Years | 0 (0.0%) | 0 (0.0%) |
| 35 to 64 Years | 0 (0.0%) | 0 (0.0%) |
| 65 to 74 Years | 3 (4.1%) | 0 (0.0%) |
| 75 Years and over | 0 (0.0%) | 3 (12.0%) |
Technology Access in Yankeetown
Computing Device Access in Yankeetown
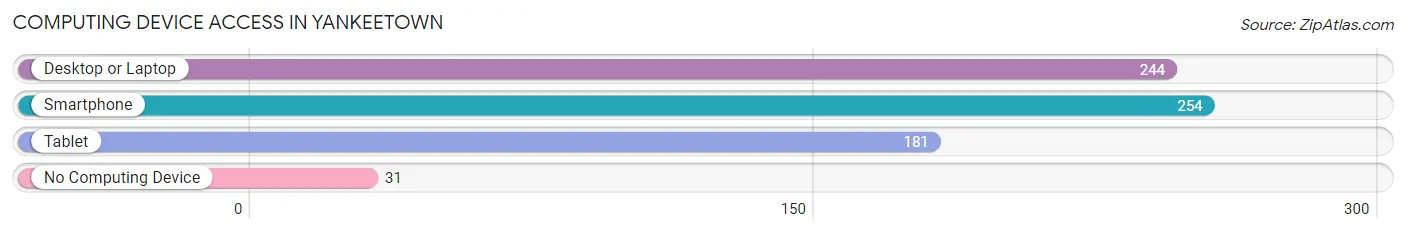
| Device Type | # Households | % Households |
| Desktop or Laptop | 244 | 80.8% |
| Smartphone | 254 | 84.1% |
| Tablet | 181 | 59.9% |
| No Computing Device | 31 | 10.3% |
| Total | 302 | 100.0% |
Internet Access in Yankeetown
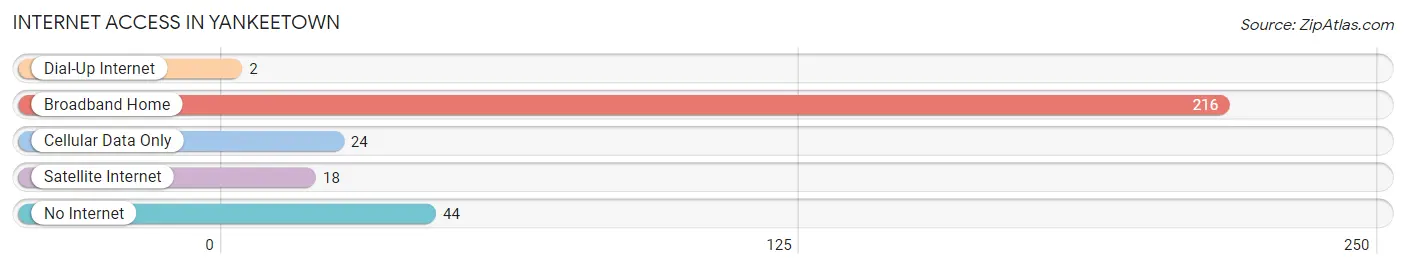
| Internet Type | # Households | % Households |
| Dial-Up Internet | 2 | 0.7% |
| Broadband Home | 216 | 71.5% |
| Cellular Data Only | 24 | 8.0% |
| Satellite Internet | 18 | 6.0% |
| No Internet | 44 | 14.6% |
| Total | 302 | 100.0% |
Yankeetown Summary
Yankeetown is a small town located in Levy County, Florida, United States. It is situated on the banks of the Withlacoochee River, about 25 miles (40 km) southwest of Ocala. The town was founded in the late 19th century by a group of settlers from the North, hence its name. As of the 2010 census, the population of Yankeetown was 554.
History
Yankeetown was founded in 1883 by a group of settlers from the North, hence its name. The town was originally known as "Yankeetown Landing" and was a popular stop for steamboats traveling up and down the Withlacoochee River. The town was incorporated in 1925 and was the first incorporated town in Levy County.
In the early 20th century, Yankeetown was a thriving port town, with a bustling economy based on the lumber and fishing industries. The town was also home to a number of businesses, including a hotel, a general store, a post office, and a sawmill.
In the 1950s, the town began to decline as the lumber and fishing industries moved away. The town was further impacted by the construction of the Cross Florida Barge Canal, which diverted the flow of the Withlacoochee River away from Yankeetown.
Geography
Yankeetown is located in Levy County, Florida, on the banks of the Withlacoochee River. The town is situated about 25 miles (40 km) southwest of Ocala and about 50 miles (80 km) northwest of Tampa.
The town has a total area of 0.7 square miles (1.8 km2), all of which is land. The town is located in a flat, low-lying area, with the highest elevation being just 10 feet (3 m) above sea level.
Economy
Yankeetown's economy is largely based on tourism and fishing. The town is home to a number of marinas, boat ramps, and fishing charters, which attract visitors from all over the state. The town is also home to a number of restaurants, shops, and other businesses.
The town is also home to a number of manufacturing and industrial businesses, including a wood-products plant and a concrete plant.
Demographics
As of the 2010 census, there were 554 people, 230 households, and 149 families residing in the town. The population density was 790.3 people per square mile (305.3/km2). There were 259 housing units at an average density of 369.3 per square mile (142.7/km2). The racial makeup of the town was 97.3% White, 0.7% African American, 0.2% Native American, 0.2% Asian, 0.2% from other races, and 1.5% from two or more races. Hispanic or Latino of any race were 1.5% of the population.
There were 230 households, out of which 24.3% had children under the age of 18 living with them, 48.7% were married couples living together, 11.3% had a female householder with no husband present, and 34.8% were non-families. 29.1% of all households were made up of individuals, and 14.3% had someone living alone who was 65 years of age or older. The average household size was 2.41 and the average family size was 2.94.
In the town, the population was spread out, with 22.2% under the age of 18, 6.7% from 18 to 24, 24.3% from 25 to 44, 28.2% from 45 to 64, and 18.6% who were 65 years of age or older. The median age was 43 years. For every 100 females, there were 97.3 males. For every 100 females age 18 and over, there were 94.3 males.
The median income for a household in the town was $30,000, and the median income for a family was $35,000. Males had a median income of $30,000 versus $20,000 for females. The per capita income for the town was $15,000. About 10.7% of families and 14.3% of the population were below the poverty line, including 18.2% of those under age 18 and 8.3% of those age 65 or over.
Common Questions
What is Per Capita Income in Yankeetown?
Per Capita income in Yankeetown is $34,819.
What is the Median Family Income in Yankeetown?
Median Family Income in Yankeetown is $52,500.
What is the Median Household income in Yankeetown?
Median Household Income in Yankeetown is $49,833.
What is Family Income Deficit in Yankeetown?
Family Income Deficit in Yankeetown is $23,490.
Families that are below poverty line in Yankeetown earn $23,490 less on average than the poverty threshold level.
What is Inequality or Gini Index in Yankeetown?
Inequality or Gini Index in Yankeetown is 0.48.
What is the Total Population of Yankeetown?
Total Population of Yankeetown is 629.
What is the Total Male Population of Yankeetown?
Total Male Population of Yankeetown is 326.
What is the Total Female Population of Yankeetown?
Total Female Population of Yankeetown is 303.
What is the Ratio of Males per 100 Females in Yankeetown?
There are 107.59 Males per 100 Females in Yankeetown.
What is the Ratio of Females per 100 Males in Yankeetown?
There are 92.94 Females per 100 Males in Yankeetown.
What is the Median Population Age in Yankeetown?
Median Population Age in Yankeetown is 60.1 Years.
What is the Average Family Size in Yankeetown
Average Family Size in Yankeetown is 2.3 People.
What is the Average Household Size in Yankeetown
Average Household Size in Yankeetown is 2.1 People.
How Large is the Labor Force in Yankeetown?
There are 172 People in the Labor Forcein in Yankeetown.
What is the Percentage of People in the Labor Force in Yankeetown?
33.5% of People are in the Labor Force in Yankeetown.
What is the Unemployment Rate in Yankeetown?
Unemployment Rate in Yankeetown is 9.3%.