Newberry, FL Map & Demographics
Newberry Map
Newberry Overview
$30,935
PER CAPITA INCOME
$106,154
AVG FAMILY INCOME
$90,547
AVG HOUSEHOLD INCOME
22.2%
WAGE / INCOME GAP [ % ]
77.8¢/ $1
WAGE / INCOME GAP [ $ ]
0.35
INEQUALITY / GINI INDEX
7,401
TOTAL POPULATION
3,836
MALE POPULATION
3,565
FEMALE POPULATION
107.60
MALES / 100 FEMALES
92.94
FEMALES / 100 MALES
33.0
MEDIAN AGE
3.4
AVG FAMILY SIZE
2.8
AVG HOUSEHOLD SIZE
3,578
LABOR FORCE [ PEOPLE ]
64.0%
PERCENT IN LABOR FORCE
5.4%
UNEMPLOYMENT RATE
Newberry Zip Codes
Newberry Area Codes
Income in Newberry
Income Overview in Newberry
Per Capita Income in Newberry is $30,935, while median incomes of families and households are $106,154 and $90,547 respectively.
| Characteristic | Number | Measure |
| Per Capita Income | 7,401 | $30,935 |
| Median Family Income | 1,824 | $106,154 |
| Mean Family Income | 1,824 | $103,088 |
| Median Household Income | 2,649 | $90,547 |
| Mean Household Income | 2,649 | $84,857 |
| Income Deficit | 1,824 | $0 |
| Wage / Income Gap (%) | 7,401 | 22.20% |
| Wage / Income Gap ($) | 7,401 | 77.80¢ per $1 |
| Gini / Inequality Index | 7,401 | 0.35 |
Earnings by Sex in Newberry
Average Earnings in Newberry are $46,988, $50,637 for men and $39,397 for women, a difference of 22.2%.
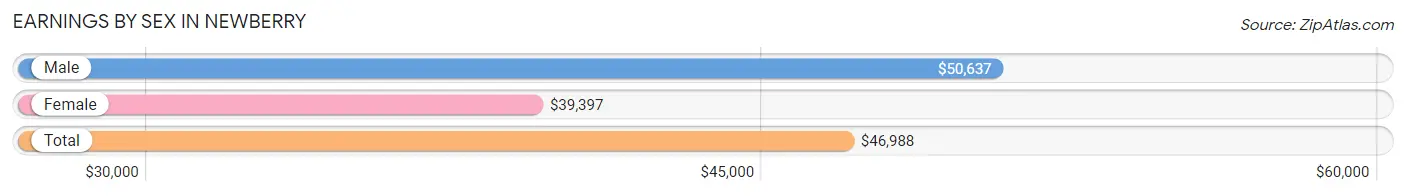
| Sex | Number | Average Earnings |
| Male | 2,054 (54.8%) | $50,637 |
| Female | 1,696 (45.2%) | $39,397 |
| Total | 3,750 (100.0%) | $46,988 |
Earnings by Sex by Income Bracket in Newberry
The most common earnings brackets in Newberry are $75,000 to $99,999 for men (290 | 14.1%) and $55,000 to $64,999 for women (223 | 13.2%).
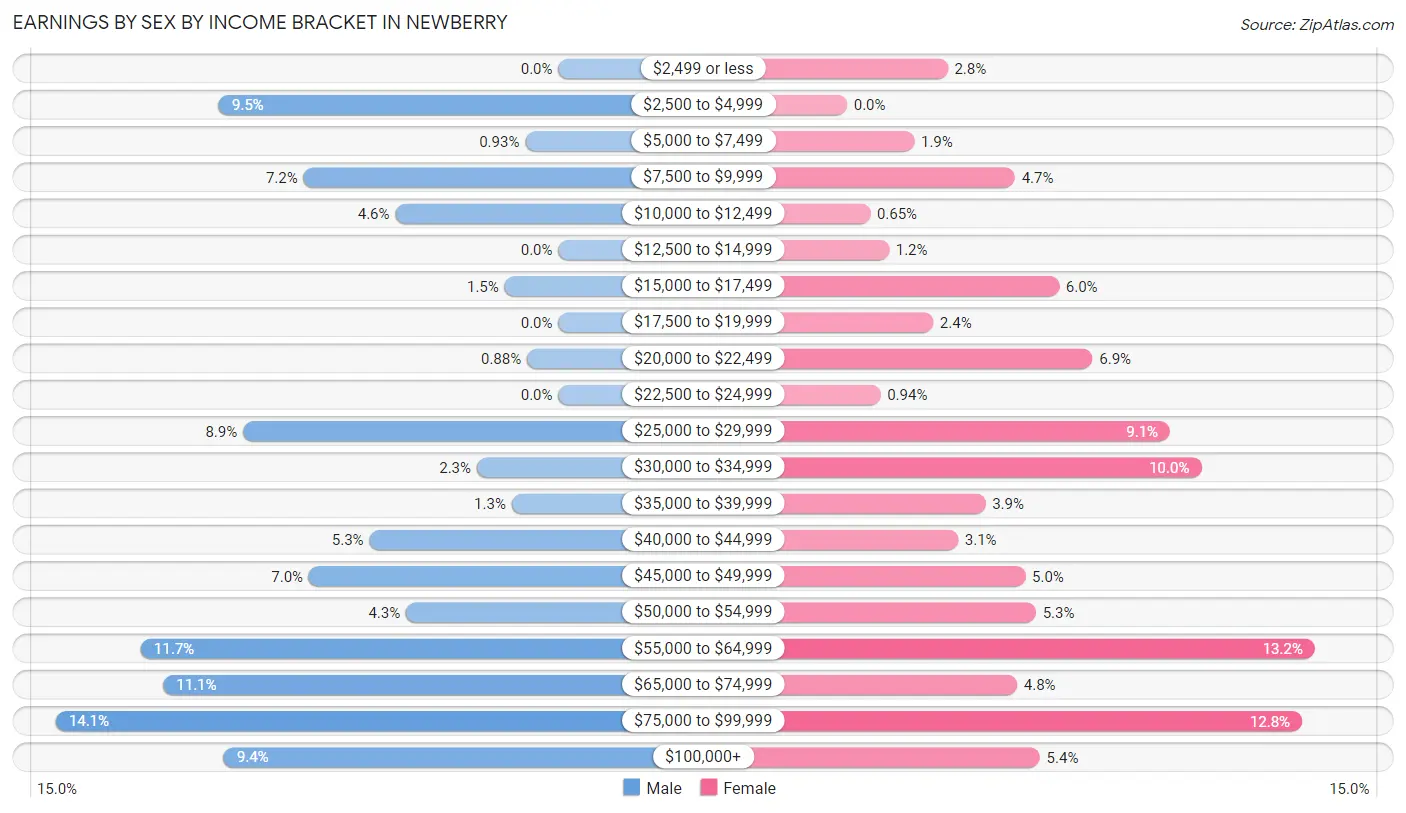
| Income | Male | Female |
| $2,499 or less | 0 (0.0%) | 48 (2.8%) |
| $2,500 to $4,999 | 196 (9.5%) | 0 (0.0%) |
| $5,000 to $7,499 | 19 (0.9%) | 32 (1.9%) |
| $7,500 to $9,999 | 147 (7.2%) | 80 (4.7%) |
| $10,000 to $12,499 | 94 (4.6%) | 11 (0.6%) |
| $12,500 to $14,999 | 0 (0.0%) | 20 (1.2%) |
| $15,000 to $17,499 | 31 (1.5%) | 101 (6.0%) |
| $17,500 to $19,999 | 0 (0.0%) | 41 (2.4%) |
| $20,000 to $22,499 | 18 (0.9%) | 117 (6.9%) |
| $22,500 to $24,999 | 0 (0.0%) | 16 (0.9%) |
| $25,000 to $29,999 | 182 (8.9%) | 154 (9.1%) |
| $30,000 to $34,999 | 47 (2.3%) | 169 (10.0%) |
| $35,000 to $39,999 | 27 (1.3%) | 66 (3.9%) |
| $40,000 to $44,999 | 109 (5.3%) | 53 (3.1%) |
| $45,000 to $49,999 | 144 (7.0%) | 85 (5.0%) |
| $50,000 to $54,999 | 88 (4.3%) | 90 (5.3%) |
| $55,000 to $64,999 | 241 (11.7%) | 223 (13.2%) |
| $65,000 to $74,999 | 228 (11.1%) | 81 (4.8%) |
| $75,000 to $99,999 | 290 (14.1%) | 217 (12.8%) |
| $100,000+ | 193 (9.4%) | 92 (5.4%) |
| Total | 2,054 (100.0%) | 1,696 (100.0%) |
Earnings by Sex by Educational Attainment in Newberry
Average earnings in Newberry are $56,490 for men and $46,866 for women, a difference of 17.0%. Men with an educational attainment of graduate degree enjoy the highest average annual earnings of $115,265, while those with high school diploma education earn the least with $40,096. Women with an educational attainment of graduate degree earn the most with the average annual earnings of $81,607, while those with college or associate's degree education have the smallest earnings of $33,198.
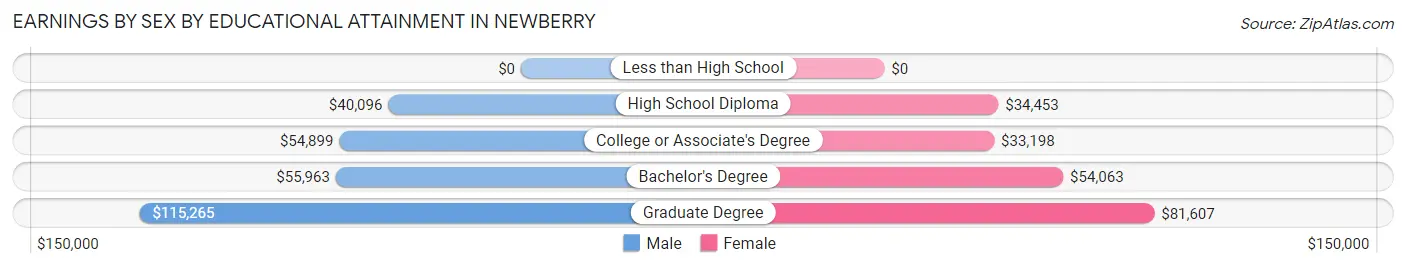
| Educational Attainment | Male Income | Female Income |
| Less than High School | - | - |
| High School Diploma | $40,096 | $34,453 |
| College or Associate's Degree | $54,899 | $33,198 |
| Bachelor's Degree | $55,963 | $54,063 |
| Graduate Degree | $115,265 | $81,607 |
| Total | $56,490 | $46,866 |
Family Income in Newberry
Family Income Brackets in Newberry
According to the Newberry family income data, there are 700 families falling into the $100,000 to $149,999 income range, which is the most common income bracket and makes up 38.4% of all families.
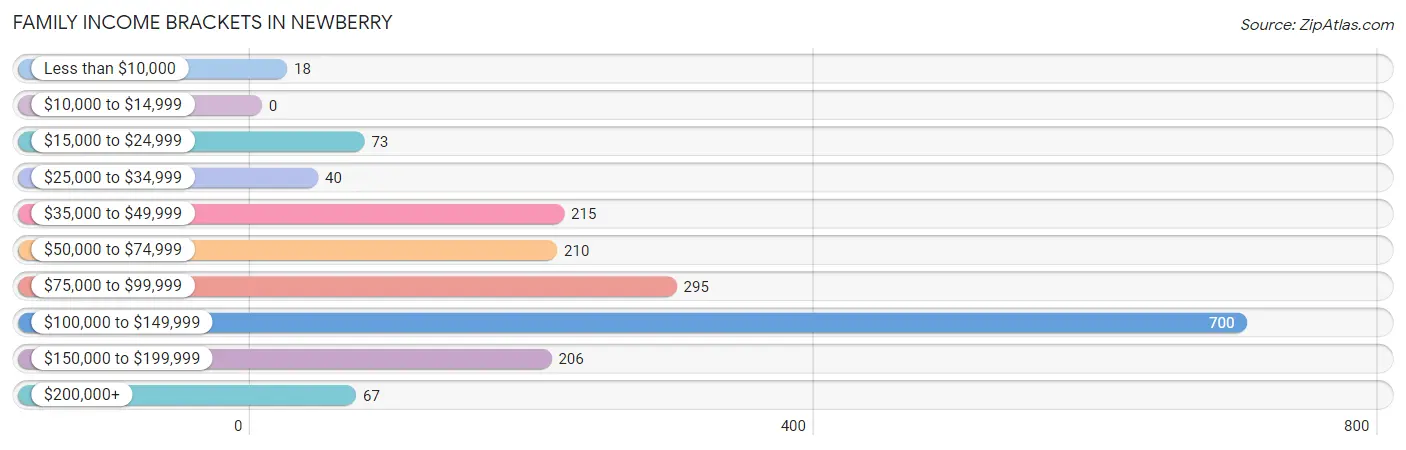
| Income Bracket | # Families | % Families |
| Less than $10,000 | 18 | 1.0% |
| $10,000 to $14,999 | 0 | 0.0% |
| $15,000 to $24,999 | 73 | 4.0% |
| $25,000 to $34,999 | 40 | 2.2% |
| $35,000 to $49,999 | 215 | 11.8% |
| $50,000 to $74,999 | 210 | 11.5% |
| $75,000 to $99,999 | 295 | 16.2% |
| $100,000 to $149,999 | 700 | 38.4% |
| $150,000 to $199,999 | 206 | 11.3% |
| $200,000+ | 67 | 3.7% |
Family Income by Famaliy Size in Newberry
6-person families (105 | 5.8%) account for the highest median family income in Newberry with $155,417 per family, while 2-person families (783 | 42.9%) have the highest median income of $54,334 per family member.
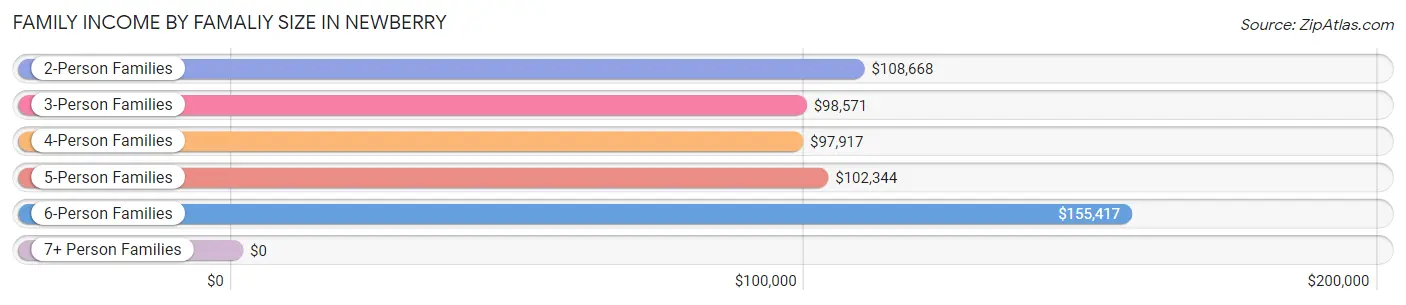
| Income Bracket | # Families | Median Income |
| 2-Person Families | 783 (42.9%) | $108,668 |
| 3-Person Families | 244 (13.4%) | $98,571 |
| 4-Person Families | 569 (31.2%) | $97,917 |
| 5-Person Families | 123 (6.7%) | $102,344 |
| 6-Person Families | 105 (5.8%) | $155,417 |
| 7+ Person Families | 0 (0.0%) | $0 |
| Total | 1,824 (100.0%) | $106,154 |
Family Income by Number of Earners in Newberry
The median family income in Newberry is $106,154, with families comprising 3+ earners (105) having the highest median family income of $118,375, while families with no earners (207) have the lowest median family income of $65,156, accounting for 5.8% and 11.4% of families, respectively.
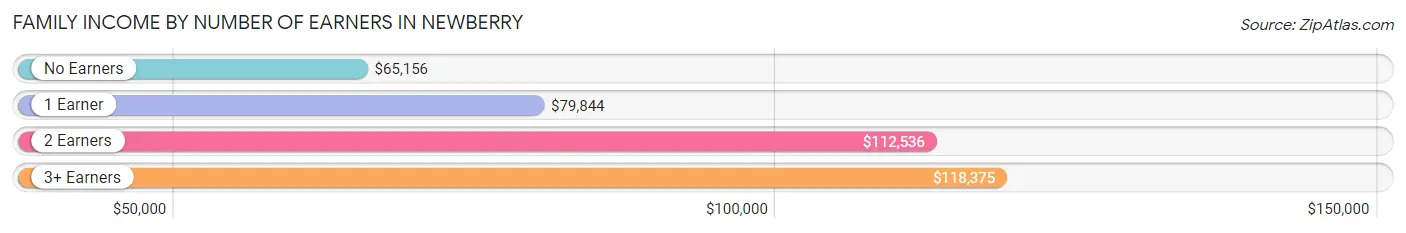
| Number of Earners | # Families | Median Income |
| No Earners | 207 (11.4%) | $65,156 |
| 1 Earner | 281 (15.4%) | $79,844 |
| 2 Earners | 1,231 (67.5%) | $112,536 |
| 3+ Earners | 105 (5.8%) | $118,375 |
| Total | 1,824 (100.0%) | $106,154 |
Household Income in Newberry
Household Income Brackets in Newberry
With 760 households falling in the category, the $100,000 to $149,999 income range is the most frequent in Newberry, accounting for 28.7% of all households. In contrast, only 53 households (2.0%) fall into the $10,000 to $14,999 income bracket, making it the least populous group.
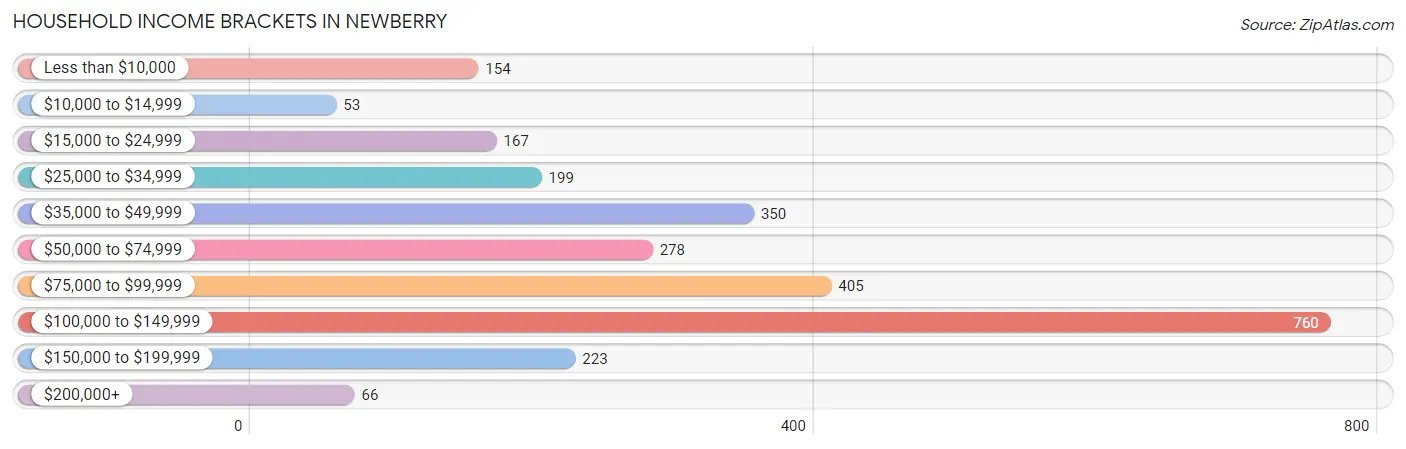
| Income Bracket | # Households | % Households |
| Less than $10,000 | 154 | 5.8% |
| $10,000 to $14,999 | 53 | 2.0% |
| $15,000 to $24,999 | 167 | 6.3% |
| $25,000 to $34,999 | 199 | 7.5% |
| $35,000 to $49,999 | 350 | 13.2% |
| $50,000 to $74,999 | 278 | 10.5% |
| $75,000 to $99,999 | 405 | 15.3% |
| $100,000 to $149,999 | 760 | 28.7% |
| $150,000 to $199,999 | 223 | 8.4% |
| $200,000+ | 66 | 2.5% |
Household Income by Householder Age in Newberry
The median household income in Newberry is $90,547, with the highest median household income of $106,250 found in the 25 to 44 years age bracket for the primary householder. A total of 1,107 households (41.8%) fall into this category.
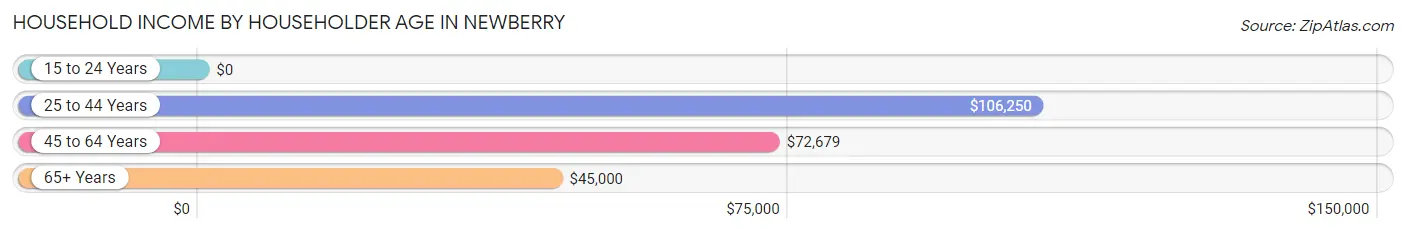
| Income Bracket | # Households | Median Income |
| 15 to 24 Years | 0 (0.0%) | $0 |
| 25 to 44 Years | 1,107 (41.8%) | $106,250 |
| 45 to 64 Years | 964 (36.4%) | $72,679 |
| 65+ Years | 578 (21.8%) | $45,000 |
| Total | 2,649 (100.0%) | $90,547 |
Poverty in Newberry
Income Below Poverty by Sex and Age in Newberry
With 13.6% poverty level for males and 11.5% for females among the residents of Newberry, 18 to 24 year old males and 12 to 14 year old females are the most vulnerable to poverty, with 309 males (63.7%) and 127 females (49.2%) in their respective age groups living below the poverty level.
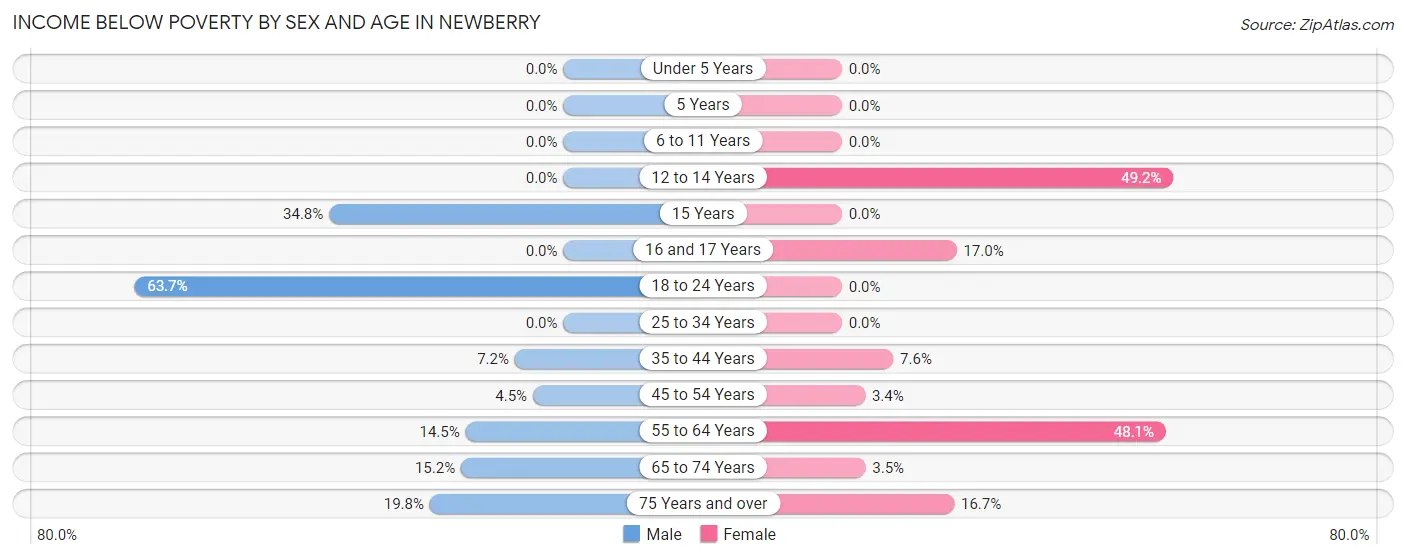
| Age Bracket | Male | Female |
| Under 5 Years | 0 (0.0%) | 0 (0.0%) |
| 5 Years | 0 (0.0%) | 0 (0.0%) |
| 6 to 11 Years | 0 (0.0%) | 0 (0.0%) |
| 12 to 14 Years | 0 (0.0%) | 127 (49.2%) |
| 15 Years | 16 (34.8%) | 0 (0.0%) |
| 16 and 17 Years | 0 (0.0%) | 39 (17.0%) |
| 18 to 24 Years | 309 (63.7%) | 0 (0.0%) |
| 25 to 34 Years | 0 (0.0%) | 0 (0.0%) |
| 35 to 44 Years | 37 (7.2%) | 39 (7.6%) |
| 45 to 54 Years | 15 (4.5%) | 18 (3.4%) |
| 55 to 64 Years | 72 (14.5%) | 154 (48.1%) |
| 65 to 74 Years | 38 (15.2%) | 14 (3.5%) |
| 75 Years and over | 24 (19.8%) | 13 (16.7%) |
| Total | 511 (13.6%) | 404 (11.5%) |
Income Above Poverty by Sex and Age in Newberry
According to the poverty statistics in Newberry, males aged under 5 years and females aged under 5 years are the age groups that are most secure financially, with 100.0% of males and 100.0% of females in these age groups living above the poverty line.
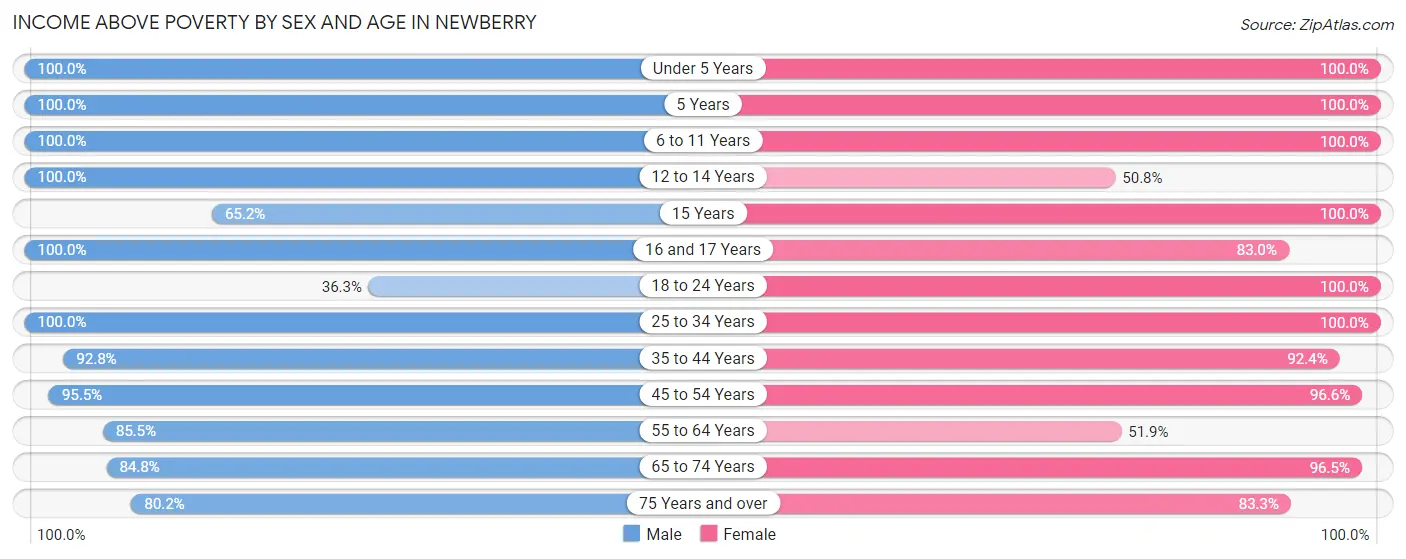
| Age Bracket | Male | Female |
| Under 5 Years | 282 (100.0%) | 235 (100.0%) |
| 5 Years | 28 (100.0%) | 49 (100.0%) |
| 6 to 11 Years | 327 (100.0%) | 202 (100.0%) |
| 12 to 14 Years | 191 (100.0%) | 131 (50.8%) |
| 15 Years | 30 (65.2%) | 69 (100.0%) |
| 16 and 17 Years | 98 (100.0%) | 190 (83.0%) |
| 18 to 24 Years | 176 (36.3%) | 220 (100.0%) |
| 25 to 34 Years | 594 (100.0%) | 419 (100.0%) |
| 35 to 44 Years | 476 (92.8%) | 472 (92.4%) |
| 45 to 54 Years | 317 (95.5%) | 506 (96.6%) |
| 55 to 64 Years | 424 (85.5%) | 166 (51.9%) |
| 65 to 74 Years | 212 (84.8%) | 386 (96.5%) |
| 75 Years and over | 97 (80.2%) | 65 (83.3%) |
| Total | 3,252 (86.4%) | 3,110 (88.5%) |
Income Below Poverty Among Married-Couple Families in Newberry
The poverty statistics for married-couple families in Newberry show that 1.1% or 18 of the total 1,603 families live below the poverty line. Families with 1 or 2 children have the highest poverty rate of 2.6%, comprising of 18 families. On the other hand, families with no children have the lowest poverty rate of 0.0%, which includes 0 families.
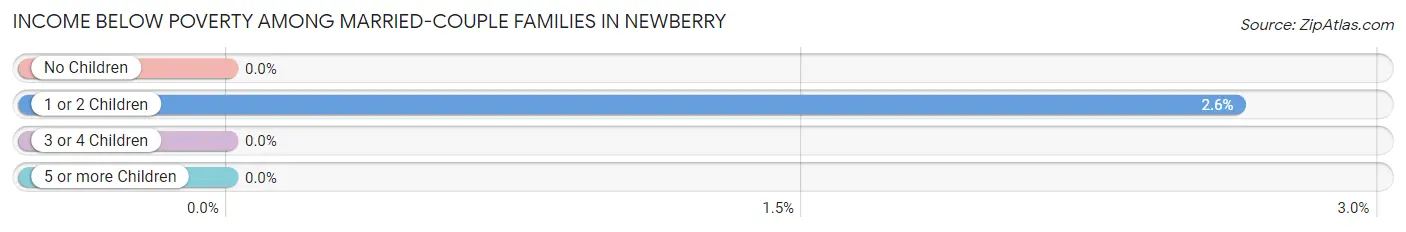
| Children | Above Poverty | Below Poverty |
| No Children | 774 (100.0%) | 0 (0.0%) |
| 1 or 2 Children | 667 (97.4%) | 18 (2.6%) |
| 3 or 4 Children | 144 (100.0%) | 0 (0.0%) |
| 5 or more Children | 0 (0.0%) | 0 (0.0%) |
| Total | 1,585 (98.9%) | 18 (1.1%) |
Income Below Poverty Among Single-Parent Households in Newberry
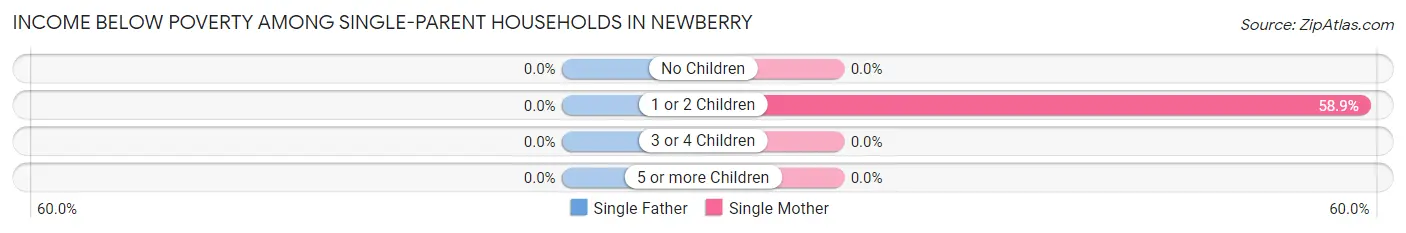
| Children | Single Father | Single Mother |
| No Children | 0 (0.0%) | 0 (0.0%) |
| 1 or 2 Children | 0 (0.0%) | 73 (58.9%) |
| 3 or 4 Children | 0 (0.0%) | 0 (0.0%) |
| 5 or more Children | 0 (0.0%) | 0 (0.0%) |
| Total | 0 (0.0%) | 73 (34.6%) |
Income Below Poverty Among Married-Couple vs Single-Parent Households in Newberry
The poverty data for Newberry shows that 18 of the married-couple family households (1.1%) and 73 of the single-parent households (33.0%) are living below the poverty level. Within the married-couple family households, those with 1 or 2 children have the highest poverty rate, with 18 households (2.6%) falling below the poverty line. Among the single-parent households, those with 1 or 2 children have the highest poverty rate, with 73 household (54.5%) living below poverty.
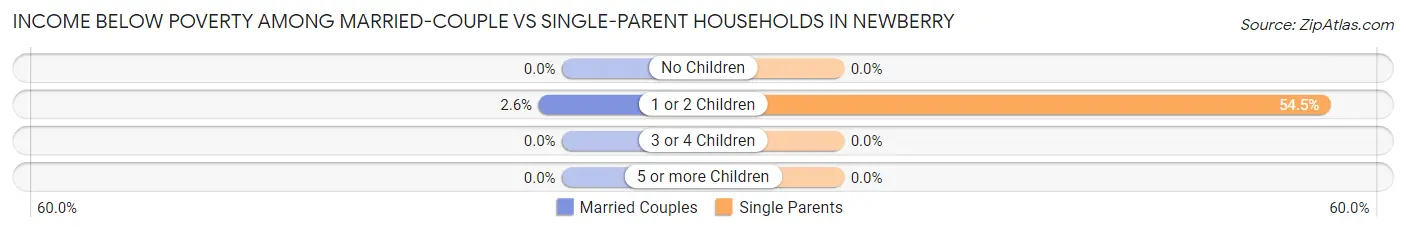
| Children | Married-Couple Families | Single-Parent Households |
| No Children | 0 (0.0%) | 0 (0.0%) |
| 1 or 2 Children | 18 (2.6%) | 73 (54.5%) |
| 3 or 4 Children | 0 (0.0%) | 0 (0.0%) |
| 5 or more Children | 0 (0.0%) | 0 (0.0%) |
| Total | 18 (1.1%) | 73 (33.0%) |
Race in Newberry
The most populous races in Newberry are White / Caucasian (5,156 | 69.7%), Hispanic or Latino (1,017 | 13.7%), and Black / African American (999 | 13.5%).
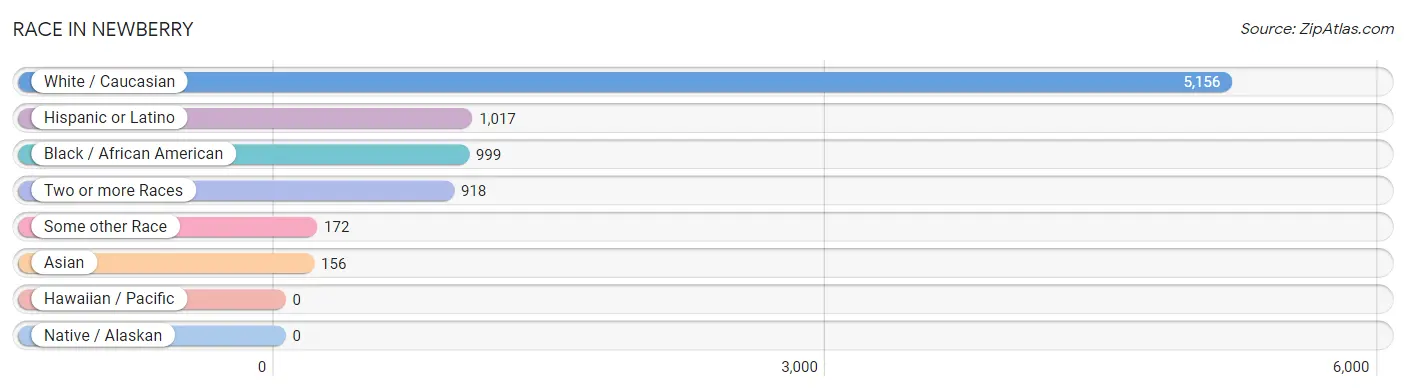
| Race | # Population | % Population |
| Asian | 156 | 2.1% |
| Black / African American | 999 | 13.5% |
| Hawaiian / Pacific | 0 | 0.0% |
| Hispanic or Latino | 1,017 | 13.7% |
| Native / Alaskan | 0 | 0.0% |
| White / Caucasian | 5,156 | 69.7% |
| Two or more Races | 918 | 12.4% |
| Some other Race | 172 | 2.3% |
| Total | 7,401 | 100.0% |
Ancestry in Newberry
The most populous ancestries reported in Newberry are English (863 | 11.7%), American (640 | 8.6%), Irish (614 | 8.3%), German (578 | 7.8%), and Scottish (517 | 7.0%), together accounting for 43.4% of all Newberry residents.
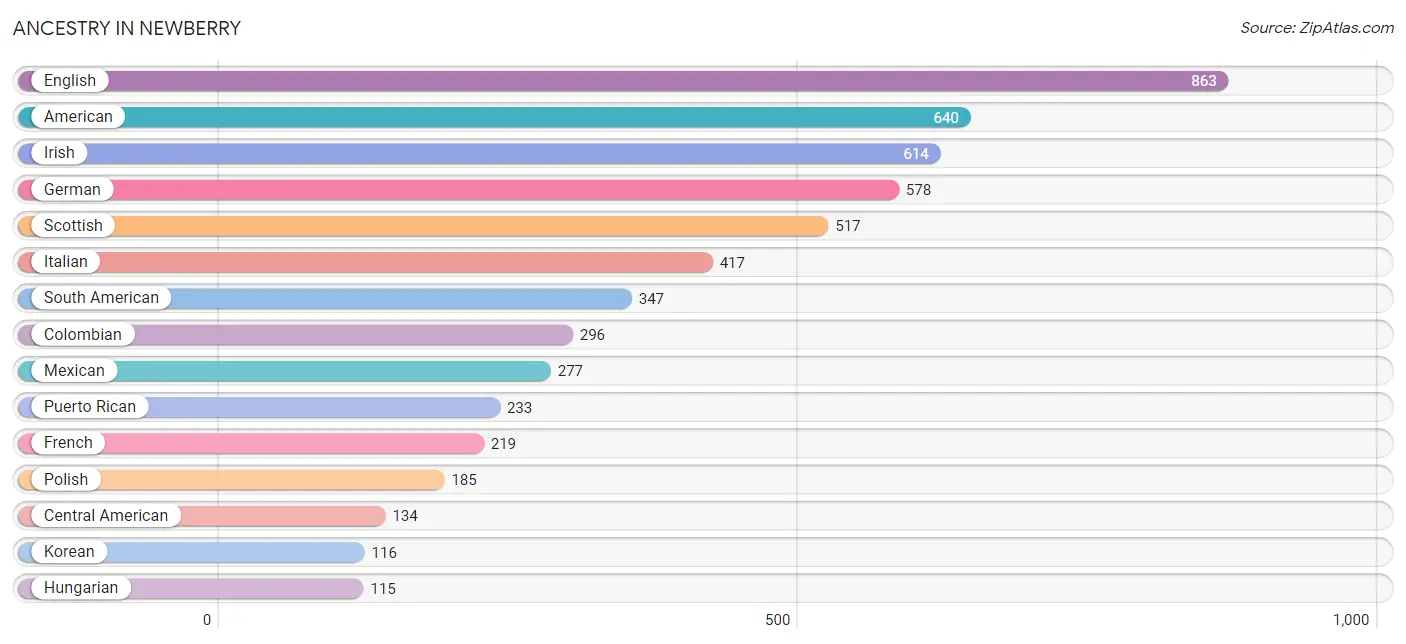
| Ancestry | # Population | % Population |
| American | 640 | 8.6% |
| Brazilian | 11 | 0.2% |
| British | 26 | 0.4% |
| Burmese | 15 | 0.2% |
| Central American | 134 | 1.8% |
| Cherokee | 7 | 0.1% |
| Colombian | 296 | 4.0% |
| Cuban | 26 | 0.4% |
| Czech | 40 | 0.5% |
| Czechoslovakian | 15 | 0.2% |
| Dutch | 65 | 0.9% |
| Ecuadorian | 21 | 0.3% |
| English | 863 | 11.7% |
| European | 37 | 0.5% |
| Filipino | 66 | 0.9% |
| Finnish | 110 | 1.5% |
| French | 219 | 3.0% |
| French Canadian | 53 | 0.7% |
| German | 578 | 7.8% |
| Greek | 7 | 0.1% |
| Haitian | 16 | 0.2% |
| Honduran | 60 | 0.8% |
| Hungarian | 115 | 1.5% |
| Indian (Asian) | 27 | 0.4% |
| Irish | 614 | 8.3% |
| Israeli | 54 | 0.7% |
| Italian | 417 | 5.6% |
| Jamaican | 110 | 1.5% |
| Korean | 116 | 1.6% |
| Mexican | 277 | 3.7% |
| Northern European | 19 | 0.3% |
| Norwegian | 9 | 0.1% |
| Polish | 185 | 2.5% |
| Puerto Rican | 233 | 3.2% |
| Russian | 10 | 0.1% |
| Salvadoran | 74 | 1.0% |
| Scandinavian | 19 | 0.3% |
| Scotch-Irish | 12 | 0.2% |
| Scottish | 517 | 7.0% |
| South American | 347 | 4.7% |
| Swedish | 14 | 0.2% |
| Ukrainian | 8 | 0.1% |
| Venezuelan | 30 | 0.4% | View All 43 Rows |
Immigrants in Newberry
The most numerous immigrant groups reported in Newberry came from Latin America (502 | 6.8%), South America (216 | 2.9%), Colombia (172 | 2.3%), Central America (159 | 2.1%), and Caribbean (127 | 1.7%), together accounting for 15.9% of all Newberry residents.
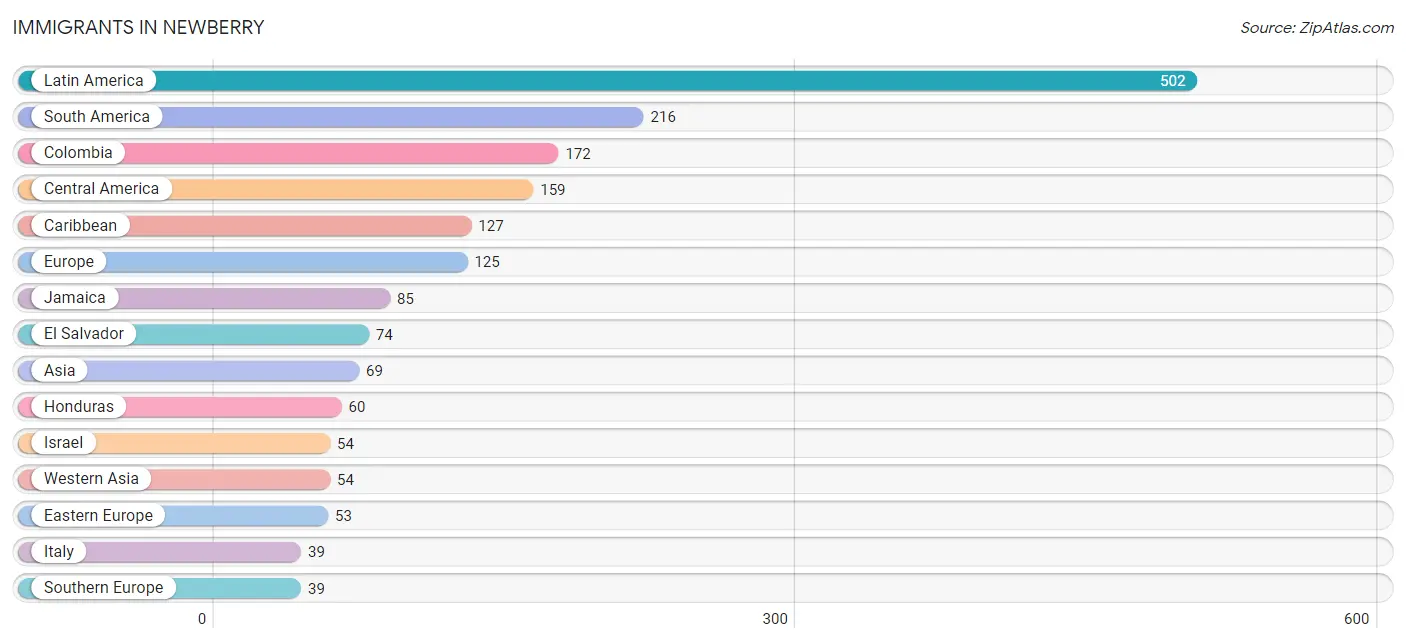
| Immigration Origin | # Population | % Population |
| Asia | 69 | 0.9% |
| Bahamas | 16 | 0.2% |
| Brazil | 23 | 0.3% |
| Canada | 24 | 0.3% |
| Caribbean | 127 | 1.7% |
| Central America | 159 | 2.1% |
| Colombia | 172 | 2.3% |
| Cuba | 26 | 0.4% |
| Czechoslovakia | 16 | 0.2% |
| Eastern Asia | 15 | 0.2% |
| Eastern Europe | 53 | 0.7% |
| Ecuador | 21 | 0.3% |
| El Salvador | 74 | 1.0% |
| England | 15 | 0.2% |
| Europe | 125 | 1.7% |
| Germany | 18 | 0.2% |
| Honduras | 60 | 0.8% |
| Israel | 54 | 0.7% |
| Italy | 39 | 0.5% |
| Jamaica | 85 | 1.1% |
| Korea | 15 | 0.2% |
| Latin America | 502 | 6.8% |
| Mexico | 25 | 0.3% |
| Northern Europe | 15 | 0.2% |
| Romania | 37 | 0.5% |
| South America | 216 | 2.9% |
| Southern Europe | 39 | 0.5% |
| Western Asia | 54 | 0.7% |
| Western Europe | 18 | 0.2% | View All 29 Rows |
Sex and Age in Newberry
Sex and Age in Newberry
The most populous age groups in Newberry are 10 to 14 Years (353 | 9.2%) for men and 10 to 14 Years (396 | 11.1%) for women.

| Age Bracket | Male | Female |
| Under 5 Years | 314 (8.2%) | 286 (8.0%) |
| 5 to 9 Years | 234 (6.1%) | 113 (3.2%) |
| 10 to 14 Years | 353 (9.2%) | 396 (11.1%) |
| 15 to 19 Years | 304 (7.9%) | 359 (10.1%) |
| 20 to 24 Years | 325 (8.5%) | 159 (4.5%) |
| 25 to 29 Years | 294 (7.7%) | 204 (5.7%) |
| 30 to 34 Years | 300 (7.8%) | 215 (6.0%) |
| 35 to 39 Years | 275 (7.2%) | 236 (6.6%) |
| 40 to 44 Years | 238 (6.2%) | 275 (7.7%) |
| 45 to 49 Years | 191 (5.0%) | 285 (8.0%) |
| 50 to 54 Years | 141 (3.7%) | 239 (6.7%) |
| 55 to 59 Years | 187 (4.9%) | 109 (3.1%) |
| 60 to 64 Years | 309 (8.1%) | 211 (5.9%) |
| 65 to 69 Years | 151 (3.9%) | 285 (8.0%) |
| 70 to 74 Years | 99 (2.6%) | 115 (3.2%) |
| 75 to 79 Years | 73 (1.9%) | 48 (1.3%) |
| 80 to 84 Years | 18 (0.5%) | 10 (0.3%) |
| 85 Years and over | 30 (0.8%) | 20 (0.6%) |
| Total | 3,836 (100.0%) | 3,565 (100.0%) |
Families and Households in Newberry
Median Family Size in Newberry
The median family size in Newberry is 3.44 persons per family, with single female/mother families (211 | 11.6%) accounting for the largest median family size of 4.16 persons per family. On the other hand, single male/father families (10 | 0.5%) represent the smallest median family size with 3.10 persons per family.
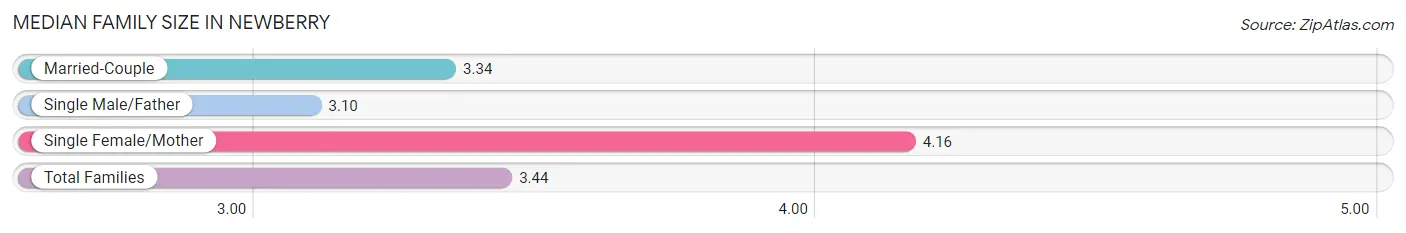
| Family Type | # Families | Family Size |
| Married-Couple | 1,603 (87.9%) | 3.34 |
| Single Male/Father | 10 (0.5%) | 3.10 |
| Single Female/Mother | 211 (11.6%) | 4.16 |
| Total Families | 1,824 (100.0%) | 3.44 |
Median Household Size in Newberry
The median household size in Newberry is 2.79 persons per household, with single female/mother households (211 | 8.0%) accounting for the largest median household size of 4.16 persons per household. non-family households (825 | 31.1%) represent the smallest median household size with 1.23 persons per household.
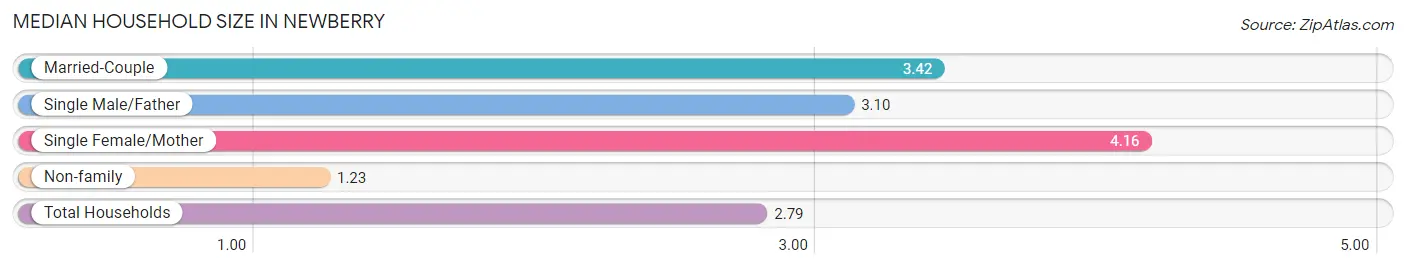
| Household Type | # Households | Household Size |
| Married-Couple | 1,603 (60.5%) | 3.42 |
| Single Male/Father | 10 (0.4%) | 3.10 |
| Single Female/Mother | 211 (8.0%) | 4.16 |
| Non-family | 825 (31.1%) | 1.23 |
| Total Households | 2,649 (100.0%) | 2.79 |
Household Size by Marriage Status in Newberry
Out of a total of 2,649 households in Newberry, 1,824 (68.9%) are family households, while 825 (31.1%) are nonfamily households. The most numerous type of family households are 2-person households, comprising 768, and the most common type of nonfamily households are 1-person households, comprising 634.
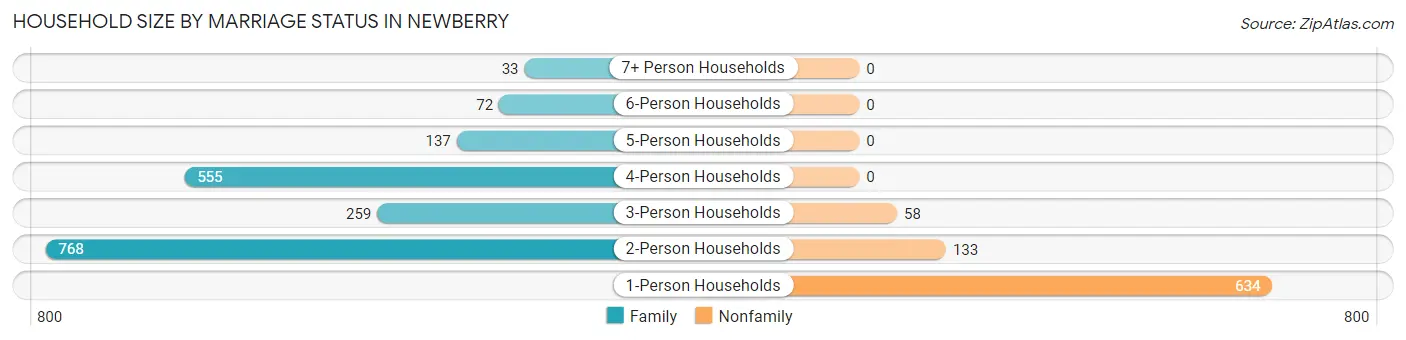
| Household Size | Family Households | Nonfamily Households |
| 1-Person Households | - | 634 (23.9%) |
| 2-Person Households | 768 (29.0%) | 133 (5.0%) |
| 3-Person Households | 259 (9.8%) | 58 (2.2%) |
| 4-Person Households | 555 (20.9%) | 0 (0.0%) |
| 5-Person Households | 137 (5.2%) | 0 (0.0%) |
| 6-Person Households | 72 (2.7%) | 0 (0.0%) |
| 7+ Person Households | 33 (1.3%) | 0 (0.0%) |
| Total | 1,824 (68.9%) | 825 (31.1%) |
Female Fertility in Newberry
Fertility by Age in Newberry
Average fertility rate in Newberry is 44.0 births per 1,000 women. Women in the age bracket of 20 to 34 years have the highest fertility rate with 107.0 births per 1,000 women. Women in the age bracket of 20 to 34 years acount for 79.5% of all women with births.
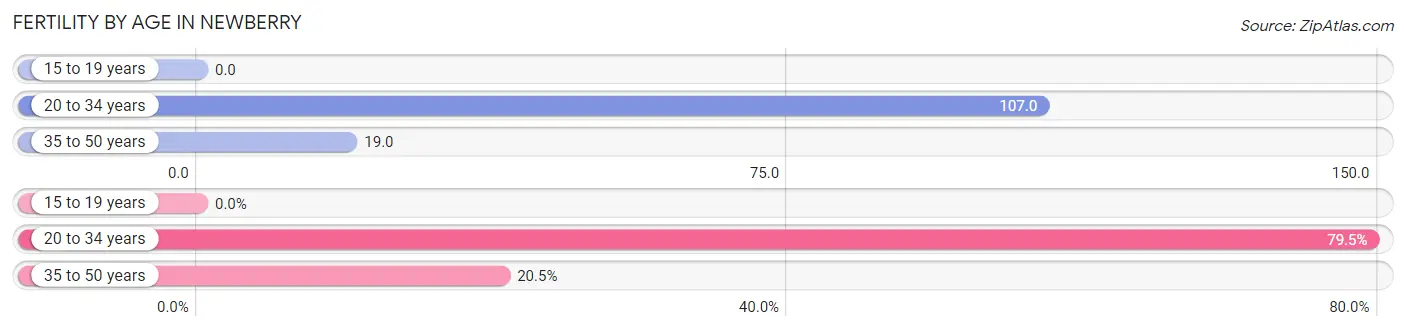
| Age Bracket | Women with Births | Births / 1,000 Women |
| 15 to 19 years | 0 (0.0%) | 0.0 |
| 20 to 34 years | 62 (79.5%) | 107.0 |
| 35 to 50 years | 16 (20.5%) | 19.0 |
| Total | 78 (100.0%) | 44.0 |
Fertility by Age by Marriage Status in Newberry
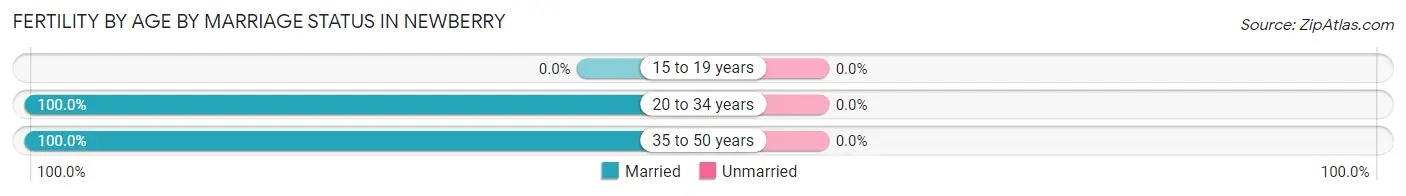
| Age Bracket | Married | Unmarried |
| 15 to 19 years | 0 (0.0%) | 0 (0.0%) |
| 20 to 34 years | 62 (100.0%) | 0 (0.0%) |
| 35 to 50 years | 16 (100.0%) | 0 (0.0%) |
| Total | 78 (100.0%) | 0 (0.0%) |
Fertility by Education in Newberry
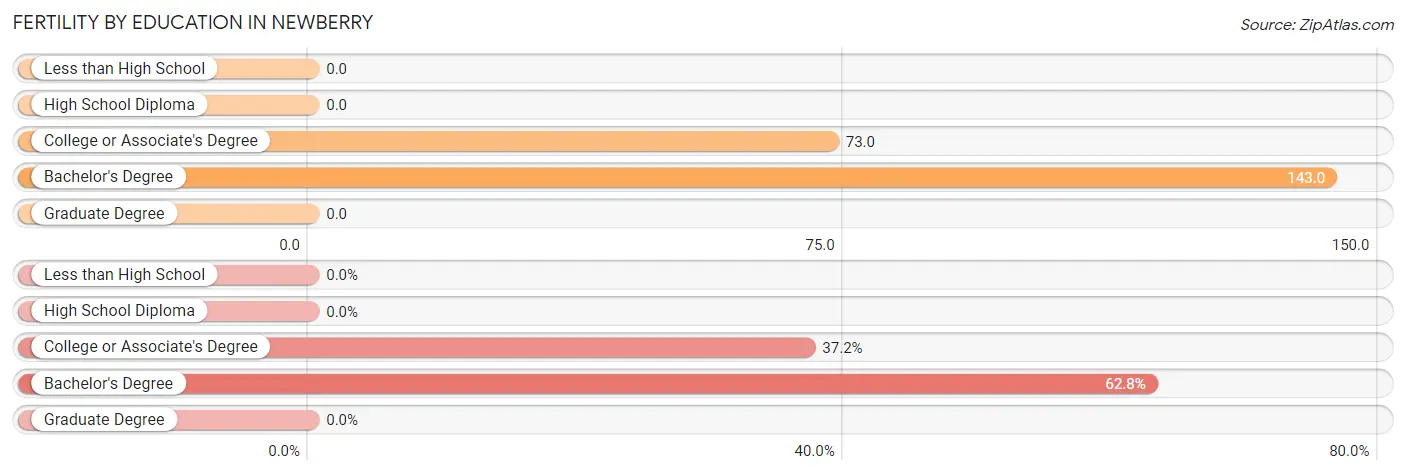
| Educational Attainment | Women with Births | Births / 1,000 Women |
| Less than High School | 0 (0.0%) | 0.0 |
| High School Diploma | 0 (0.0%) | 0.0 |
| College or Associate's Degree | 29 (37.2%) | 73.0 |
| Bachelor's Degree | 49 (62.8%) | 143.0 |
| Graduate Degree | 0 (0.0%) | 0.0 |
| Total | 78 (100.0%) | 44.0 |
Fertility by Education by Marriage Status in Newberry
| Educational Attainment | Married | Unmarried |
| Less than High School | 0 (0.0%) | 0 (0.0%) |
| High School Diploma | 0 (0.0%) | 0 (0.0%) |
| College or Associate's Degree | 29 (100.0%) | 0 (0.0%) |
| Bachelor's Degree | 49 (100.0%) | 0 (0.0%) |
| Graduate Degree | 0 (0.0%) | 0 (0.0%) |
| Total | 78 (100.0%) | 0 (0.0%) |
Employment Characteristics in Newberry
Employment by Class of Employer in Newberry
Among the 3,305 employed individuals in Newberry, private company employees (1,552 | 47.0%), local government employees (553 | 16.7%), and state government employees (307 | 9.3%) make up the most common classes of employment.
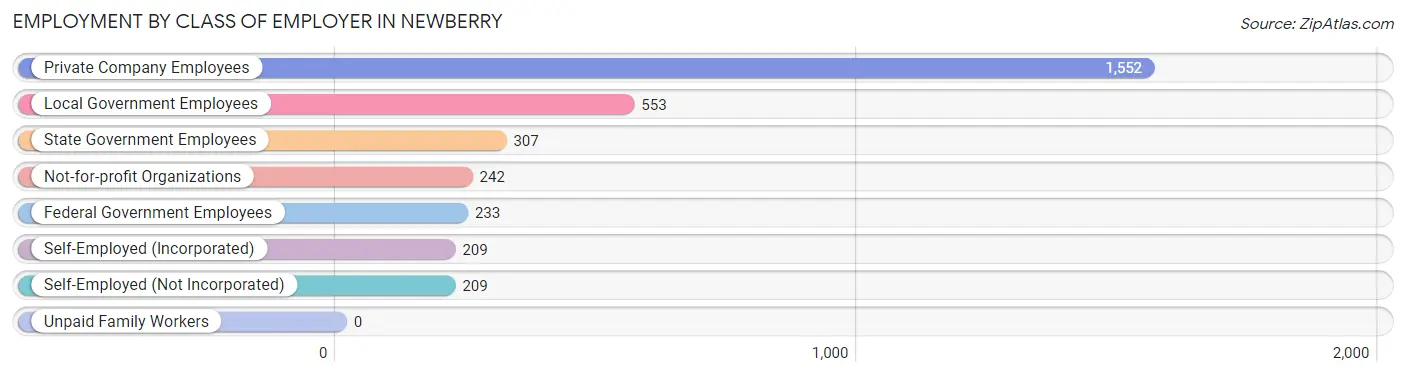
| Employer Class | # Employees | % Employees |
| Private Company Employees | 1,552 | 47.0% |
| Self-Employed (Incorporated) | 209 | 6.3% |
| Self-Employed (Not Incorporated) | 209 | 6.3% |
| Not-for-profit Organizations | 242 | 7.3% |
| Local Government Employees | 553 | 16.7% |
| State Government Employees | 307 | 9.3% |
| Federal Government Employees | 233 | 7.0% |
| Unpaid Family Workers | 0 | 0.0% |
| Total | 3,305 | 100.0% |
Employment Status by Age in Newberry
According to the labor force statistics for Newberry, out of the total population over 16 years of age (5,590), 64.0% or 3,578 individuals are in the labor force, with 5.4% or 193 of them unemployed. The age group with the highest labor force participation rate is 25 to 29 years, with 95.6% or 476 individuals in the labor force. Within the labor force, the 16 to 19 years age range has the highest percentage of unemployed individuals, with 69.9% or 109 of them being unemployed.
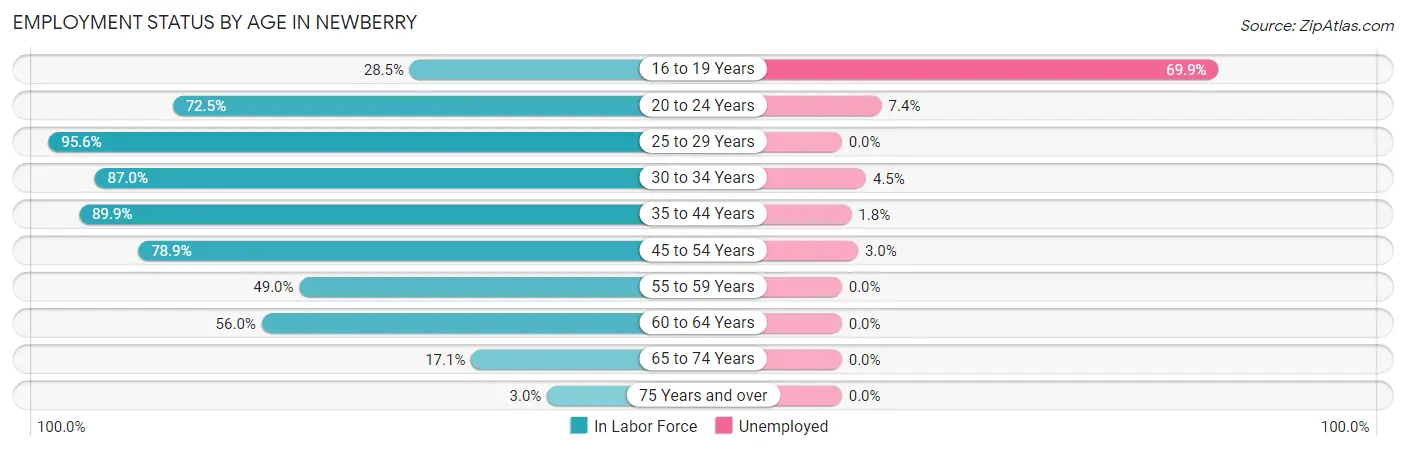
| Age Bracket | In Labor Force | Unemployed |
| 16 to 19 Years | 156 (28.5%) | 109 (69.9%) |
| 20 to 24 Years | 351 (72.5%) | 26 (7.4%) |
| 25 to 29 Years | 476 (95.6%) | 0 (0.0%) |
| 30 to 34 Years | 448 (87.0%) | 20 (4.5%) |
| 35 to 44 Years | 921 (89.9%) | 17 (1.8%) |
| 45 to 54 Years | 675 (78.9%) | 20 (3.0%) |
| 55 to 59 Years | 145 (49.0%) | 0 (0.0%) |
| 60 to 64 Years | 291 (56.0%) | 0 (0.0%) |
| 65 to 74 Years | 111 (17.1%) | 0 (0.0%) |
| 75 Years and over | 6 (3.0%) | 0 (0.0%) |
| Total | 3,578 (64.0%) | 193 (5.4%) |
Employment Status by Educational Attainment in Newberry
According to labor force statistics for Newberry, 79.7% of individuals (2,956) out of the total population between 25 and 64 years of age (3,709) are in the labor force, with 1.9% or 56 of them being unemployed. The group with the highest labor force participation rate are those with the educational attainment of bachelor's degree or higher, with 85.2% or 1,136 individuals in the labor force. Within the labor force, individuals with less than high school education have the highest percentage of unemployment, with 21.3% or 17 of them being unemployed.
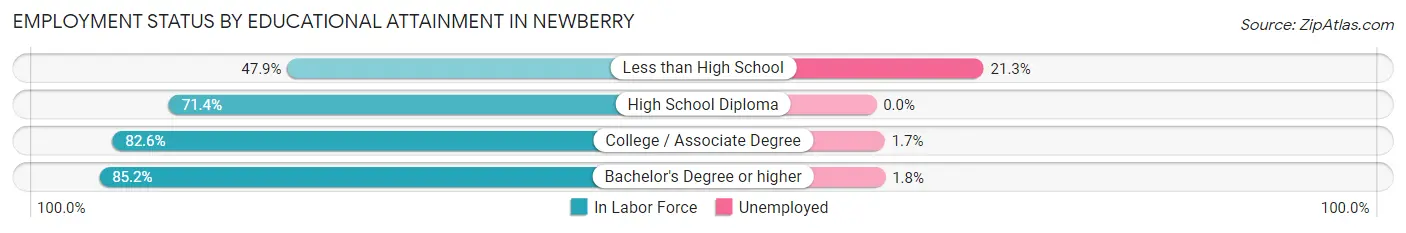
| Educational Attainment | In Labor Force | Unemployed |
| Less than High School | 80 (47.9%) | 36 (21.3%) |
| High School Diploma | 545 (71.4%) | 0 (0.0%) |
| College / Associate Degree | 1,194 (82.6%) | 25 (1.7%) |
| Bachelor's Degree or higher | 1,136 (85.2%) | 24 (1.8%) |
| Total | 2,956 (79.7%) | 70 (1.9%) |
Employment Occupations by Sex in Newberry
Management, Business, Science and Arts Occupations
The most common Management, Business, Science and Arts occupations in Newberry are Health Diagnosing & Treating (406 | 12.0%), Management (388 | 11.5%), Health Technologists (279 | 8.2%), Community & Social Service (270 | 8.0%), and Education Instruction & Library (196 | 5.8%).
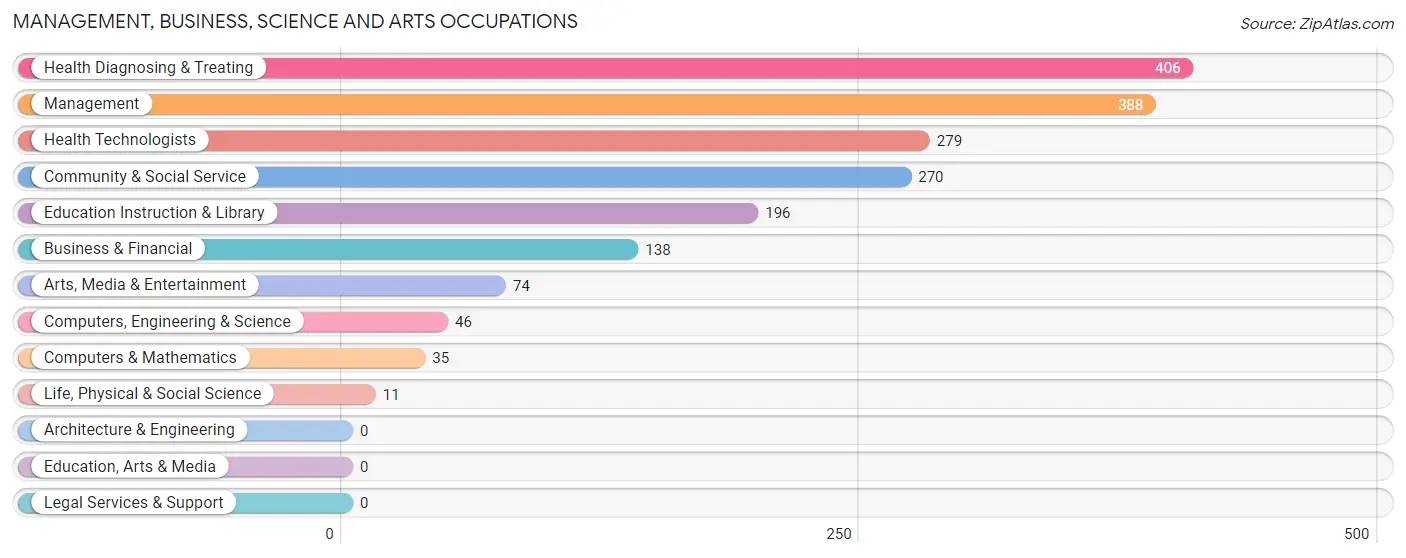
Management, Business, Science and Arts Occupations by Sex
Within the Management, Business, Science and Arts occupations in Newberry, the most male-oriented occupations are Computers, Engineering & Science (100.0%), Computers & Mathematics (100.0%), and Life, Physical & Social Science (100.0%), while the most female-oriented occupations are Arts, Media & Entertainment (100.0%), Community & Social Service (84.1%), and Education Instruction & Library (78.1%).
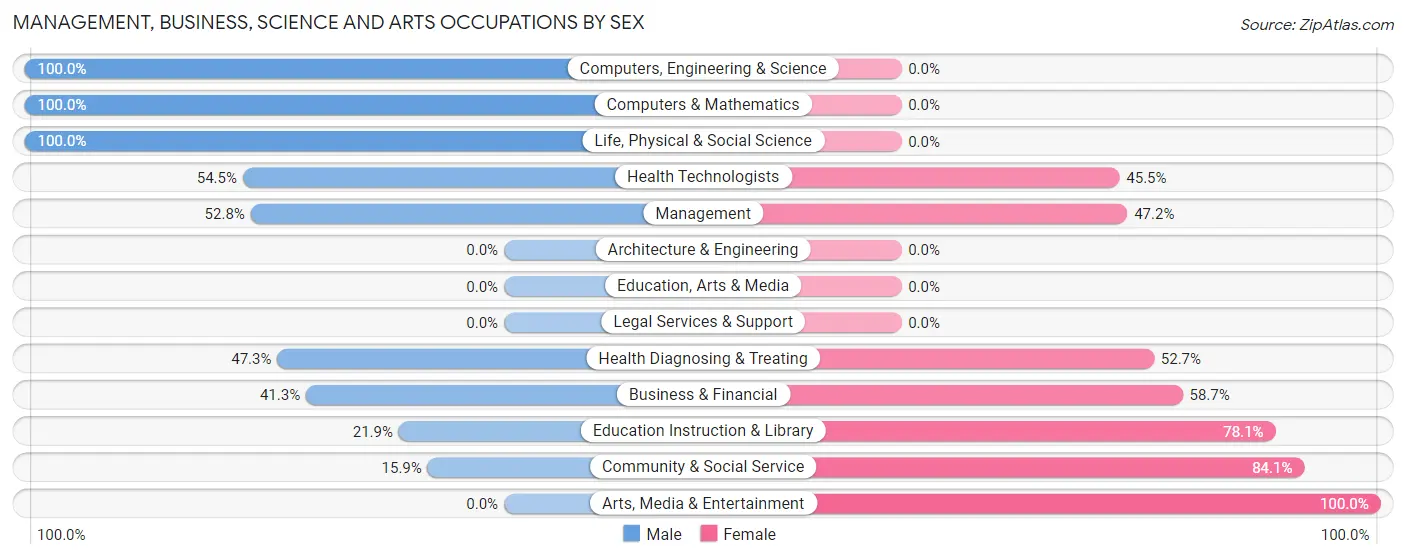
| Occupation | Male | Female |
| Management | 205 (52.8%) | 183 (47.2%) |
| Business & Financial | 57 (41.3%) | 81 (58.7%) |
| Computers, Engineering & Science | 46 (100.0%) | 0 (0.0%) |
| Computers & Mathematics | 35 (100.0%) | 0 (0.0%) |
| Architecture & Engineering | 0 (0.0%) | 0 (0.0%) |
| Life, Physical & Social Science | 11 (100.0%) | 0 (0.0%) |
| Community & Social Service | 43 (15.9%) | 227 (84.1%) |
| Education, Arts & Media | 0 (0.0%) | 0 (0.0%) |
| Legal Services & Support | 0 (0.0%) | 0 (0.0%) |
| Education Instruction & Library | 43 (21.9%) | 153 (78.1%) |
| Arts, Media & Entertainment | 0 (0.0%) | 74 (100.0%) |
| Health Diagnosing & Treating | 192 (47.3%) | 214 (52.7%) |
| Health Technologists | 152 (54.5%) | 127 (45.5%) |
| Total (Category) | 543 (43.5%) | 705 (56.5%) |
| Total (Overall) | 1,907 (56.3%) | 1,481 (43.7%) |
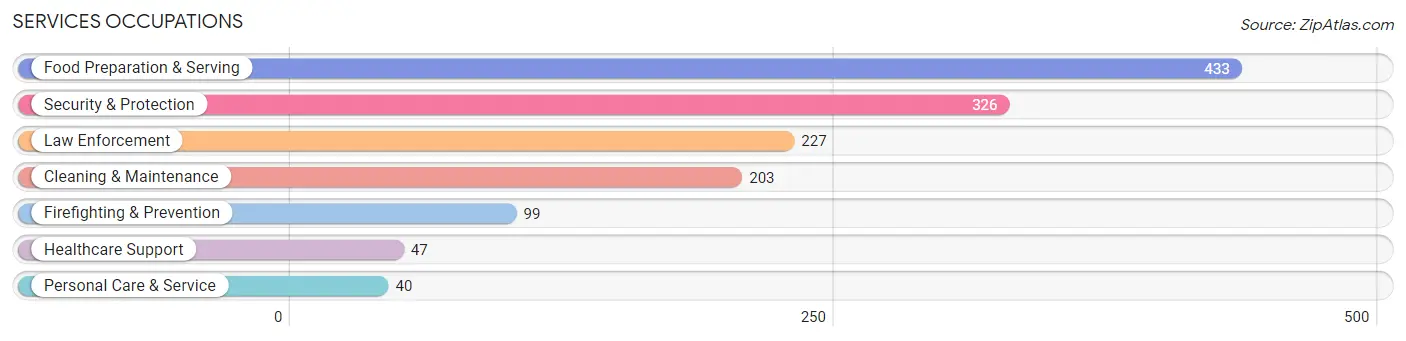
Services Occupations
The most common Services occupations in Newberry are Food Preparation & Serving (433 | 12.8%), Security & Protection (326 | 9.6%), Law Enforcement (227 | 6.7%), Cleaning & Maintenance (203 | 6.0%), and Firefighting & Prevention (99 | 2.9%).
Services Occupations by Sex
Within the Services occupations in Newberry, the most male-oriented occupations are Security & Protection (100.0%), Firefighting & Prevention (100.0%), and Law Enforcement (100.0%), while the most female-oriented occupations are Personal Care & Service (100.0%), Cleaning & Maintenance (76.3%), and Healthcare Support (57.5%).
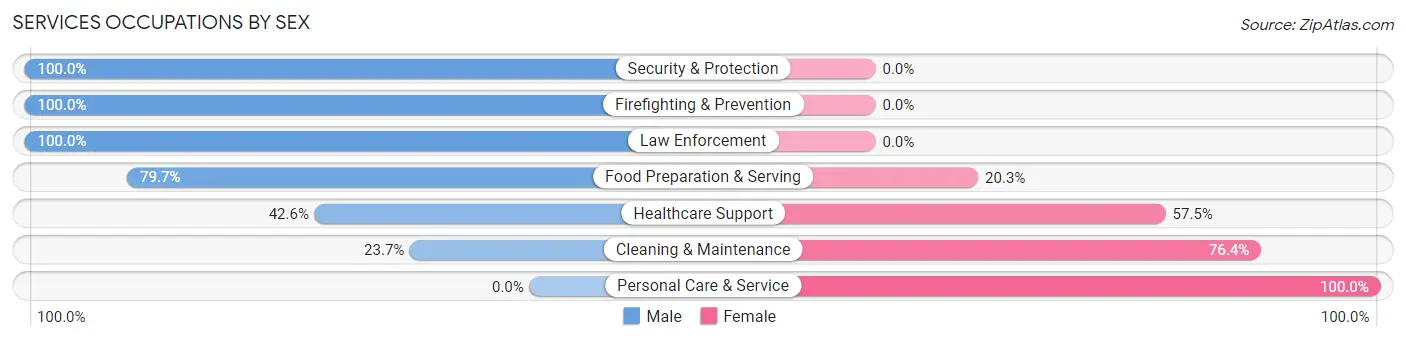
| Occupation | Male | Female |
| Healthcare Support | 20 (42.5%) | 27 (57.5%) |
| Security & Protection | 326 (100.0%) | 0 (0.0%) |
| Firefighting & Prevention | 99 (100.0%) | 0 (0.0%) |
| Law Enforcement | 227 (100.0%) | 0 (0.0%) |
| Food Preparation & Serving | 345 (79.7%) | 88 (20.3%) |
| Cleaning & Maintenance | 48 (23.6%) | 155 (76.3%) |
| Personal Care & Service | 0 (0.0%) | 40 (100.0%) |
| Total (Category) | 739 (70.5%) | 310 (29.5%) |
| Total (Overall) | 1,907 (56.3%) | 1,481 (43.7%) |
Sales and Office Occupations
The most common Sales and Office occupations in Newberry are Office & Administration (321 | 9.5%), and Sales & Related (242 | 7.1%).

Sales and Office Occupations by Sex
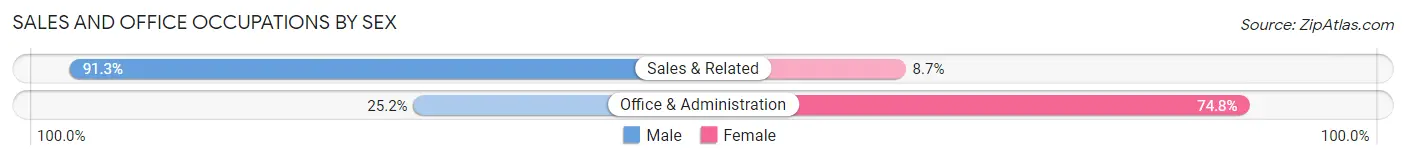
| Occupation | Male | Female |
| Sales & Related | 221 (91.3%) | 21 (8.7%) |
| Office & Administration | 81 (25.2%) | 240 (74.8%) |
| Total (Category) | 302 (53.6%) | 261 (46.4%) |
| Total (Overall) | 1,907 (56.3%) | 1,481 (43.7%) |
Natural Resources, Construction and Maintenance Occupations
The most common Natural Resources, Construction and Maintenance occupations in Newberry are Installation, Maintenance & Repair (154 | 4.5%), Construction & Extraction (120 | 3.5%), and Farming, Fishing & Forestry (18 | 0.5%).

Natural Resources, Construction and Maintenance Occupations by Sex
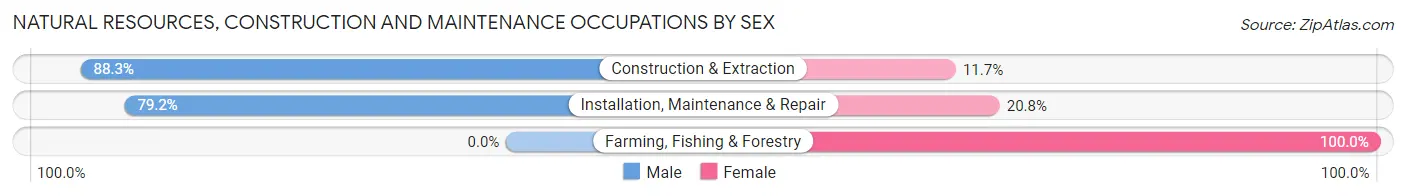
| Occupation | Male | Female |
| Farming, Fishing & Forestry | 0 (0.0%) | 18 (100.0%) |
| Construction & Extraction | 106 (88.3%) | 14 (11.7%) |
| Installation, Maintenance & Repair | 122 (79.2%) | 32 (20.8%) |
| Total (Category) | 228 (78.1%) | 64 (21.9%) |
| Total (Overall) | 1,907 (56.3%) | 1,481 (43.7%) |
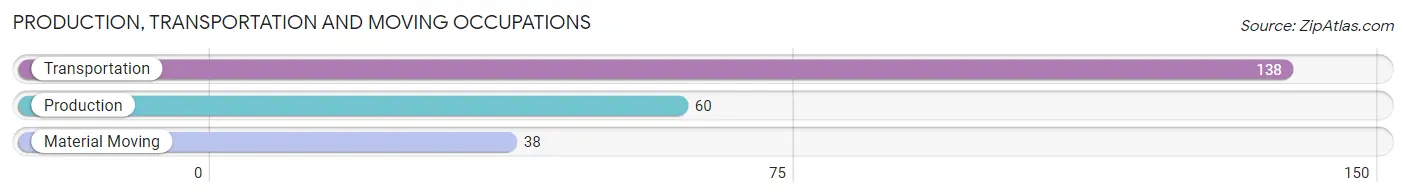
Production, Transportation and Moving Occupations
The most common Production, Transportation and Moving occupations in Newberry are Transportation (138 | 4.1%), Production (60 | 1.8%), and Material Moving (38 | 1.1%).
Production, Transportation and Moving Occupations by Sex
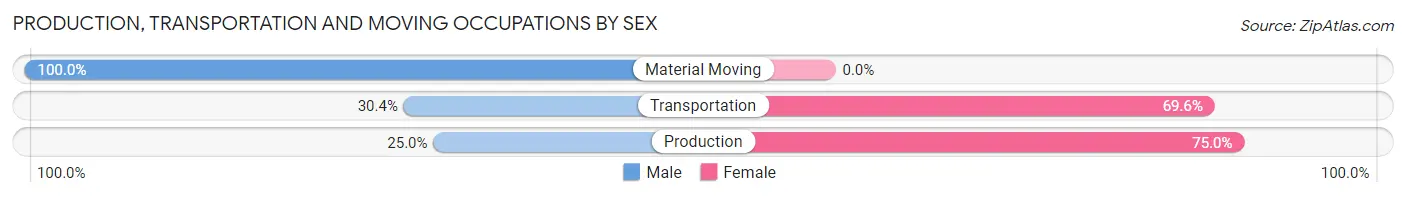
| Occupation | Male | Female |
| Production | 15 (25.0%) | 45 (75.0%) |
| Transportation | 42 (30.4%) | 96 (69.6%) |
| Material Moving | 38 (100.0%) | 0 (0.0%) |
| Total (Category) | 95 (40.3%) | 141 (59.8%) |
| Total (Overall) | 1,907 (56.3%) | 1,481 (43.7%) |
Employment Industries by Sex in Newberry
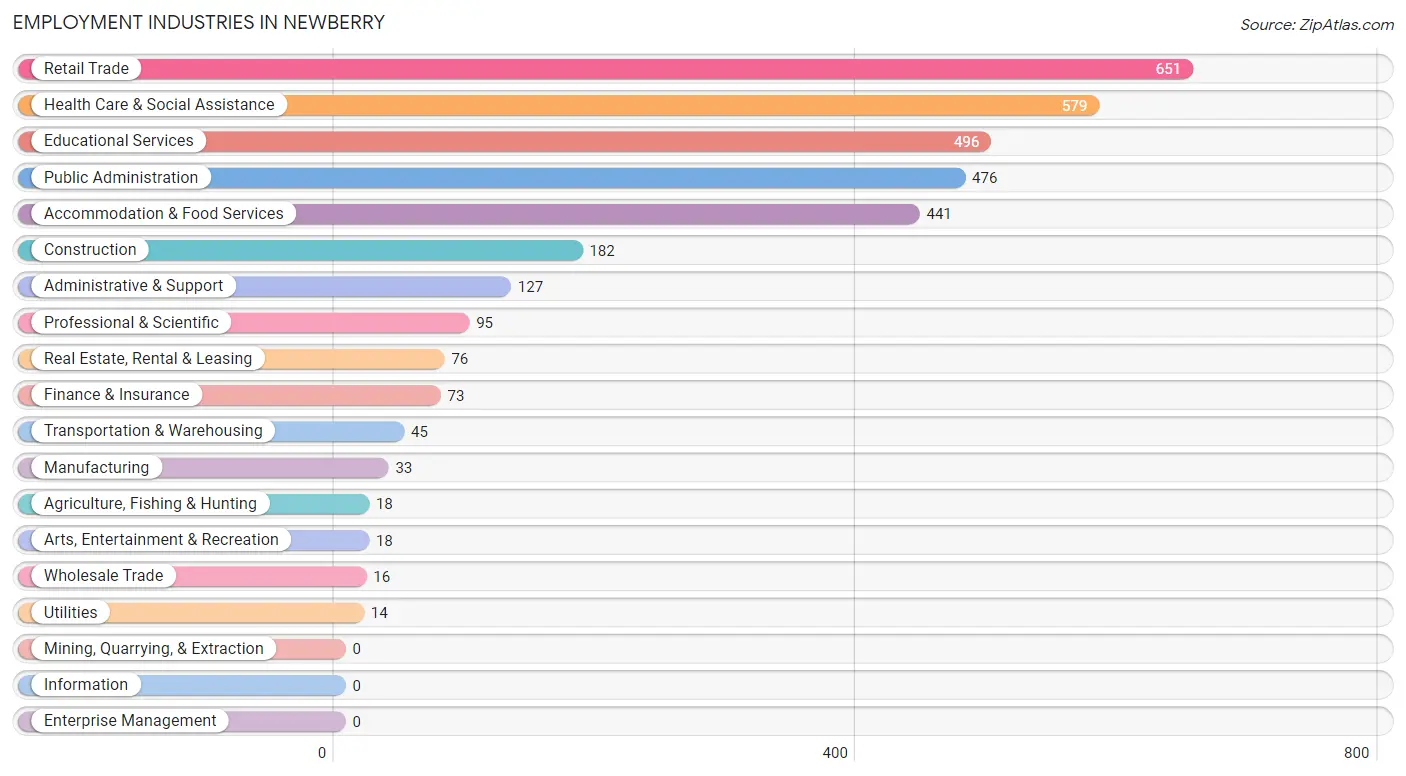
Employment Industries in Newberry
The major employment industries in Newberry include Retail Trade (651 | 19.2%), Health Care & Social Assistance (579 | 17.1%), Educational Services (496 | 14.6%), Public Administration (476 | 14.1%), and Accommodation & Food Services (441 | 13.0%).
Employment Industries by Sex in Newberry
The Newberry industries that see more men than women are Construction (100.0%), Manufacturing (100.0%), and Transportation & Warehousing (100.0%), whereas the industries that tend to have a higher number of women are Agriculture, Fishing & Hunting (100.0%), Wholesale Trade (100.0%), and Finance & Insurance (79.4%).
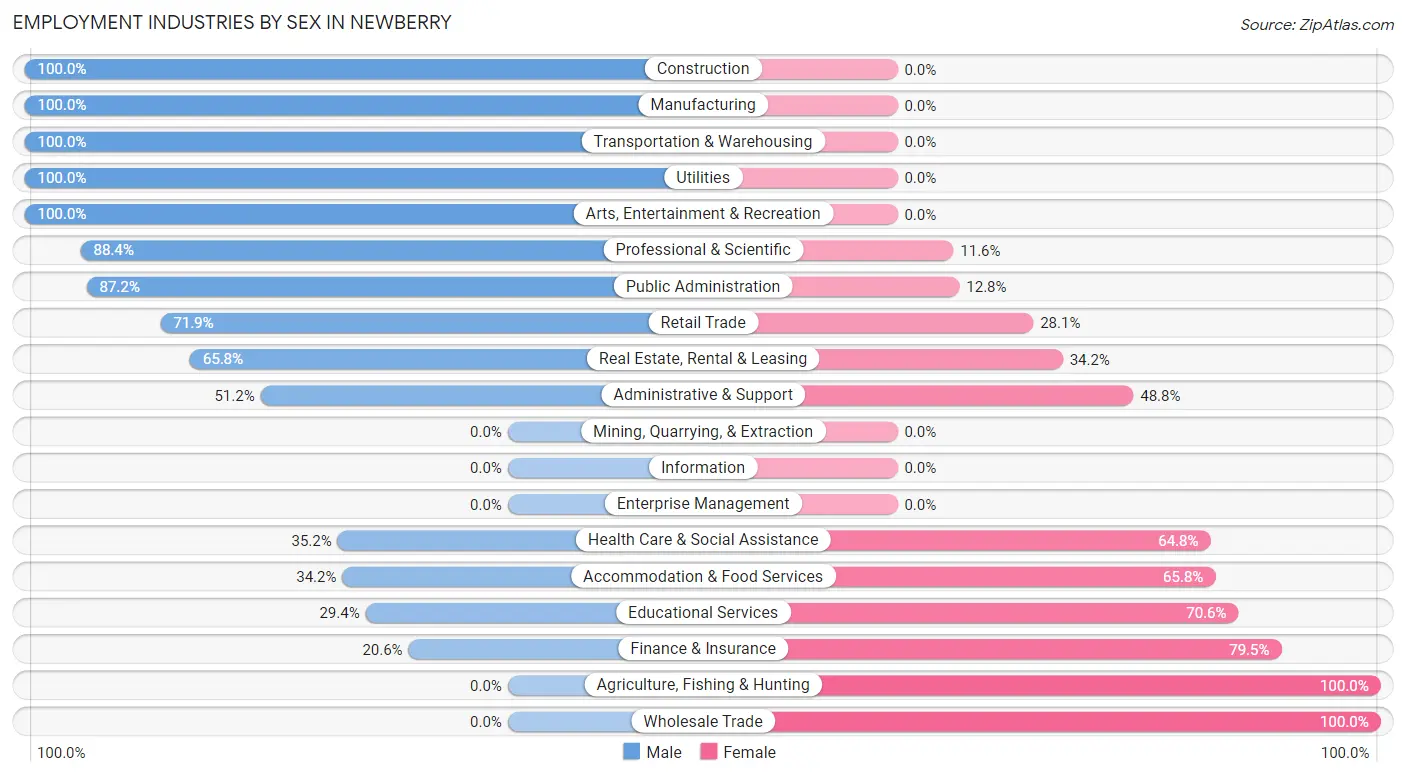
| Industry | Male | Female |
| Agriculture, Fishing & Hunting | 0 (0.0%) | 18 (100.0%) |
| Mining, Quarrying, & Extraction | 0 (0.0%) | 0 (0.0%) |
| Construction | 182 (100.0%) | 0 (0.0%) |
| Manufacturing | 33 (100.0%) | 0 (0.0%) |
| Wholesale Trade | 0 (0.0%) | 16 (100.0%) |
| Retail Trade | 468 (71.9%) | 183 (28.1%) |
| Transportation & Warehousing | 45 (100.0%) | 0 (0.0%) |
| Utilities | 14 (100.0%) | 0 (0.0%) |
| Information | 0 (0.0%) | 0 (0.0%) |
| Finance & Insurance | 15 (20.5%) | 58 (79.4%) |
| Real Estate, Rental & Leasing | 50 (65.8%) | 26 (34.2%) |
| Professional & Scientific | 84 (88.4%) | 11 (11.6%) |
| Enterprise Management | 0 (0.0%) | 0 (0.0%) |
| Administrative & Support | 65 (51.2%) | 62 (48.8%) |
| Educational Services | 146 (29.4%) | 350 (70.6%) |
| Health Care & Social Assistance | 204 (35.2%) | 375 (64.8%) |
| Arts, Entertainment & Recreation | 18 (100.0%) | 0 (0.0%) |
| Accommodation & Food Services | 151 (34.2%) | 290 (65.8%) |
| Public Administration | 415 (87.2%) | 61 (12.8%) |
| Total | 1,907 (56.3%) | 1,481 (43.7%) |
Education in Newberry
School Enrollment in Newberry
The most common levels of schooling among the 2,363 students in Newberry are high school (770 | 32.6%), college / undergraduate (466 | 19.7%), and middle school (457 | 19.3%).
| School Level | # Students | % Students |
| Nursery / Preschool | 178 | 7.5% |
| Kindergarten | 28 | 1.2% |
| Elementary School | 364 | 15.4% |
| Middle School | 457 | 19.3% |
| High School | 770 | 32.6% |
| College / Undergraduate | 466 | 19.7% |
| Graduate / Professional | 100 | 4.2% |
| Total | 2,363 | 100.0% |
School Enrollment by Age by Funding Source in Newberry
Out of a total of 2,363 students who are enrolled in schools in Newberry, 418 (17.7%) attend a private institution, while the remaining 1,945 (82.3%) are enrolled in public schools. The age group of 3 to 4 year olds has the highest likelihood of being enrolled in private schools, with 148 (100.0% in the age bracket) enrolled. Conversely, the age group of 18 to 19 year olds has the lowest likelihood of being enrolled in a private school, with 177 (100.0% in the age bracket) attending a public institution.
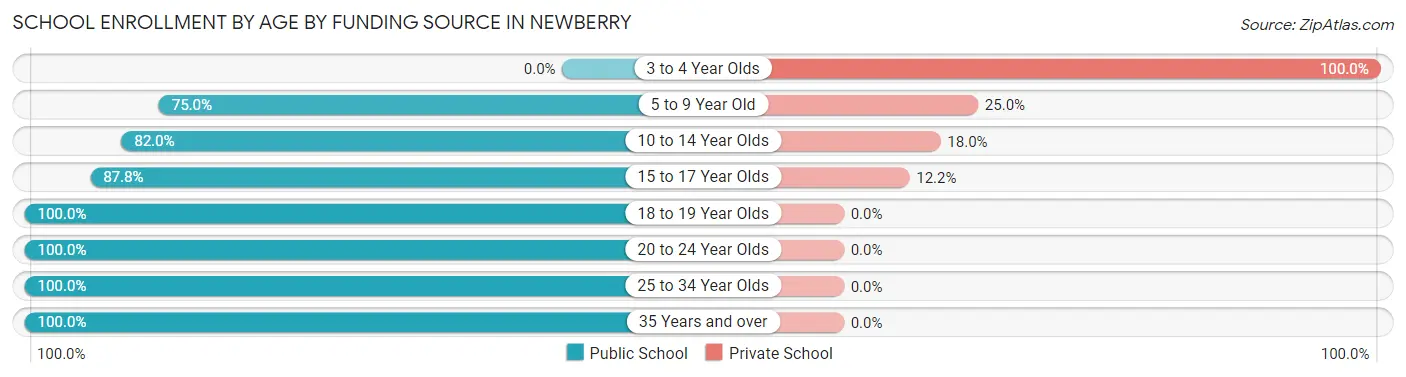
| Age Bracket | Public School | Private School |
| 3 to 4 Year Olds | 0 (0.0%) | 148 (100.0%) |
| 5 to 9 Year Old | 246 (75.0%) | 82 (25.0%) |
| 10 to 14 Year Olds | 614 (82.0%) | 135 (18.0%) |
| 15 to 17 Year Olds | 388 (87.8%) | 54 (12.2%) |
| 18 to 19 Year Olds | 177 (100.0%) | 0 (0.0%) |
| 20 to 24 Year Olds | 370 (100.0%) | 0 (0.0%) |
| 25 to 34 Year Olds | 133 (100.0%) | 0 (0.0%) |
| 35 Years and over | 16 (100.0%) | 0 (0.0%) |
| Total | 1,945 (82.3%) | 418 (17.7%) |
Educational Attainment by Field of Study in Newberry
Business (348 | 20.6%), education (300 | 17.7%), science & technology (220 | 13.0%), bio, nature & agricultural (218 | 12.9%), and arts & humanities (100 | 5.9%) are the most common fields of study among 1,692 individuals in Newberry who have obtained a bachelor's degree or higher.
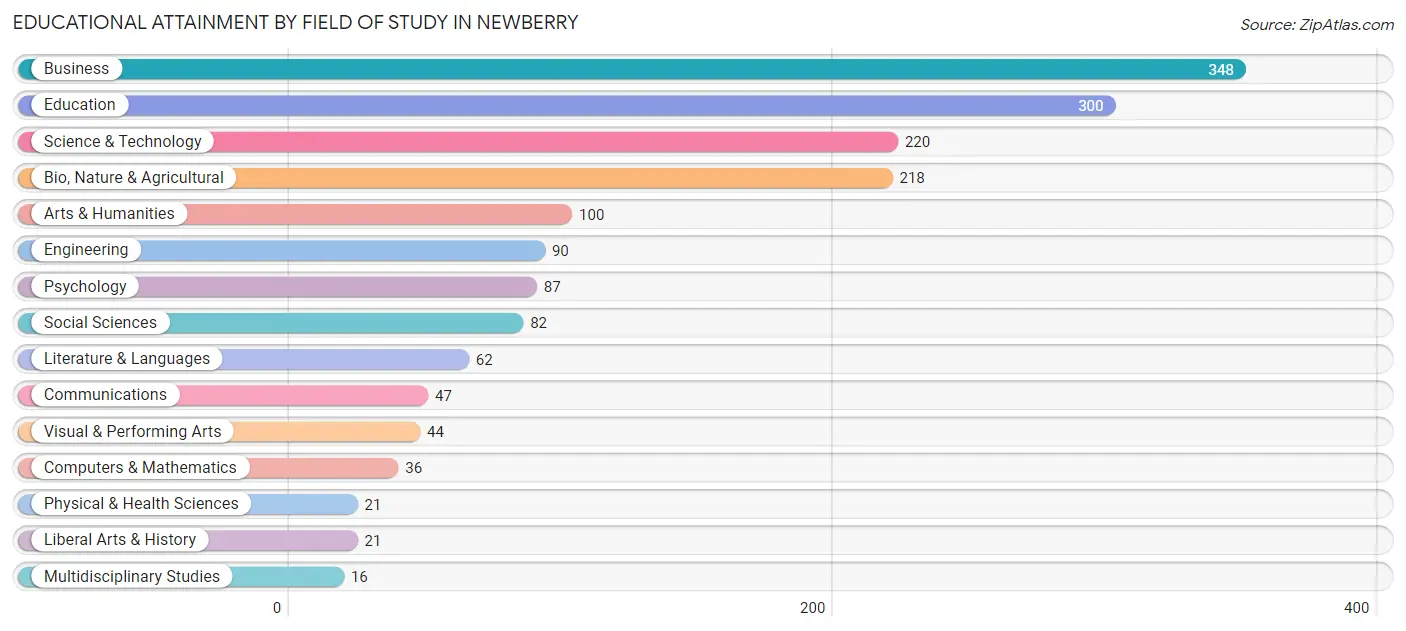
| Field of Study | # Graduates | % Graduates |
| Computers & Mathematics | 36 | 2.1% |
| Bio, Nature & Agricultural | 218 | 12.9% |
| Physical & Health Sciences | 21 | 1.2% |
| Psychology | 87 | 5.1% |
| Social Sciences | 82 | 4.9% |
| Engineering | 90 | 5.3% |
| Multidisciplinary Studies | 16 | 0.9% |
| Science & Technology | 220 | 13.0% |
| Business | 348 | 20.6% |
| Education | 300 | 17.7% |
| Literature & Languages | 62 | 3.7% |
| Liberal Arts & History | 21 | 1.2% |
| Visual & Performing Arts | 44 | 2.6% |
| Communications | 47 | 2.8% |
| Arts & Humanities | 100 | 5.9% |
| Total | 1,692 | 100.0% |
Transportation & Commute in Newberry
Vehicle Availability by Sex in Newberry
The most prevalent vehicle ownership categories in Newberry are males with 2 vehicles (972, accounting for 52.5%) and females with 2 vehicles (883, making up 66.8%).
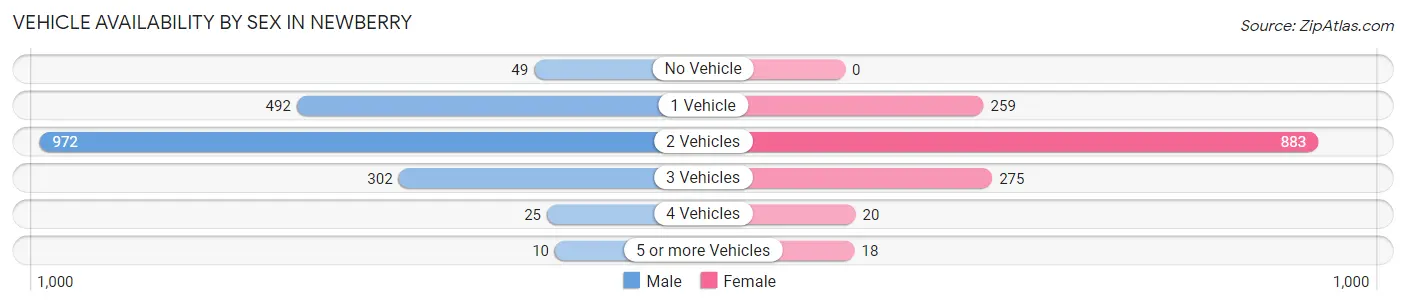
| Vehicles Available | Male | Female |
| No Vehicle | 49 (2.6%) | 0 (0.0%) |
| 1 Vehicle | 492 (26.6%) | 259 (17.8%) |
| 2 Vehicles | 972 (52.5%) | 883 (60.7%) |
| 3 Vehicles | 302 (16.3%) | 275 (18.9%) |
| 4 Vehicles | 25 (1.3%) | 20 (1.4%) |
| 5 or more Vehicles | 10 (0.5%) | 18 (1.2%) |
| Total | 1,850 (100.0%) | 1,455 (100.0%) |
Commute Time in Newberry
The most frequently occuring commute durations in Newberry are 30 to 34 minutes (569 commuters, 18.7%), 45 to 59 minutes (453 commuters, 14.9%), and 20 to 24 minutes (388 commuters, 12.8%).
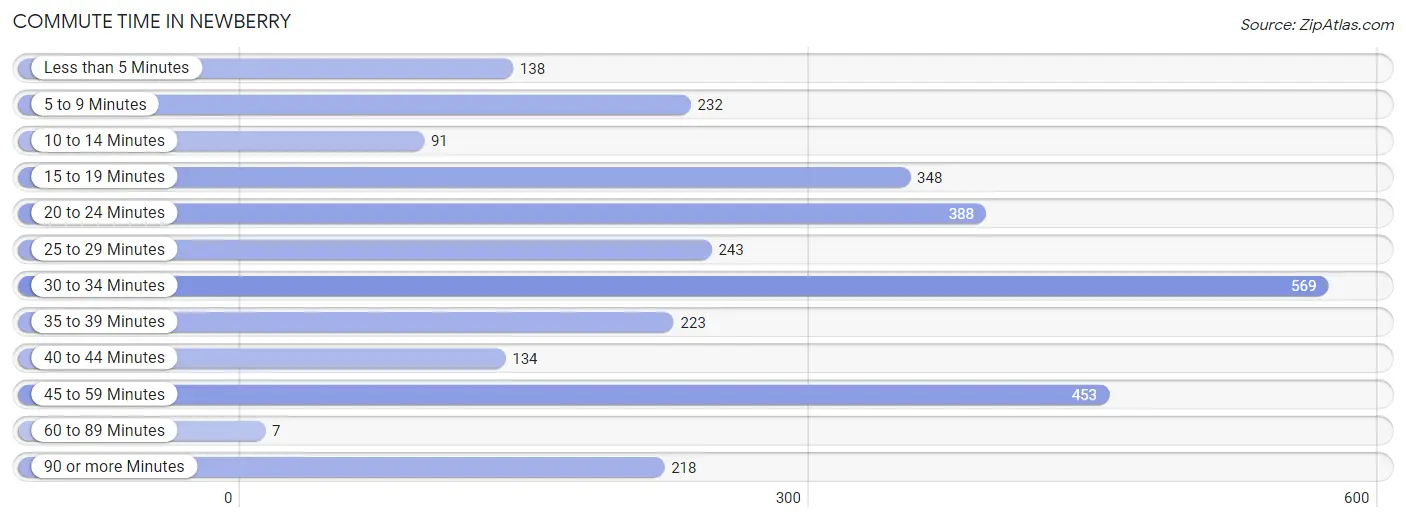
| Commute Time | # Commuters | % Commuters |
| Less than 5 Minutes | 138 | 4.5% |
| 5 to 9 Minutes | 232 | 7.6% |
| 10 to 14 Minutes | 91 | 3.0% |
| 15 to 19 Minutes | 348 | 11.4% |
| 20 to 24 Minutes | 388 | 12.8% |
| 25 to 29 Minutes | 243 | 8.0% |
| 30 to 34 Minutes | 569 | 18.7% |
| 35 to 39 Minutes | 223 | 7.3% |
| 40 to 44 Minutes | 134 | 4.4% |
| 45 to 59 Minutes | 453 | 14.9% |
| 60 to 89 Minutes | 7 | 0.2% |
| 90 or more Minutes | 218 | 7.2% |
Commute Time by Sex in Newberry
The most common commute times in Newberry are 30 to 34 minutes (286 commuters, 16.8%) for males and 30 to 34 minutes (283 commuters, 21.1%) for females.
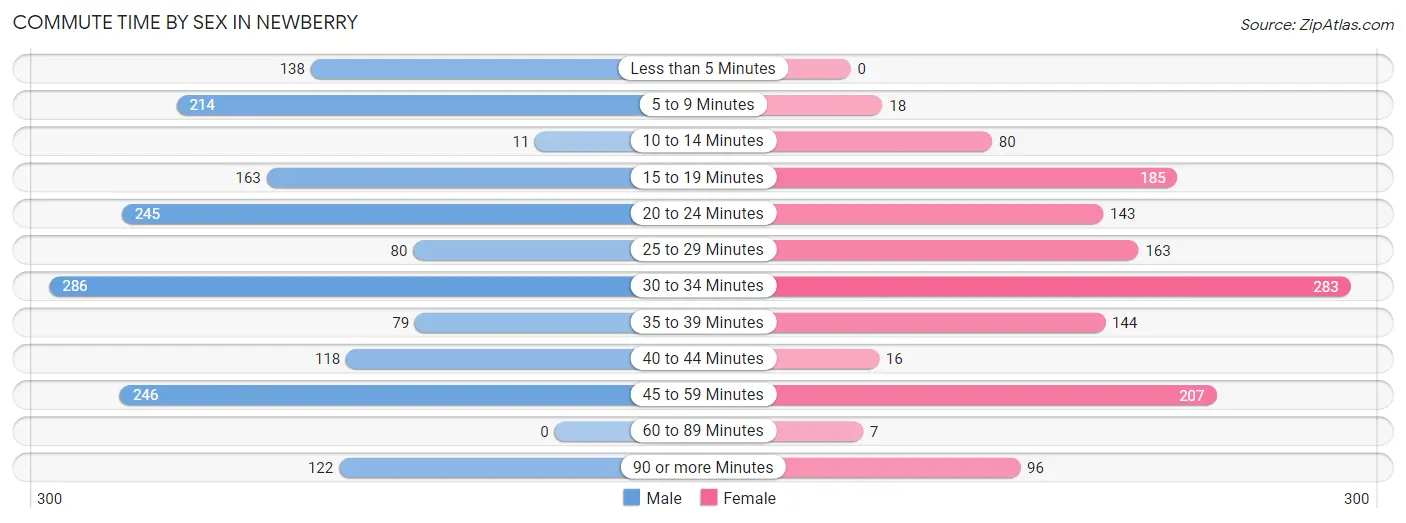
| Commute Time | Male | Female |
| Less than 5 Minutes | 138 (8.1%) | 0 (0.0%) |
| 5 to 9 Minutes | 214 (12.6%) | 18 (1.3%) |
| 10 to 14 Minutes | 11 (0.6%) | 80 (6.0%) |
| 15 to 19 Minutes | 163 (9.6%) | 185 (13.8%) |
| 20 to 24 Minutes | 245 (14.4%) | 143 (10.7%) |
| 25 to 29 Minutes | 80 (4.7%) | 163 (12.1%) |
| 30 to 34 Minutes | 286 (16.8%) | 283 (21.1%) |
| 35 to 39 Minutes | 79 (4.6%) | 144 (10.7%) |
| 40 to 44 Minutes | 118 (6.9%) | 16 (1.2%) |
| 45 to 59 Minutes | 246 (14.4%) | 207 (15.4%) |
| 60 to 89 Minutes | 0 (0.0%) | 7 (0.5%) |
| 90 or more Minutes | 122 (7.2%) | 96 (7.1%) |
Time of Departure to Work by Sex in Newberry
The most frequent times of departure to work in Newberry are 6:30 AM to 6:59 AM (446, 26.2%) for males and 7:00 AM to 7:29 AM (279, 20.8%) for females.
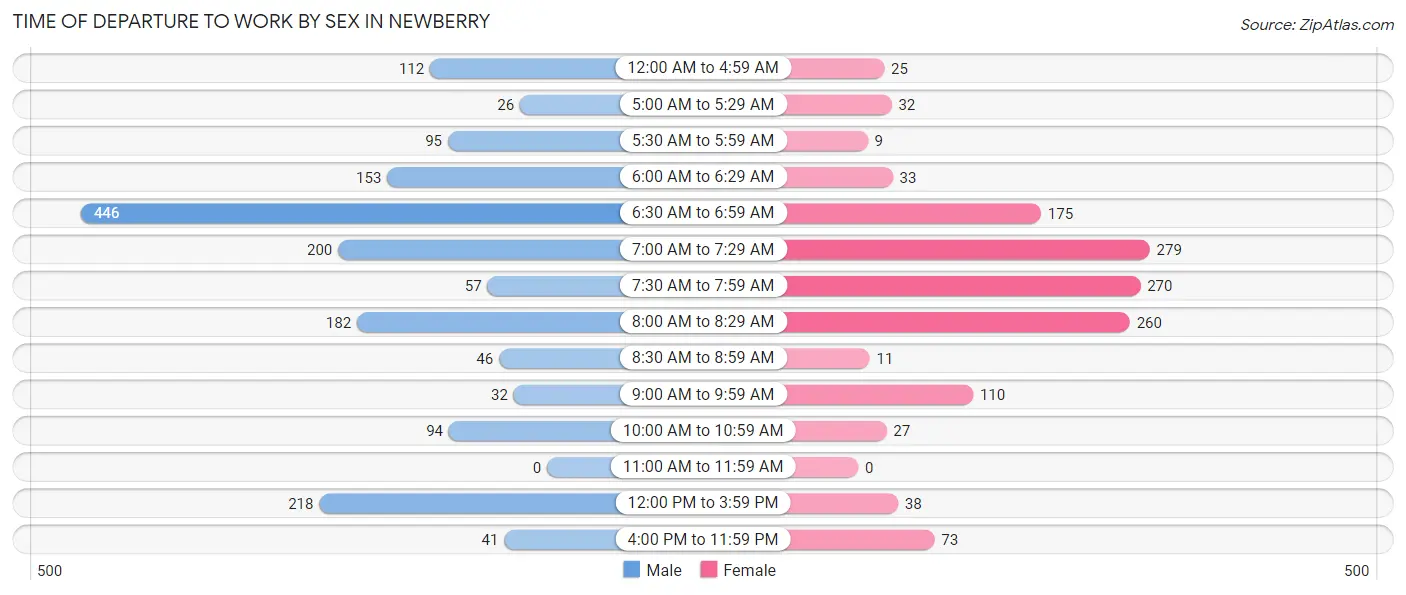
| Time of Departure | Male | Female |
| 12:00 AM to 4:59 AM | 112 (6.6%) | 25 (1.9%) |
| 5:00 AM to 5:29 AM | 26 (1.5%) | 32 (2.4%) |
| 5:30 AM to 5:59 AM | 95 (5.6%) | 9 (0.7%) |
| 6:00 AM to 6:29 AM | 153 (9.0%) | 33 (2.5%) |
| 6:30 AM to 6:59 AM | 446 (26.2%) | 175 (13.0%) |
| 7:00 AM to 7:29 AM | 200 (11.7%) | 279 (20.8%) |
| 7:30 AM to 7:59 AM | 57 (3.4%) | 270 (20.1%) |
| 8:00 AM to 8:29 AM | 182 (10.7%) | 260 (19.4%) |
| 8:30 AM to 8:59 AM | 46 (2.7%) | 11 (0.8%) |
| 9:00 AM to 9:59 AM | 32 (1.9%) | 110 (8.2%) |
| 10:00 AM to 10:59 AM | 94 (5.5%) | 27 (2.0%) |
| 11:00 AM to 11:59 AM | 0 (0.0%) | 0 (0.0%) |
| 12:00 PM to 3:59 PM | 218 (12.8%) | 38 (2.8%) |
| 4:00 PM to 11:59 PM | 41 (2.4%) | 73 (5.4%) |
| Total | 1,702 (100.0%) | 1,342 (100.0%) |
Housing Occupancy in Newberry
Occupancy by Ownership in Newberry
Of the total 2,649 dwellings in Newberry, owner-occupied units account for 2,328 (87.9%), while renter-occupied units make up 321 (12.1%).
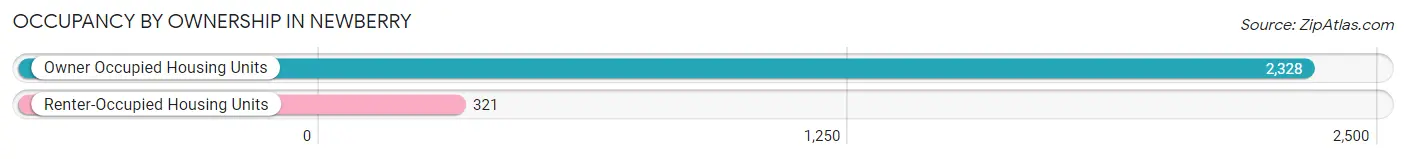
| Occupancy | # Housing Units | % Housing Units |
| Owner Occupied Housing Units | 2,328 | 87.9% |
| Renter-Occupied Housing Units | 321 | 12.1% |
| Total Occupied Housing Units | 2,649 | 100.0% |
Occupancy by Household Size in Newberry
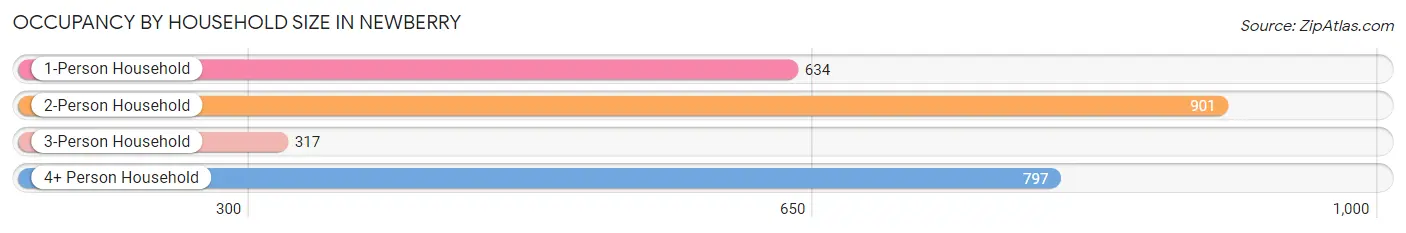
| Household Size | # Housing Units | % Housing Units |
| 1-Person Household | 634 | 23.9% |
| 2-Person Household | 901 | 34.0% |
| 3-Person Household | 317 | 12.0% |
| 4+ Person Household | 797 | 30.1% |
| Total Housing Units | 2,649 | 100.0% |
Occupancy by Ownership by Household Size in Newberry
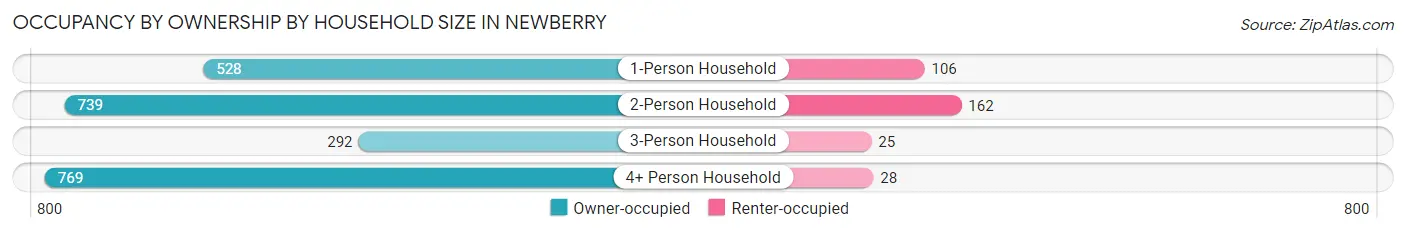
| Household Size | Owner-occupied | Renter-occupied |
| 1-Person Household | 528 (83.3%) | 106 (16.7%) |
| 2-Person Household | 739 (82.0%) | 162 (18.0%) |
| 3-Person Household | 292 (92.1%) | 25 (7.9%) |
| 4+ Person Household | 769 (96.5%) | 28 (3.5%) |
| Total Housing Units | 2,328 (87.9%) | 321 (12.1%) |
Occupancy by Educational Attainment in Newberry
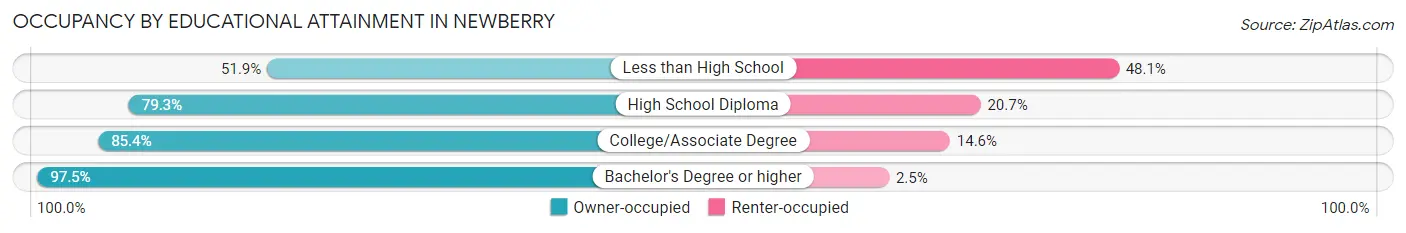
| Household Size | Owner-occupied | Renter-occupied |
| Less than High School | 27 (51.9%) | 25 (48.1%) |
| High School Diploma | 399 (79.3%) | 104 (20.7%) |
| College/Associate Degree | 982 (85.4%) | 168 (14.6%) |
| Bachelor's Degree or higher | 920 (97.5%) | 24 (2.5%) |
Occupancy by Age of Householder in Newberry
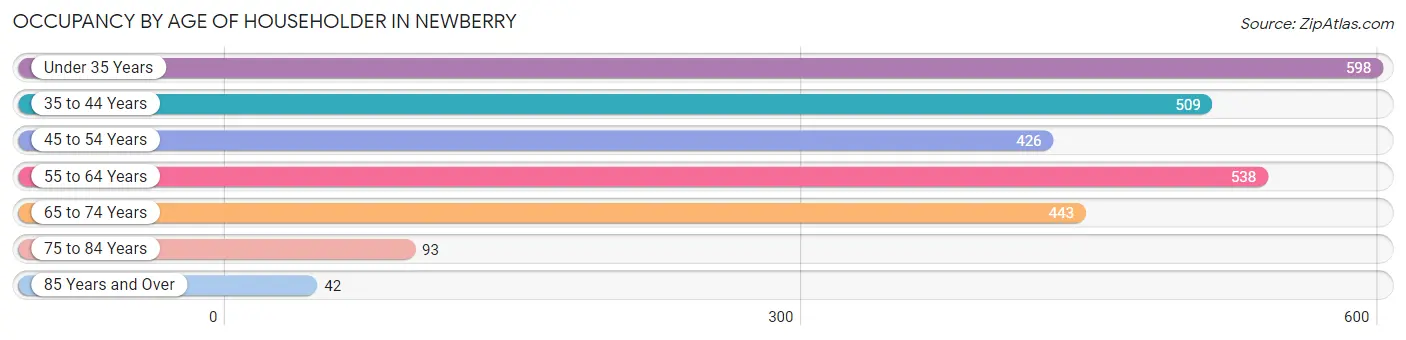
| Age Bracket | # Households | % Households |
| Under 35 Years | 598 | 22.6% |
| 35 to 44 Years | 509 | 19.2% |
| 45 to 54 Years | 426 | 16.1% |
| 55 to 64 Years | 538 | 20.3% |
| 65 to 74 Years | 443 | 16.7% |
| 75 to 84 Years | 93 | 3.5% |
| 85 Years and Over | 42 | 1.6% |
| Total | 2,649 | 100.0% |
Housing Finances in Newberry
Median Income by Occupancy in Newberry
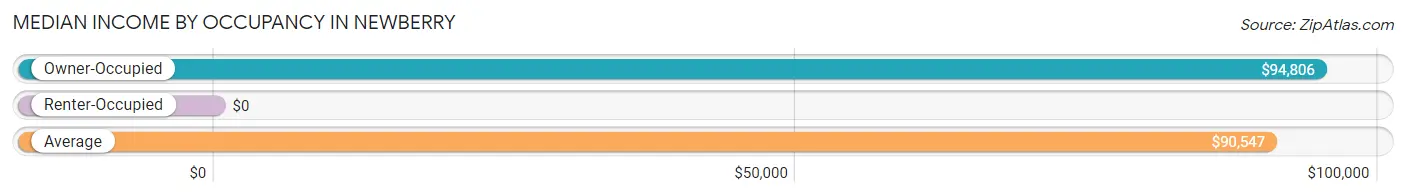
| Occupancy Type | # Households | Median Income |
| Owner-Occupied | 2,328 (87.9%) | $94,806 |
| Renter-Occupied | 321 (12.1%) | $0 |
| Average | 2,649 (100.0%) | $90,547 |
Occupancy by Householder Income Bracket in Newberry
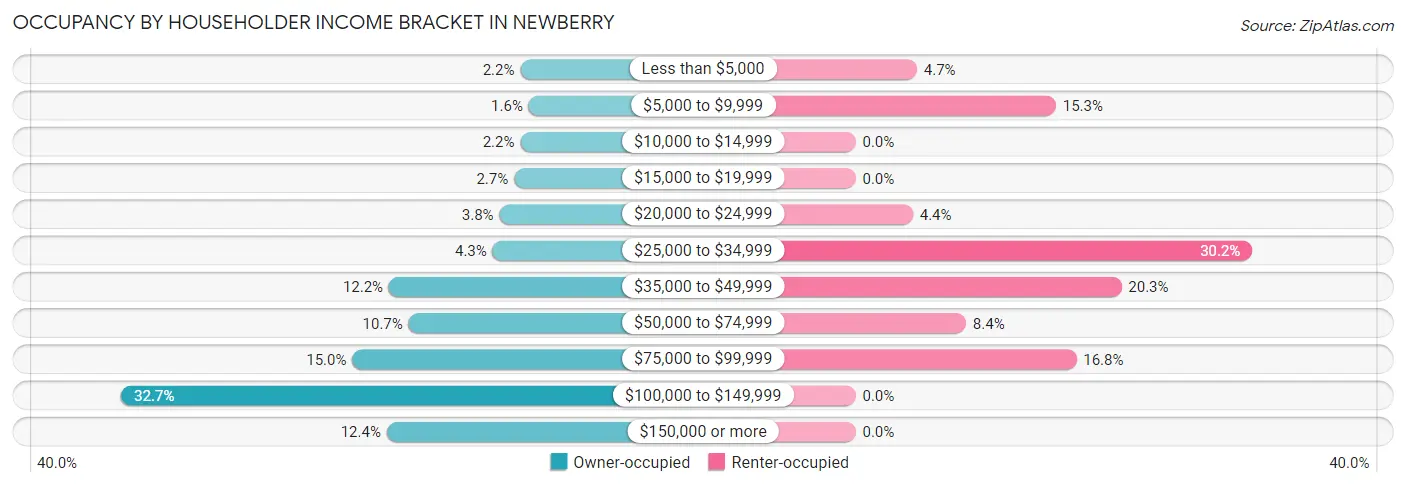
| Income Bracket | Owner-occupied | Renter-occupied |
| Less than $5,000 | 52 (2.2%) | 15 (4.7%) |
| $5,000 to $9,999 | 37 (1.6%) | 49 (15.3%) |
| $10,000 to $14,999 | 52 (2.2%) | 0 (0.0%) |
| $15,000 to $19,999 | 63 (2.7%) | 0 (0.0%) |
| $20,000 to $24,999 | 89 (3.8%) | 14 (4.4%) |
| $25,000 to $34,999 | 101 (4.3%) | 97 (30.2%) |
| $35,000 to $49,999 | 285 (12.2%) | 65 (20.3%) |
| $50,000 to $74,999 | 250 (10.7%) | 27 (8.4%) |
| $75,000 to $99,999 | 350 (15.0%) | 54 (16.8%) |
| $100,000 to $149,999 | 760 (32.7%) | 0 (0.0%) |
| $150,000 or more | 289 (12.4%) | 0 (0.0%) |
| Total | 2,328 (100.0%) | 321 (100.0%) |
Monthly Housing Cost Tiers in Newberry
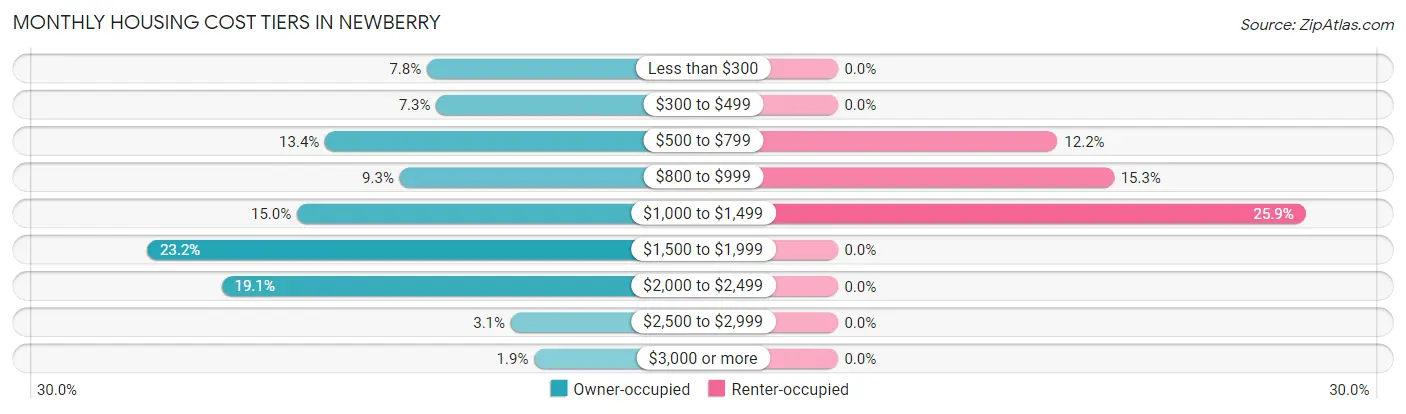
| Monthly Cost | Owner-occupied | Renter-occupied |
| Less than $300 | 181 (7.8%) | 0 (0.0%) |
| $300 to $499 | 169 (7.3%) | 0 (0.0%) |
| $500 to $799 | 312 (13.4%) | 39 (12.1%) |
| $800 to $999 | 216 (9.3%) | 49 (15.3%) |
| $1,000 to $1,499 | 348 (14.9%) | 83 (25.9%) |
| $1,500 to $1,999 | 541 (23.2%) | 0 (0.0%) |
| $2,000 to $2,499 | 445 (19.1%) | 0 (0.0%) |
| $2,500 to $2,999 | 73 (3.1%) | 0 (0.0%) |
| $3,000 or more | 43 (1.8%) | 0 (0.0%) |
| Total | 2,328 (100.0%) | 321 (100.0%) |
Physical Housing Characteristics in Newberry
Housing Structures in Newberry
| Structure Type | # Housing Units | % Housing Units |
| Single Unit, Detached | 2,388 | 90.1% |
| Single Unit, Attached | 0 | 0.0% |
| 2 Unit Apartments | 0 | 0.0% |
| 3 or 4 Unit Apartments | 61 | 2.3% |
| 5 to 9 Unit Apartments | 10 | 0.4% |
| 10 or more Apartments | 0 | 0.0% |
| Mobile Home / Other | 190 | 7.2% |
| Total | 2,649 | 100.0% |
Housing Structures by Occupancy in Newberry
| Structure Type | Owner-occupied | Renter-occupied |
| Single Unit, Detached | 2,198 (92.0%) | 190 (8.0%) |
| Single Unit, Attached | 0 (0.0%) | 0 (0.0%) |
| 2 Unit Apartments | 0 (0.0%) | 0 (0.0%) |
| 3 or 4 Unit Apartments | 0 (0.0%) | 61 (100.0%) |
| 5 to 9 Unit Apartments | 10 (100.0%) | 0 (0.0%) |
| 10 or more Apartments | 0 (0.0%) | 0 (0.0%) |
| Mobile Home / Other | 120 (63.2%) | 70 (36.8%) |
| Total | 2,328 (87.9%) | 321 (12.1%) |
Housing Structures by Number of Rooms in Newberry
| Number of Rooms | Owner-occupied | Renter-occupied |
| 1 Room | 0 (0.0%) | 0 (0.0%) |
| 2 or 3 Rooms | 61 (2.6%) | 171 (53.3%) |
| 4 or 5 Rooms | 689 (29.6%) | 65 (20.3%) |
| 6 or 7 Rooms | 1,104 (47.4%) | 60 (18.7%) |
| 8 or more Rooms | 474 (20.4%) | 25 (7.8%) |
| Total | 2,328 (100.0%) | 321 (100.0%) |
Housing Structure by Heating Type in Newberry
| Heating Type | Owner-occupied | Renter-occupied |
| Utility Gas | 450 (19.3%) | 0 (0.0%) |
| Bottled, Tank, or LP Gas | 51 (2.2%) | 15 (4.7%) |
| Electricity | 1,827 (78.5%) | 306 (95.3%) |
| Fuel Oil or Kerosene | 0 (0.0%) | 0 (0.0%) |
| Coal or Coke | 0 (0.0%) | 0 (0.0%) |
| All other Fuels | 0 (0.0%) | 0 (0.0%) |
| No Fuel Used | 0 (0.0%) | 0 (0.0%) |
| Total | 2,328 (100.0%) | 321 (100.0%) |
Household Vehicle Usage in Newberry
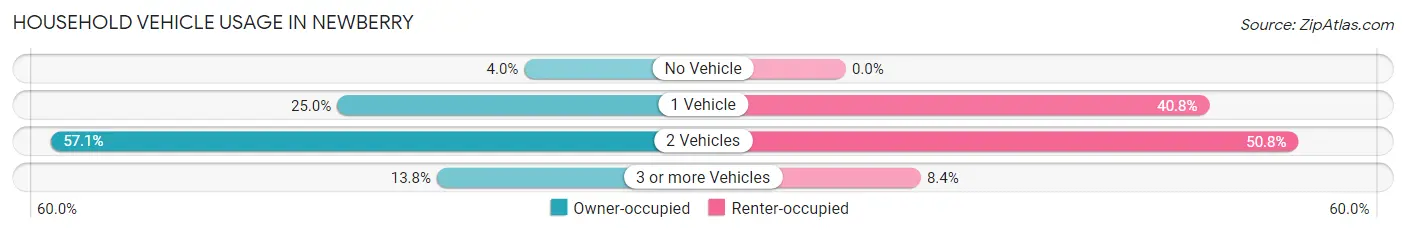
| Vehicles per Household | Owner-occupied | Renter-occupied |
| No Vehicle | 94 (4.0%) | 0 (0.0%) |
| 1 Vehicle | 582 (25.0%) | 131 (40.8%) |
| 2 Vehicles | 1,330 (57.1%) | 163 (50.8%) |
| 3 or more Vehicles | 322 (13.8%) | 27 (8.4%) |
| Total | 2,328 (100.0%) | 321 (100.0%) |
Real Estate & Mortgages in Newberry
Real Estate and Mortgage Overview in Newberry
| Characteristic | Without Mortgage | With Mortgage |
| Housing Units | 659 | 1,669 |
| Median Property Value | $192,100 | $274,400 |
| Median Household Income | $66,172 | $279 |
| Monthly Housing Costs | $492 | $43 |
| Real Estate Taxes | $1,473 | $70 |
Property Value by Mortgage Status in Newberry
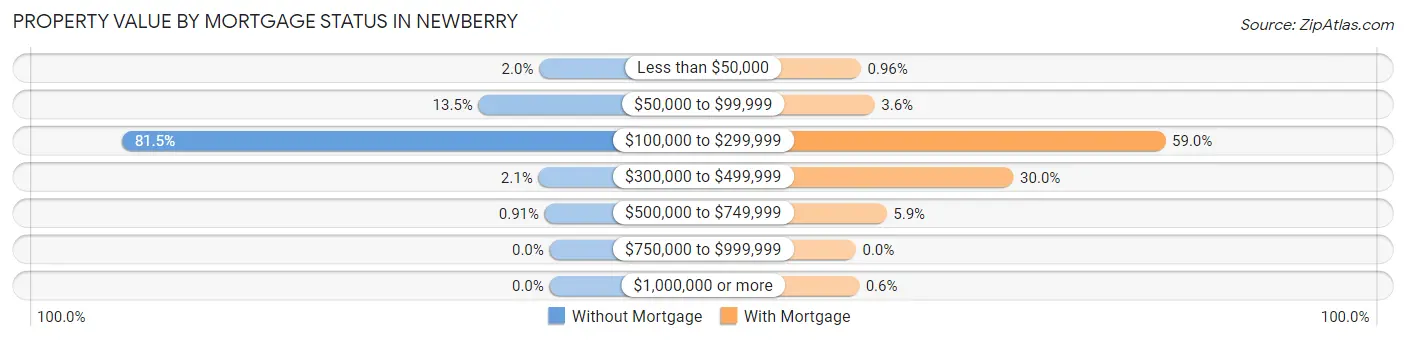
| Property Value | Without Mortgage | With Mortgage |
| Less than $50,000 | 13 (2.0%) | 16 (1.0%) |
| $50,000 to $99,999 | 89 (13.5%) | 60 (3.6%) |
| $100,000 to $299,999 | 537 (81.5%) | 984 (59.0%) |
| $300,000 to $499,999 | 14 (2.1%) | 501 (30.0%) |
| $500,000 to $749,999 | 6 (0.9%) | 98 (5.9%) |
| $750,000 to $999,999 | 0 (0.0%) | 0 (0.0%) |
| $1,000,000 or more | 0 (0.0%) | 10 (0.6%) |
| Total | 659 (100.0%) | 1,669 (100.0%) |
Household Income by Mortgage Status in Newberry
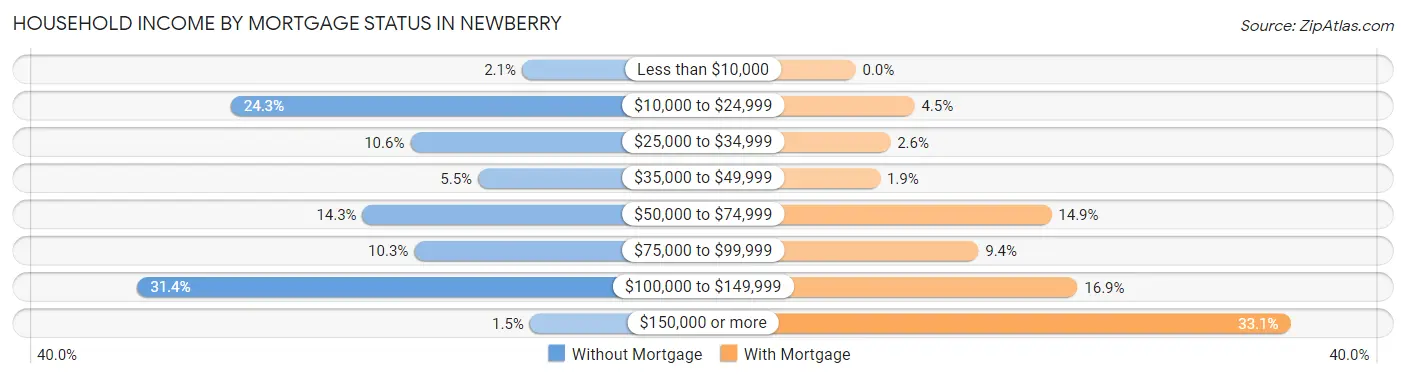
| Household Income | Without Mortgage | With Mortgage |
| Less than $10,000 | 14 (2.1%) | 0 (0.0%) |
| $10,000 to $24,999 | 160 (24.3%) | 75 (4.5%) |
| $25,000 to $34,999 | 70 (10.6%) | 44 (2.6%) |
| $35,000 to $49,999 | 36 (5.5%) | 31 (1.9%) |
| $50,000 to $74,999 | 94 (14.3%) | 249 (14.9%) |
| $75,000 to $99,999 | 68 (10.3%) | 156 (9.3%) |
| $100,000 to $149,999 | 207 (31.4%) | 282 (16.9%) |
| $150,000 or more | 10 (1.5%) | 553 (33.1%) |
| Total | 659 (100.0%) | 1,669 (100.0%) |
Property Value to Household Income Ratio in Newberry
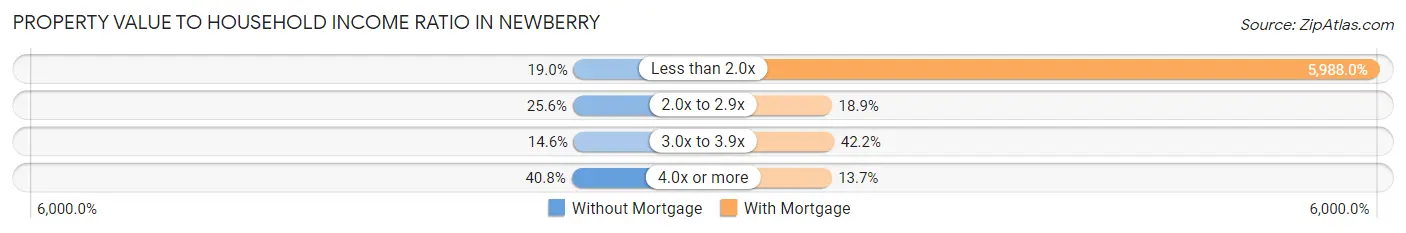
| Value-to-Income Ratio | Without Mortgage | With Mortgage |
| Less than 2.0x | 125 (19.0%) | 99,939 (5,988.0%) |
| 2.0x to 2.9x | 169 (25.6%) | 316 (18.9%) |
| 3.0x to 3.9x | 96 (14.6%) | 704 (42.2%) |
| 4.0x or more | 269 (40.8%) | 228 (13.7%) |
| Total | 659 (100.0%) | 1,669 (100.0%) |
Real Estate Taxes by Mortgage Status in Newberry
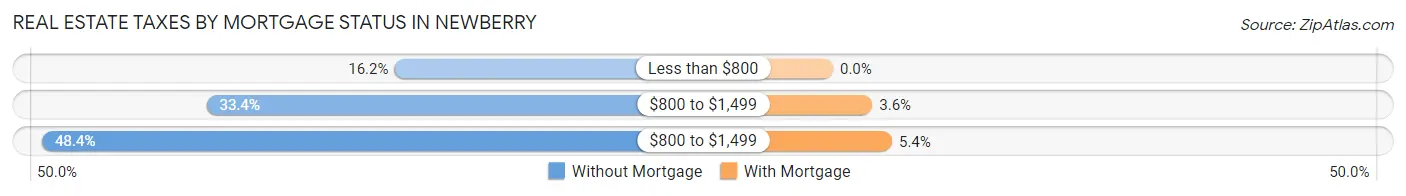
| Property Taxes | Without Mortgage | With Mortgage |
| Less than $800 | 107 (16.2%) | 0 (0.0%) |
| $800 to $1,499 | 220 (33.4%) | 60 (3.6%) |
| $800 to $1,499 | 319 (48.4%) | 90 (5.4%) |
| Total | 659 (100.0%) | 1,669 (100.0%) |
Health & Disability in Newberry
Health Insurance Coverage by Age in Newberry
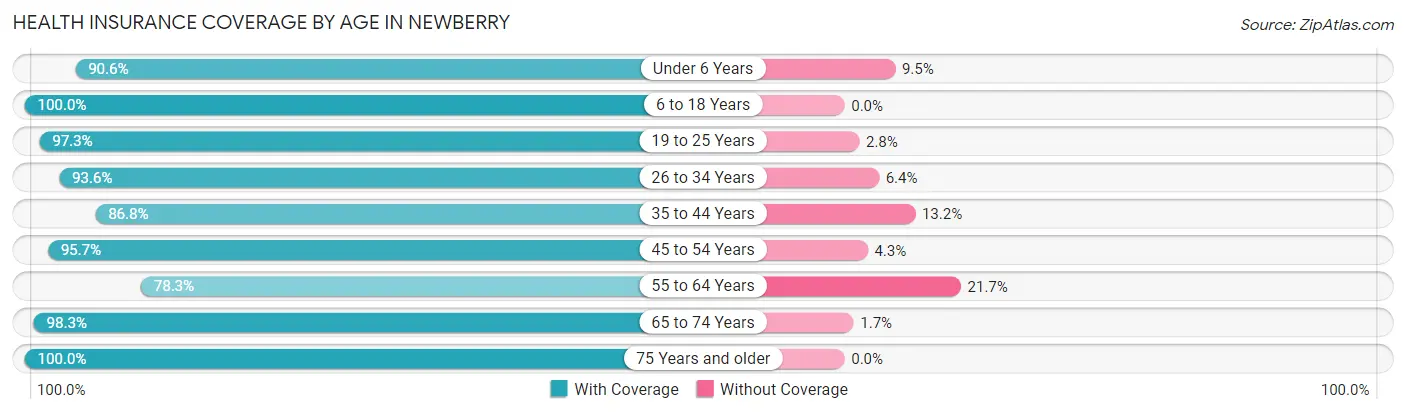
| Age Bracket | With Coverage | Without Coverage |
| Under 6 Years | 613 (90.5%) | 64 (9.5%) |
| 6 to 18 Years | 1,620 (100.0%) | 0 (0.0%) |
| 19 to 25 Years | 531 (97.3%) | 15 (2.8%) |
| 26 to 34 Years | 948 (93.6%) | 65 (6.4%) |
| 35 to 44 Years | 889 (86.8%) | 135 (13.2%) |
| 45 to 54 Years | 819 (95.7%) | 37 (4.3%) |
| 55 to 64 Years | 639 (78.3%) | 177 (21.7%) |
| 65 to 74 Years | 639 (98.3%) | 11 (1.7%) |
| 75 Years and older | 199 (100.0%) | 0 (0.0%) |
| Total | 6,897 (93.2%) | 504 (6.8%) |
Health Insurance Coverage by Citizenship Status in Newberry
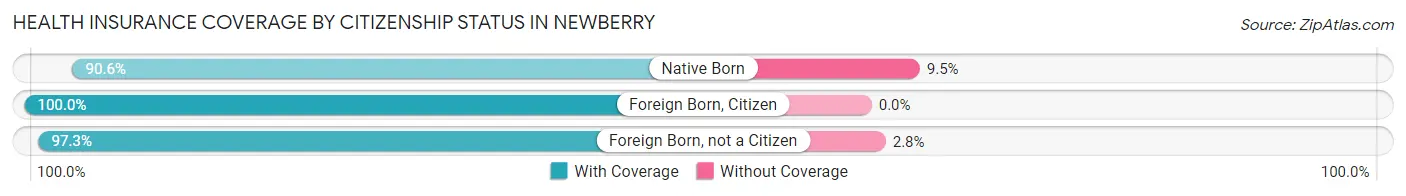
| Citizenship Status | With Coverage | Without Coverage |
| Native Born | 613 (90.5%) | 64 (9.5%) |
| Foreign Born, Citizen | 1,620 (100.0%) | 0 (0.0%) |
| Foreign Born, not a Citizen | 531 (97.3%) | 15 (2.8%) |
Health Insurance Coverage by Household Income in Newberry
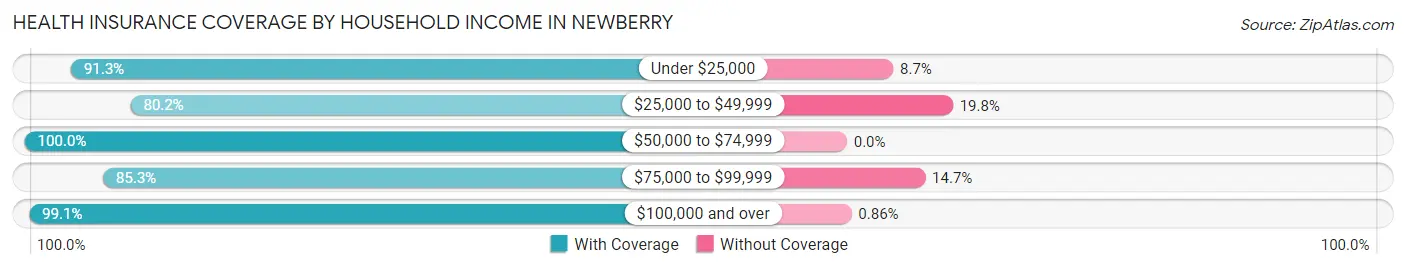
| Household Income | With Coverage | Without Coverage |
| Under $25,000 | 768 (91.3%) | 73 (8.7%) |
| $25,000 to $49,999 | 881 (80.2%) | 218 (19.8%) |
| $50,000 to $74,999 | 737 (100.0%) | 0 (0.0%) |
| $75,000 to $99,999 | 1,064 (85.3%) | 183 (14.7%) |
| $100,000 and over | 3,447 (99.1%) | 30 (0.9%) |
Public vs Private Health Insurance Coverage by Age in Newberry
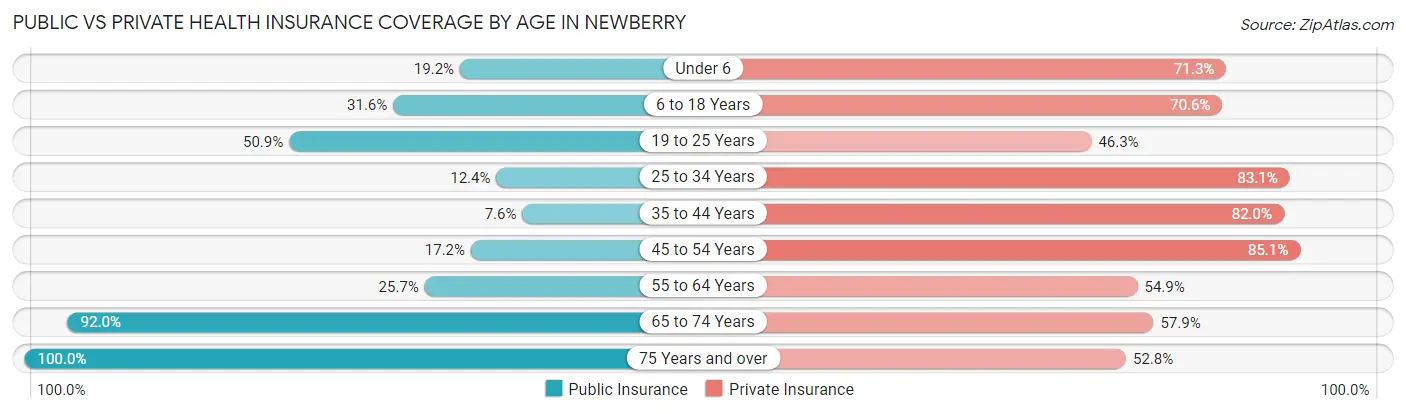
| Age Bracket | Public Insurance | Private Insurance |
| Under 6 | 130 (19.2%) | 483 (71.3%) |
| 6 to 18 Years | 512 (31.6%) | 1,144 (70.6%) |
| 19 to 25 Years | 278 (50.9%) | 253 (46.3%) |
| 25 to 34 Years | 126 (12.4%) | 842 (83.1%) |
| 35 to 44 Years | 78 (7.6%) | 840 (82.0%) |
| 45 to 54 Years | 147 (17.2%) | 728 (85.1%) |
| 55 to 64 Years | 210 (25.7%) | 448 (54.9%) |
| 65 to 74 Years | 598 (92.0%) | 376 (57.9%) |
| 75 Years and over | 199 (100.0%) | 105 (52.8%) |
| Total | 2,278 (30.8%) | 5,219 (70.5%) |
Disability Status by Sex by Age in Newberry
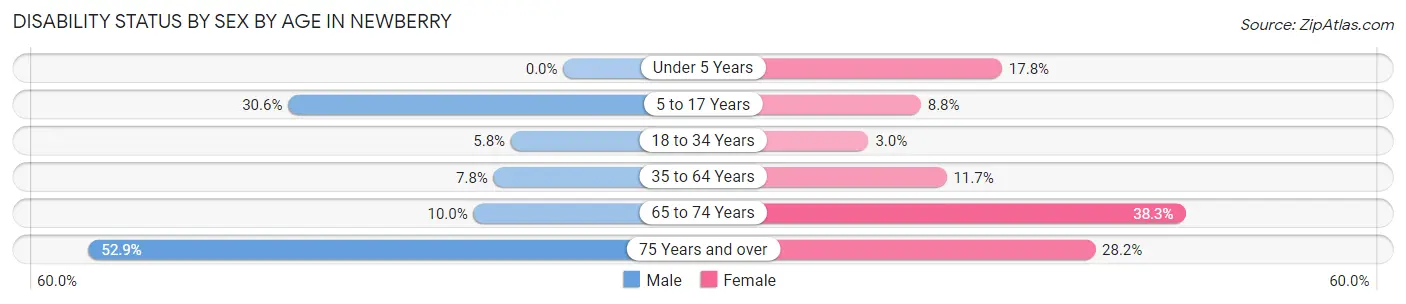
| Age Bracket | Male | Female |
| Under 5 Years | 0 (0.0%) | 51 (17.8%) |
| 5 to 17 Years | 224 (30.6%) | 71 (8.8%) |
| 18 to 34 Years | 63 (5.8%) | 19 (3.0%) |
| 35 to 64 Years | 104 (7.8%) | 158 (11.7%) |
| 65 to 74 Years | 25 (10.0%) | 153 (38.3%) |
| 75 Years and over | 64 (52.9%) | 22 (28.2%) |
Disability Class by Sex by Age in Newberry
Disability Class: Hearing Difficulty
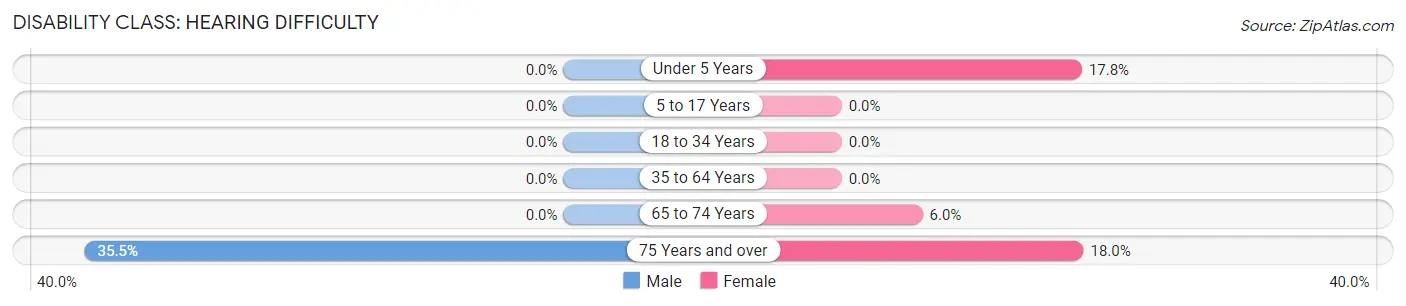
| Age Bracket | Male | Female |
| Under 5 Years | 0 (0.0%) | 51 (17.8%) |
| 5 to 17 Years | 0 (0.0%) | 0 (0.0%) |
| 18 to 34 Years | 0 (0.0%) | 0 (0.0%) |
| 35 to 64 Years | 0 (0.0%) | 0 (0.0%) |
| 65 to 74 Years | 0 (0.0%) | 24 (6.0%) |
| 75 Years and over | 43 (35.5%) | 14 (17.9%) |
Disability Class: Vision Difficulty
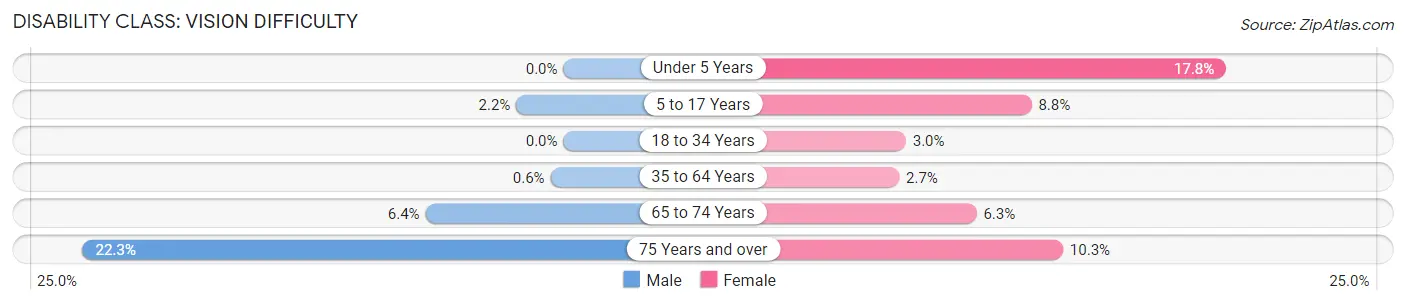
| Age Bracket | Male | Female |
| Under 5 Years | 0 (0.0%) | 51 (17.8%) |
| 5 to 17 Years | 16 (2.2%) | 71 (8.8%) |
| 18 to 34 Years | 0 (0.0%) | 19 (3.0%) |
| 35 to 64 Years | 8 (0.6%) | 36 (2.7%) |
| 65 to 74 Years | 16 (6.4%) | 25 (6.2%) |
| 75 Years and over | 27 (22.3%) | 8 (10.3%) |
Disability Class: Cognitive Difficulty
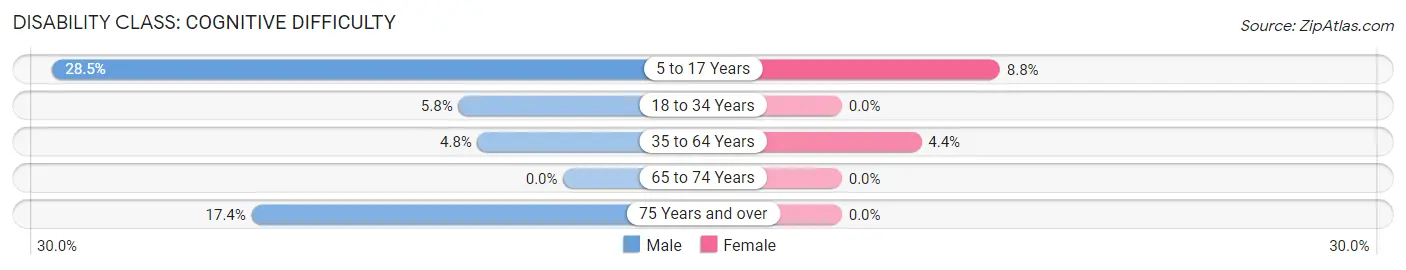
| Age Bracket | Male | Female |
| 5 to 17 Years | 208 (28.4%) | 71 (8.8%) |
| 18 to 34 Years | 63 (5.8%) | 0 (0.0%) |
| 35 to 64 Years | 64 (4.8%) | 60 (4.4%) |
| 65 to 74 Years | 0 (0.0%) | 0 (0.0%) |
| 75 Years and over | 21 (17.4%) | 0 (0.0%) |
Disability Class: Ambulatory Difficulty
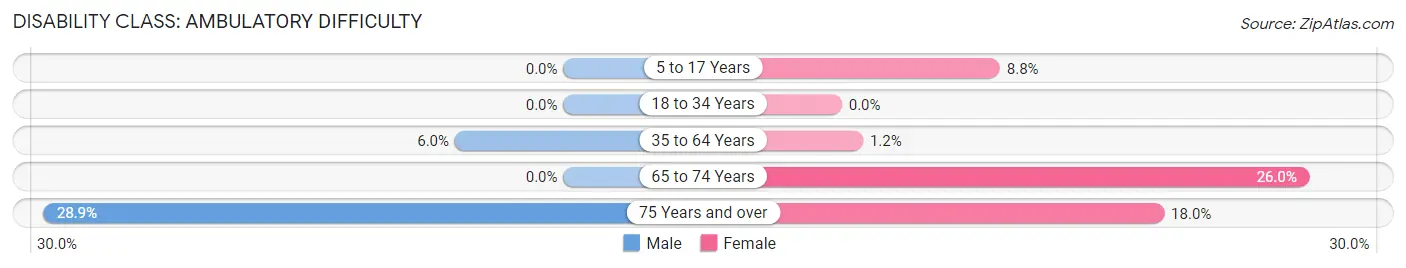
| Age Bracket | Male | Female |
| 5 to 17 Years | 0 (0.0%) | 71 (8.8%) |
| 18 to 34 Years | 0 (0.0%) | 0 (0.0%) |
| 35 to 64 Years | 81 (6.0%) | 16 (1.2%) |
| 65 to 74 Years | 0 (0.0%) | 104 (26.0%) |
| 75 Years and over | 35 (28.9%) | 14 (17.9%) |
Disability Class: Self-Care Difficulty
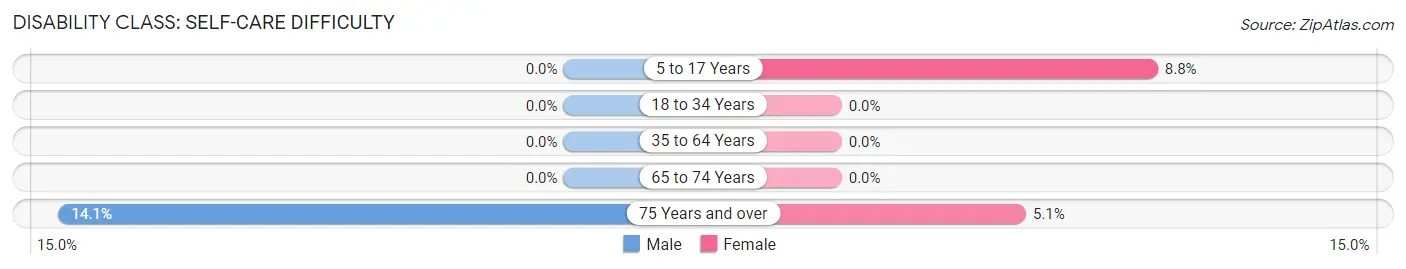
| Age Bracket | Male | Female |
| 5 to 17 Years | 0 (0.0%) | 71 (8.8%) |
| 18 to 34 Years | 0 (0.0%) | 0 (0.0%) |
| 35 to 64 Years | 0 (0.0%) | 0 (0.0%) |
| 65 to 74 Years | 0 (0.0%) | 0 (0.0%) |
| 75 Years and over | 17 (14.1%) | 4 (5.1%) |
Technology Access in Newberry
Computing Device Access in Newberry
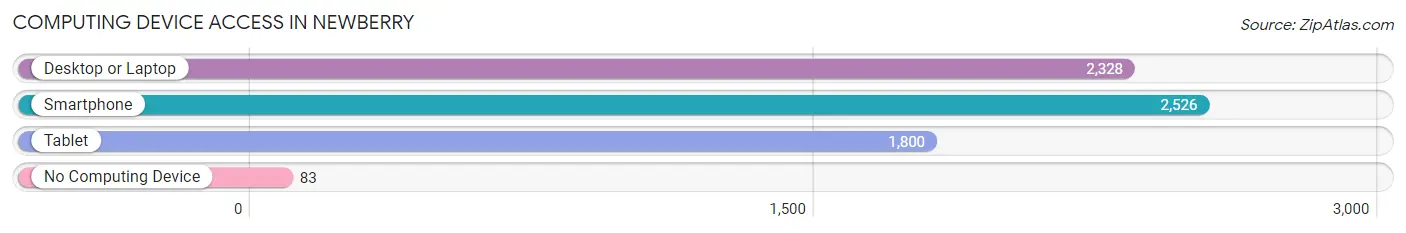
| Device Type | # Households | % Households |
| Desktop or Laptop | 2,328 | 87.9% |
| Smartphone | 2,526 | 95.4% |
| Tablet | 1,800 | 67.9% |
| No Computing Device | 83 | 3.1% |
| Total | 2,649 | 100.0% |
Internet Access in Newberry
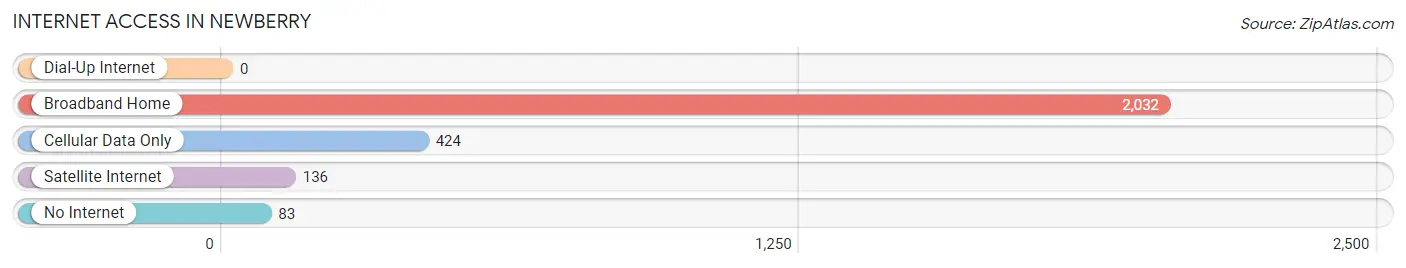
| Internet Type | # Households | % Households |
| Dial-Up Internet | 0 | 0.0% |
| Broadband Home | 2,032 | 76.7% |
| Cellular Data Only | 424 | 16.0% |
| Satellite Internet | 136 | 5.1% |
| No Internet | 83 | 3.1% |
| Total | 2,649 | 100.0% |
Newberry Summary
Newberry, Florida is a small city located in Alachua County, Florida. It is situated in the north-central part of the state, approximately 20 miles west of Gainesville. The city has a population of approximately 5,000 people and covers an area of 4.2 square miles.
History
Newberry was founded in 1873 by a group of settlers from Newberry, South Carolina. The town was named after the South Carolina town, and the settlers brought with them many of the same traditions and customs. The town was incorporated in 1885 and was the first incorporated town in Alachua County.
The town was originally a farming community, and the main crops were cotton, corn, and tobacco. The town also had a sawmill and a gristmill. In the early 1900s, the town began to grow and develop. The first bank was established in 1906, and the first post office was established in 1907.
In the 1920s, the town began to experience a period of growth and development. The first paved road was built in 1923, and the first school was built in 1924. The town also had a movie theater, a hotel, and a variety of stores.
Geography
Newberry is located in north-central Florida, approximately 20 miles west of Gainesville. The city is situated in the rolling hills of the Florida panhandle. The city is bordered by the Santa Fe River to the east and the Suwannee River to the west. The city is also located near several state parks, including Paynes Prairie State Park and O’Leno State Park.
The climate in Newberry is subtropical, with hot, humid summers and mild winters. The average temperature in the summer is around 90 degrees Fahrenheit, and the average temperature in the winter is around 60 degrees Fahrenheit.
Economy
The economy of Newberry is largely based on agriculture. The main crops grown in the area are cotton, corn, and tobacco. The city also has a number of small businesses, including restaurants, retail stores, and service providers.
The city is also home to several large employers, including the University of Florida, Shands Hospital, and the Alachua County School District. The city is also home to several manufacturing companies, including a paper mill and a plastics factory.
Demographics
As of the 2010 census, the population of Newberry was 5,099. The racial makeup of the city was 73.3% White, 19.2% African American, 0.4% Native American, 0.7% Asian, and 5.4% from other races. The median household income was $37,945, and the median family income was $45,945.
The city is served by the Alachua County School District, which includes three elementary schools, one middle school, and one high school. The city is also home to several private schools, including a Catholic school and a Montessori school.
Newberry is a small city with a rich history and a vibrant economy. The city is home to a diverse population and is served by a number of excellent schools. The city is also located near several state parks, making it a great place to visit and explore.
Common Questions
What is Per Capita Income in Newberry?
Per Capita income in Newberry is $30,935.
What is the Median Family Income in Newberry?
Median Family Income in Newberry is $106,154.
What is the Median Household income in Newberry?
Median Household Income in Newberry is $90,547.
What is Income or Wage Gap in Newberry?
Income or Wage Gap in Newberry is 22.2%.
Women in Newberry earn 77.8 cents for every dollar earned by a man.
What is Inequality or Gini Index in Newberry?
Inequality or Gini Index in Newberry is 0.35.
What is the Total Population of Newberry?
Total Population of Newberry is 7,401.
What is the Total Male Population of Newberry?
Total Male Population of Newberry is 3,836.
What is the Total Female Population of Newberry?
Total Female Population of Newberry is 3,565.
What is the Ratio of Males per 100 Females in Newberry?
There are 107.60 Males per 100 Females in Newberry.
What is the Ratio of Females per 100 Males in Newberry?
There are 92.94 Females per 100 Males in Newberry.
What is the Median Population Age in Newberry?
Median Population Age in Newberry is 33.0 Years.
What is the Average Family Size in Newberry
Average Family Size in Newberry is 3.4 People.
What is the Average Household Size in Newberry
Average Household Size in Newberry is 2.8 People.
How Large is the Labor Force in Newberry?
There are 3,578 People in the Labor Forcein in Newberry.
What is the Percentage of People in the Labor Force in Newberry?
64.0% of People are in the Labor Force in Newberry.
What is the Unemployment Rate in Newberry?
Unemployment Rate in Newberry is 5.4%.