Woodlawn Beach, FL Map & Demographics
Woodlawn Beach Map
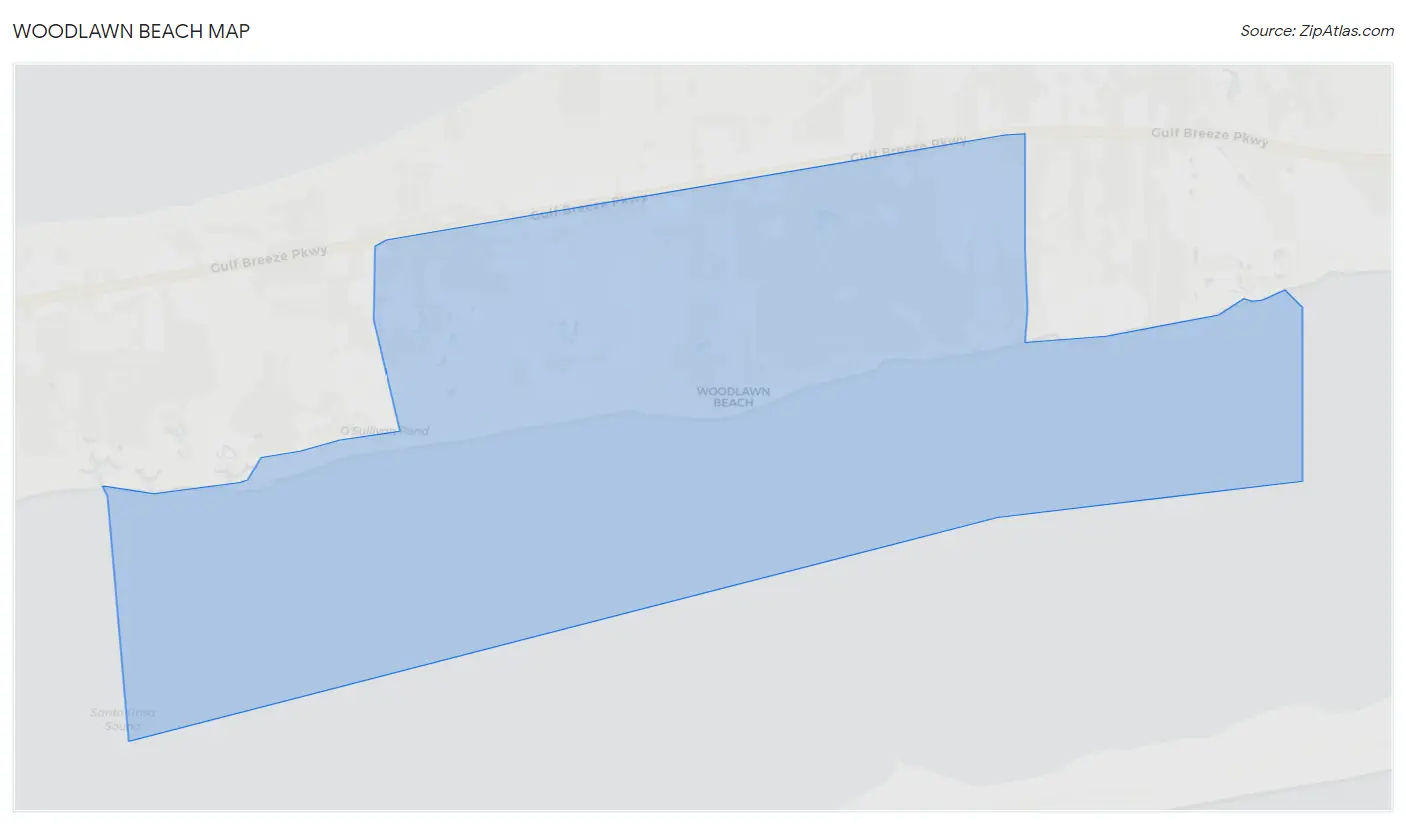
Woodlawn Beach Overview
$45,436
PER CAPITA INCOME
$117,744
AVG FAMILY INCOME
$107,321
AVG HOUSEHOLD INCOME
59.2%
WAGE / INCOME GAP [ % ]
40.8¢/ $1
WAGE / INCOME GAP [ $ ]
0.29
INEQUALITY / GINI INDEX
3,128
TOTAL POPULATION
1,606
MALE POPULATION
1,522
FEMALE POPULATION
105.52
MALES / 100 FEMALES
94.77
FEMALES / 100 MALES
41.1
MEDIAN AGE
2.8
AVG FAMILY SIZE
2.6
AVG HOUSEHOLD SIZE
1,505
LABOR FORCE [ PEOPLE ]
58.6%
PERCENT IN LABOR FORCE
3.8%
UNEMPLOYMENT RATE
Income in Woodlawn Beach
Income Overview in Woodlawn Beach
Per Capita Income in Woodlawn Beach is $45,436, while median incomes of families and households are $117,744 and $107,321 respectively.
| Characteristic | Number | Measure |
| Per Capita Income | 3,128 | $45,436 |
| Median Family Income | 1,001 | $117,744 |
| Mean Family Income | 1,001 | $126,086 |
| Median Household Income | 1,221 | $107,321 |
| Mean Household Income | 1,221 | $114,916 |
| Income Deficit | 1,001 | $0 |
| Wage / Income Gap (%) | 3,128 | 59.24% |
| Wage / Income Gap ($) | 3,128 | 40.76¢ per $1 |
| Gini / Inequality Index | 3,128 | 0.29 |
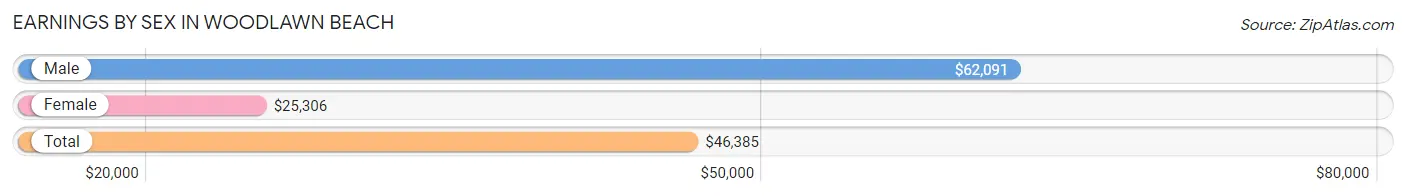
Earnings by Sex in Woodlawn Beach
Average Earnings in Woodlawn Beach are $46,385, $62,091 for men and $25,306 for women, a difference of 59.2%.
| Sex | Number | Average Earnings |
| Male | 738 (45.1%) | $62,091 |
| Female | 898 (54.9%) | $25,306 |
| Total | 1,636 (100.0%) | $46,385 |
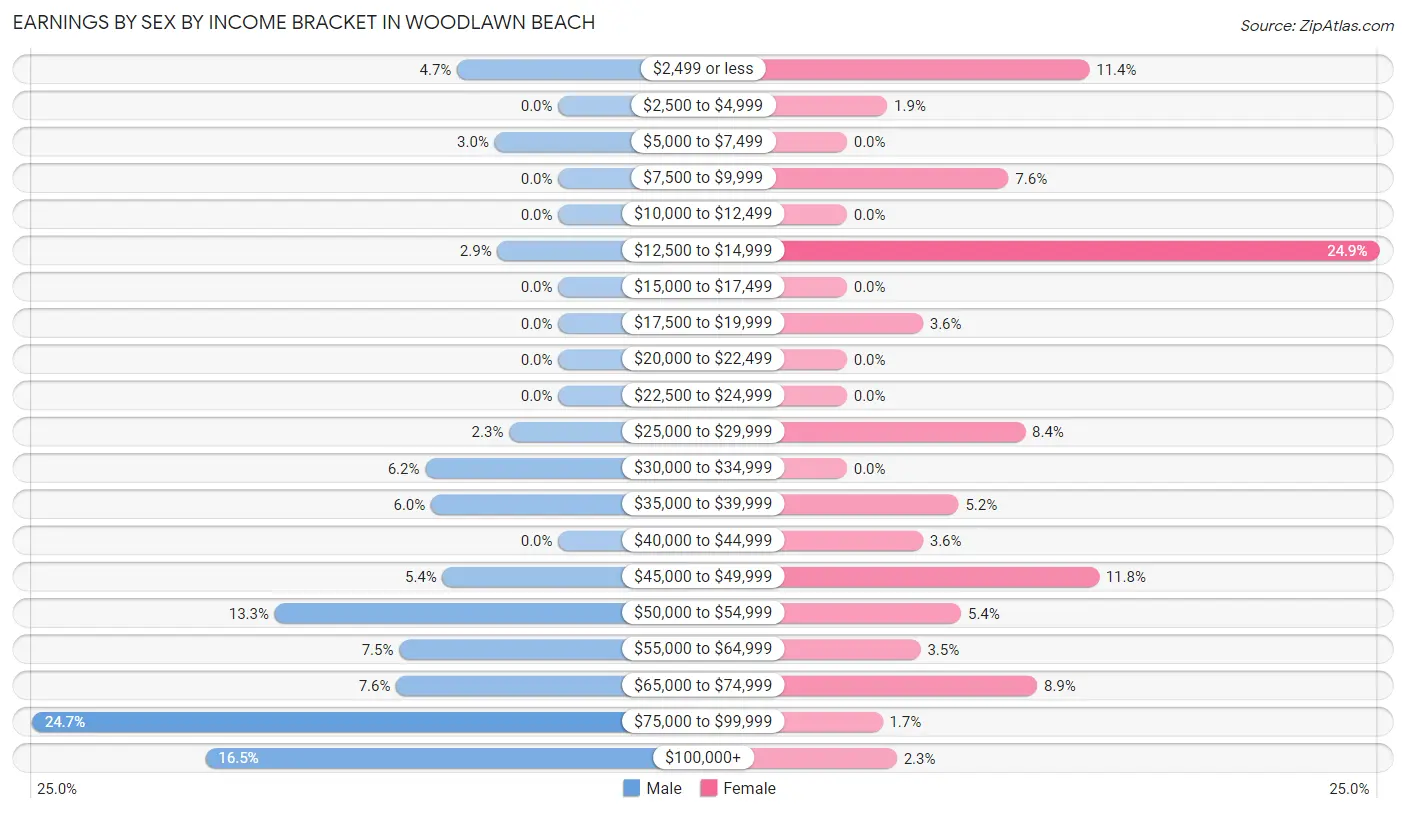
Earnings by Sex by Income Bracket in Woodlawn Beach
The most common earnings brackets in Woodlawn Beach are $75,000 to $99,999 for men (182 | 24.7%) and $12,500 to $14,999 for women (224 | 24.9%).
| Income | Male | Female |
| $2,499 or less | 35 (4.7%) | 102 (11.4%) |
| $2,500 to $4,999 | 0 (0.0%) | 17 (1.9%) |
| $5,000 to $7,499 | 22 (3.0%) | 0 (0.0%) |
| $7,500 to $9,999 | 0 (0.0%) | 68 (7.6%) |
| $10,000 to $12,499 | 0 (0.0%) | 0 (0.0%) |
| $12,500 to $14,999 | 21 (2.9%) | 224 (24.9%) |
| $15,000 to $17,499 | 0 (0.0%) | 0 (0.0%) |
| $17,500 to $19,999 | 0 (0.0%) | 32 (3.6%) |
| $20,000 to $22,499 | 0 (0.0%) | 0 (0.0%) |
| $22,500 to $24,999 | 0 (0.0%) | 0 (0.0%) |
| $25,000 to $29,999 | 17 (2.3%) | 75 (8.4%) |
| $30,000 to $34,999 | 46 (6.2%) | 0 (0.0%) |
| $35,000 to $39,999 | 44 (6.0%) | 47 (5.2%) |
| $40,000 to $44,999 | 0 (0.0%) | 32 (3.6%) |
| $45,000 to $49,999 | 40 (5.4%) | 106 (11.8%) |
| $50,000 to $54,999 | 98 (13.3%) | 48 (5.3%) |
| $55,000 to $64,999 | 55 (7.4%) | 31 (3.5%) |
| $65,000 to $74,999 | 56 (7.6%) | 80 (8.9%) |
| $75,000 to $99,999 | 182 (24.7%) | 15 (1.7%) |
| $100,000+ | 122 (16.5%) | 21 (2.3%) |
| Total | 738 (100.0%) | 898 (100.0%) |
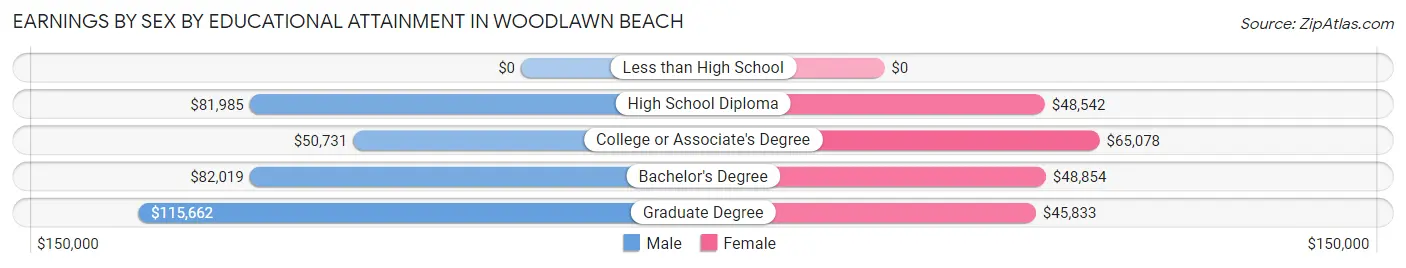
Earnings by Sex by Educational Attainment in Woodlawn Beach
Average earnings in Woodlawn Beach are $70,128 for men and $48,025 for women, a difference of 31.5%. Men with an educational attainment of graduate degree enjoy the highest average annual earnings of $115,662, while those with college or associate's degree education earn the least with $50,731. Women with an educational attainment of college or associate's degree earn the most with the average annual earnings of $65,078, while those with graduate degree education have the smallest earnings of $45,833.
| Educational Attainment | Male Income | Female Income |
| Less than High School | - | - |
| High School Diploma | $81,985 | $48,542 |
| College or Associate's Degree | $50,731 | $65,078 |
| Bachelor's Degree | $82,019 | $48,854 |
| Graduate Degree | $115,662 | $45,833 |
| Total | $70,128 | $48,025 |
Family Income in Woodlawn Beach
Family Income Brackets in Woodlawn Beach
According to the Woodlawn Beach family income data, there are 502 families falling into the $100,000 to $149,999 income range, which is the most common income bracket and makes up 50.1% of all families.
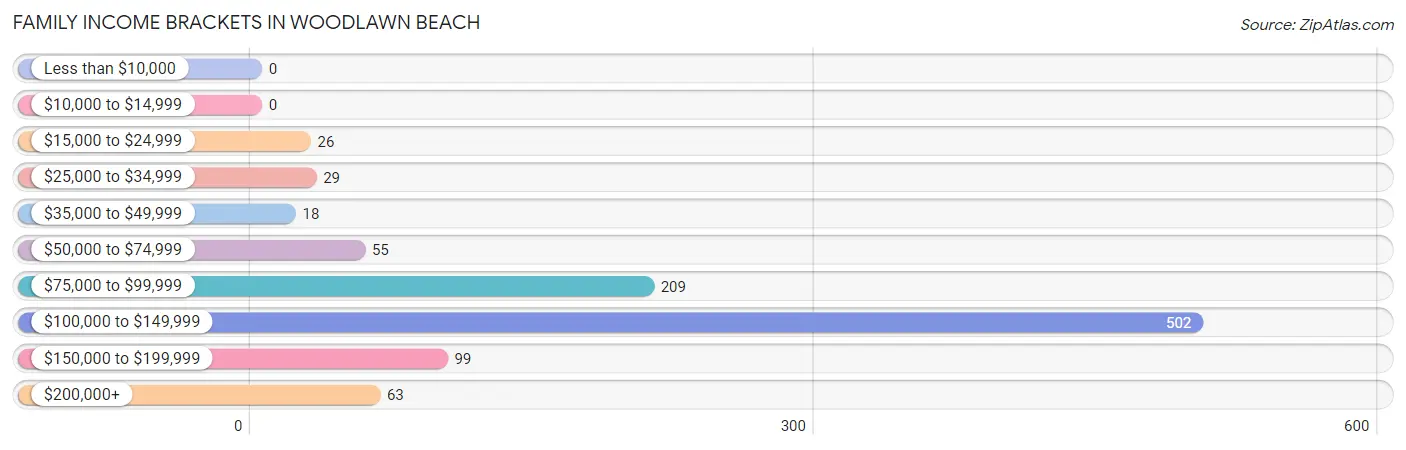
| Income Bracket | # Families | % Families |
| Less than $10,000 | 0 | 0.0% |
| $10,000 to $14,999 | 0 | 0.0% |
| $15,000 to $24,999 | 26 | 2.6% |
| $25,000 to $34,999 | 29 | 2.9% |
| $35,000 to $49,999 | 18 | 1.8% |
| $50,000 to $74,999 | 55 | 5.5% |
| $75,000 to $99,999 | 209 | 20.9% |
| $100,000 to $149,999 | 502 | 50.1% |
| $150,000 to $199,999 | 99 | 9.9% |
| $200,000+ | 63 | 6.3% |
Family Income by Famaliy Size in Woodlawn Beach
4-person families (372 | 37.2%) account for the highest median family income in Woodlawn Beach with $118,190 per family, while 2-person families (530 | 52.9%) have the highest median income of $56,136 per family member.
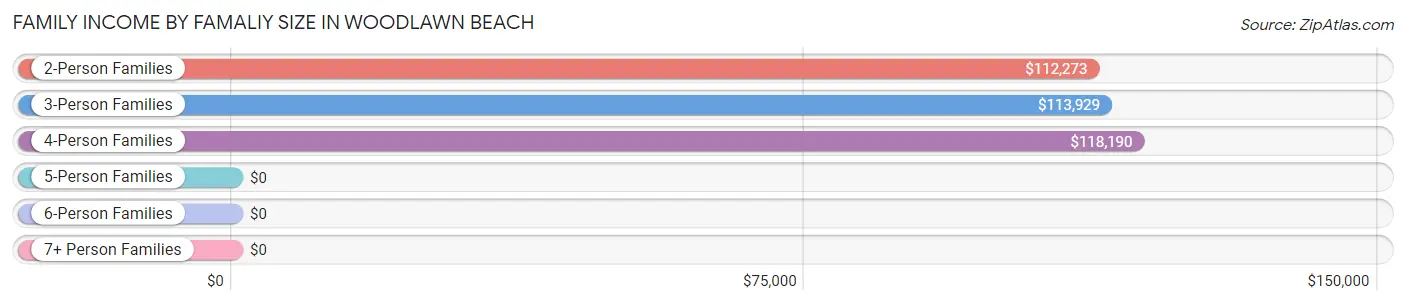
| Income Bracket | # Families | Median Income |
| 2-Person Families | 530 (52.9%) | $112,273 |
| 3-Person Families | 82 (8.2%) | $113,929 |
| 4-Person Families | 372 (37.2%) | $118,190 |
| 5-Person Families | 9 (0.9%) | $0 |
| 6-Person Families | 8 (0.8%) | $0 |
| 7+ Person Families | 0 (0.0%) | $0 |
| Total | 1,001 (100.0%) | $117,744 |
Family Income by Number of Earners in Woodlawn Beach
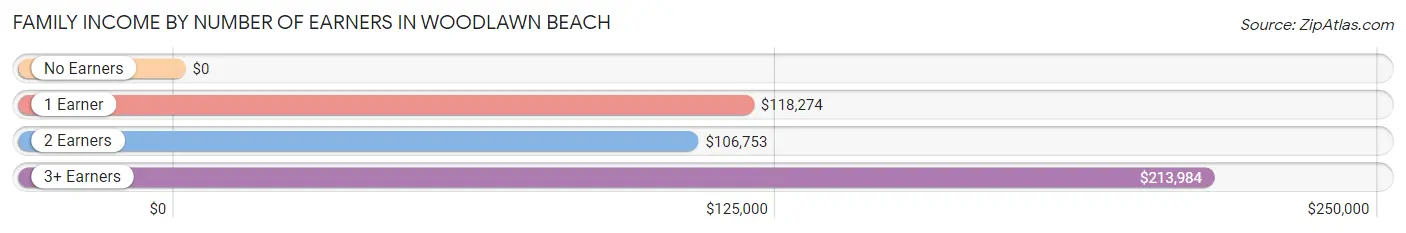
| Number of Earners | # Families | Median Income |
| No Earners | 108 (10.8%) | $0 |
| 1 Earner | 408 (40.8%) | $118,274 |
| 2 Earners | 436 (43.6%) | $106,753 |
| 3+ Earners | 49 (4.9%) | $213,984 |
| Total | 1,001 (100.0%) | $117,744 |
Household Income in Woodlawn Beach
Household Income Brackets in Woodlawn Beach
With 502 households falling in the category, the $100,000 to $149,999 income range is the most frequent in Woodlawn Beach, accounting for 41.1% of all households.
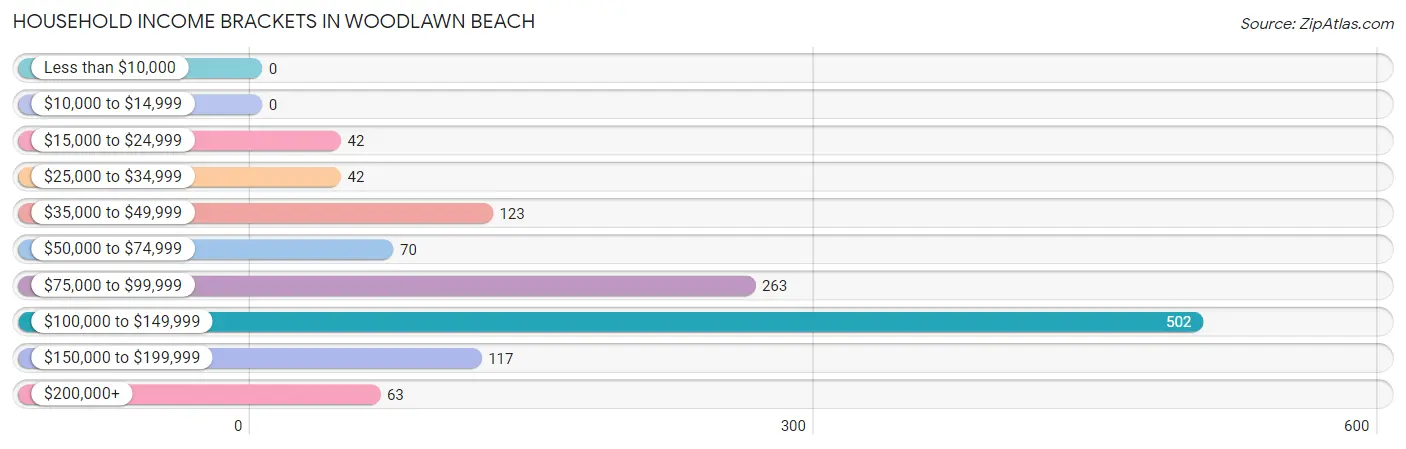
| Income Bracket | # Households | % Households |
| Less than $10,000 | 0 | 0.0% |
| $10,000 to $14,999 | 0 | 0.0% |
| $15,000 to $24,999 | 42 | 3.4% |
| $25,000 to $34,999 | 42 | 3.4% |
| $35,000 to $49,999 | 123 | 10.1% |
| $50,000 to $74,999 | 70 | 5.7% |
| $75,000 to $99,999 | 263 | 21.5% |
| $100,000 to $149,999 | 502 | 41.1% |
| $150,000 to $199,999 | 117 | 9.6% |
| $200,000+ | 63 | 5.2% |
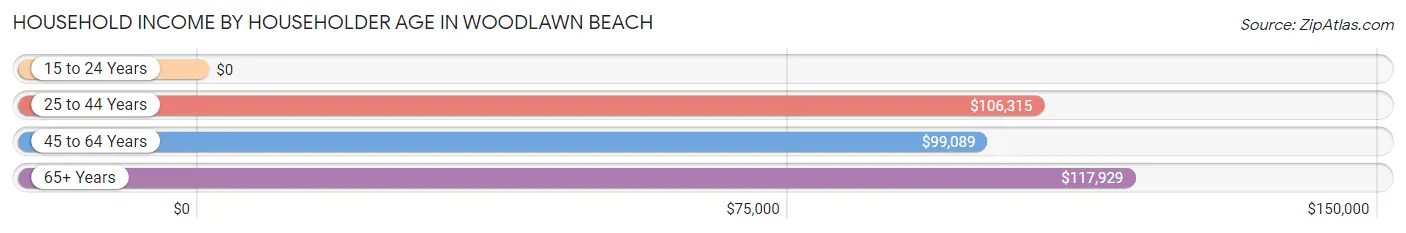
Household Income by Householder Age in Woodlawn Beach
The median household income in Woodlawn Beach is $107,321, with the highest median household income of $117,929 found in the 65+ years age bracket for the primary householder. A total of 584 households (47.8%) fall into this category. Meanwhile, the 15 to 24 years age bracket for the primary householder has the lowest median household income of $0, with 19 households (1.6%) in this group.
| Income Bracket | # Households | Median Income |
| 15 to 24 Years | 19 (1.6%) | $0 |
| 25 to 44 Years | 335 (27.4%) | $106,315 |
| 45 to 64 Years | 283 (23.2%) | $99,089 |
| 65+ Years | 584 (47.8%) | $117,929 |
| Total | 1,221 (100.0%) | $107,321 |
Poverty in Woodlawn Beach
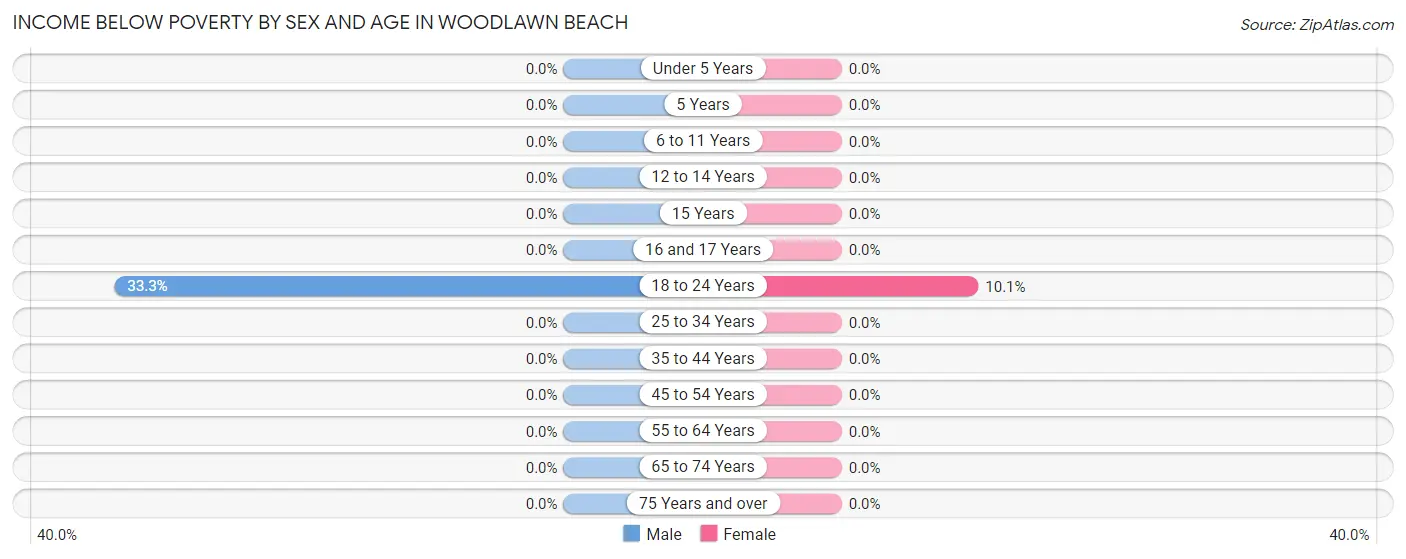
Income Below Poverty by Sex and Age in Woodlawn Beach
With 1.3% poverty level for males and 2.4% for females among the residents of Woodlawn Beach, 18 to 24 year old males and 18 to 24 year old females are the most vulnerable to poverty, with 21 males (33.3%) and 36 females (10.1%) in their respective age groups living below the poverty level.
| Age Bracket | Male | Female |
| Under 5 Years | 0 (0.0%) | 0 (0.0%) |
| 5 Years | 0 (0.0%) | 0 (0.0%) |
| 6 to 11 Years | 0 (0.0%) | 0 (0.0%) |
| 12 to 14 Years | 0 (0.0%) | 0 (0.0%) |
| 15 Years | 0 (0.0%) | 0 (0.0%) |
| 16 and 17 Years | 0 (0.0%) | 0 (0.0%) |
| 18 to 24 Years | 21 (33.3%) | 36 (10.1%) |
| 25 to 34 Years | 0 (0.0%) | 0 (0.0%) |
| 35 to 44 Years | 0 (0.0%) | 0 (0.0%) |
| 45 to 54 Years | 0 (0.0%) | 0 (0.0%) |
| 55 to 64 Years | 0 (0.0%) | 0 (0.0%) |
| 65 to 74 Years | 0 (0.0%) | 0 (0.0%) |
| 75 Years and over | 0 (0.0%) | 0 (0.0%) |
| Total | 21 (1.3%) | 36 (2.4%) |
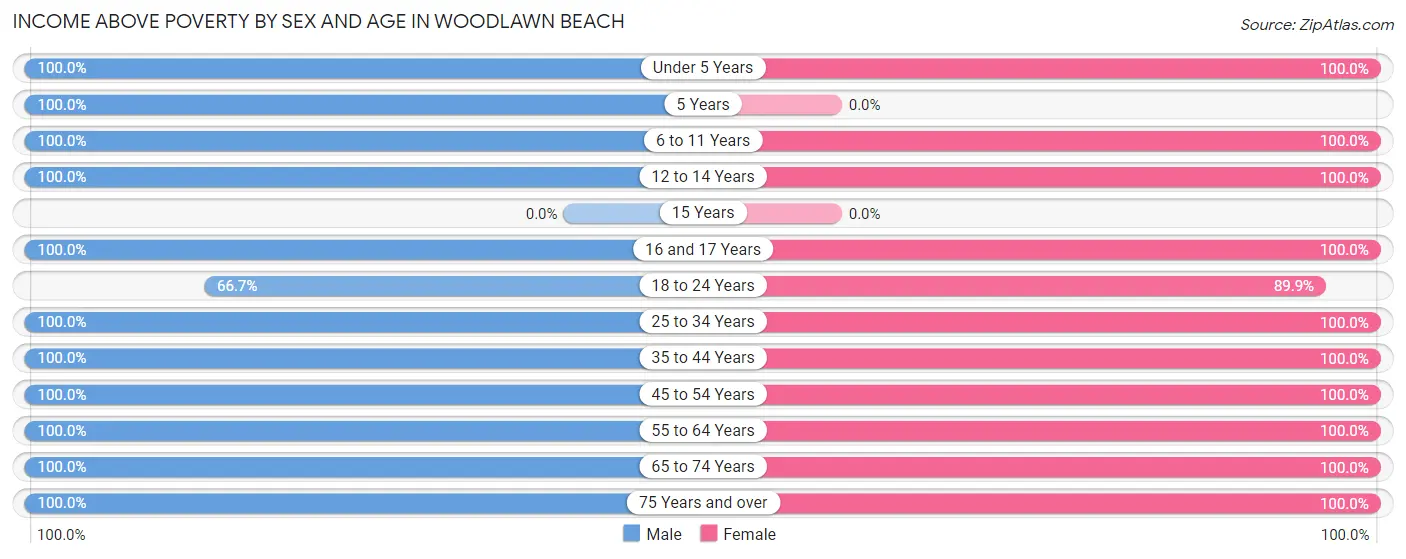
Income Above Poverty by Sex and Age in Woodlawn Beach
According to the poverty statistics in Woodlawn Beach, males aged under 5 years and females aged under 5 years are the age groups that are most secure financially, with 100.0% of males and 100.0% of females in these age groups living above the poverty line.
| Age Bracket | Male | Female |
| Under 5 Years | 71 (100.0%) | 64 (100.0%) |
| 5 Years | 186 (100.0%) | 0 (0.0%) |
| 6 to 11 Years | 77 (100.0%) | 56 (100.0%) |
| 12 to 14 Years | 47 (100.0%) | 58 (100.0%) |
| 15 Years | 0 (0.0%) | 0 (0.0%) |
| 16 and 17 Years | 15 (100.0%) | 35 (100.0%) |
| 18 to 24 Years | 42 (66.7%) | 319 (89.9%) |
| 25 to 34 Years | 275 (100.0%) | 140 (100.0%) |
| 35 to 44 Years | 109 (100.0%) | 122 (100.0%) |
| 45 to 54 Years | 125 (100.0%) | 198 (100.0%) |
| 55 to 64 Years | 96 (100.0%) | 119 (100.0%) |
| 65 to 74 Years | 479 (100.0%) | 355 (100.0%) |
| 75 Years and over | 63 (100.0%) | 20 (100.0%) |
| Total | 1,585 (98.7%) | 1,486 (97.6%) |
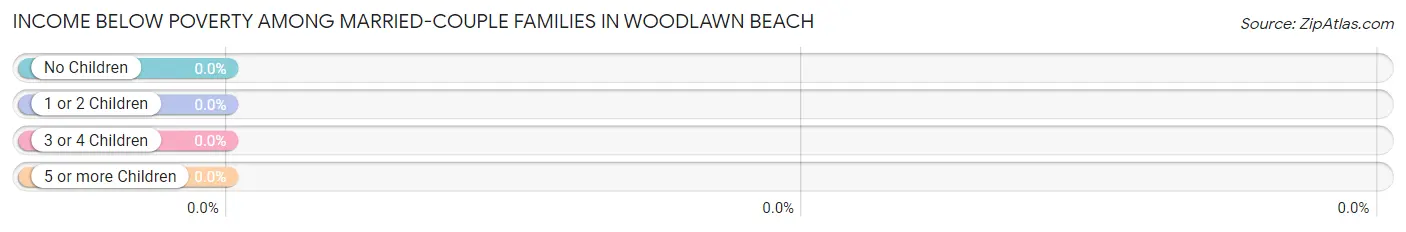
Income Below Poverty Among Married-Couple Families in Woodlawn Beach
| Children | Above Poverty | Below Poverty |
| No Children | 459 (100.0%) | 0 (0.0%) |
| 1 or 2 Children | 411 (100.0%) | 0 (0.0%) |
| 3 or 4 Children | 9 (100.0%) | 0 (0.0%) |
| 5 or more Children | 0 (0.0%) | 0 (0.0%) |
| Total | 879 (100.0%) | 0 (0.0%) |
Income Below Poverty Among Single-Parent Households in Woodlawn Beach
| Children | Single Father | Single Mother |
| No Children | 0 (0.0%) | 0 (0.0%) |
| 1 or 2 Children | 0 (0.0%) | 0 (0.0%) |
| 3 or 4 Children | 0 (0.0%) | 0 (0.0%) |
| 5 or more Children | 0 (0.0%) | 0 (0.0%) |
| Total | 0 (0.0%) | 0 (0.0%) |
Income Below Poverty Among Married-Couple vs Single-Parent Households in Woodlawn Beach
| Children | Married-Couple Families | Single-Parent Households |
| No Children | 0 (0.0%) | 0 (0.0%) |
| 1 or 2 Children | 0 (0.0%) | 0 (0.0%) |
| 3 or 4 Children | 0 (0.0%) | 0 (0.0%) |
| 5 or more Children | 0 (0.0%) | 0 (0.0%) |
| Total | 0 (0.0%) | 0 (0.0%) |
Race in Woodlawn Beach
The most populous races in Woodlawn Beach are White / Caucasian (2,691 | 86.0%), Hispanic or Latino (349 | 11.2%), and Two or more Races (204 | 6.5%).
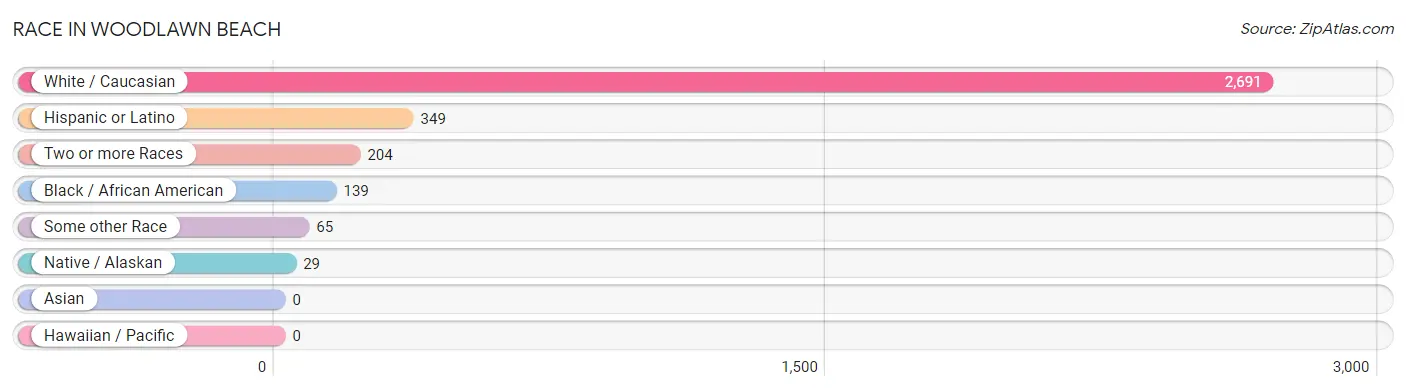
| Race | # Population | % Population |
| Asian | 0 | 0.0% |
| Black / African American | 139 | 4.4% |
| Hawaiian / Pacific | 0 | 0.0% |
| Hispanic or Latino | 349 | 11.2% |
| Native / Alaskan | 29 | 0.9% |
| White / Caucasian | 2,691 | 86.0% |
| Two or more Races | 204 | 6.5% |
| Some other Race | 65 | 2.1% |
| Total | 3,128 | 100.0% |
Ancestry in Woodlawn Beach
The most populous ancestries reported in Woodlawn Beach are German (1,067 | 34.1%), English (980 | 31.3%), Irish (423 | 13.5%), American (143 | 4.6%), and Scottish (143 | 4.6%), together accounting for 88.1% of all Woodlawn Beach residents.
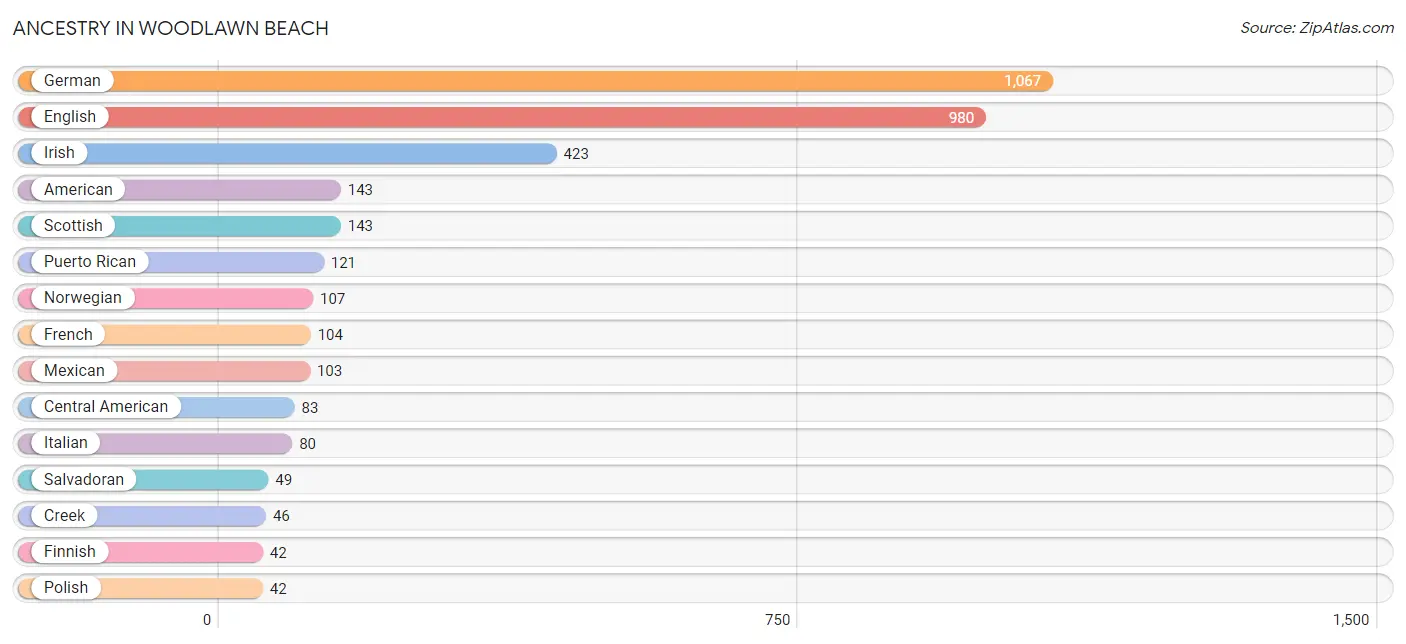
| Ancestry | # Population | % Population |
| American | 143 | 4.6% |
| Brazilian | 33 | 1.1% |
| Central American | 83 | 2.6% |
| Cherokee | 23 | 0.7% |
| Creek | 46 | 1.5% |
| Delaware | 29 | 0.9% |
| English | 980 | 31.3% |
| European | 40 | 1.3% |
| Finnish | 42 | 1.3% |
| French | 104 | 3.3% |
| French Canadian | 9 | 0.3% |
| German | 1,067 | 34.1% |
| Honduran | 34 | 1.1% |
| Hungarian | 19 | 0.6% |
| Irish | 423 | 13.5% |
| Italian | 80 | 2.6% |
| Mexican | 103 | 3.3% |
| Northern European | 12 | 0.4% |
| Norwegian | 107 | 3.4% |
| Polish | 42 | 1.3% |
| Puerto Rican | 121 | 3.9% |
| Salvadoran | 49 | 1.6% |
| Scottish | 143 | 4.6% |
| South American | 11 | 0.4% |
| Trinidadian and Tobagonian | 11 | 0.4% |
| Venezuelan | 11 | 0.4% |
| Welsh | 32 | 1.0% | View All 27 Rows |
Immigrants in Woodlawn Beach
The most numerous immigrant groups reported in Woodlawn Beach came from Europe (102 | 3.3%), Ireland (60 | 1.9%), Northern Europe (60 | 1.9%), Eastern Europe (42 | 1.3%), and Russia (42 | 1.3%), together accounting for 9.8% of all Woodlawn Beach residents.
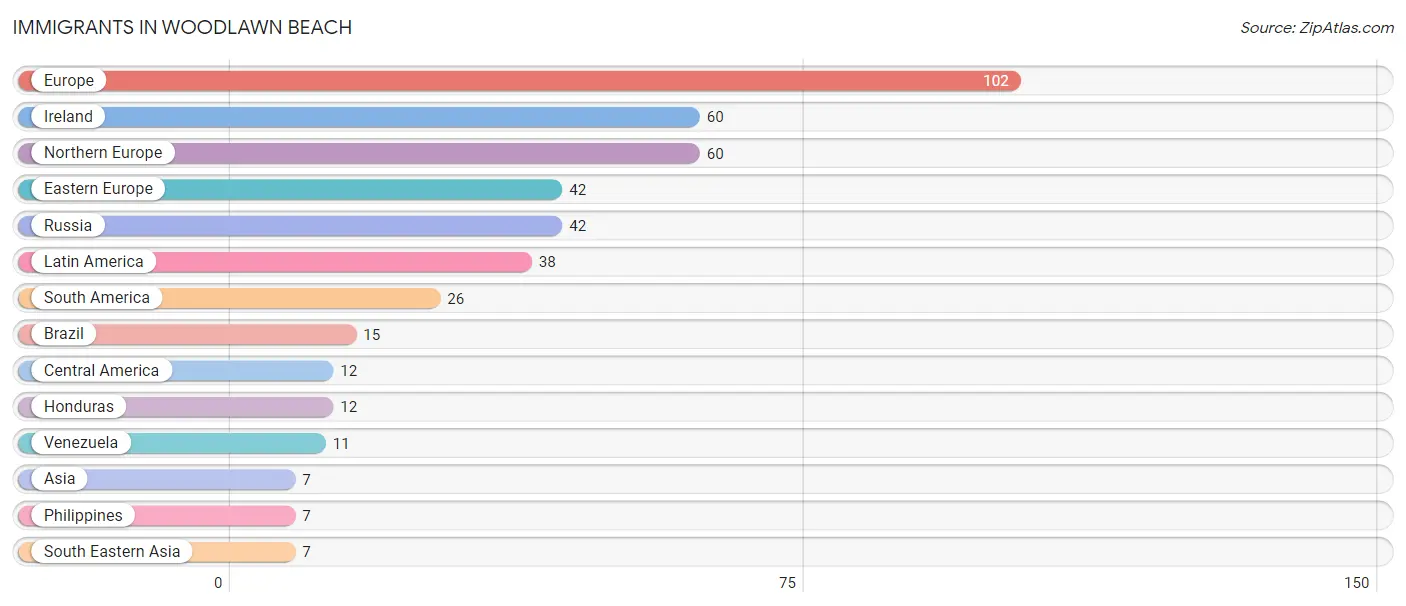
| Immigration Origin | # Population | % Population |
| Asia | 7 | 0.2% |
| Brazil | 15 | 0.5% |
| Central America | 12 | 0.4% |
| Eastern Europe | 42 | 1.3% |
| Europe | 102 | 3.3% |
| Honduras | 12 | 0.4% |
| Ireland | 60 | 1.9% |
| Latin America | 38 | 1.2% |
| Northern Europe | 60 | 1.9% |
| Philippines | 7 | 0.2% |
| Russia | 42 | 1.3% |
| South America | 26 | 0.8% |
| South Eastern Asia | 7 | 0.2% |
| Venezuela | 11 | 0.4% | View All 14 Rows |
Sex and Age in Woodlawn Beach
Sex and Age in Woodlawn Beach
The most populous age groups in Woodlawn Beach are 70 to 74 Years (338 | 21.0%) for men and 70 to 74 Years (281 | 18.5%) for women.
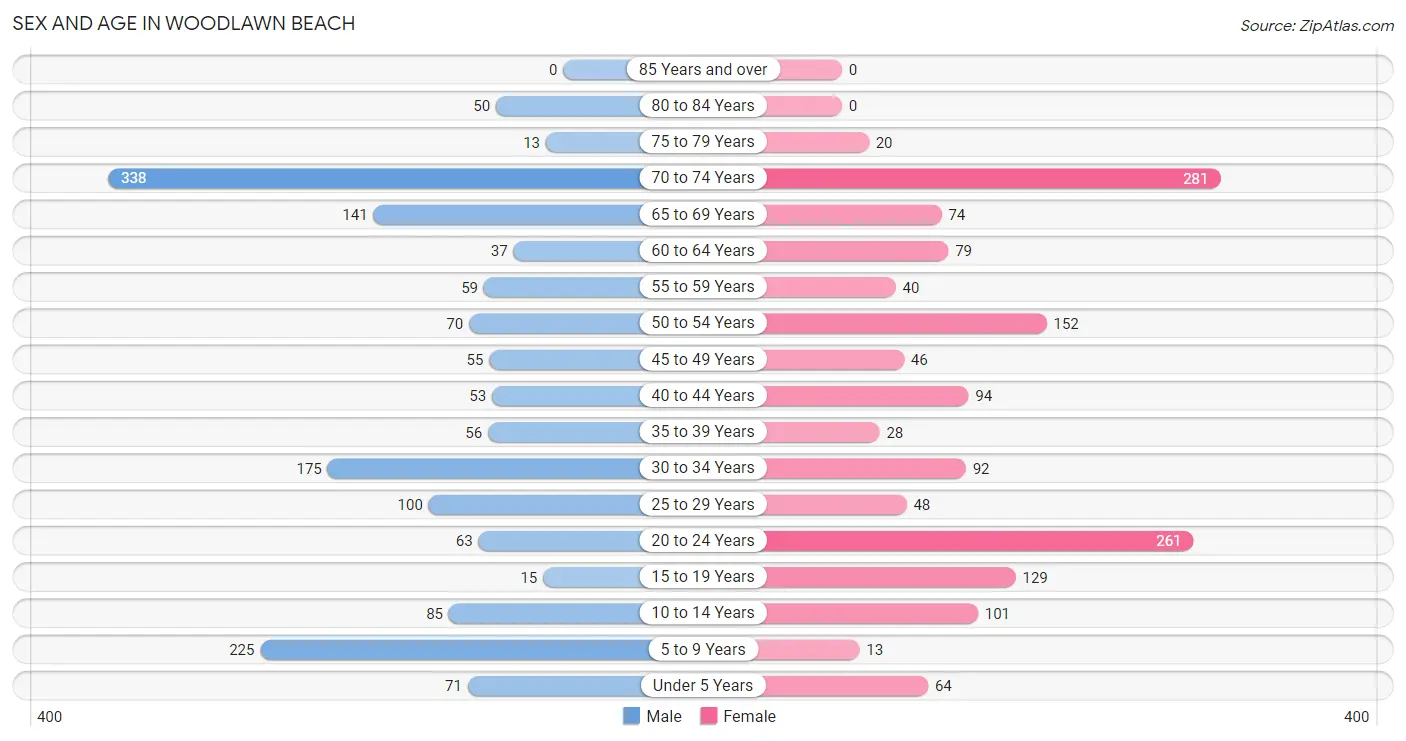
| Age Bracket | Male | Female |
| Under 5 Years | 71 (4.4%) | 64 (4.2%) |
| 5 to 9 Years | 225 (14.0%) | 13 (0.9%) |
| 10 to 14 Years | 85 (5.3%) | 101 (6.6%) |
| 15 to 19 Years | 15 (0.9%) | 129 (8.5%) |
| 20 to 24 Years | 63 (3.9%) | 261 (17.2%) |
| 25 to 29 Years | 100 (6.2%) | 48 (3.2%) |
| 30 to 34 Years | 175 (10.9%) | 92 (6.0%) |
| 35 to 39 Years | 56 (3.5%) | 28 (1.8%) |
| 40 to 44 Years | 53 (3.3%) | 94 (6.2%) |
| 45 to 49 Years | 55 (3.4%) | 46 (3.0%) |
| 50 to 54 Years | 70 (4.4%) | 152 (10.0%) |
| 55 to 59 Years | 59 (3.7%) | 40 (2.6%) |
| 60 to 64 Years | 37 (2.3%) | 79 (5.2%) |
| 65 to 69 Years | 141 (8.8%) | 74 (4.9%) |
| 70 to 74 Years | 338 (21.0%) | 281 (18.5%) |
| 75 to 79 Years | 13 (0.8%) | 20 (1.3%) |
| 80 to 84 Years | 50 (3.1%) | 0 (0.0%) |
| 85 Years and over | 0 (0.0%) | 0 (0.0%) |
| Total | 1,606 (100.0%) | 1,522 (100.0%) |
Families and Households in Woodlawn Beach
Median Family Size in Woodlawn Beach
The median family size in Woodlawn Beach is 2.77 persons per family, with single male/father families (77 | 7.7%) accounting for the largest median family size of 3.17 persons per family. On the other hand, single female/mother families (45 | 4.5%) represent the smallest median family size with 2.56 persons per family.
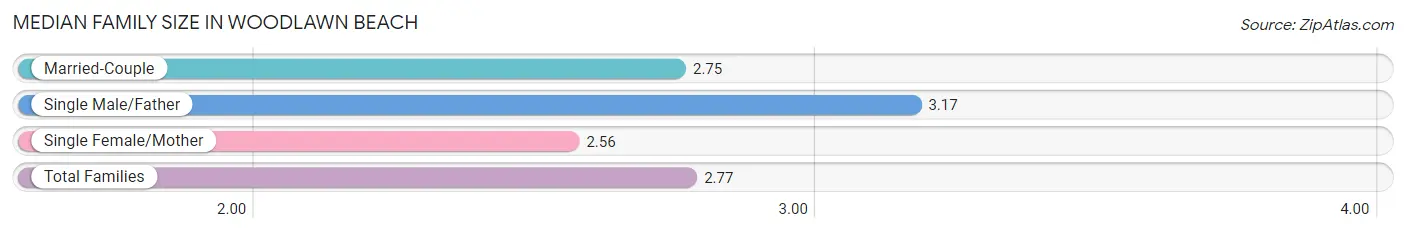
| Family Type | # Families | Family Size |
| Married-Couple | 879 (87.8%) | 2.75 |
| Single Male/Father | 77 (7.7%) | 3.17 |
| Single Female/Mother | 45 (4.5%) | 2.56 |
| Total Families | 1,001 (100.0%) | 2.77 |
Median Household Size in Woodlawn Beach
The median household size in Woodlawn Beach is 2.56 persons per household, with single male/father households (77 | 6.3%) accounting for the largest median household size of 4.09 persons per household. non-family households (220 | 18.0%) represent the smallest median household size with 1.17 persons per household.
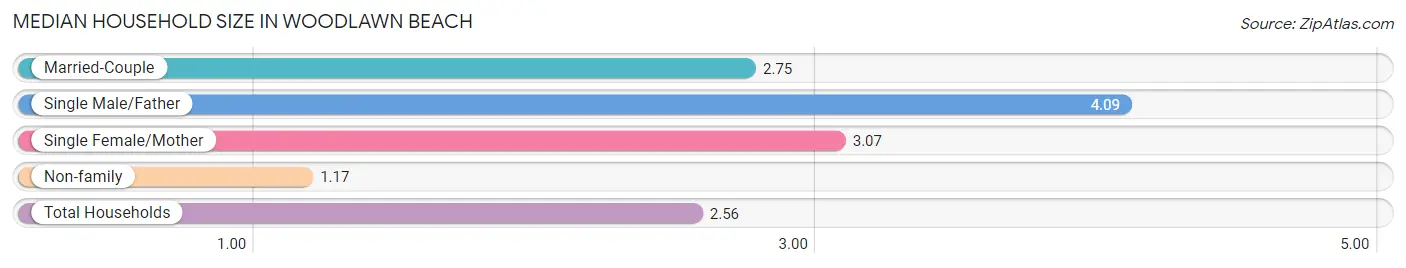
| Household Type | # Households | Household Size |
| Married-Couple | 879 (72.0%) | 2.75 |
| Single Male/Father | 77 (6.3%) | 4.09 |
| Single Female/Mother | 45 (3.7%) | 3.07 |
| Non-family | 220 (18.0%) | 1.17 |
| Total Households | 1,221 (100.0%) | 2.56 |
Household Size by Marriage Status in Woodlawn Beach
Out of a total of 1,221 households in Woodlawn Beach, 1,001 (82.0%) are family households, while 220 (18.0%) are nonfamily households. The most numerous type of family households are 2-person households, comprising 515, and the most common type of nonfamily households are 1-person households, comprising 179.
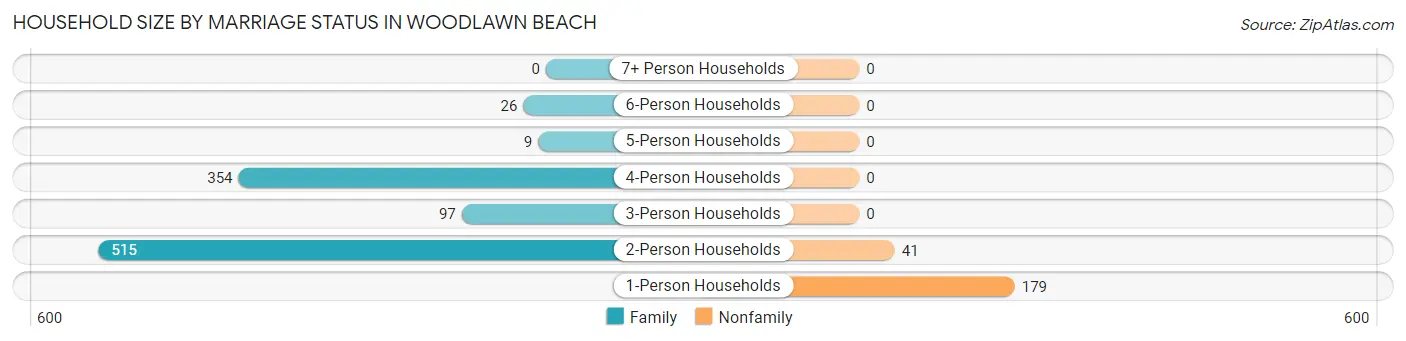
| Household Size | Family Households | Nonfamily Households |
| 1-Person Households | - | 179 (14.7%) |
| 2-Person Households | 515 (42.2%) | 41 (3.4%) |
| 3-Person Households | 97 (7.9%) | 0 (0.0%) |
| 4-Person Households | 354 (29.0%) | 0 (0.0%) |
| 5-Person Households | 9 (0.7%) | 0 (0.0%) |
| 6-Person Households | 26 (2.1%) | 0 (0.0%) |
| 7+ Person Households | 0 (0.0%) | 0 (0.0%) |
| Total | 1,001 (82.0%) | 220 (18.0%) |
Female Fertility in Woodlawn Beach
Fertility by Age in Woodlawn Beach
Average fertility rate in Woodlawn Beach is 8.0 births per 1,000 women. Women in the age bracket of 35 to 50 years have the highest fertility rate with 26.0 births per 1,000 women. Women in the age bracket of 35 to 50 years acount for 100.0% of all women with births.
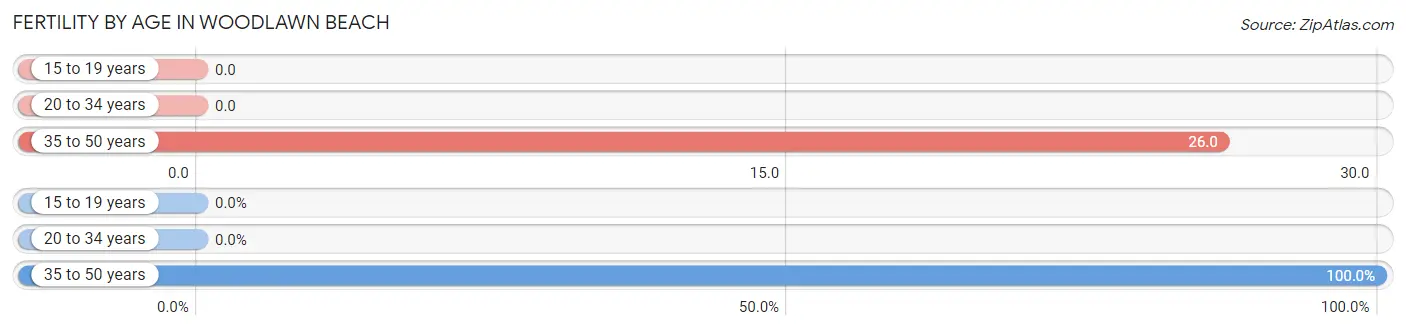
| Age Bracket | Women with Births | Births / 1,000 Women |
| 15 to 19 years | 0 (0.0%) | 0.0 |
| 20 to 34 years | 0 (0.0%) | 0.0 |
| 35 to 50 years | 6 (100.0%) | 26.0 |
| Total | 6 (100.0%) | 8.0 |
Fertility by Age by Marriage Status in Woodlawn Beach
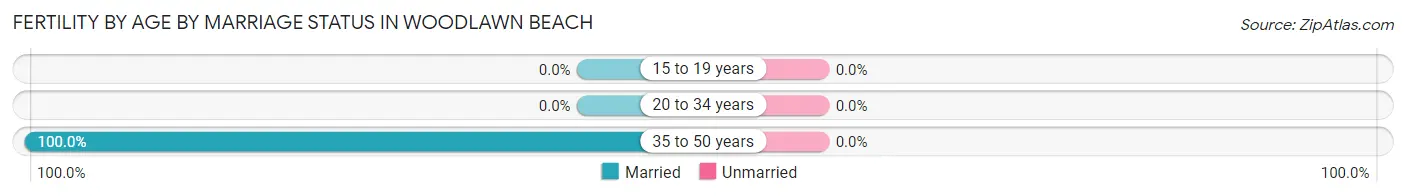
| Age Bracket | Married | Unmarried |
| 15 to 19 years | 0 (0.0%) | 0 (0.0%) |
| 20 to 34 years | 0 (0.0%) | 0 (0.0%) |
| 35 to 50 years | 6 (100.0%) | 0 (0.0%) |
| Total | 6 (100.0%) | 0 (0.0%) |
Fertility by Education in Woodlawn Beach
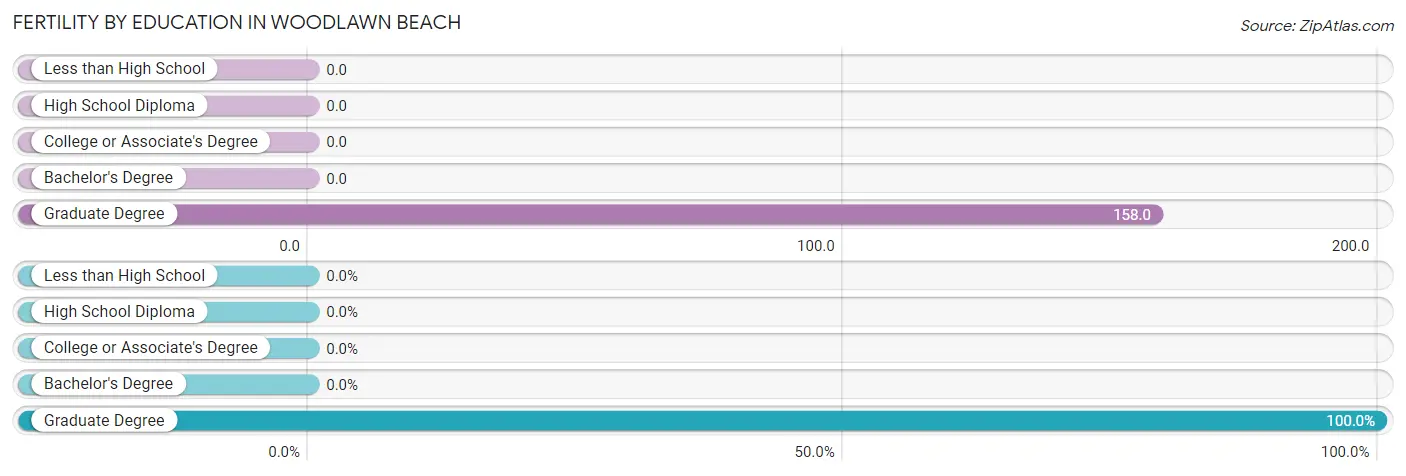
| Educational Attainment | Women with Births | Births / 1,000 Women |
| Less than High School | 0 (0.0%) | 0.0 |
| High School Diploma | 0 (0.0%) | 0.0 |
| College or Associate's Degree | 0 (0.0%) | 0.0 |
| Bachelor's Degree | 0 (0.0%) | 0.0 |
| Graduate Degree | 6 (100.0%) | 158.0 |
| Total | 6 (100.0%) | 8.0 |
Fertility by Education by Marriage Status in Woodlawn Beach
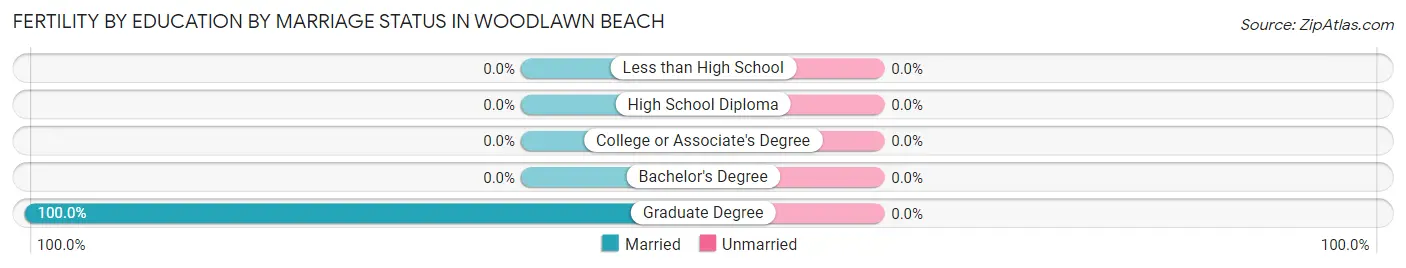
| Educational Attainment | Married | Unmarried |
| Less than High School | 0 (0.0%) | 0 (0.0%) |
| High School Diploma | 0 (0.0%) | 0 (0.0%) |
| College or Associate's Degree | 0 (0.0%) | 0 (0.0%) |
| Bachelor's Degree | 0 (0.0%) | 0 (0.0%) |
| Graduate Degree | 6 (100.0%) | 0 (0.0%) |
| Total | 6 (100.0%) | 0 (0.0%) |
Employment Characteristics in Woodlawn Beach
Employment by Class of Employer in Woodlawn Beach
Among the 1,437 employed individuals in Woodlawn Beach, private company employees (840 | 58.5%), federal government employees (230 | 16.0%), and not-for-profit organizations (220 | 15.3%) make up the most common classes of employment.
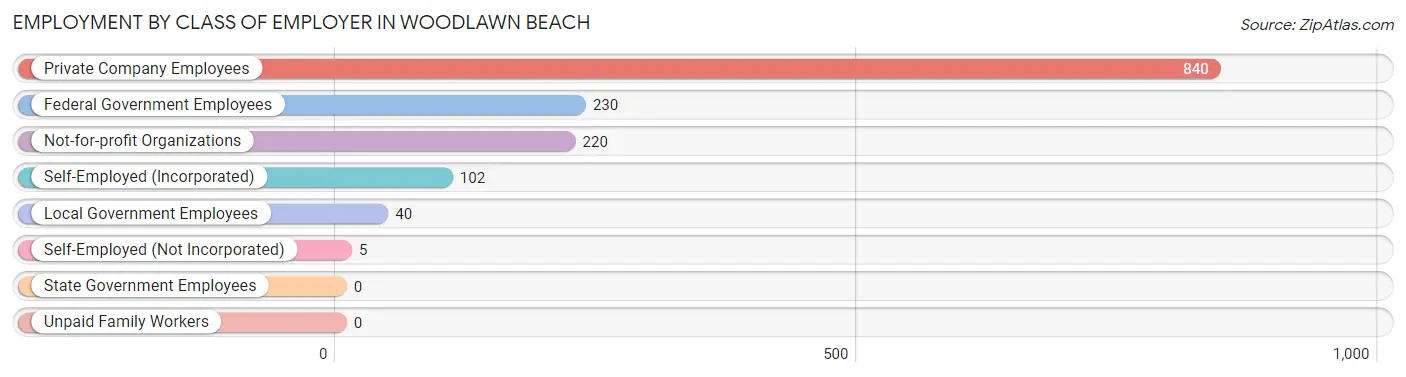
| Employer Class | # Employees | % Employees |
| Private Company Employees | 840 | 58.5% |
| Self-Employed (Incorporated) | 102 | 7.1% |
| Self-Employed (Not Incorporated) | 5 | 0.4% |
| Not-for-profit Organizations | 220 | 15.3% |
| Local Government Employees | 40 | 2.8% |
| State Government Employees | 0 | 0.0% |
| Federal Government Employees | 230 | 16.0% |
| Unpaid Family Workers | 0 | 0.0% |
| Total | 1,437 | 100.0% |
Employment Status by Age in Woodlawn Beach
According to the labor force statistics for Woodlawn Beach, out of the total population over 16 years of age (2,569), 58.6% or 1,505 individuals are in the labor force, with 3.8% or 57 of them unemployed. The age group with the highest labor force participation rate is 25 to 29 years, with 100.0% or 148 individuals in the labor force. Within the labor force, the 45 to 54 years age range has the highest percentage of unemployed individuals, with 14.9% or 39 of them being unemployed.
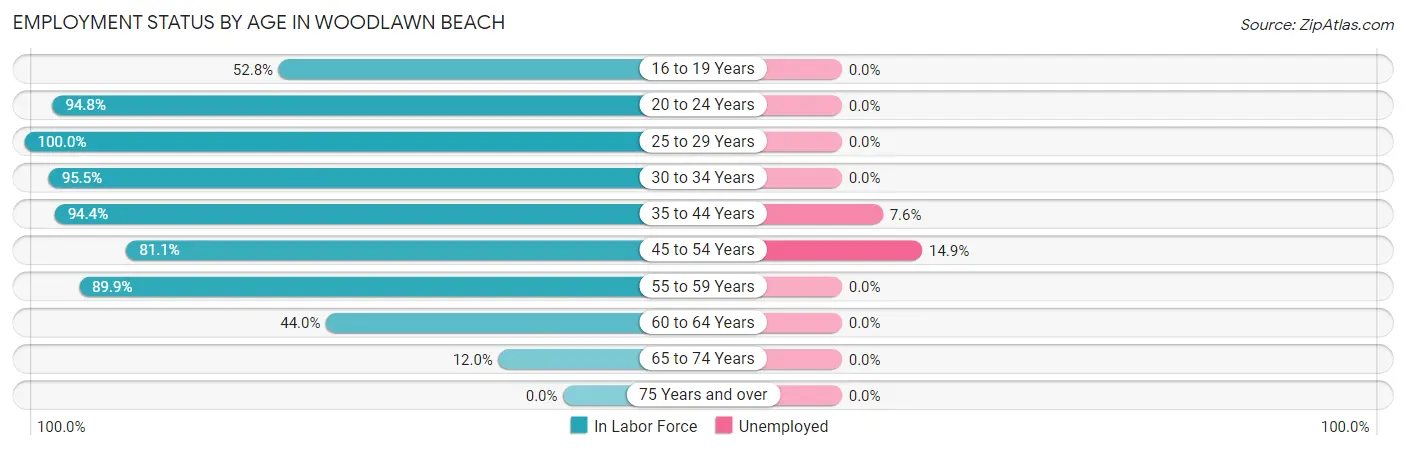
| Age Bracket | In Labor Force | Unemployed |
| 16 to 19 Years | 76 (52.8%) | 0 (0.0%) |
| 20 to 24 Years | 307 (94.8%) | 0 (0.0%) |
| 25 to 29 Years | 148 (100.0%) | 0 (0.0%) |
| 30 to 34 Years | 255 (95.5%) | 0 (0.0%) |
| 35 to 44 Years | 218 (94.4%) | 17 (7.6%) |
| 45 to 54 Years | 262 (81.1%) | 39 (14.9%) |
| 55 to 59 Years | 89 (89.9%) | 0 (0.0%) |
| 60 to 64 Years | 51 (44.0%) | 0 (0.0%) |
| 65 to 74 Years | 100 (12.0%) | 0 (0.0%) |
| 75 Years and over | 0 (0.0%) | 0 (0.0%) |
| Total | 1,505 (58.6%) | 57 (3.8%) |
Employment Status by Educational Attainment in Woodlawn Beach
According to labor force statistics for Woodlawn Beach, 86.4% of individuals (1,023) out of the total population between 25 and 64 years of age (1,184) are in the labor force, with 5.7% or 58 of them being unemployed. The group with the highest labor force participation rate are those with the educational attainment of less than high school, with 100.0% or 58 individuals in the labor force. Within the labor force, individuals with less than high school education have the highest percentage of unemployment, with 29.3% or 17 of them being unemployed.
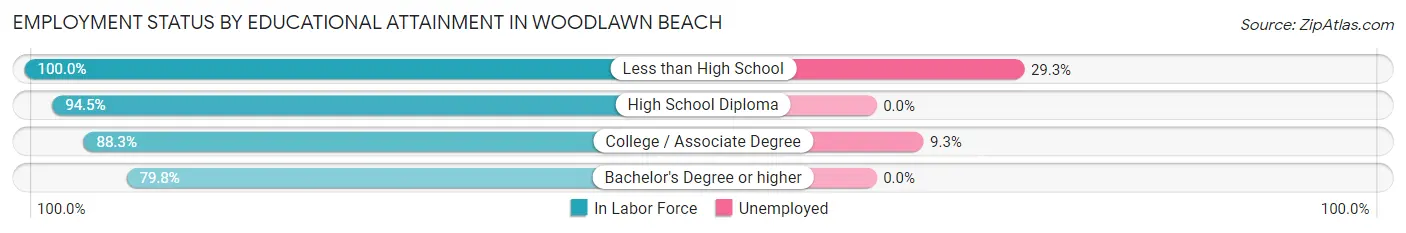
| Educational Attainment | In Labor Force | Unemployed |
| Less than High School | 58 (100.0%) | 17 (29.3%) |
| High School Diploma | 171 (94.5%) | 0 (0.0%) |
| College / Associate Degree | 415 (88.3%) | 44 (9.3%) |
| Bachelor's Degree or higher | 379 (79.8%) | 0 (0.0%) |
| Total | 1,023 (86.4%) | 67 (5.7%) |
Employment Occupations by Sex in Woodlawn Beach
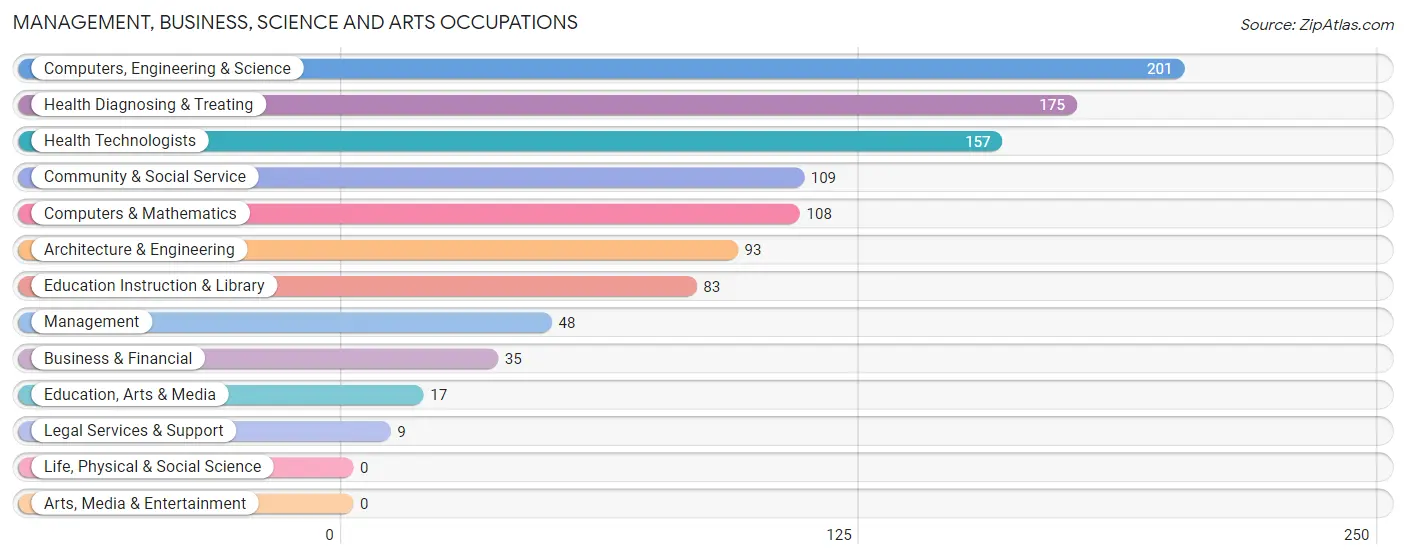
Management, Business, Science and Arts Occupations
The most common Management, Business, Science and Arts occupations in Woodlawn Beach are Computers, Engineering & Science (201 | 14.6%), Health Diagnosing & Treating (175 | 12.8%), Health Technologists (157 | 11.4%), Community & Social Service (109 | 7.9%), and Computers & Mathematics (108 | 7.9%).
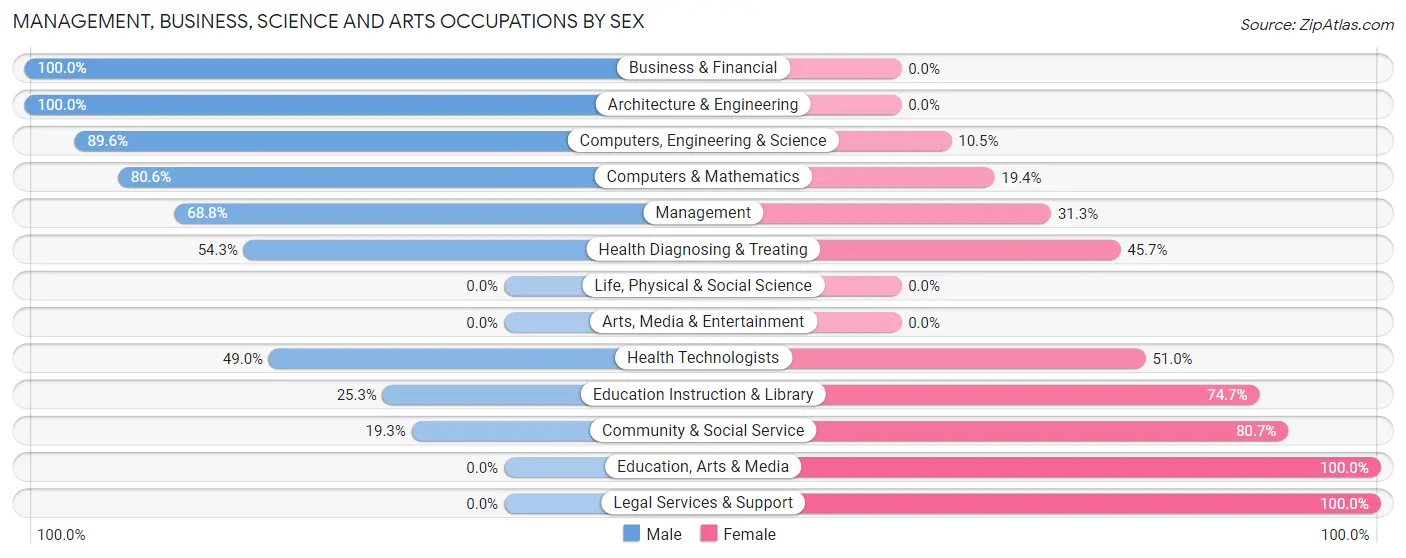
Management, Business, Science and Arts Occupations by Sex
Within the Management, Business, Science and Arts occupations in Woodlawn Beach, the most male-oriented occupations are Business & Financial (100.0%), Architecture & Engineering (100.0%), and Computers, Engineering & Science (89.5%), while the most female-oriented occupations are Education, Arts & Media (100.0%), Legal Services & Support (100.0%), and Community & Social Service (80.7%).
| Occupation | Male | Female |
| Management | 33 (68.8%) | 15 (31.2%) |
| Business & Financial | 35 (100.0%) | 0 (0.0%) |
| Computers, Engineering & Science | 180 (89.5%) | 21 (10.4%) |
| Computers & Mathematics | 87 (80.6%) | 21 (19.4%) |
| Architecture & Engineering | 93 (100.0%) | 0 (0.0%) |
| Life, Physical & Social Science | 0 (0.0%) | 0 (0.0%) |
| Community & Social Service | 21 (19.3%) | 88 (80.7%) |
| Education, Arts & Media | 0 (0.0%) | 17 (100.0%) |
| Legal Services & Support | 0 (0.0%) | 9 (100.0%) |
| Education Instruction & Library | 21 (25.3%) | 62 (74.7%) |
| Arts, Media & Entertainment | 0 (0.0%) | 0 (0.0%) |
| Health Diagnosing & Treating | 95 (54.3%) | 80 (45.7%) |
| Health Technologists | 77 (49.0%) | 80 (51.0%) |
| Total (Category) | 364 (64.1%) | 204 (35.9%) |
| Total (Overall) | 612 (44.6%) | 760 (55.4%) |
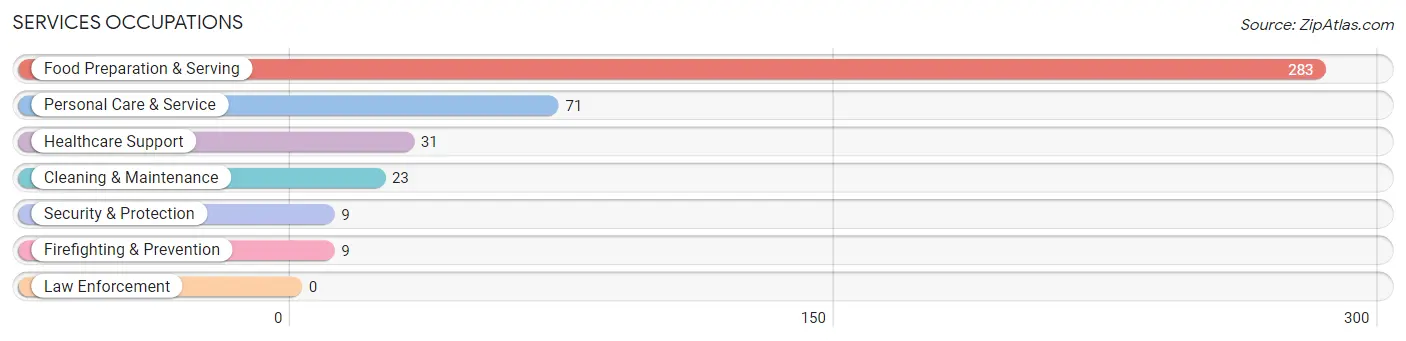
Services Occupations
The most common Services occupations in Woodlawn Beach are Food Preparation & Serving (283 | 20.6%), Personal Care & Service (71 | 5.2%), Healthcare Support (31 | 2.3%), Cleaning & Maintenance (23 | 1.7%), and Security & Protection (9 | 0.7%).
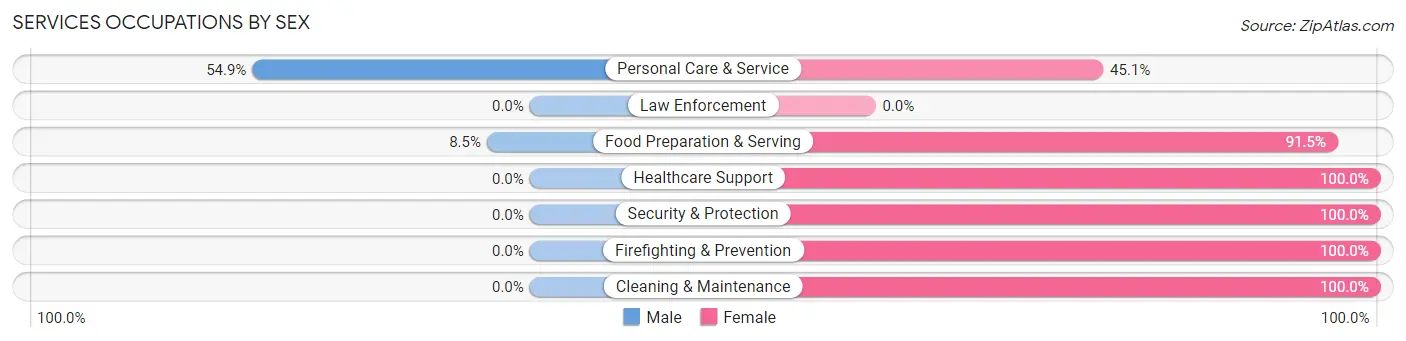
Services Occupations by Sex
Within the Services occupations in Woodlawn Beach, the most male-oriented occupations are Personal Care & Service (54.9%), and Food Preparation & Serving (8.5%), while the most female-oriented occupations are Healthcare Support (100.0%), Security & Protection (100.0%), and Firefighting & Prevention (100.0%).
| Occupation | Male | Female |
| Healthcare Support | 0 (0.0%) | 31 (100.0%) |
| Security & Protection | 0 (0.0%) | 9 (100.0%) |
| Firefighting & Prevention | 0 (0.0%) | 9 (100.0%) |
| Law Enforcement | 0 (0.0%) | 0 (0.0%) |
| Food Preparation & Serving | 24 (8.5%) | 259 (91.5%) |
| Cleaning & Maintenance | 0 (0.0%) | 23 (100.0%) |
| Personal Care & Service | 39 (54.9%) | 32 (45.1%) |
| Total (Category) | 63 (15.1%) | 354 (84.9%) |
| Total (Overall) | 612 (44.6%) | 760 (55.4%) |
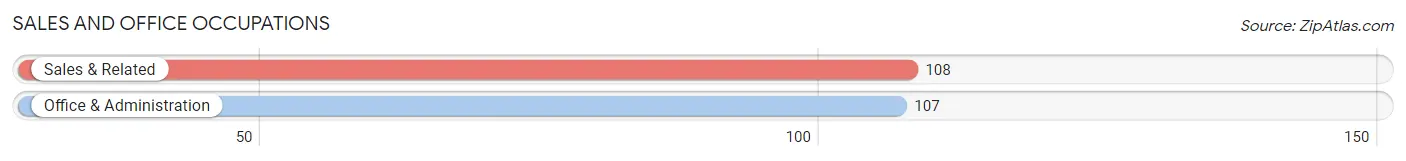
Sales and Office Occupations
The most common Sales and Office occupations in Woodlawn Beach are Sales & Related (108 | 7.9%), and Office & Administration (107 | 7.8%).
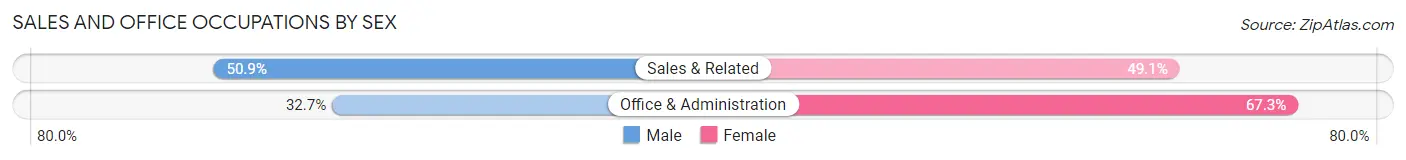
Sales and Office Occupations by Sex
| Occupation | Male | Female |
| Sales & Related | 55 (50.9%) | 53 (49.1%) |
| Office & Administration | 35 (32.7%) | 72 (67.3%) |
| Total (Category) | 90 (41.9%) | 125 (58.1%) |
| Total (Overall) | 612 (44.6%) | 760 (55.4%) |
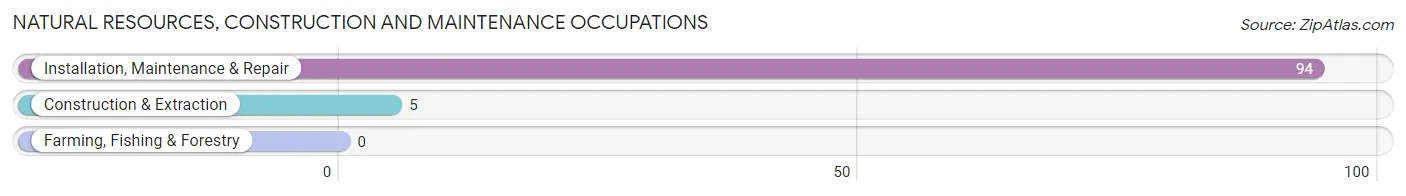
Natural Resources, Construction and Maintenance Occupations
The most common Natural Resources, Construction and Maintenance occupations in Woodlawn Beach are Installation, Maintenance & Repair (94 | 6.9%), and Construction & Extraction (5 | 0.4%).
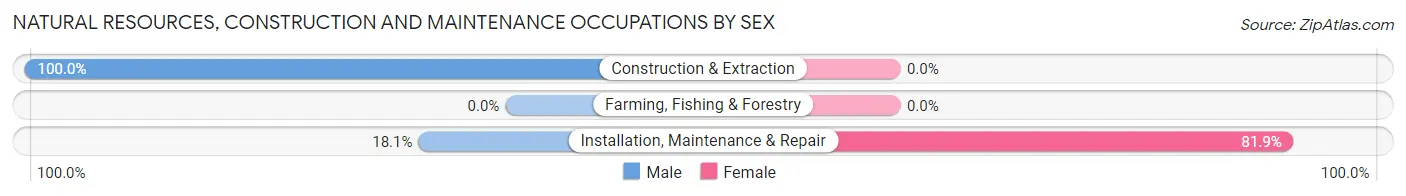
Natural Resources, Construction and Maintenance Occupations by Sex
| Occupation | Male | Female |
| Farming, Fishing & Forestry | 0 (0.0%) | 0 (0.0%) |
| Construction & Extraction | 5 (100.0%) | 0 (0.0%) |
| Installation, Maintenance & Repair | 17 (18.1%) | 77 (81.9%) |
| Total (Category) | 22 (22.2%) | 77 (77.8%) |
| Total (Overall) | 612 (44.6%) | 760 (55.4%) |
Production, Transportation and Moving Occupations
The most common Production, Transportation and Moving occupations in Woodlawn Beach are Transportation (53 | 3.9%), and Material Moving (20 | 1.5%).
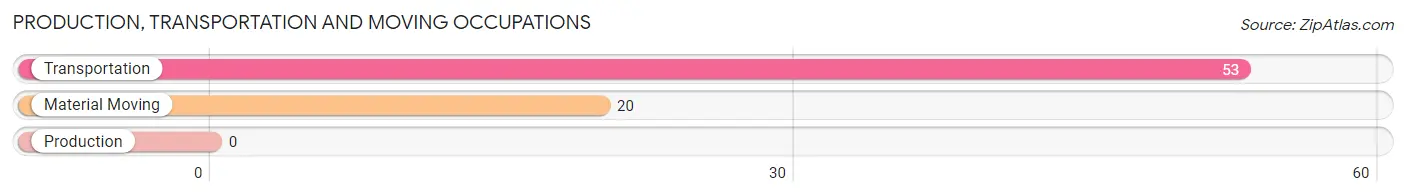
Production, Transportation and Moving Occupations by Sex
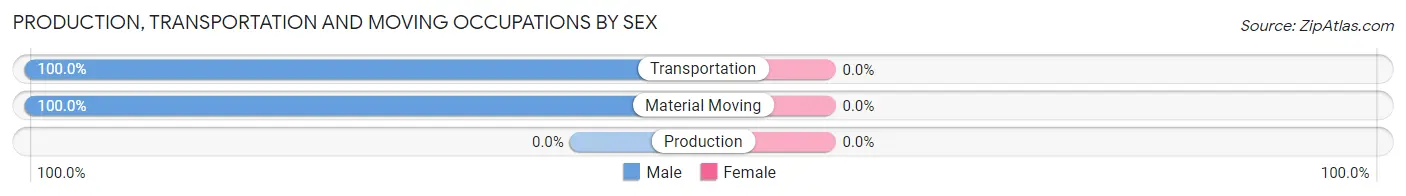
| Occupation | Male | Female |
| Production | 0 (0.0%) | 0 (0.0%) |
| Transportation | 53 (100.0%) | 0 (0.0%) |
| Material Moving | 20 (100.0%) | 0 (0.0%) |
| Total (Category) | 73 (100.0%) | 0 (0.0%) |
| Total (Overall) | 612 (44.6%) | 760 (55.4%) |
Employment Industries by Sex in Woodlawn Beach
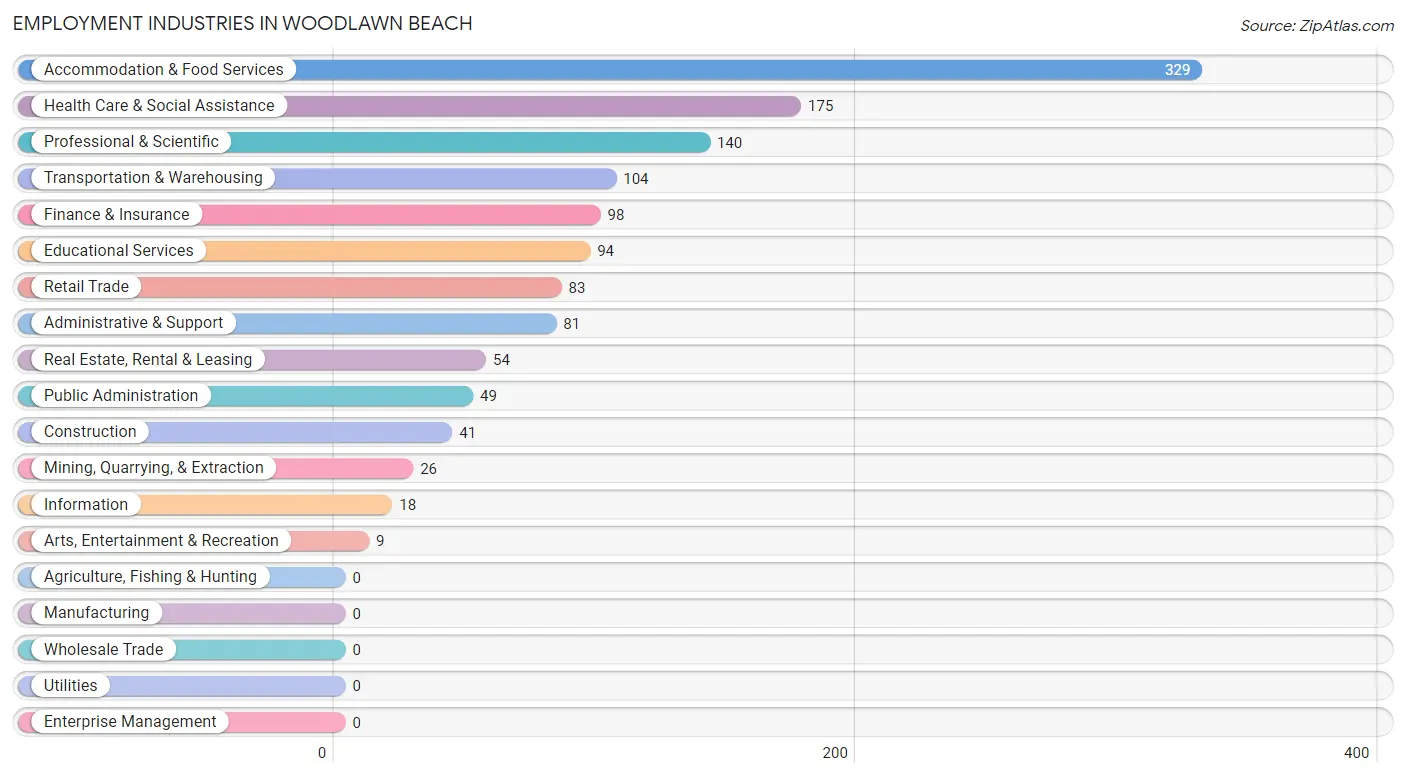
Employment Industries in Woodlawn Beach
The major employment industries in Woodlawn Beach include Accommodation & Food Services (329 | 24.0%), Health Care & Social Assistance (175 | 12.8%), Professional & Scientific (140 | 10.2%), Transportation & Warehousing (104 | 7.6%), and Finance & Insurance (98 | 7.1%).
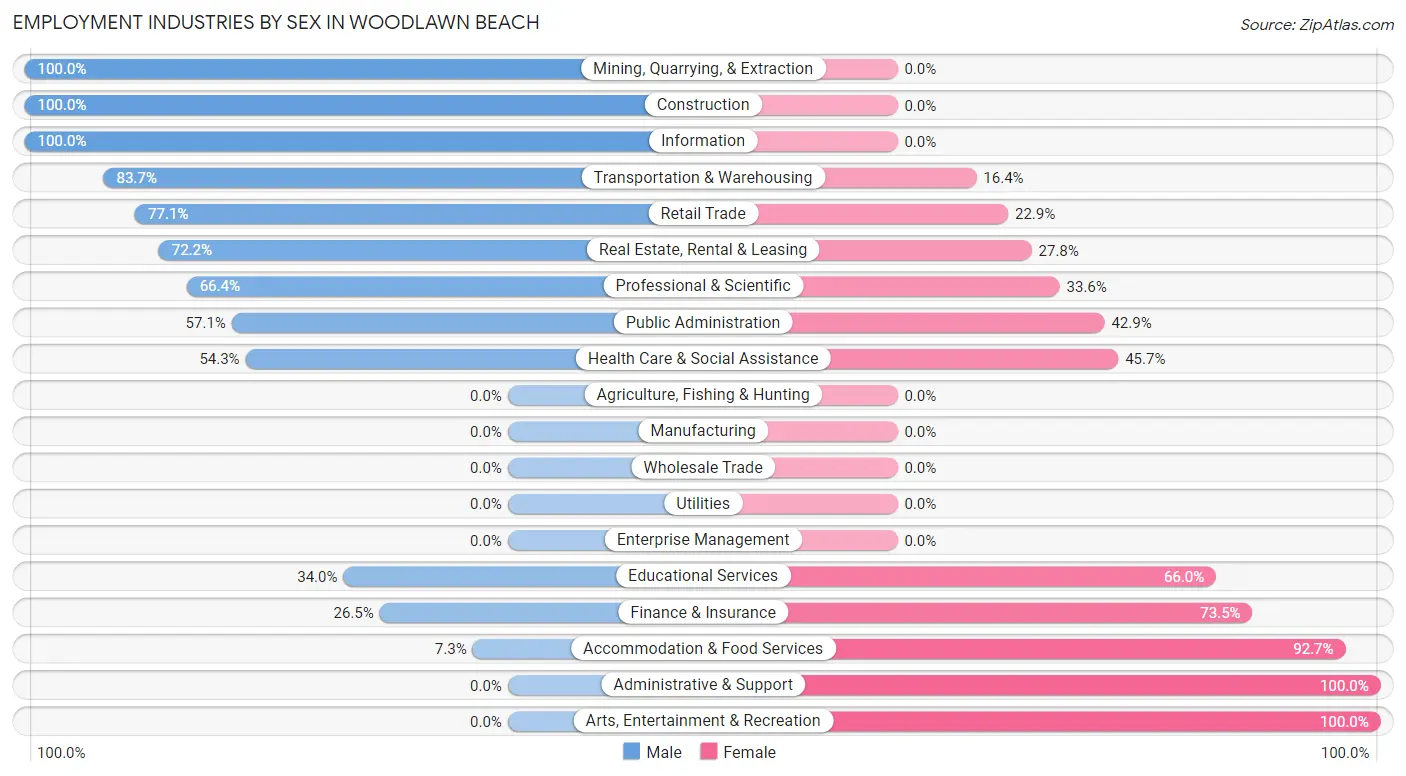
Employment Industries by Sex in Woodlawn Beach
The Woodlawn Beach industries that see more men than women are Mining, Quarrying, & Extraction (100.0%), Construction (100.0%), and Information (100.0%), whereas the industries that tend to have a higher number of women are Administrative & Support (100.0%), Arts, Entertainment & Recreation (100.0%), and Accommodation & Food Services (92.7%).
| Industry | Male | Female |
| Agriculture, Fishing & Hunting | 0 (0.0%) | 0 (0.0%) |
| Mining, Quarrying, & Extraction | 26 (100.0%) | 0 (0.0%) |
| Construction | 41 (100.0%) | 0 (0.0%) |
| Manufacturing | 0 (0.0%) | 0 (0.0%) |
| Wholesale Trade | 0 (0.0%) | 0 (0.0%) |
| Retail Trade | 64 (77.1%) | 19 (22.9%) |
| Transportation & Warehousing | 87 (83.7%) | 17 (16.4%) |
| Utilities | 0 (0.0%) | 0 (0.0%) |
| Information | 18 (100.0%) | 0 (0.0%) |
| Finance & Insurance | 26 (26.5%) | 72 (73.5%) |
| Real Estate, Rental & Leasing | 39 (72.2%) | 15 (27.8%) |
| Professional & Scientific | 93 (66.4%) | 47 (33.6%) |
| Enterprise Management | 0 (0.0%) | 0 (0.0%) |
| Administrative & Support | 0 (0.0%) | 81 (100.0%) |
| Educational Services | 32 (34.0%) | 62 (66.0%) |
| Health Care & Social Assistance | 95 (54.3%) | 80 (45.7%) |
| Arts, Entertainment & Recreation | 0 (0.0%) | 9 (100.0%) |
| Accommodation & Food Services | 24 (7.3%) | 305 (92.7%) |
| Public Administration | 28 (57.1%) | 21 (42.9%) |
| Total | 612 (44.6%) | 760 (55.4%) |
Education in Woodlawn Beach
School Enrollment in Woodlawn Beach
The most common levels of schooling among the 578 students in Woodlawn Beach are middle school (158 | 27.3%), kindergarten (145 | 25.1%), and college / undergraduate (90 | 15.6%).
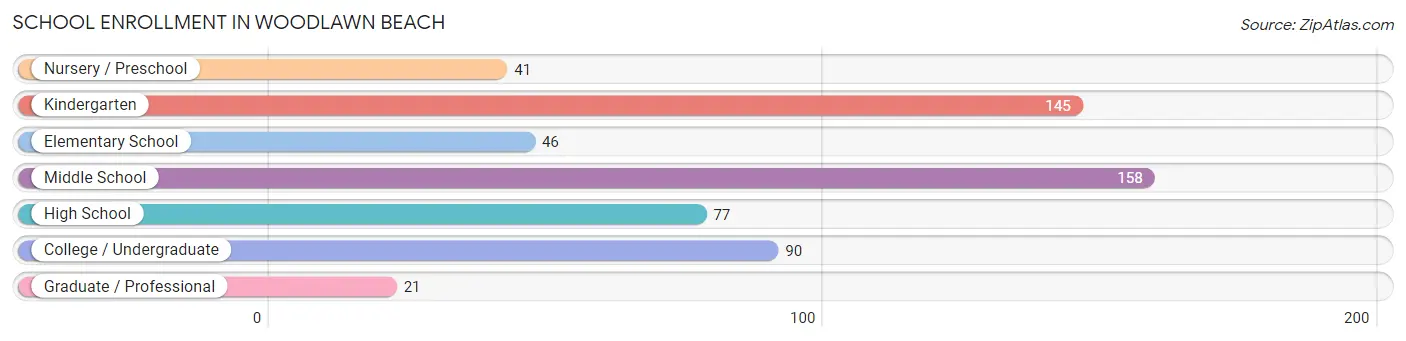
| School Level | # Students | % Students |
| Nursery / Preschool | 41 | 7.1% |
| Kindergarten | 145 | 25.1% |
| Elementary School | 46 | 8.0% |
| Middle School | 158 | 27.3% |
| High School | 77 | 13.3% |
| College / Undergraduate | 90 | 15.6% |
| Graduate / Professional | 21 | 3.6% |
| Total | 578 | 100.0% |
School Enrollment by Age by Funding Source in Woodlawn Beach
Out of a total of 578 students who are enrolled in schools in Woodlawn Beach, 71 (12.3%) attend a private institution, while the remaining 507 (87.7%) are enrolled in public schools. The age group of 35 years and over has the highest likelihood of being enrolled in private schools, with 21 (100.0% in the age bracket) enrolled. Conversely, the age group of 10 to 14 year olds has the lowest likelihood of being enrolled in a private school, with 186 (100.0% in the age bracket) attending a public institution.
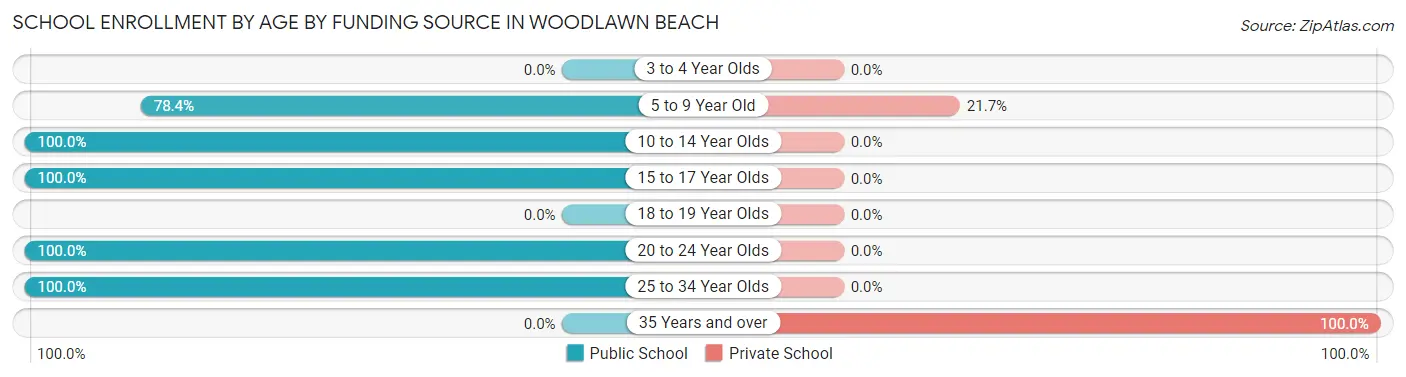
| Age Bracket | Public School | Private School |
| 3 to 4 Year Olds | 0 (0.0%) | 0 (0.0%) |
| 5 to 9 Year Old | 181 (78.3%) | 50 (21.6%) |
| 10 to 14 Year Olds | 186 (100.0%) | 0 (0.0%) |
| 15 to 17 Year Olds | 50 (100.0%) | 0 (0.0%) |
| 18 to 19 Year Olds | 0 (0.0%) | 0 (0.0%) |
| 20 to 24 Year Olds | 59 (100.0%) | 0 (0.0%) |
| 25 to 34 Year Olds | 31 (100.0%) | 0 (0.0%) |
| 35 Years and over | 0 (0.0%) | 21 (100.0%) |
| Total | 507 (87.7%) | 71 (12.3%) |
Educational Attainment by Field of Study in Woodlawn Beach
Business (315 | 35.5%), science & technology (114 | 12.9%), arts & humanities (109 | 12.3%), education (87 | 9.8%), and psychology (59 | 6.7%) are the most common fields of study among 886 individuals in Woodlawn Beach who have obtained a bachelor's degree or higher.
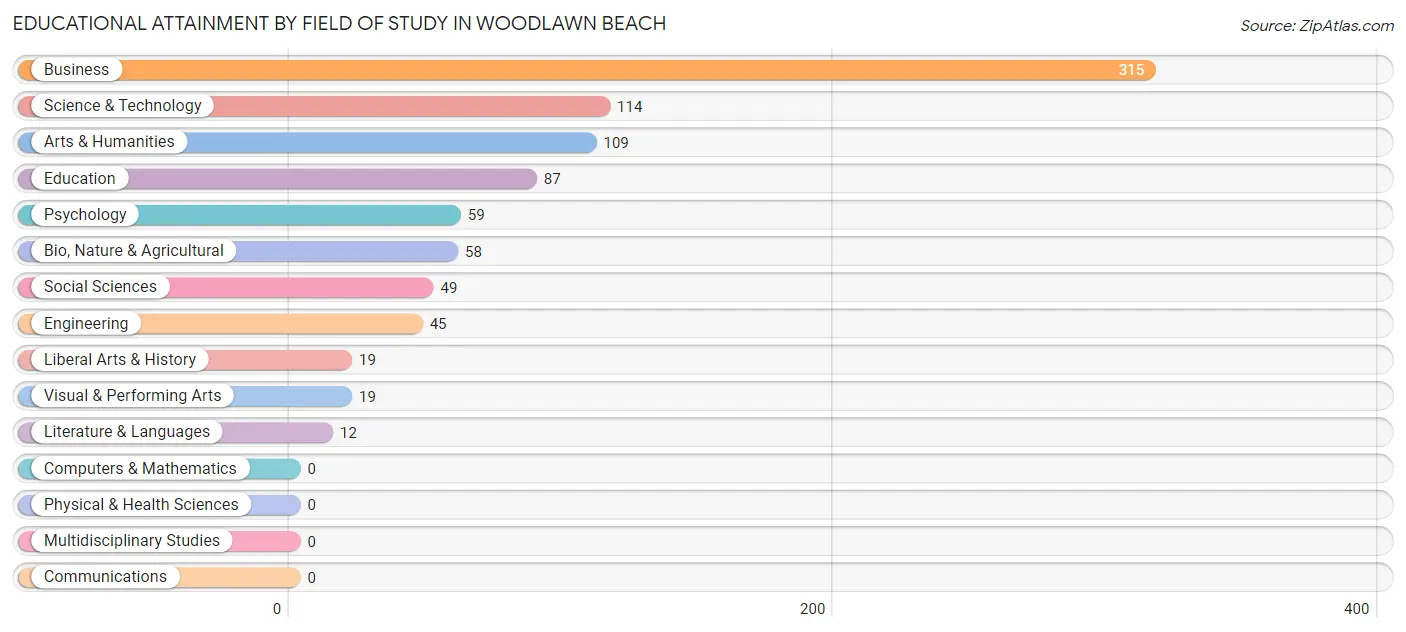
| Field of Study | # Graduates | % Graduates |
| Computers & Mathematics | 0 | 0.0% |
| Bio, Nature & Agricultural | 58 | 6.6% |
| Physical & Health Sciences | 0 | 0.0% |
| Psychology | 59 | 6.7% |
| Social Sciences | 49 | 5.5% |
| Engineering | 45 | 5.1% |
| Multidisciplinary Studies | 0 | 0.0% |
| Science & Technology | 114 | 12.9% |
| Business | 315 | 35.5% |
| Education | 87 | 9.8% |
| Literature & Languages | 12 | 1.3% |
| Liberal Arts & History | 19 | 2.1% |
| Visual & Performing Arts | 19 | 2.1% |
| Communications | 0 | 0.0% |
| Arts & Humanities | 109 | 12.3% |
| Total | 886 | 100.0% |
Transportation & Commute in Woodlawn Beach
Vehicle Availability by Sex in Woodlawn Beach
The most prevalent vehicle ownership categories in Woodlawn Beach are males with 2 vehicles (346, accounting for 50.0%) and females with 2 vehicles (261, making up 46.4%).
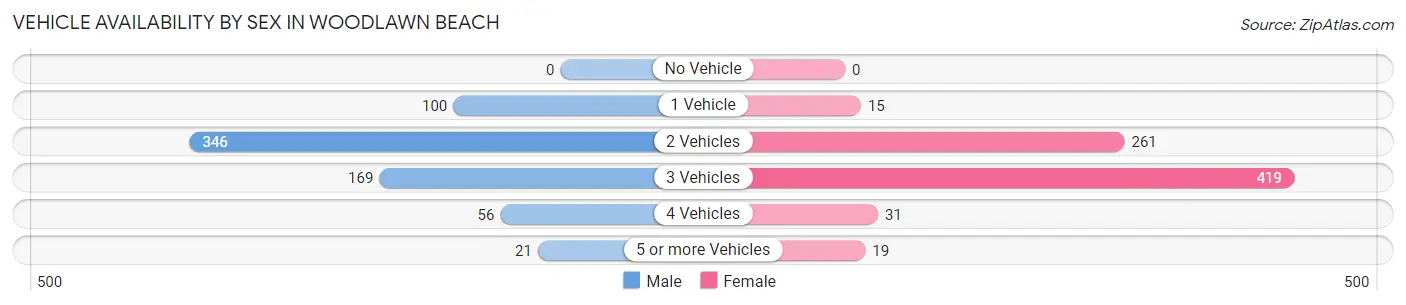
| Vehicles Available | Male | Female |
| No Vehicle | 0 (0.0%) | 0 (0.0%) |
| 1 Vehicle | 100 (14.4%) | 15 (2.0%) |
| 2 Vehicles | 346 (50.0%) | 261 (35.0%) |
| 3 Vehicles | 169 (24.4%) | 419 (56.2%) |
| 4 Vehicles | 56 (8.1%) | 31 (4.2%) |
| 5 or more Vehicles | 21 (3.0%) | 19 (2.5%) |
| Total | 692 (100.0%) | 745 (100.0%) |
Commute Time in Woodlawn Beach
The most frequently occuring commute durations in Woodlawn Beach are 30 to 34 minutes (451 commuters, 32.7%), 40 to 44 minutes (234 commuters, 17.0%), and 45 to 59 minutes (152 commuters, 11.0%).
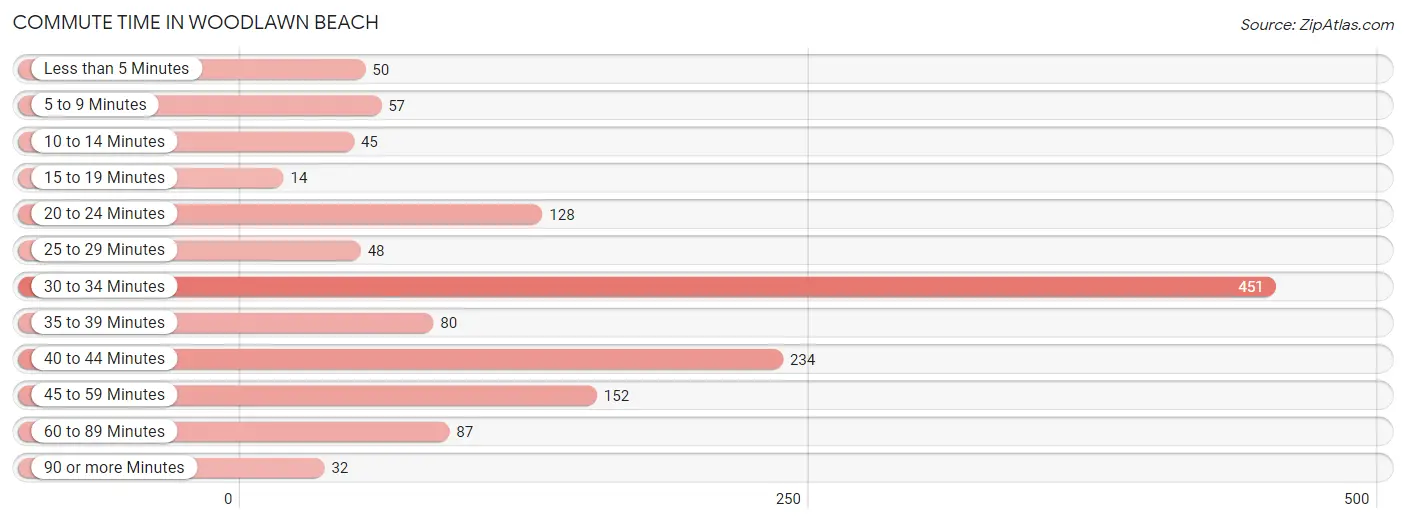
| Commute Time | # Commuters | % Commuters |
| Less than 5 Minutes | 50 | 3.6% |
| 5 to 9 Minutes | 57 | 4.1% |
| 10 to 14 Minutes | 45 | 3.3% |
| 15 to 19 Minutes | 14 | 1.0% |
| 20 to 24 Minutes | 128 | 9.3% |
| 25 to 29 Minutes | 48 | 3.5% |
| 30 to 34 Minutes | 451 | 32.7% |
| 35 to 39 Minutes | 80 | 5.8% |
| 40 to 44 Minutes | 234 | 17.0% |
| 45 to 59 Minutes | 152 | 11.0% |
| 60 to 89 Minutes | 87 | 6.3% |
| 90 or more Minutes | 32 | 2.3% |
Commute Time by Sex in Woodlawn Beach
The most common commute times in Woodlawn Beach are 40 to 44 minutes (138 commuters, 20.3%) for males and 30 to 34 minutes (316 commuters, 45.3%) for females.
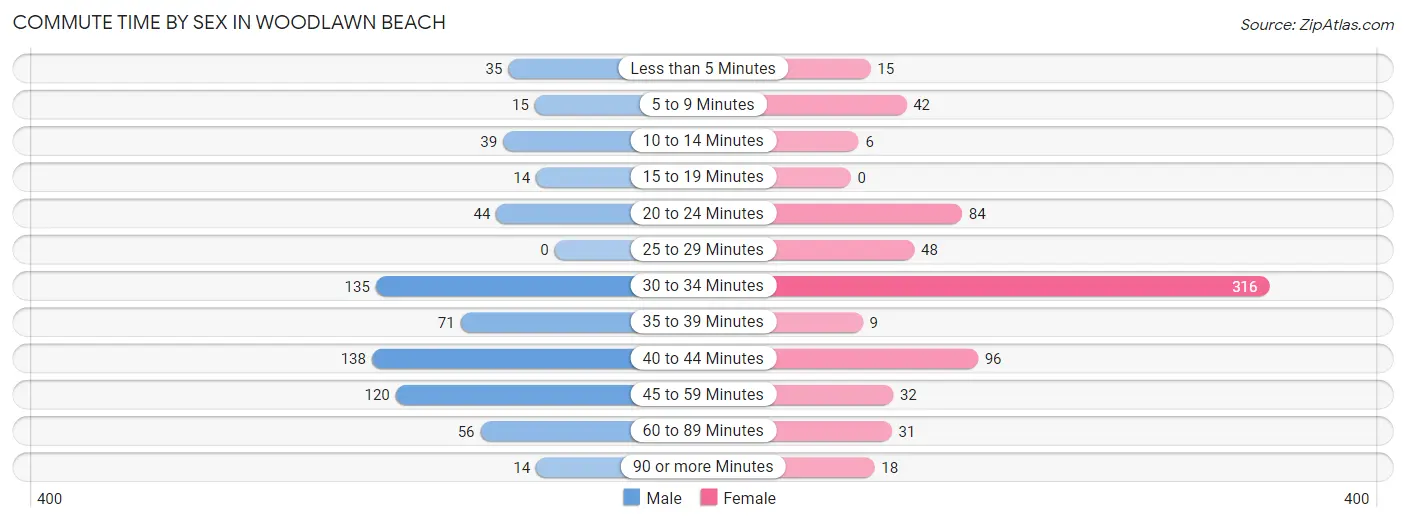
| Commute Time | Male | Female |
| Less than 5 Minutes | 35 (5.1%) | 15 (2.1%) |
| 5 to 9 Minutes | 15 (2.2%) | 42 (6.0%) |
| 10 to 14 Minutes | 39 (5.7%) | 6 (0.9%) |
| 15 to 19 Minutes | 14 (2.1%) | 0 (0.0%) |
| 20 to 24 Minutes | 44 (6.5%) | 84 (12.0%) |
| 25 to 29 Minutes | 0 (0.0%) | 48 (6.9%) |
| 30 to 34 Minutes | 135 (19.8%) | 316 (45.3%) |
| 35 to 39 Minutes | 71 (10.4%) | 9 (1.3%) |
| 40 to 44 Minutes | 138 (20.3%) | 96 (13.8%) |
| 45 to 59 Minutes | 120 (17.6%) | 32 (4.6%) |
| 60 to 89 Minutes | 56 (8.2%) | 31 (4.4%) |
| 90 or more Minutes | 14 (2.1%) | 18 (2.6%) |
Time of Departure to Work by Sex in Woodlawn Beach
The most frequent times of departure to work in Woodlawn Beach are 6:00 AM to 6:29 AM (128, 18.8%) for males and 12:00 PM to 3:59 PM (250, 35.9%) for females.
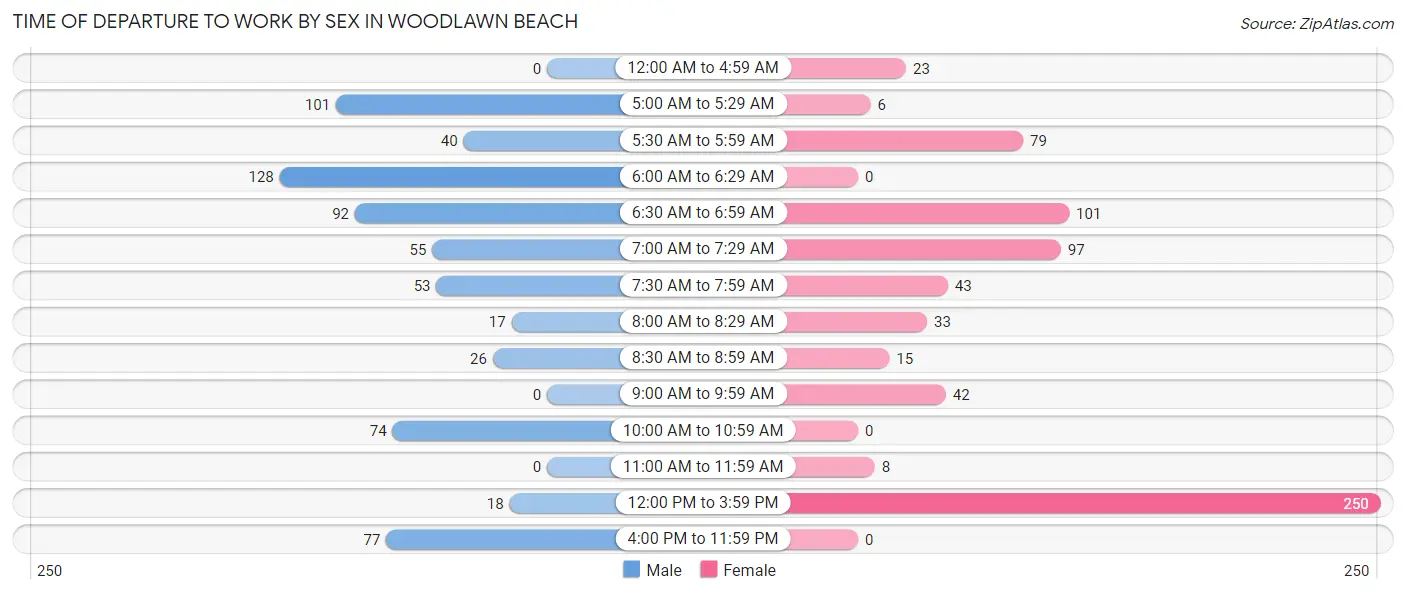
| Time of Departure | Male | Female |
| 12:00 AM to 4:59 AM | 0 (0.0%) | 23 (3.3%) |
| 5:00 AM to 5:29 AM | 101 (14.8%) | 6 (0.9%) |
| 5:30 AM to 5:59 AM | 40 (5.9%) | 79 (11.3%) |
| 6:00 AM to 6:29 AM | 128 (18.8%) | 0 (0.0%) |
| 6:30 AM to 6:59 AM | 92 (13.5%) | 101 (14.5%) |
| 7:00 AM to 7:29 AM | 55 (8.1%) | 97 (13.9%) |
| 7:30 AM to 7:59 AM | 53 (7.8%) | 43 (6.2%) |
| 8:00 AM to 8:29 AM | 17 (2.5%) | 33 (4.7%) |
| 8:30 AM to 8:59 AM | 26 (3.8%) | 15 (2.1%) |
| 9:00 AM to 9:59 AM | 0 (0.0%) | 42 (6.0%) |
| 10:00 AM to 10:59 AM | 74 (10.9%) | 0 (0.0%) |
| 11:00 AM to 11:59 AM | 0 (0.0%) | 8 (1.1%) |
| 12:00 PM to 3:59 PM | 18 (2.6%) | 250 (35.9%) |
| 4:00 PM to 11:59 PM | 77 (11.3%) | 0 (0.0%) |
| Total | 681 (100.0%) | 697 (100.0%) |
Housing Occupancy in Woodlawn Beach
Occupancy by Ownership in Woodlawn Beach
Of the total 1,221 dwellings in Woodlawn Beach, owner-occupied units account for 1,173 (96.1%), while renter-occupied units make up 48 (3.9%).
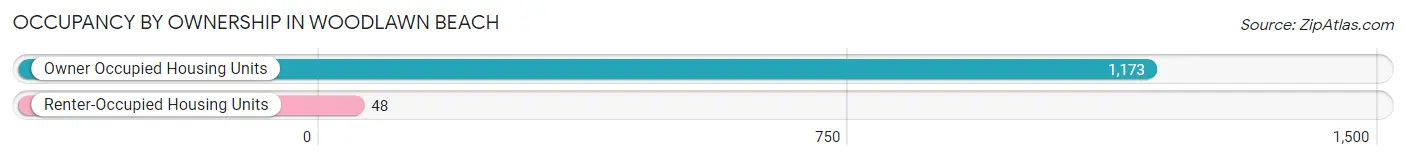
| Occupancy | # Housing Units | % Housing Units |
| Owner Occupied Housing Units | 1,173 | 96.1% |
| Renter-Occupied Housing Units | 48 | 3.9% |
| Total Occupied Housing Units | 1,221 | 100.0% |
Occupancy by Household Size in Woodlawn Beach
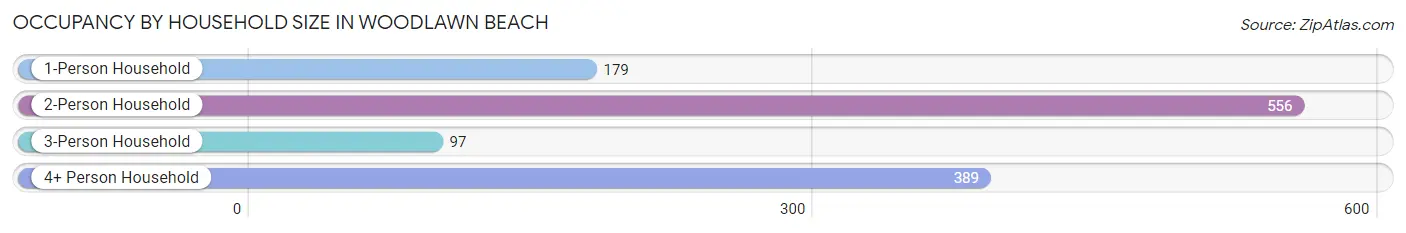
| Household Size | # Housing Units | % Housing Units |
| 1-Person Household | 179 | 14.7% |
| 2-Person Household | 556 | 45.5% |
| 3-Person Household | 97 | 7.9% |
| 4+ Person Household | 389 | 31.9% |
| Total Housing Units | 1,221 | 100.0% |
Occupancy by Ownership by Household Size in Woodlawn Beach
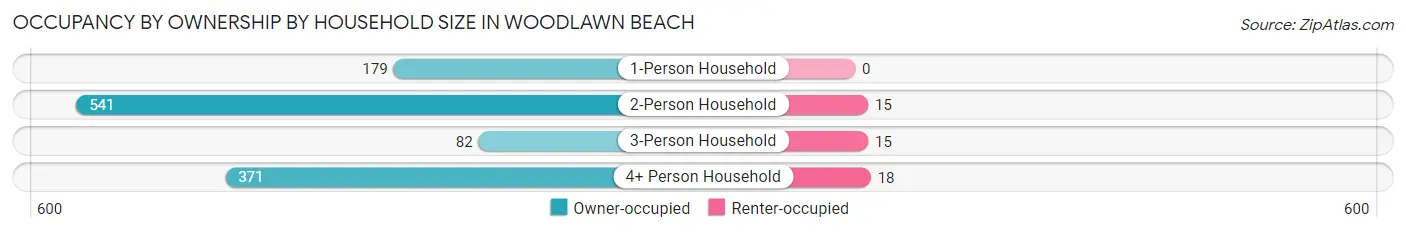
| Household Size | Owner-occupied | Renter-occupied |
| 1-Person Household | 179 (100.0%) | 0 (0.0%) |
| 2-Person Household | 541 (97.3%) | 15 (2.7%) |
| 3-Person Household | 82 (84.5%) | 15 (15.5%) |
| 4+ Person Household | 371 (95.4%) | 18 (4.6%) |
| Total Housing Units | 1,173 (96.1%) | 48 (3.9%) |
Occupancy by Educational Attainment in Woodlawn Beach
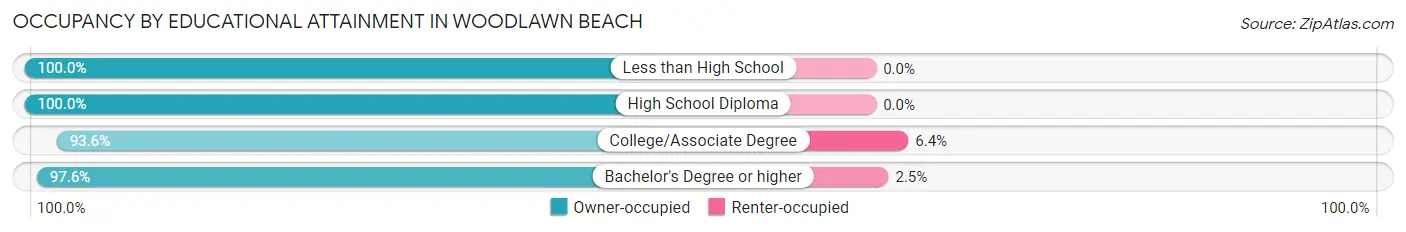
| Household Size | Owner-occupied | Renter-occupied |
| Less than High School | 21 (100.0%) | 0 (0.0%) |
| High School Diploma | 70 (100.0%) | 0 (0.0%) |
| College/Associate Degree | 484 (93.6%) | 33 (6.4%) |
| Bachelor's Degree or higher | 598 (97.6%) | 15 (2.5%) |
Occupancy by Age of Householder in Woodlawn Beach
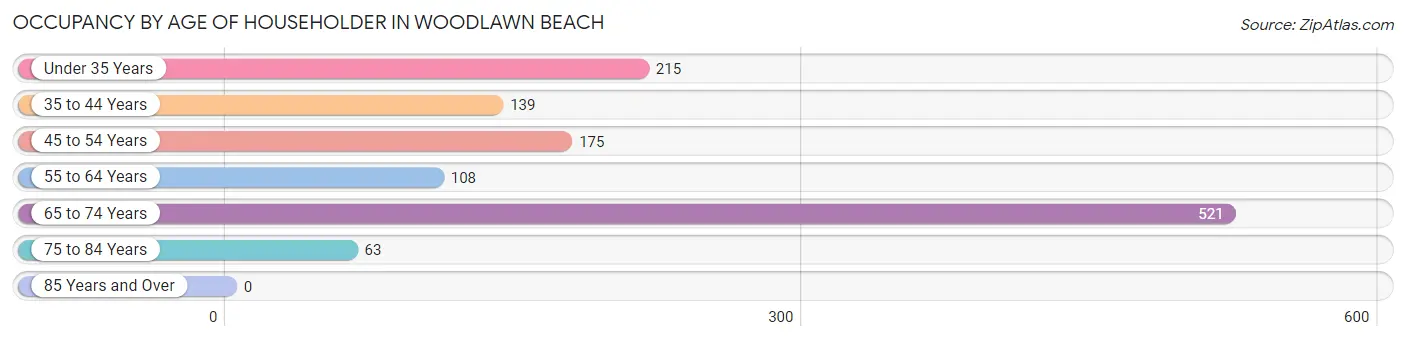
| Age Bracket | # Households | % Households |
| Under 35 Years | 215 | 17.6% |
| 35 to 44 Years | 139 | 11.4% |
| 45 to 54 Years | 175 | 14.3% |
| 55 to 64 Years | 108 | 8.8% |
| 65 to 74 Years | 521 | 42.7% |
| 75 to 84 Years | 63 | 5.2% |
| 85 Years and Over | 0 | 0.0% |
| Total | 1,221 | 100.0% |
Housing Finances in Woodlawn Beach
Median Income by Occupancy in Woodlawn Beach
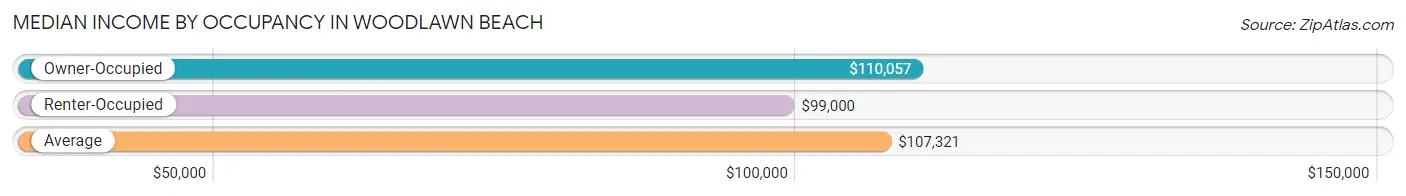
| Occupancy Type | # Households | Median Income |
| Owner-Occupied | 1,173 (96.1%) | $110,057 |
| Renter-Occupied | 48 (3.9%) | $99,000 |
| Average | 1,221 (100.0%) | $107,321 |
Occupancy by Householder Income Bracket in Woodlawn Beach
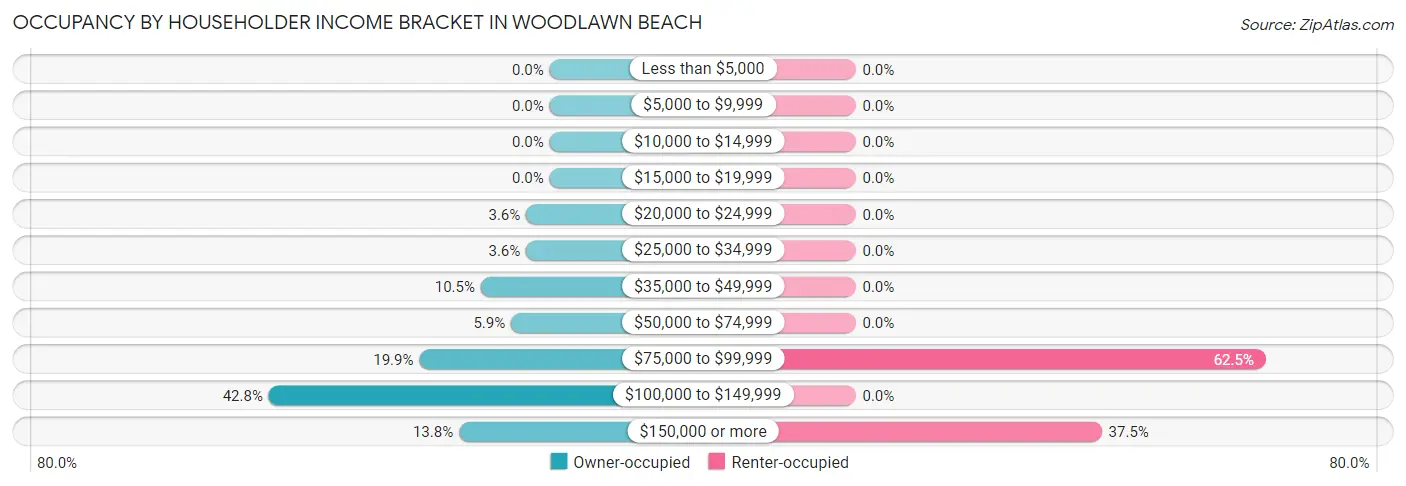
| Income Bracket | Owner-occupied | Renter-occupied |
| Less than $5,000 | 0 (0.0%) | 0 (0.0%) |
| $5,000 to $9,999 | 0 (0.0%) | 0 (0.0%) |
| $10,000 to $14,999 | 0 (0.0%) | 0 (0.0%) |
| $15,000 to $19,999 | 0 (0.0%) | 0 (0.0%) |
| $20,000 to $24,999 | 42 (3.6%) | 0 (0.0%) |
| $25,000 to $34,999 | 42 (3.6%) | 0 (0.0%) |
| $35,000 to $49,999 | 123 (10.5%) | 0 (0.0%) |
| $50,000 to $74,999 | 69 (5.9%) | 0 (0.0%) |
| $75,000 to $99,999 | 233 (19.9%) | 30 (62.5%) |
| $100,000 to $149,999 | 502 (42.8%) | 0 (0.0%) |
| $150,000 or more | 162 (13.8%) | 18 (37.5%) |
| Total | 1,173 (100.0%) | 48 (100.0%) |
Monthly Housing Cost Tiers in Woodlawn Beach
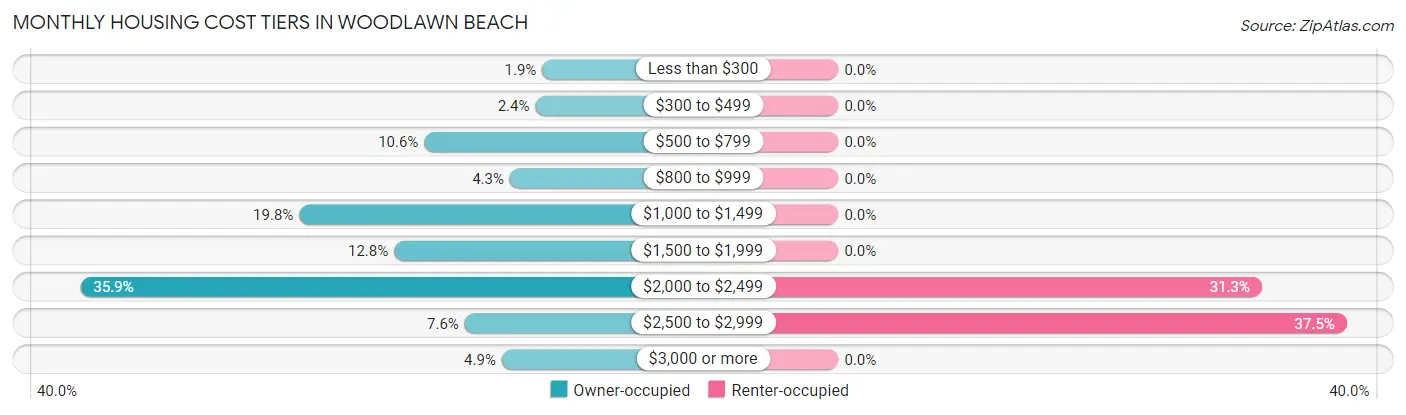
| Monthly Cost | Owner-occupied | Renter-occupied |
| Less than $300 | 22 (1.9%) | 0 (0.0%) |
| $300 to $499 | 28 (2.4%) | 0 (0.0%) |
| $500 to $799 | 124 (10.6%) | 0 (0.0%) |
| $800 to $999 | 50 (4.3%) | 0 (0.0%) |
| $1,000 to $1,499 | 232 (19.8%) | 0 (0.0%) |
| $1,500 to $1,999 | 150 (12.8%) | 0 (0.0%) |
| $2,000 to $2,499 | 421 (35.9%) | 15 (31.2%) |
| $2,500 to $2,999 | 89 (7.6%) | 18 (37.5%) |
| $3,000 or more | 57 (4.9%) | 0 (0.0%) |
| Total | 1,173 (100.0%) | 48 (100.0%) |
Physical Housing Characteristics in Woodlawn Beach
Housing Structures in Woodlawn Beach
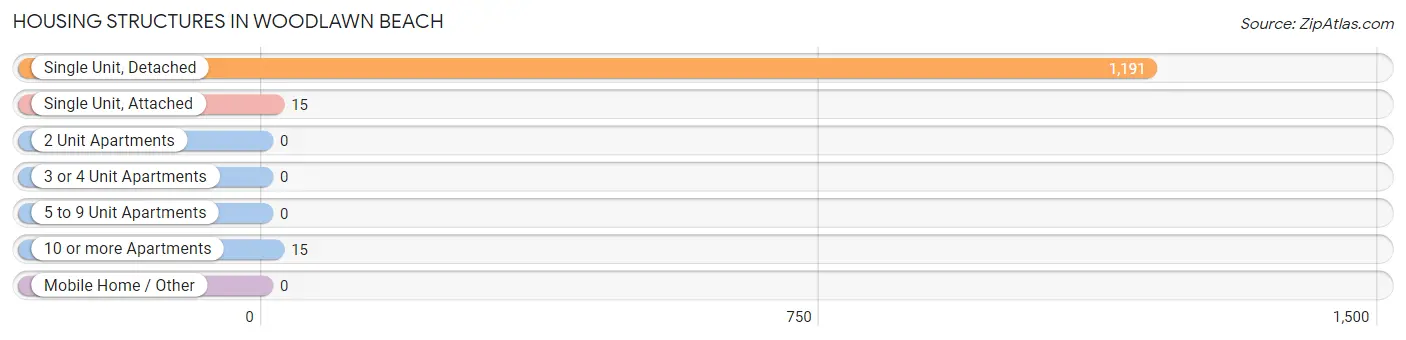
| Structure Type | # Housing Units | % Housing Units |
| Single Unit, Detached | 1,191 | 97.5% |
| Single Unit, Attached | 15 | 1.2% |
| 2 Unit Apartments | 0 | 0.0% |
| 3 or 4 Unit Apartments | 0 | 0.0% |
| 5 to 9 Unit Apartments | 0 | 0.0% |
| 10 or more Apartments | 15 | 1.2% |
| Mobile Home / Other | 0 | 0.0% |
| Total | 1,221 | 100.0% |
Housing Structures by Occupancy in Woodlawn Beach

| Structure Type | Owner-occupied | Renter-occupied |
| Single Unit, Detached | 1,158 (97.2%) | 33 (2.8%) |
| Single Unit, Attached | 0 (0.0%) | 15 (100.0%) |
| 2 Unit Apartments | 0 (0.0%) | 0 (0.0%) |
| 3 or 4 Unit Apartments | 0 (0.0%) | 0 (0.0%) |
| 5 to 9 Unit Apartments | 0 (0.0%) | 0 (0.0%) |
| 10 or more Apartments | 15 (100.0%) | 0 (0.0%) |
| Mobile Home / Other | 0 (0.0%) | 0 (0.0%) |
| Total | 1,173 (96.1%) | 48 (3.9%) |
Housing Structures by Number of Rooms in Woodlawn Beach
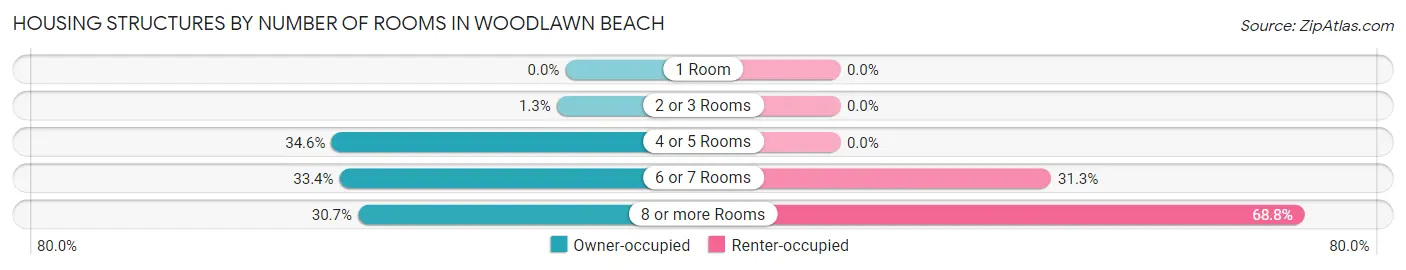
| Number of Rooms | Owner-occupied | Renter-occupied |
| 1 Room | 0 (0.0%) | 0 (0.0%) |
| 2 or 3 Rooms | 15 (1.3%) | 0 (0.0%) |
| 4 or 5 Rooms | 406 (34.6%) | 0 (0.0%) |
| 6 or 7 Rooms | 392 (33.4%) | 15 (31.2%) |
| 8 or more Rooms | 360 (30.7%) | 33 (68.8%) |
| Total | 1,173 (100.0%) | 48 (100.0%) |
Housing Structure by Heating Type in Woodlawn Beach
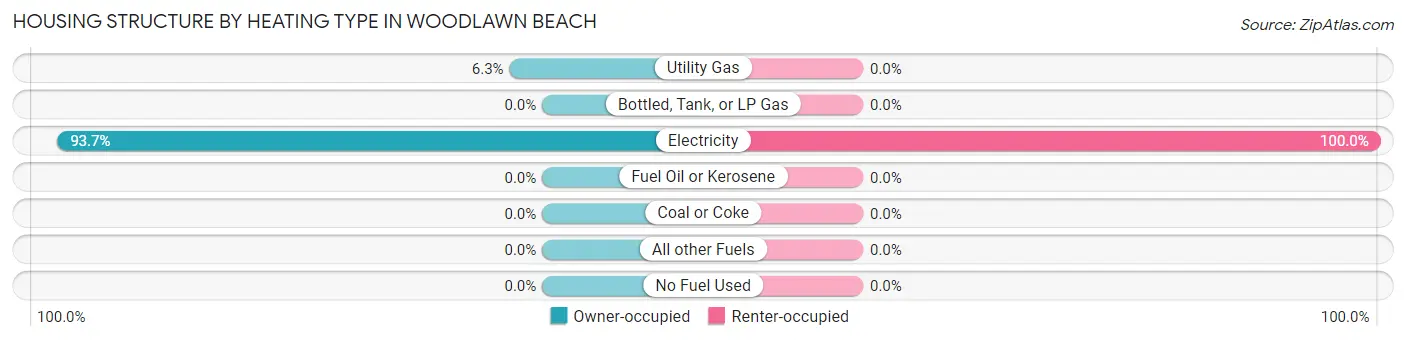
| Heating Type | Owner-occupied | Renter-occupied |
| Utility Gas | 74 (6.3%) | 0 (0.0%) |
| Bottled, Tank, or LP Gas | 0 (0.0%) | 0 (0.0%) |
| Electricity | 1,099 (93.7%) | 48 (100.0%) |
| Fuel Oil or Kerosene | 0 (0.0%) | 0 (0.0%) |
| Coal or Coke | 0 (0.0%) | 0 (0.0%) |
| All other Fuels | 0 (0.0%) | 0 (0.0%) |
| No Fuel Used | 0 (0.0%) | 0 (0.0%) |
| Total | 1,173 (100.0%) | 48 (100.0%) |
Household Vehicle Usage in Woodlawn Beach
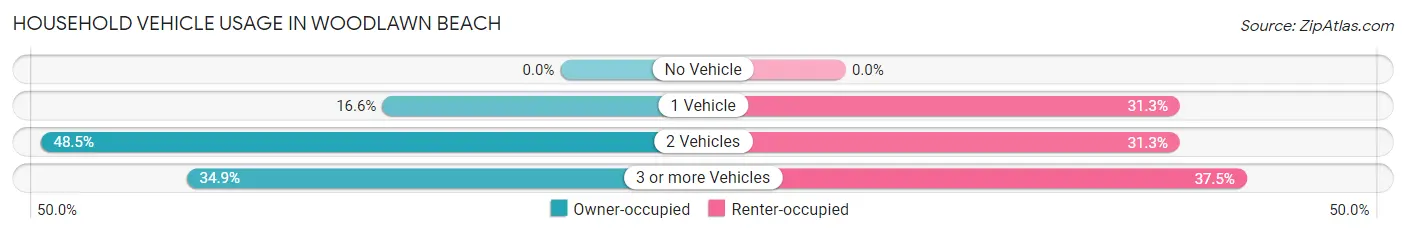
| Vehicles per Household | Owner-occupied | Renter-occupied |
| No Vehicle | 0 (0.0%) | 0 (0.0%) |
| 1 Vehicle | 195 (16.6%) | 15 (31.2%) |
| 2 Vehicles | 569 (48.5%) | 15 (31.2%) |
| 3 or more Vehicles | 409 (34.9%) | 18 (37.5%) |
| Total | 1,173 (100.0%) | 48 (100.0%) |
Real Estate & Mortgages in Woodlawn Beach
Real Estate and Mortgage Overview in Woodlawn Beach
| Characteristic | Without Mortgage | With Mortgage |
| Housing Units | 290 | 883 |
| Median Property Value | $477,600 | $347,700 |
| Median Household Income | $81,731 | $123 |
| Monthly Housing Costs | $797 | $57 |
| Real Estate Taxes | $2,990 | $132 |
Property Value by Mortgage Status in Woodlawn Beach
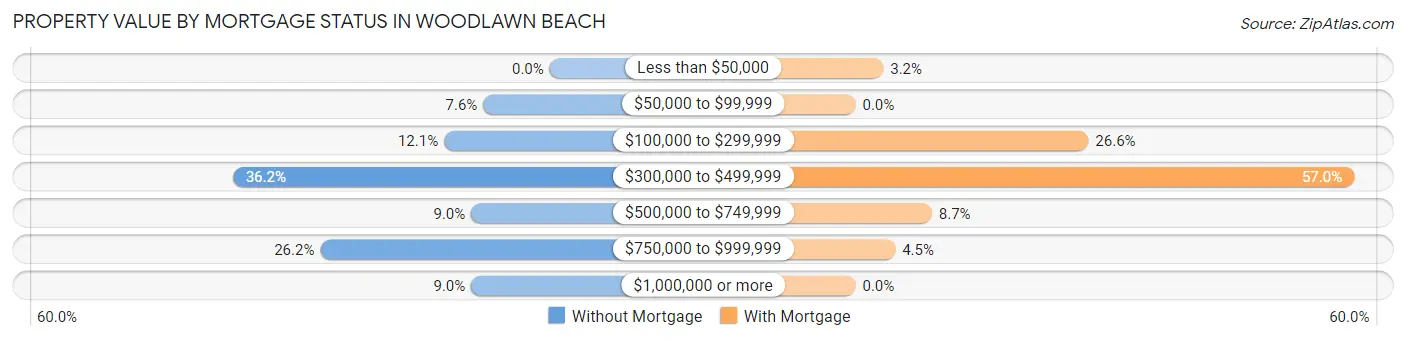
| Property Value | Without Mortgage | With Mortgage |
| Less than $50,000 | 0 (0.0%) | 28 (3.2%) |
| $50,000 to $99,999 | 22 (7.6%) | 0 (0.0%) |
| $100,000 to $299,999 | 35 (12.1%) | 235 (26.6%) |
| $300,000 to $499,999 | 105 (36.2%) | 503 (57.0%) |
| $500,000 to $749,999 | 26 (9.0%) | 77 (8.7%) |
| $750,000 to $999,999 | 76 (26.2%) | 40 (4.5%) |
| $1,000,000 or more | 26 (9.0%) | 0 (0.0%) |
| Total | 290 (100.0%) | 883 (100.0%) |
Household Income by Mortgage Status in Woodlawn Beach
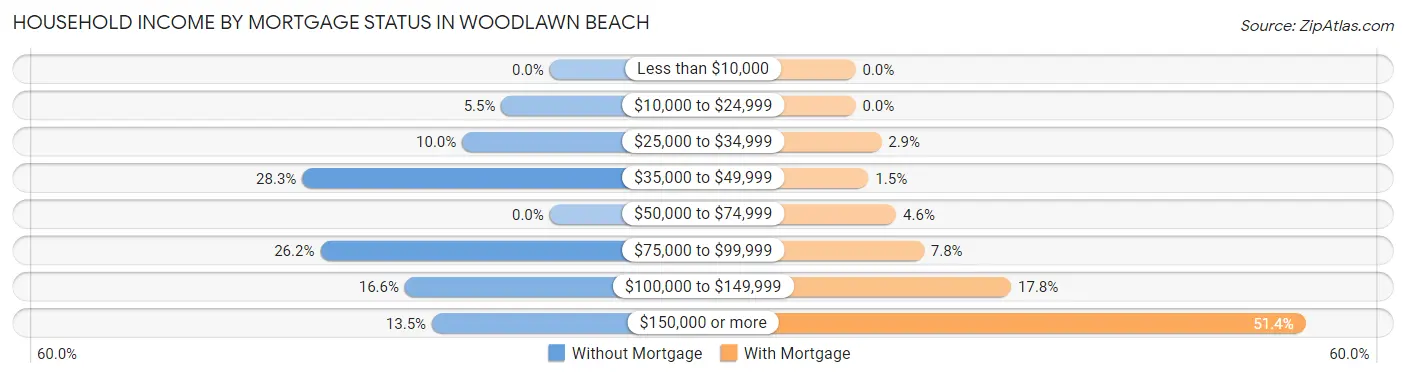
| Household Income | Without Mortgage | With Mortgage |
| Less than $10,000 | 0 (0.0%) | 0 (0.0%) |
| $10,000 to $24,999 | 16 (5.5%) | 0 (0.0%) |
| $25,000 to $34,999 | 29 (10.0%) | 26 (2.9%) |
| $35,000 to $49,999 | 82 (28.3%) | 13 (1.5%) |
| $50,000 to $74,999 | 0 (0.0%) | 41 (4.6%) |
| $75,000 to $99,999 | 76 (26.2%) | 69 (7.8%) |
| $100,000 to $149,999 | 48 (16.6%) | 157 (17.8%) |
| $150,000 or more | 39 (13.5%) | 454 (51.4%) |
| Total | 290 (100.0%) | 883 (100.0%) |
Property Value to Household Income Ratio in Woodlawn Beach
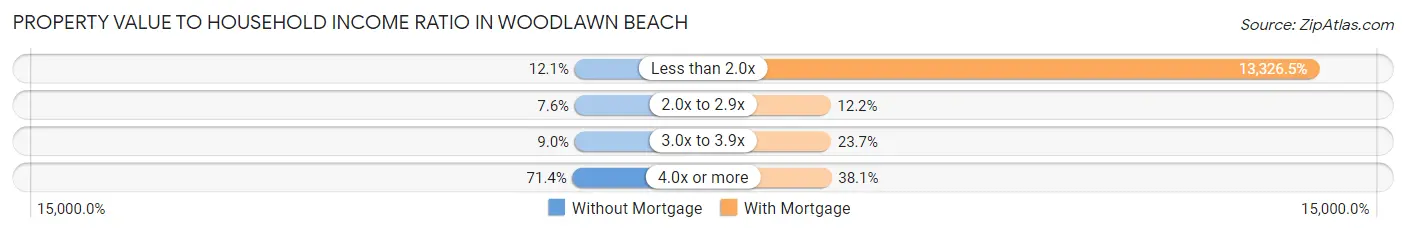
| Value-to-Income Ratio | Without Mortgage | With Mortgage |
| Less than 2.0x | 35 (12.1%) | 117,673 (13,326.5%) |
| 2.0x to 2.9x | 22 (7.6%) | 108 (12.2%) |
| 3.0x to 3.9x | 26 (9.0%) | 209 (23.7%) |
| 4.0x or more | 207 (71.4%) | 336 (38.1%) |
| Total | 290 (100.0%) | 883 (100.0%) |
Real Estate Taxes by Mortgage Status in Woodlawn Beach
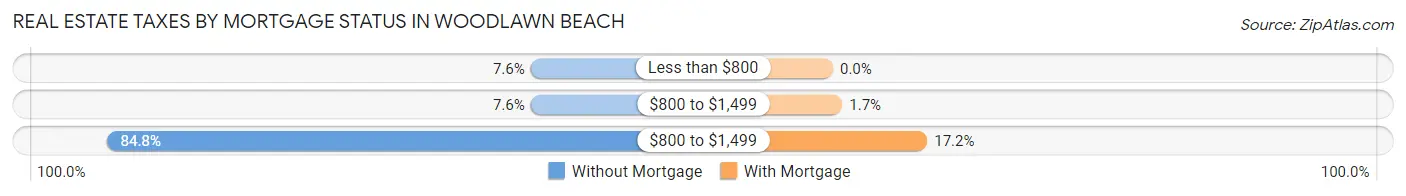
| Property Taxes | Without Mortgage | With Mortgage |
| Less than $800 | 22 (7.6%) | 0 (0.0%) |
| $800 to $1,499 | 22 (7.6%) | 15 (1.7%) |
| $800 to $1,499 | 246 (84.8%) | 152 (17.2%) |
| Total | 290 (100.0%) | 883 (100.0%) |
Health & Disability in Woodlawn Beach
Health Insurance Coverage by Age in Woodlawn Beach
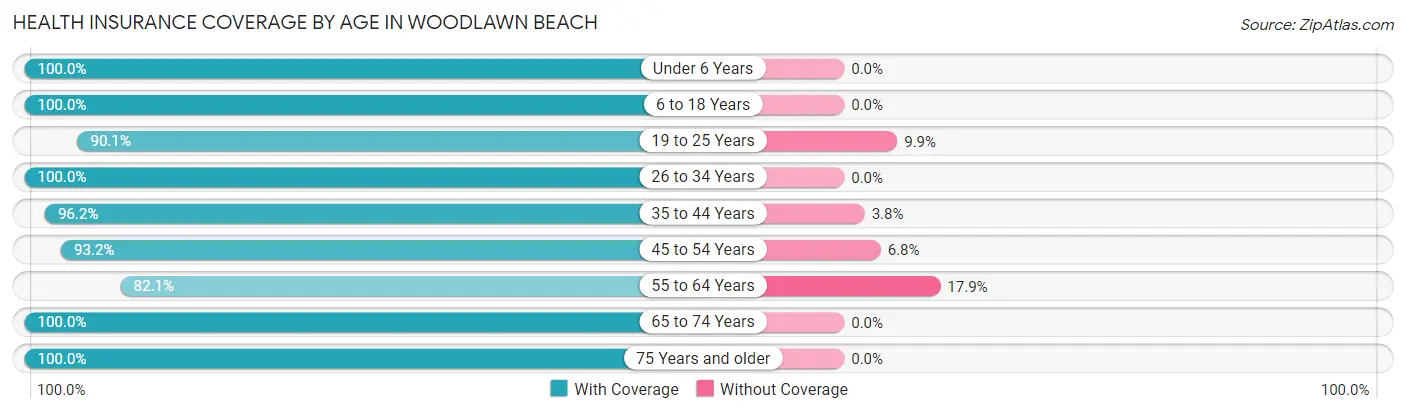
| Age Bracket | With Coverage | Without Coverage |
| Under 6 Years | 321 (100.0%) | 0 (0.0%) |
| 6 to 18 Years | 324 (100.0%) | 0 (0.0%) |
| 19 to 25 Years | 365 (90.1%) | 40 (9.9%) |
| 26 to 34 Years | 375 (100.0%) | 0 (0.0%) |
| 35 to 44 Years | 202 (96.2%) | 8 (3.8%) |
| 45 to 54 Years | 301 (93.2%) | 22 (6.8%) |
| 55 to 64 Years | 142 (82.1%) | 31 (17.9%) |
| 65 to 74 Years | 834 (100.0%) | 0 (0.0%) |
| 75 Years and older | 83 (100.0%) | 0 (0.0%) |
| Total | 2,947 (96.7%) | 101 (3.3%) |
Health Insurance Coverage by Citizenship Status in Woodlawn Beach
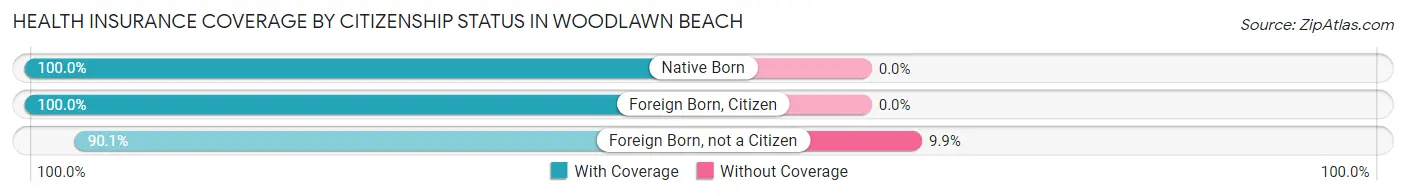
| Citizenship Status | With Coverage | Without Coverage |
| Native Born | 321 (100.0%) | 0 (0.0%) |
| Foreign Born, Citizen | 324 (100.0%) | 0 (0.0%) |
| Foreign Born, not a Citizen | 365 (90.1%) | 40 (9.9%) |
Health Insurance Coverage by Household Income in Woodlawn Beach
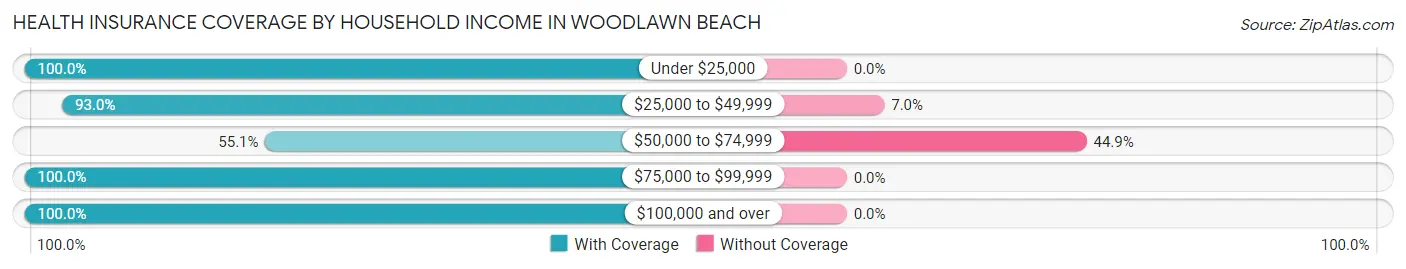
| Household Income | With Coverage | Without Coverage |
| Under $25,000 | 68 (100.0%) | 0 (0.0%) |
| $25,000 to $49,999 | 225 (93.0%) | 17 (7.0%) |
| $50,000 to $74,999 | 103 (55.1%) | 84 (44.9%) |
| $75,000 to $99,999 | 627 (100.0%) | 0 (0.0%) |
| $100,000 and over | 1,924 (100.0%) | 0 (0.0%) |
Public vs Private Health Insurance Coverage by Age in Woodlawn Beach
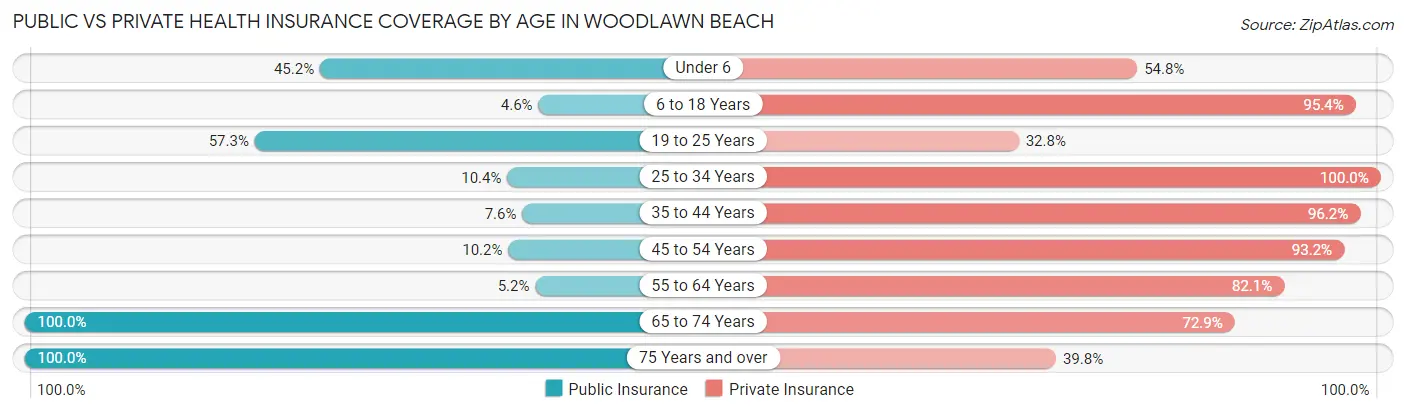
| Age Bracket | Public Insurance | Private Insurance |
| Under 6 | 145 (45.2%) | 176 (54.8%) |
| 6 to 18 Years | 15 (4.6%) | 309 (95.4%) |
| 19 to 25 Years | 232 (57.3%) | 133 (32.8%) |
| 25 to 34 Years | 39 (10.4%) | 375 (100.0%) |
| 35 to 44 Years | 16 (7.6%) | 202 (96.2%) |
| 45 to 54 Years | 33 (10.2%) | 301 (93.2%) |
| 55 to 64 Years | 9 (5.2%) | 142 (82.1%) |
| 65 to 74 Years | 834 (100.0%) | 608 (72.9%) |
| 75 Years and over | 83 (100.0%) | 33 (39.8%) |
| Total | 1,406 (46.1%) | 2,279 (74.8%) |
Disability Status by Sex by Age in Woodlawn Beach
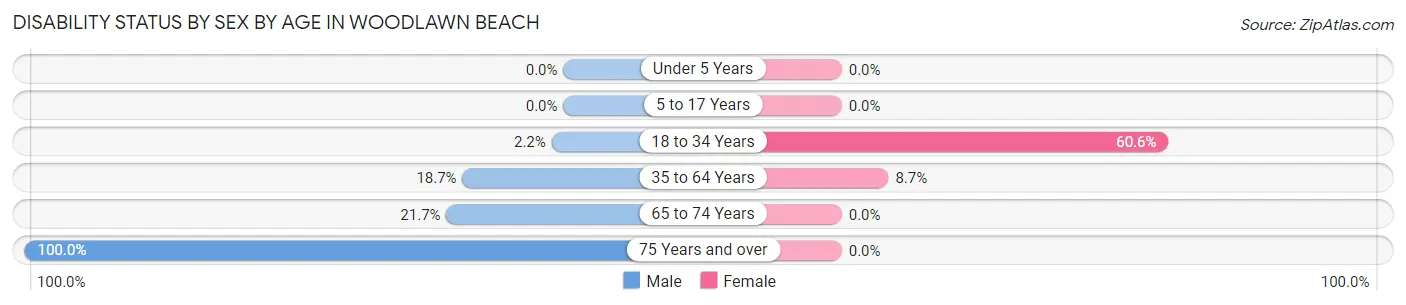
| Age Bracket | Male | Female |
| Under 5 Years | 0 (0.0%) | 0 (0.0%) |
| 5 to 17 Years | 0 (0.0%) | 0 (0.0%) |
| 18 to 34 Years | 7 (2.2%) | 300 (60.6%) |
| 35 to 64 Years | 50 (18.7%) | 38 (8.7%) |
| 65 to 74 Years | 104 (21.7%) | 0 (0.0%) |
| 75 Years and over | 63 (100.0%) | 0 (0.0%) |
Disability Class by Sex by Age in Woodlawn Beach
Disability Class: Hearing Difficulty
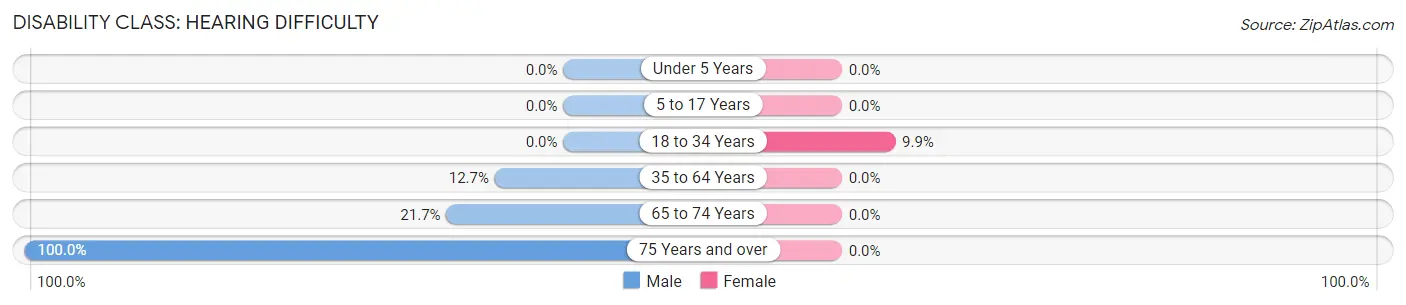
| Age Bracket | Male | Female |
| Under 5 Years | 0 (0.0%) | 0 (0.0%) |
| 5 to 17 Years | 0 (0.0%) | 0 (0.0%) |
| 18 to 34 Years | 0 (0.0%) | 49 (9.9%) |
| 35 to 64 Years | 34 (12.7%) | 0 (0.0%) |
| 65 to 74 Years | 104 (21.7%) | 0 (0.0%) |
| 75 Years and over | 63 (100.0%) | 0 (0.0%) |
Disability Class: Vision Difficulty
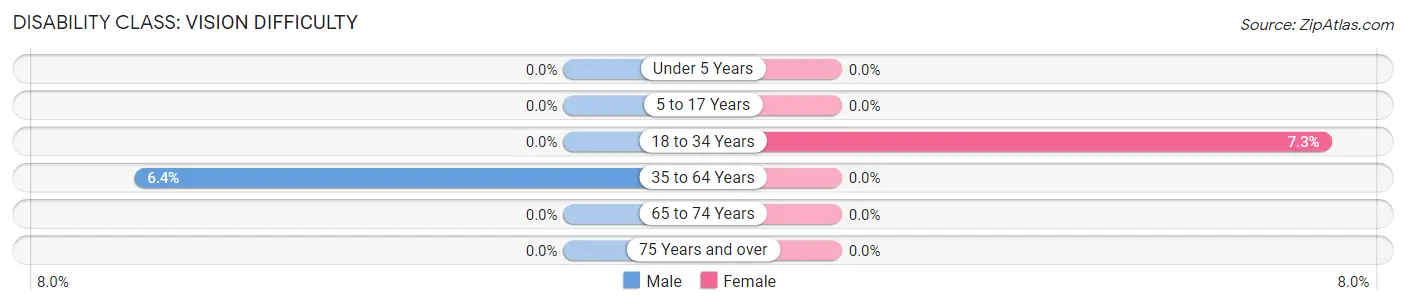
| Age Bracket | Male | Female |
| Under 5 Years | 0 (0.0%) | 0 (0.0%) |
| 5 to 17 Years | 0 (0.0%) | 0 (0.0%) |
| 18 to 34 Years | 0 (0.0%) | 36 (7.3%) |
| 35 to 64 Years | 17 (6.4%) | 0 (0.0%) |
| 65 to 74 Years | 0 (0.0%) | 0 (0.0%) |
| 75 Years and over | 0 (0.0%) | 0 (0.0%) |
Disability Class: Cognitive Difficulty
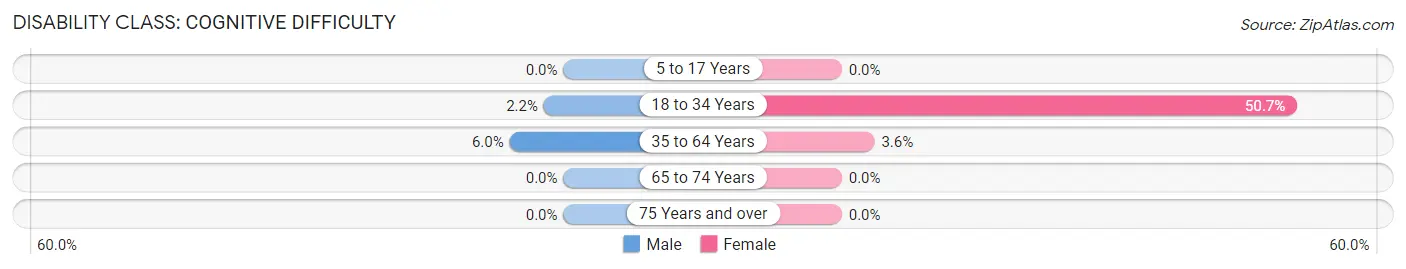
| Age Bracket | Male | Female |
| 5 to 17 Years | 0 (0.0%) | 0 (0.0%) |
| 18 to 34 Years | 7 (2.2%) | 251 (50.7%) |
| 35 to 64 Years | 16 (6.0%) | 16 (3.6%) |
| 65 to 74 Years | 0 (0.0%) | 0 (0.0%) |
| 75 Years and over | 0 (0.0%) | 0 (0.0%) |
Disability Class: Ambulatory Difficulty
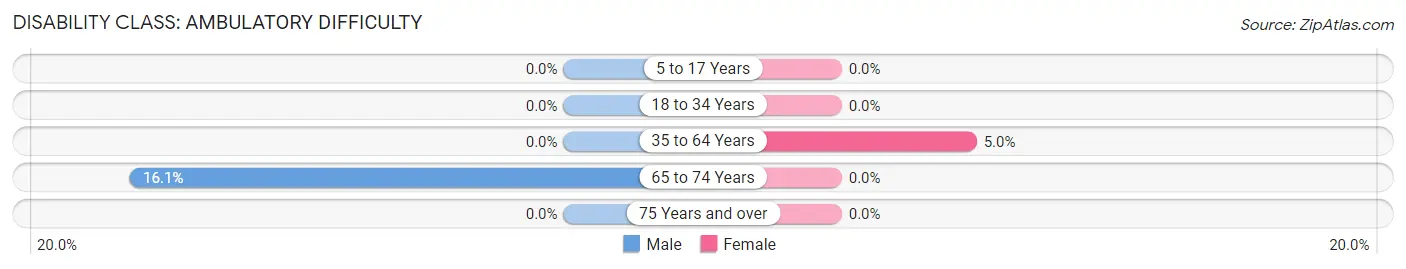
| Age Bracket | Male | Female |
| 5 to 17 Years | 0 (0.0%) | 0 (0.0%) |
| 18 to 34 Years | 0 (0.0%) | 0 (0.0%) |
| 35 to 64 Years | 0 (0.0%) | 22 (5.0%) |
| 65 to 74 Years | 77 (16.1%) | 0 (0.0%) |
| 75 Years and over | 0 (0.0%) | 0 (0.0%) |
Disability Class: Self-Care Difficulty
| Age Bracket | Male | Female |
| 5 to 17 Years | 0 (0.0%) | 0 (0.0%) |
| 18 to 34 Years | 0 (0.0%) | 0 (0.0%) |
| 35 to 64 Years | 0 (0.0%) | 0 (0.0%) |
| 65 to 74 Years | 0 (0.0%) | 0 (0.0%) |
| 75 Years and over | 0 (0.0%) | 0 (0.0%) |
Technology Access in Woodlawn Beach
Computing Device Access in Woodlawn Beach
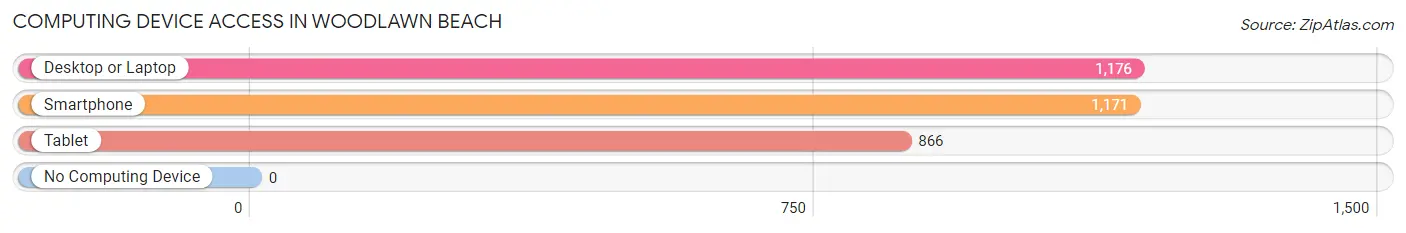
| Device Type | # Households | % Households |
| Desktop or Laptop | 1,176 | 96.3% |
| Smartphone | 1,171 | 95.9% |
| Tablet | 866 | 70.9% |
| No Computing Device | 0 | 0.0% |
| Total | 1,221 | 100.0% |
Internet Access in Woodlawn Beach
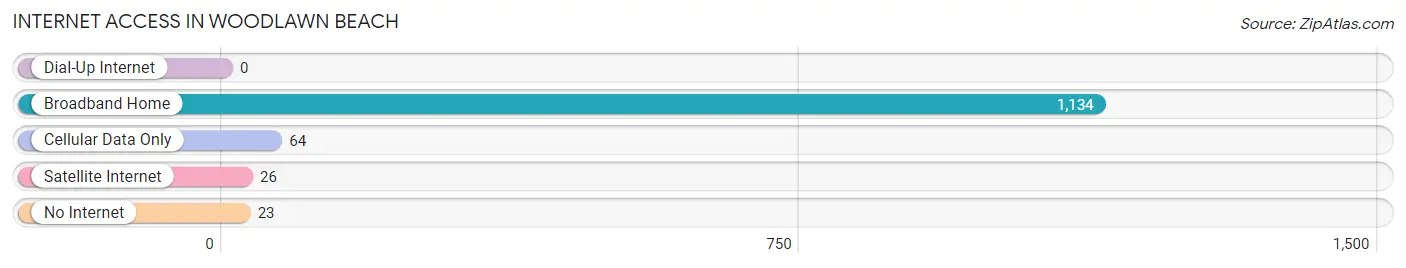
| Internet Type | # Households | % Households |
| Dial-Up Internet | 0 | 0.0% |
| Broadband Home | 1,134 | 92.9% |
| Cellular Data Only | 64 | 5.2% |
| Satellite Internet | 26 | 2.1% |
| No Internet | 23 | 1.9% |
| Total | 1,221 | 100.0% |
Woodlawn Beach Summary
Woodlawn Beach is a small community located in the panhandle of Florida, in Santa Rosa County. It is situated on the Gulf of Mexico, just south of Navarre Beach and east of Pensacola Beach. The community is known for its white sand beaches, crystal clear waters, and abundant wildlife.
History
Woodlawn Beach was originally inhabited by Native Americans, who used the area for fishing and hunting. The first European settlers arrived in the area in the late 1700s, and the area was eventually incorporated into the United States in 1821. The area was primarily used for farming and fishing until the early 1900s, when the first beachfront homes were built.
In the 1950s, the area began to develop as a tourist destination, and the first beachfront hotel was built in 1954. The area continued to grow in popularity, and by the 1970s, Woodlawn Beach had become a popular destination for vacationers.
Geography
Woodlawn Beach is located in the panhandle of Florida, in Santa Rosa County. It is situated on the Gulf of Mexico, just south of Navarre Beach and east of Pensacola Beach. The community is bordered by the Santa Rosa Sound to the north, the Gulf of Mexico to the south, and the Blackwater River to the east.
The area is characterized by its white sand beaches, crystal clear waters, and abundant wildlife. The area is also home to a variety of plant and animal species, including sea turtles, dolphins, and a variety of birds.
Economy
The economy of Woodlawn Beach is largely driven by tourism. The area is home to a variety of beachfront hotels, restaurants, and other tourist attractions. The area is also home to a number of fishing charters, which offer visitors the opportunity to experience the area’s abundant marine life.
In addition to tourism, the area is also home to a number of small businesses, including retail stores, restaurants, and other services. The area is also home to a number of residential developments, which provide housing for both vacationers and permanent residents.
Demographics
As of the 2010 census, the population of Woodlawn Beach was 1,845. The population is primarily white (90.2%), with a small percentage of African Americans (4.2%) and Hispanics (3.2%). The median household income in the area is $45,000, and the median age is 44.
Conclusion
Woodlawn Beach is a small community located in the panhandle of Florida, in Santa Rosa County. It is situated on the Gulf of Mexico, just south of Navarre Beach and east of Pensacola Beach. The area is known for its white sand beaches, crystal clear waters, and abundant wildlife. The economy of Woodlawn Beach is largely driven by tourism, and the area is home to a variety of beachfront hotels, restaurants, and other tourist attractions. The population of Woodlawn Beach is primarily white, with a small percentage of African Americans and Hispanics. The median household income in the area is $45,000, and the median age is 44.
Common Questions
What is Per Capita Income in Woodlawn Beach?
Per Capita income in Woodlawn Beach is $45,436.
What is the Median Family Income in Woodlawn Beach?
Median Family Income in Woodlawn Beach is $117,744.
What is the Median Household income in Woodlawn Beach?
Median Household Income in Woodlawn Beach is $107,321.
What is Income or Wage Gap in Woodlawn Beach?
Income or Wage Gap in Woodlawn Beach is 59.2%.
Women in Woodlawn Beach earn 40.8 cents for every dollar earned by a man.
What is Inequality or Gini Index in Woodlawn Beach?
Inequality or Gini Index in Woodlawn Beach is 0.29.
What is the Total Population of Woodlawn Beach?
Total Population of Woodlawn Beach is 3,128.
What is the Total Male Population of Woodlawn Beach?
Total Male Population of Woodlawn Beach is 1,606.
What is the Total Female Population of Woodlawn Beach?
Total Female Population of Woodlawn Beach is 1,522.
What is the Ratio of Males per 100 Females in Woodlawn Beach?
There are 105.52 Males per 100 Females in Woodlawn Beach.
What is the Ratio of Females per 100 Males in Woodlawn Beach?
There are 94.77 Females per 100 Males in Woodlawn Beach.
What is the Median Population Age in Woodlawn Beach?
Median Population Age in Woodlawn Beach is 41.1 Years.
What is the Average Family Size in Woodlawn Beach
Average Family Size in Woodlawn Beach is 2.8 People.
What is the Average Household Size in Woodlawn Beach
Average Household Size in Woodlawn Beach is 2.6 People.
How Large is the Labor Force in Woodlawn Beach?
There are 1,505 People in the Labor Forcein in Woodlawn Beach.
What is the Percentage of People in the Labor Force in Woodlawn Beach?
58.6% of People are in the Labor Force in Woodlawn Beach.
What is the Unemployment Rate in Woodlawn Beach?
Unemployment Rate in Woodlawn Beach is 3.8%.