Zip Codes with the Highest Percentage of Population Employed in Food Preparation & Serving in Leesburg, FL
RELATED REPORTS & OPTIONS
Food Preparation & Serving
Leesburg
Compare Zip Codes
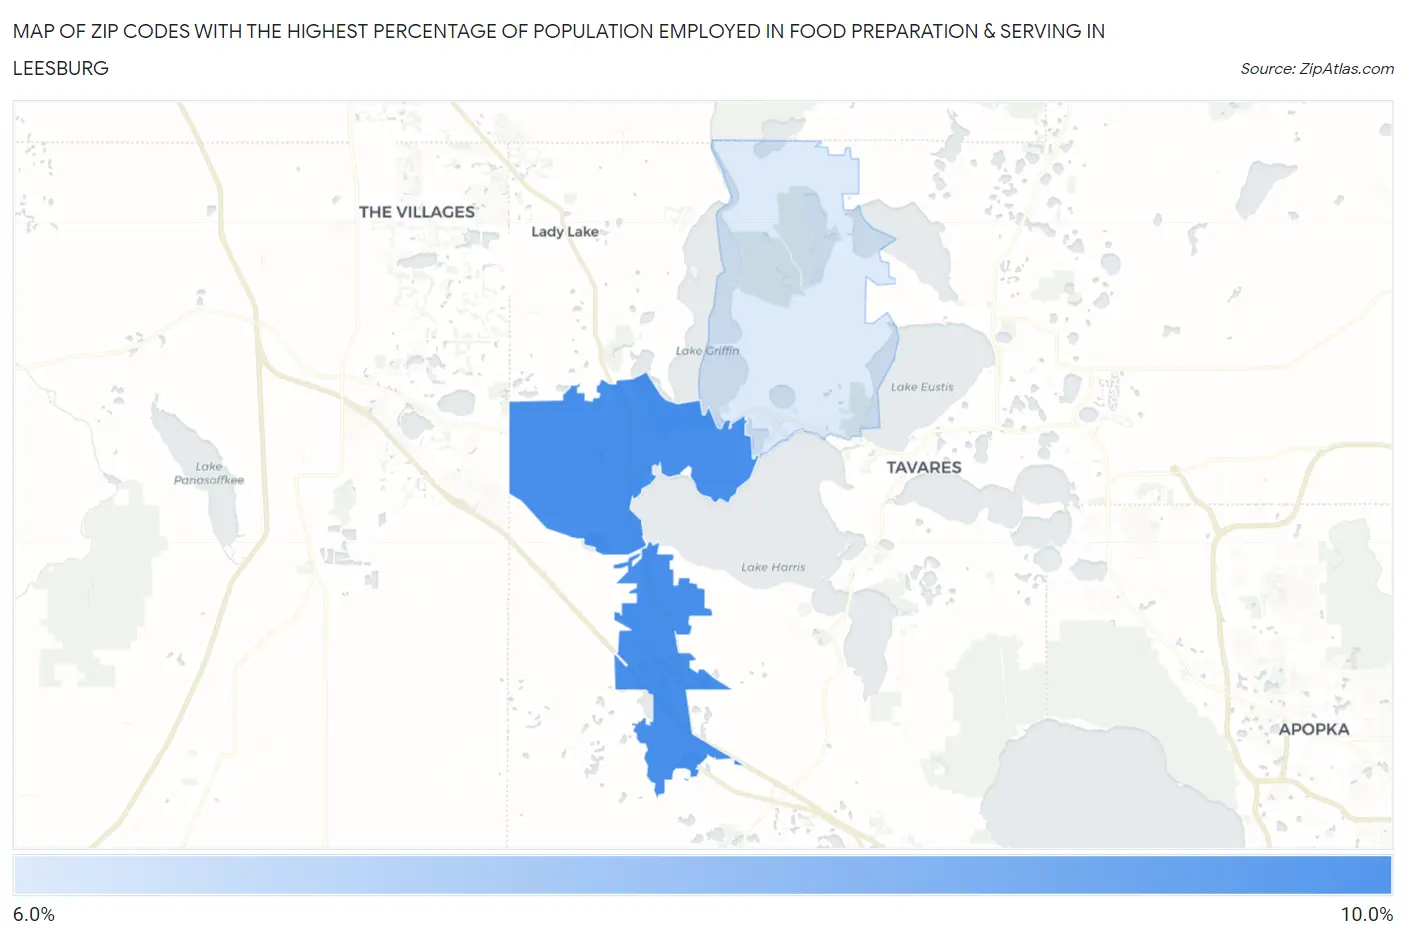
Map of Zip Codes with the Highest Percentage of Population Employed in Food Preparation & Serving in Leesburg
6.0%
9.8%
Zip Codes with the Highest Percentage of Population Employed in Food Preparation & Serving in Leesburg, FL
| Zip Code | % Employed | vs State | vs National | |
| 1. | 34748 | 9.8% | 6.1%(+3.68)#98 | 5.3%(+4.48)#2,830 |
| 2. | 34788 | 6.0% | 6.1%(-0.062)#451 | 5.3%(+0.743)#9,243 |
1
Common Questions
What are the Top Zip Codes with the Highest Percentage of Population Employed in Food Preparation & Serving in Leesburg, FL?
Top Zip Codes with the Highest Percentage of Population Employed in Food Preparation & Serving in Leesburg, FL are:
What zip code has the Highest Percentage of Population Employed in Food Preparation & Serving in Leesburg, FL?
34748 has the Highest Percentage of Population Employed in Food Preparation & Serving in Leesburg, FL with 9.8%.
What is the Percentage of Population Employed in Food Preparation & Serving in Leesburg, FL?
Percentage of Population Employed in Food Preparation & Serving in Leesburg is 11.7%.
What is the Percentage of Population Employed in Food Preparation & Serving in Florida?
Percentage of Population Employed in Food Preparation & Serving in Florida is 6.1%.
What is the Percentage of Population Employed in Food Preparation & Serving in the United States?
Percentage of Population Employed in Food Preparation & Serving in the United States is 5.3%.