Fort Denaud, FL Map & Demographics
Fort Denaud Map
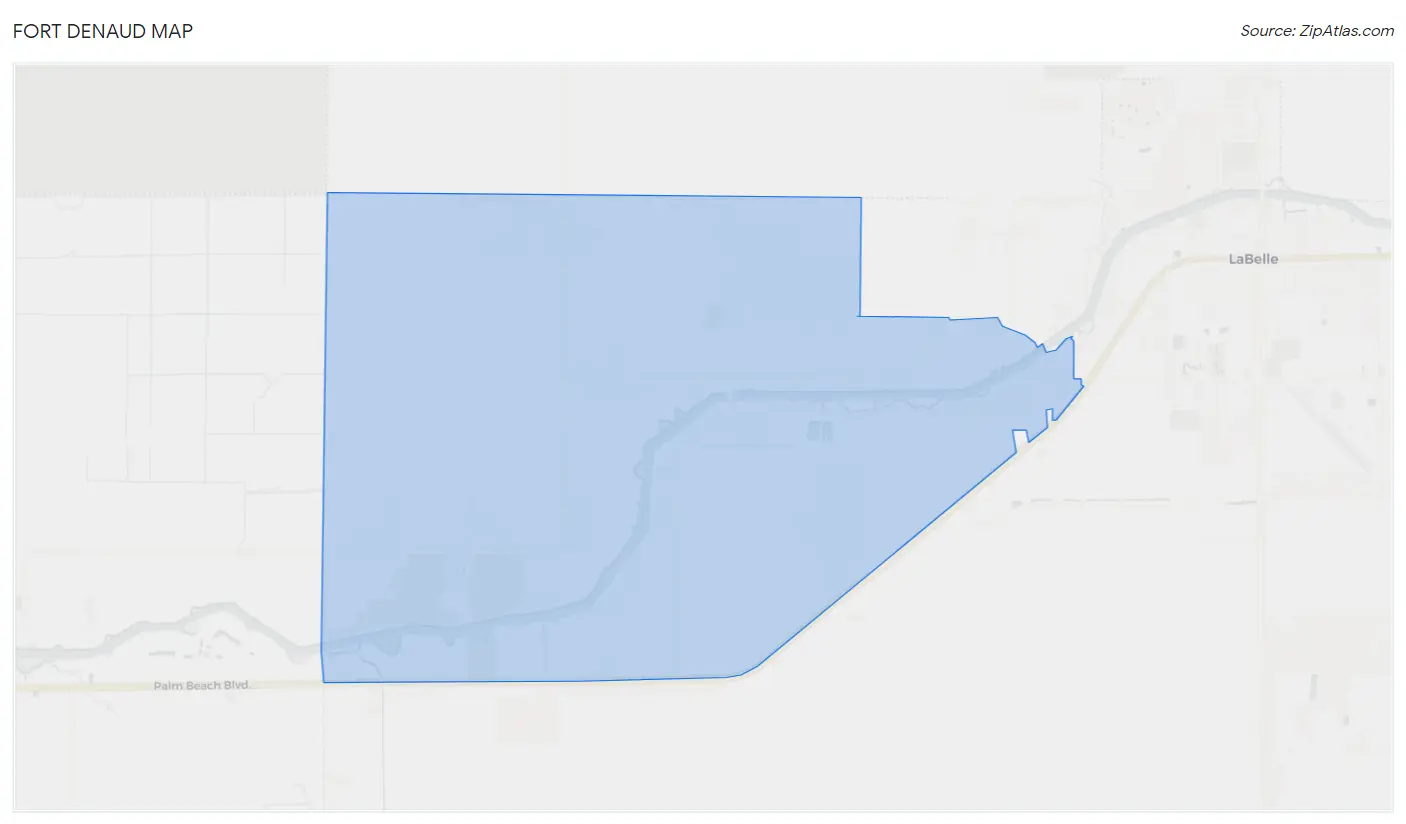
Fort Denaud Overview
$40,695
PER CAPITA INCOME
$67,813
AVG FAMILY INCOME
$70,169
AVG HOUSEHOLD INCOME
19.5%
WAGE / INCOME GAP [ % ]
80.5¢/ $1
WAGE / INCOME GAP [ $ ]
0.46
INEQUALITY / GINI INDEX
1,652
TOTAL POPULATION
877
MALE POPULATION
775
FEMALE POPULATION
113.16
MALES / 100 FEMALES
88.37
FEMALES / 100 MALES
54.6
MEDIAN AGE
2.5
AVG FAMILY SIZE
2.3
AVG HOUSEHOLD SIZE
673
LABOR FORCE [ PEOPLE ]
47.0%
PERCENT IN LABOR FORCE
Fort Denaud Area Codes
Income in Fort Denaud
Income Overview in Fort Denaud
Per Capita Income in Fort Denaud is $40,695, while median incomes of families and households are $67,813 and $70,169 respectively.
| Characteristic | Number | Measure |
| Per Capita Income | 1,652 | $40,695 |
| Median Family Income | 596 | $67,813 |
| Mean Family Income | 596 | $98,188 |
| Median Household Income | 699 | $70,169 |
| Mean Household Income | 699 | $95,747 |
| Income Deficit | 596 | $0 |
| Wage / Income Gap (%) | 1,652 | 19.48% |
| Wage / Income Gap ($) | 1,652 | 80.52¢ per $1 |
| Gini / Inequality Index | 1,652 | 0.46 |
Earnings by Sex in Fort Denaud
Average Earnings in Fort Denaud are $39,767, $46,932 for men and $37,791 for women, a difference of 19.5%.
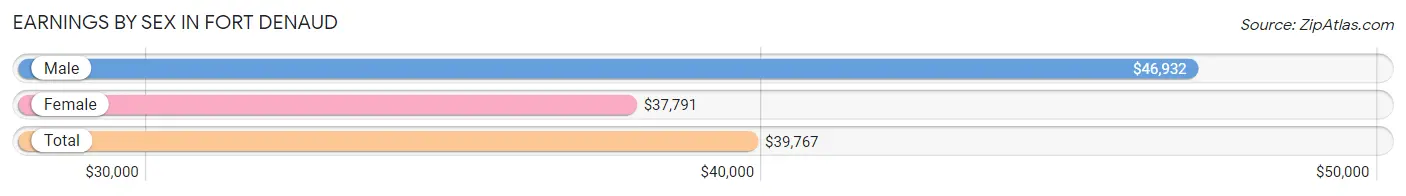
| Sex | Number | Average Earnings |
| Male | 376 (54.8%) | $46,932 |
| Female | 310 (45.2%) | $37,791 |
| Total | 686 (100.0%) | $39,767 |
Earnings by Sex by Income Bracket in Fort Denaud
The most common earnings brackets in Fort Denaud are $65,000 to $74,999 for men (74 | 19.7%) and $22,500 to $24,999 for women (74 | 23.9%).
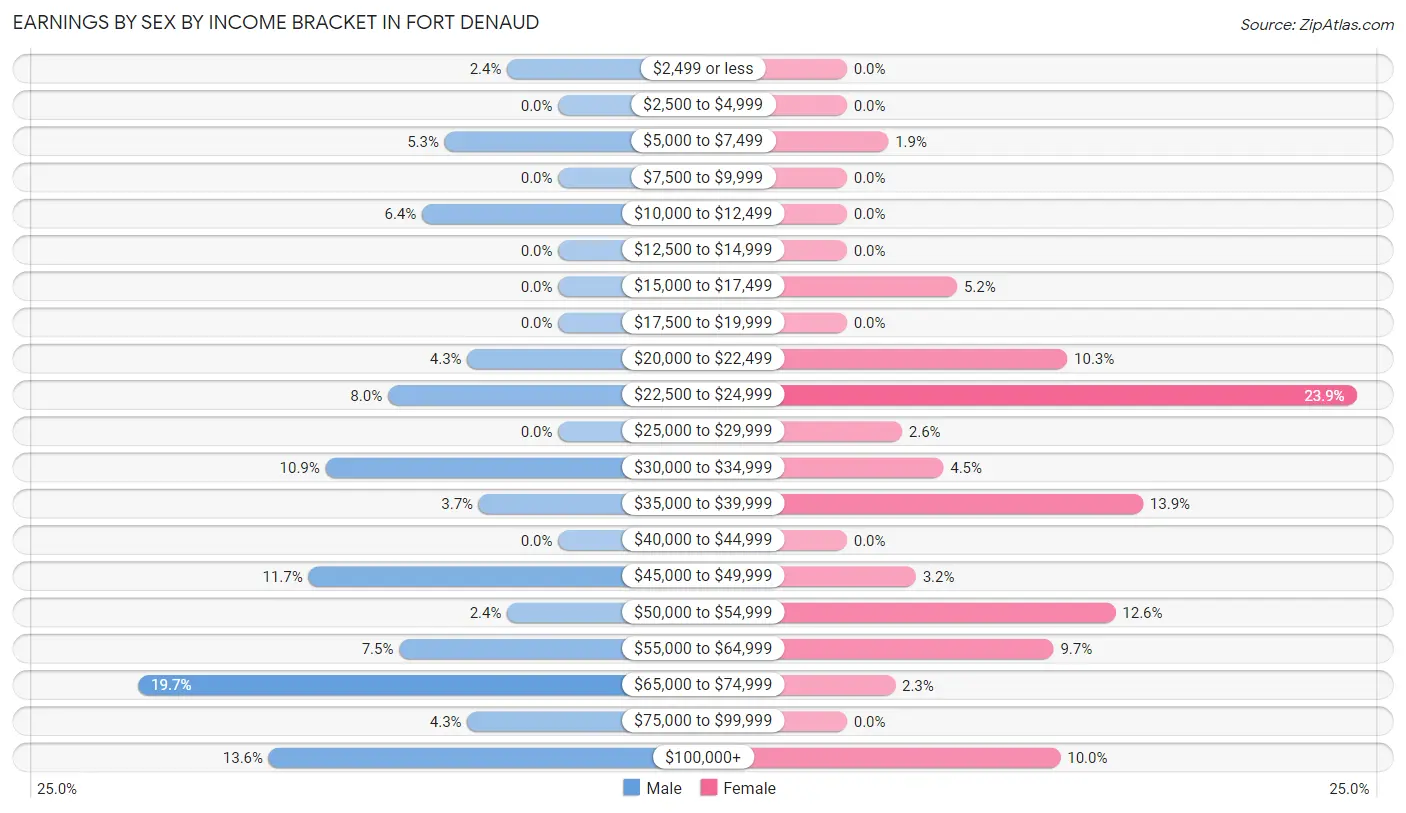
| Income | Male | Female |
| $2,499 or less | 9 (2.4%) | 0 (0.0%) |
| $2,500 to $4,999 | 0 (0.0%) | 0 (0.0%) |
| $5,000 to $7,499 | 20 (5.3%) | 6 (1.9%) |
| $7,500 to $9,999 | 0 (0.0%) | 0 (0.0%) |
| $10,000 to $12,499 | 24 (6.4%) | 0 (0.0%) |
| $12,500 to $14,999 | 0 (0.0%) | 0 (0.0%) |
| $15,000 to $17,499 | 0 (0.0%) | 16 (5.2%) |
| $17,500 to $19,999 | 0 (0.0%) | 0 (0.0%) |
| $20,000 to $22,499 | 16 (4.3%) | 32 (10.3%) |
| $22,500 to $24,999 | 30 (8.0%) | 74 (23.9%) |
| $25,000 to $29,999 | 0 (0.0%) | 8 (2.6%) |
| $30,000 to $34,999 | 41 (10.9%) | 14 (4.5%) |
| $35,000 to $39,999 | 14 (3.7%) | 43 (13.9%) |
| $40,000 to $44,999 | 0 (0.0%) | 0 (0.0%) |
| $45,000 to $49,999 | 44 (11.7%) | 10 (3.2%) |
| $50,000 to $54,999 | 9 (2.4%) | 39 (12.6%) |
| $55,000 to $64,999 | 28 (7.4%) | 30 (9.7%) |
| $65,000 to $74,999 | 74 (19.7%) | 7 (2.3%) |
| $75,000 to $99,999 | 16 (4.3%) | 0 (0.0%) |
| $100,000+ | 51 (13.6%) | 31 (10.0%) |
| Total | 376 (100.0%) | 310 (100.0%) |
Earnings by Sex by Educational Attainment in Fort Denaud
Average earnings in Fort Denaud are $47,386 for men and $37,791 for women, a difference of 20.3%. Men with an educational attainment of bachelor's degree enjoy the highest average annual earnings of $155,648, while those with high school diploma education earn the least with $67,974. Women with an educational attainment of high school diploma earn the most with the average annual earnings of $37,601, while those with college or associate's degree education have the smallest earnings of $24,392.
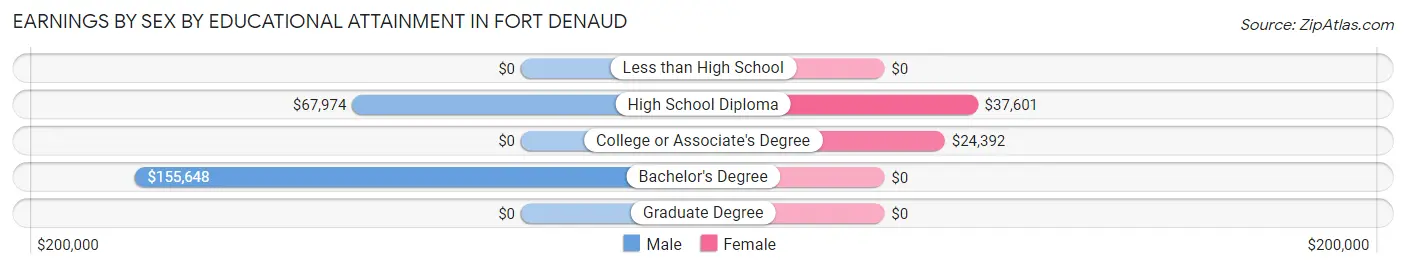
| Educational Attainment | Male Income | Female Income |
| Less than High School | - | - |
| High School Diploma | $67,974 | $37,601 |
| College or Associate's Degree | - | - |
| Bachelor's Degree | $155,648 | $0 |
| Graduate Degree | - | - |
| Total | $47,386 | $37,791 |
Family Income in Fort Denaud
Family Income Brackets in Fort Denaud
According to the Fort Denaud family income data, there are 159 families falling into the $50,000 to $74,999 income range, which is the most common income bracket and makes up 26.7% of all families.
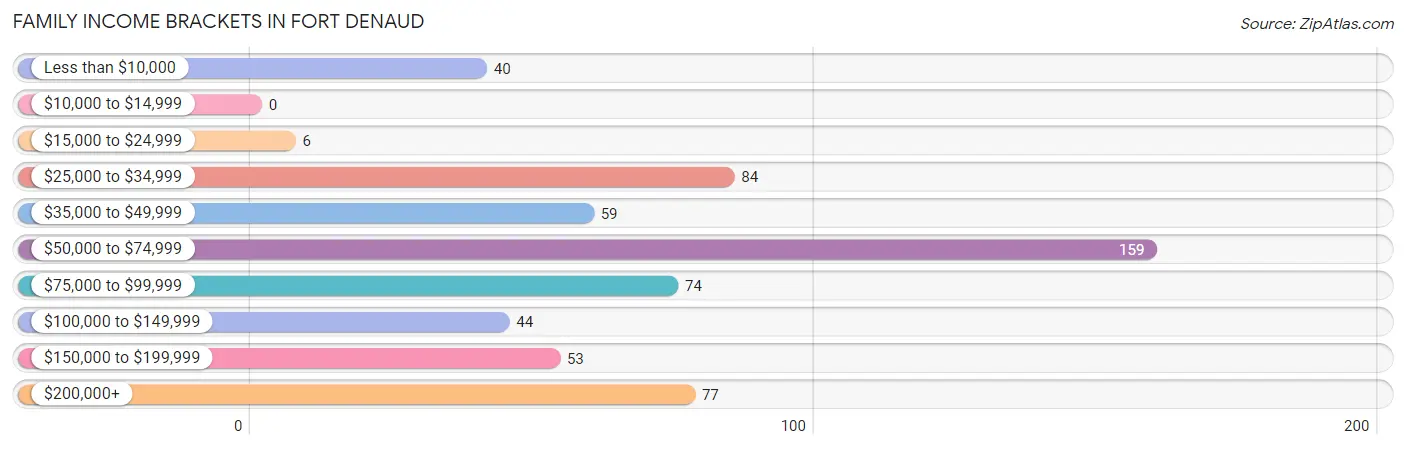
| Income Bracket | # Families | % Families |
| Less than $10,000 | 40 | 6.7% |
| $10,000 to $14,999 | 0 | 0.0% |
| $15,000 to $24,999 | 6 | 1.0% |
| $25,000 to $34,999 | 84 | 14.1% |
| $35,000 to $49,999 | 59 | 9.9% |
| $50,000 to $74,999 | 159 | 26.7% |
| $75,000 to $99,999 | 74 | 12.4% |
| $100,000 to $149,999 | 44 | 7.4% |
| $150,000 to $199,999 | 53 | 8.9% |
| $200,000+ | 77 | 12.9% |
Family Income by Famaliy Size in Fort Denaud
3-person families (58 | 9.7%) account for the highest median family income in Fort Denaud with $96,648 per family, while 3-person families (58 | 9.7%) have the highest median income of $32,216 per family member.
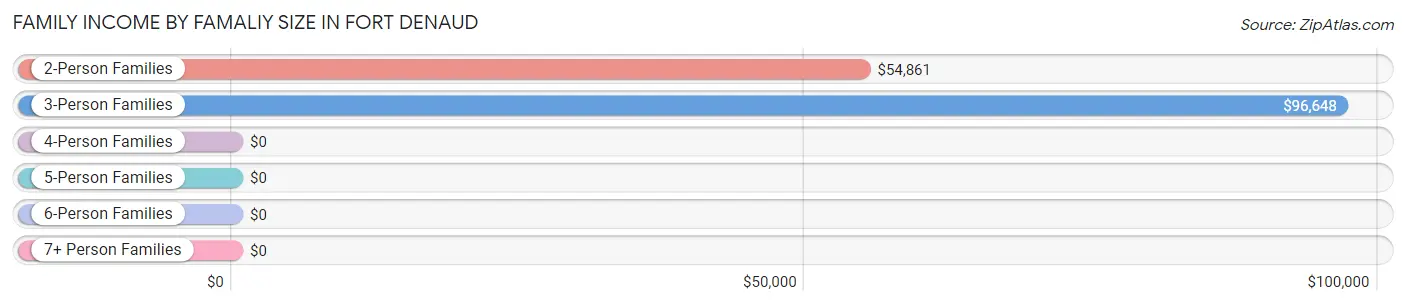
| Income Bracket | # Families | Median Income |
| 2-Person Families | 395 (66.3%) | $54,861 |
| 3-Person Families | 58 (9.7%) | $96,648 |
| 4-Person Families | 129 (21.6%) | $0 |
| 5-Person Families | 0 (0.0%) | $0 |
| 6-Person Families | 14 (2.4%) | $0 |
| 7+ Person Families | 0 (0.0%) | $0 |
| Total | 596 (100.0%) | $67,813 |
Family Income by Number of Earners in Fort Denaud
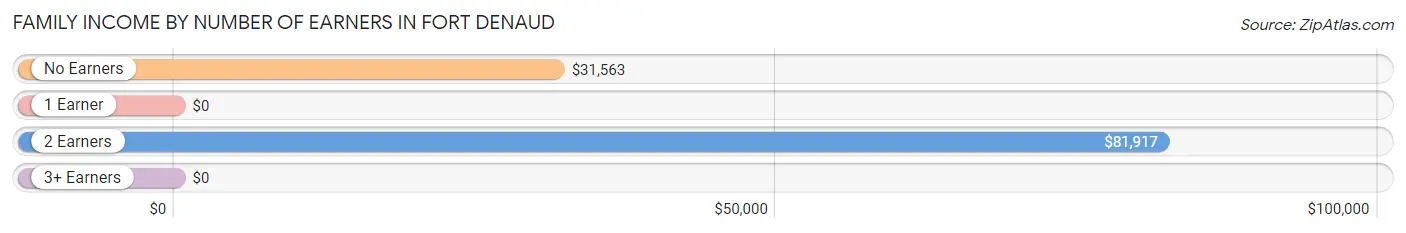
| Number of Earners | # Families | Median Income |
| No Earners | 187 (31.4%) | $31,563 |
| 1 Earner | 201 (33.7%) | $0 |
| 2 Earners | 208 (34.9%) | $81,917 |
| 3+ Earners | 0 (0.0%) | $0 |
| Total | 596 (100.0%) | $67,813 |
Household Income in Fort Denaud
Household Income Brackets in Fort Denaud
With 150 households falling in the category, the $50,000 to $74,999 income range is the most frequent in Fort Denaud, accounting for 21.5% of all households. In contrast, only 6 households (0.9%) fall into the $15,000 to $24,999 income bracket, making it the least populous group.
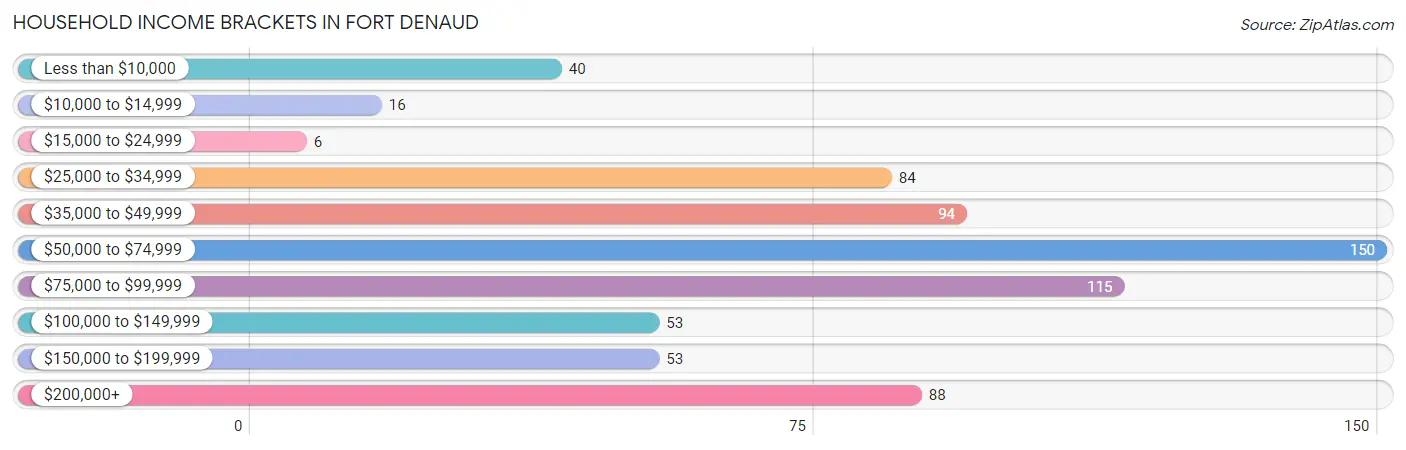
| Income Bracket | # Households | % Households |
| Less than $10,000 | 40 | 5.7% |
| $10,000 to $14,999 | 16 | 2.3% |
| $15,000 to $24,999 | 6 | 0.9% |
| $25,000 to $34,999 | 84 | 12.0% |
| $35,000 to $49,999 | 94 | 13.4% |
| $50,000 to $74,999 | 150 | 21.5% |
| $75,000 to $99,999 | 115 | 16.5% |
| $100,000 to $149,999 | 53 | 7.6% |
| $150,000 to $199,999 | 53 | 7.6% |
| $200,000+ | 88 | 12.6% |
Household Income by Householder Age in Fort Denaud
The median household income in Fort Denaud is $70,169, with the highest median household income of $81,542 found in the 45 to 64 years age bracket for the primary householder. A total of 207 households (29.6%) fall into this category.
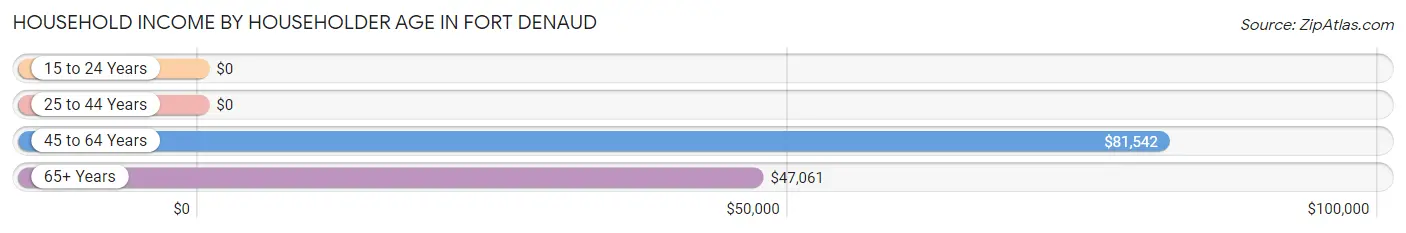
| Income Bracket | # Households | Median Income |
| 15 to 24 Years | 0 (0.0%) | $0 |
| 25 to 44 Years | 205 (29.3%) | $0 |
| 45 to 64 Years | 207 (29.6%) | $81,542 |
| 65+ Years | 287 (41.1%) | $47,061 |
| Total | 699 (100.0%) | $70,169 |
Poverty in Fort Denaud
Income Below Poverty by Sex and Age in Fort Denaud
With 9.1% poverty level for males and 10.6% for females among the residents of Fort Denaud, 35 to 44 year old males and 55 to 64 year old females are the most vulnerable to poverty, with 43 males (35.5%) and 40 females (35.4%) in their respective age groups living below the poverty level.
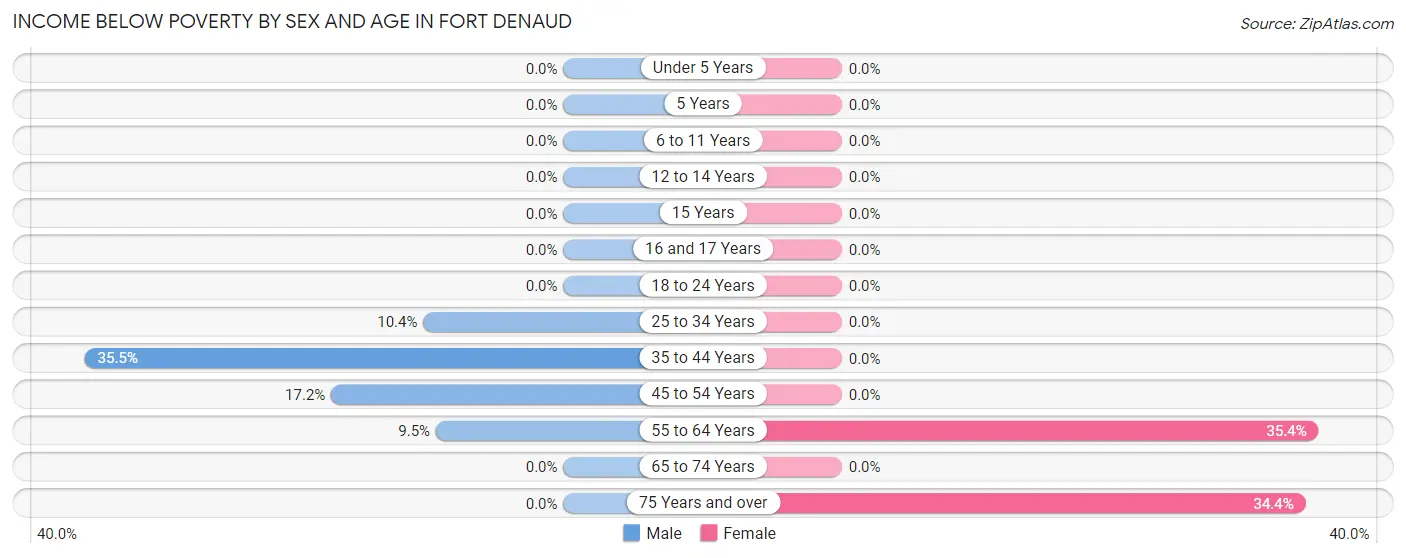
| Age Bracket | Male | Female |
| Under 5 Years | 0 (0.0%) | 0 (0.0%) |
| 5 Years | 0 (0.0%) | 0 (0.0%) |
| 6 to 11 Years | 0 (0.0%) | 0 (0.0%) |
| 12 to 14 Years | 0 (0.0%) | 0 (0.0%) |
| 15 Years | 0 (0.0%) | 0 (0.0%) |
| 16 and 17 Years | 0 (0.0%) | 0 (0.0%) |
| 18 to 24 Years | 0 (0.0%) | 0 (0.0%) |
| 25 to 34 Years | 13 (10.4%) | 0 (0.0%) |
| 35 to 44 Years | 43 (35.5%) | 0 (0.0%) |
| 45 to 54 Years | 10 (17.2%) | 0 (0.0%) |
| 55 to 64 Years | 14 (9.5%) | 40 (35.4%) |
| 65 to 74 Years | 0 (0.0%) | 0 (0.0%) |
| 75 Years and over | 0 (0.0%) | 42 (34.4%) |
| Total | 80 (9.1%) | 82 (10.6%) |
Income Above Poverty by Sex and Age in Fort Denaud
According to the poverty statistics in Fort Denaud, males aged under 5 years and females aged under 5 years are the age groups that are most secure financially, with 100.0% of males and 100.0% of females in these age groups living above the poverty line.
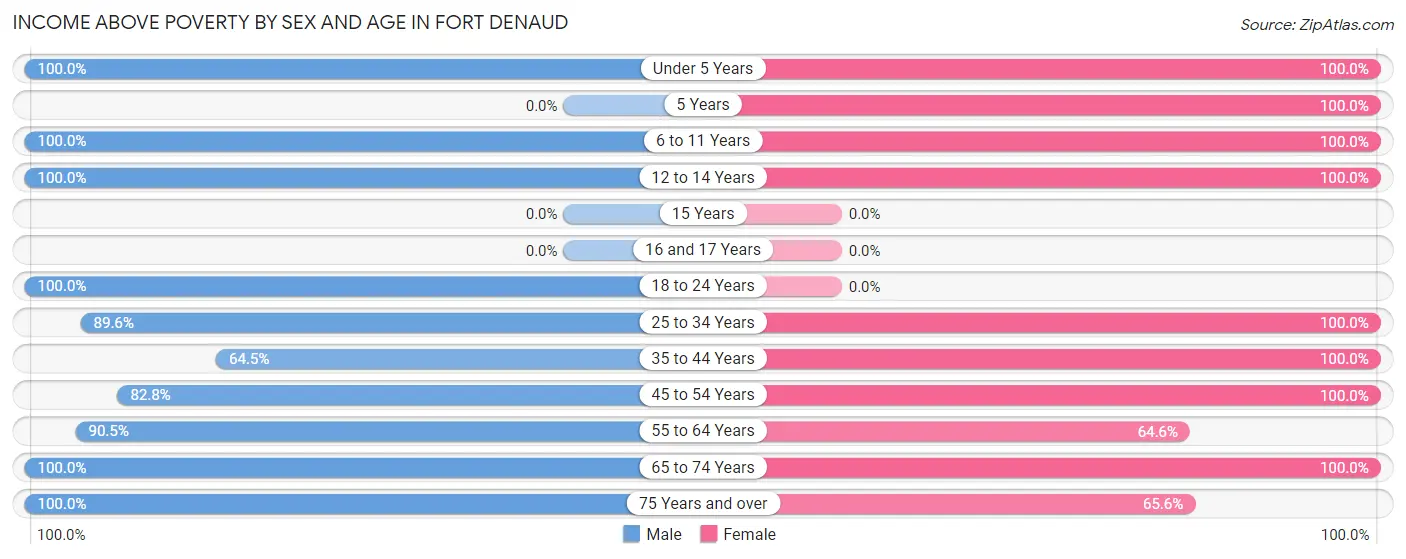
| Age Bracket | Male | Female |
| Under 5 Years | 17 (100.0%) | 34 (100.0%) |
| 5 Years | 0 (0.0%) | 11 (100.0%) |
| 6 to 11 Years | 62 (100.0%) | 11 (100.0%) |
| 12 to 14 Years | 44 (100.0%) | 42 (100.0%) |
| 15 Years | 0 (0.0%) | 0 (0.0%) |
| 16 and 17 Years | 0 (0.0%) | 0 (0.0%) |
| 18 to 24 Years | 16 (100.0%) | 0 (0.0%) |
| 25 to 34 Years | 112 (89.6%) | 100 (100.0%) |
| 35 to 44 Years | 78 (64.5%) | 99 (100.0%) |
| 45 to 54 Years | 48 (82.8%) | 106 (100.0%) |
| 55 to 64 Years | 134 (90.5%) | 73 (64.6%) |
| 65 to 74 Years | 172 (100.0%) | 137 (100.0%) |
| 75 Years and over | 114 (100.0%) | 80 (65.6%) |
| Total | 797 (90.9%) | 693 (89.4%) |
Income Below Poverty Among Married-Couple Families in Fort Denaud
The poverty statistics for married-couple families in Fort Denaud show that 4.0% or 19 of the total 477 families live below the poverty line. Families with no children have the highest poverty rate of 5.5%, comprising of 19 families. On the other hand, families with 1 or 2 children have the lowest poverty rate of 0.0%, which includes 0 families.
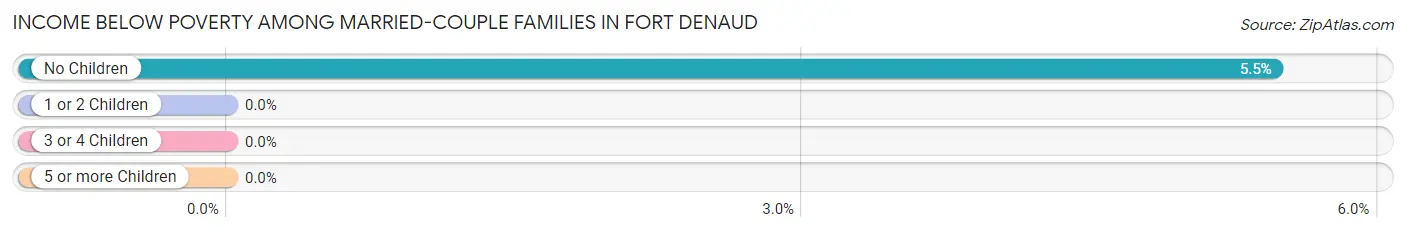
| Children | Above Poverty | Below Poverty |
| No Children | 329 (94.5%) | 19 (5.5%) |
| 1 or 2 Children | 115 (100.0%) | 0 (0.0%) |
| 3 or 4 Children | 14 (100.0%) | 0 (0.0%) |
| 5 or more Children | 0 (0.0%) | 0 (0.0%) |
| Total | 458 (96.0%) | 19 (4.0%) |
Income Below Poverty Among Single-Parent Households in Fort Denaud
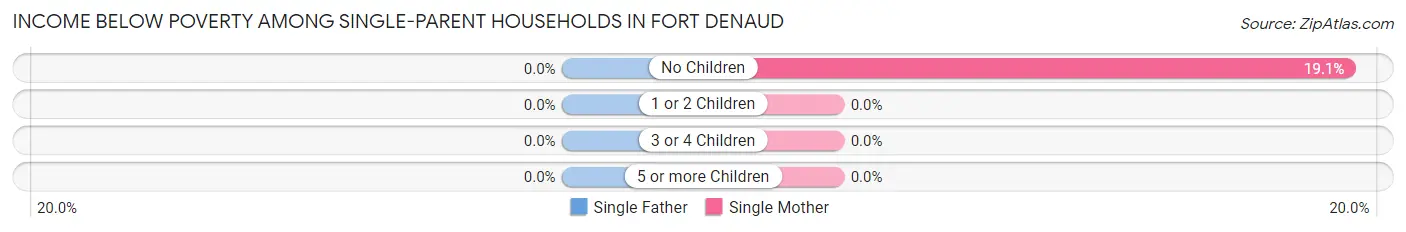
| Children | Single Father | Single Mother |
| No Children | 0 (0.0%) | 21 (19.1%) |
| 1 or 2 Children | 0 (0.0%) | 0 (0.0%) |
| 3 or 4 Children | 0 (0.0%) | 0 (0.0%) |
| 5 or more Children | 0 (0.0%) | 0 (0.0%) |
| Total | 0 (0.0%) | 21 (17.6%) |
Income Below Poverty Among Married-Couple vs Single-Parent Households in Fort Denaud
The poverty data for Fort Denaud shows that 19 of the married-couple family households (4.0%) and 21 of the single-parent households (17.6%) are living below the poverty level. Within the married-couple family households, those with no children have the highest poverty rate, with 19 households (5.5%) falling below the poverty line. Among the single-parent households, those with no children have the highest poverty rate, with 21 household (19.1%) living below poverty.
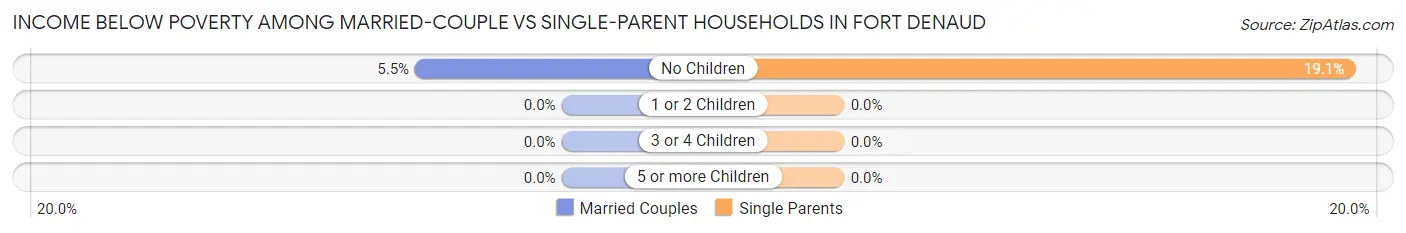
| Children | Married-Couple Families | Single-Parent Households |
| No Children | 19 (5.5%) | 21 (19.1%) |
| 1 or 2 Children | 0 (0.0%) | 0 (0.0%) |
| 3 or 4 Children | 0 (0.0%) | 0 (0.0%) |
| 5 or more Children | 0 (0.0%) | 0 (0.0%) |
| Total | 19 (4.0%) | 21 (17.6%) |
Race in Fort Denaud
The most populous races in Fort Denaud are White / Caucasian (1,535 | 92.9%), Hispanic or Latino (306 | 18.5%), and Two or more Races (104 | 6.3%).
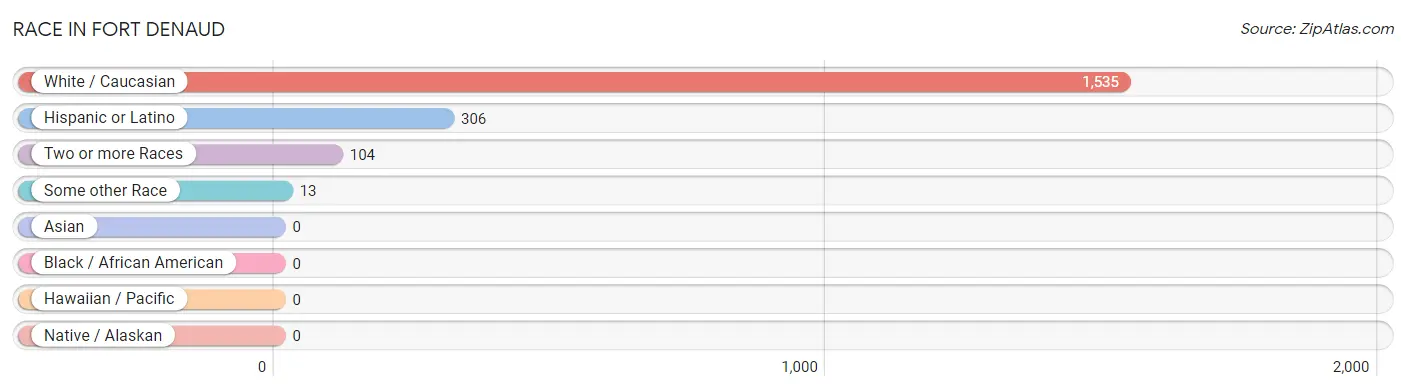
| Race | # Population | % Population |
| Asian | 0 | 0.0% |
| Black / African American | 0 | 0.0% |
| Hawaiian / Pacific | 0 | 0.0% |
| Hispanic or Latino | 306 | 18.5% |
| Native / Alaskan | 0 | 0.0% |
| White / Caucasian | 1,535 | 92.9% |
| Two or more Races | 104 | 6.3% |
| Some other Race | 13 | 0.8% |
| Total | 1,652 | 100.0% |
Ancestry in Fort Denaud
The most populous ancestries reported in Fort Denaud are English (580 | 35.1%), German (280 | 17.0%), Irish (240 | 14.5%), American (202 | 12.2%), and Mexican (180 | 10.9%), together accounting for 89.7% of all Fort Denaud residents.
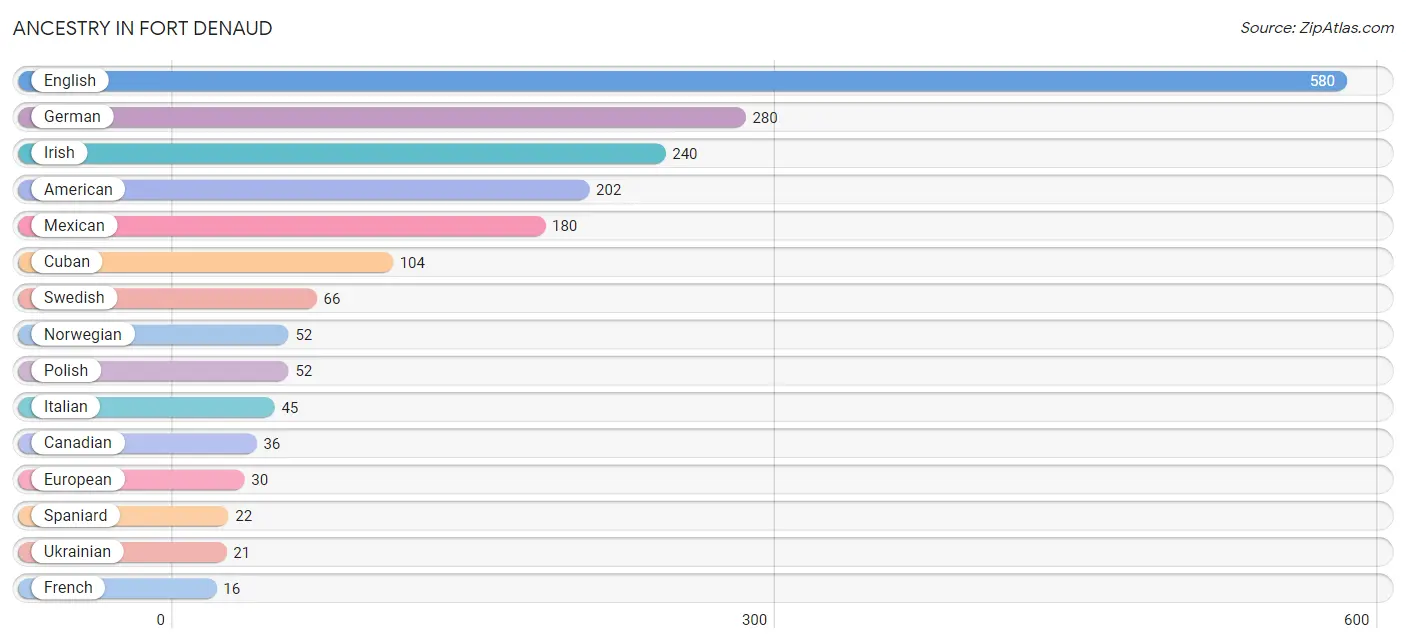
| Ancestry | # Population | % Population |
| American | 202 | 12.2% |
| British | 6 | 0.4% |
| Canadian | 36 | 2.2% |
| Cuban | 104 | 6.3% |
| Czech | 9 | 0.5% |
| Dutch | 14 | 0.9% |
| English | 580 | 35.1% |
| European | 30 | 1.8% |
| French | 16 | 1.0% |
| French Canadian | 9 | 0.5% |
| German | 280 | 17.0% |
| Irish | 240 | 14.5% |
| Italian | 45 | 2.7% |
| Mexican | 180 | 10.9% |
| Norwegian | 52 | 3.2% |
| Polish | 52 | 3.2% |
| Scottish | 6 | 0.4% |
| Spaniard | 22 | 1.3% |
| Swedish | 66 | 4.0% |
| Swiss | 9 | 0.5% |
| Ukrainian | 21 | 1.3% | View All 21 Rows |
Immigrants in Fort Denaud
The most numerous immigrant groups reported in Fort Denaud came from Latin America (117 | 7.1%), Caribbean (104 | 6.3%), Cuba (104 | 6.3%), Europe (59 | 3.6%), and Canada (46 | 2.8%), together accounting for 26.0% of all Fort Denaud residents.
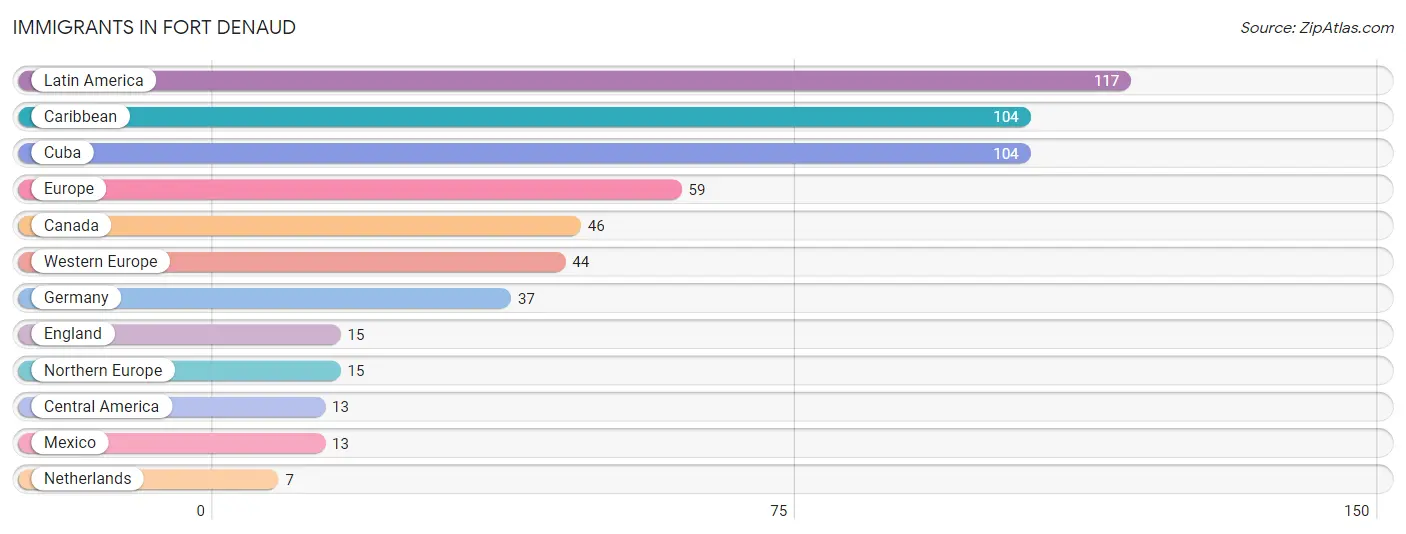
| Immigration Origin | # Population | % Population |
| Canada | 46 | 2.8% |
| Caribbean | 104 | 6.3% |
| Central America | 13 | 0.8% |
| Cuba | 104 | 6.3% |
| England | 15 | 0.9% |
| Europe | 59 | 3.6% |
| Germany | 37 | 2.2% |
| Latin America | 117 | 7.1% |
| Mexico | 13 | 0.8% |
| Netherlands | 7 | 0.4% |
| Northern Europe | 15 | 0.9% |
| Western Europe | 44 | 2.7% | View All 12 Rows |
Sex and Age in Fort Denaud
Sex and Age in Fort Denaud
The most populous age groups in Fort Denaud are 40 to 44 Years (121 | 13.8%) for men and 70 to 74 Years (121 | 15.6%) for women.
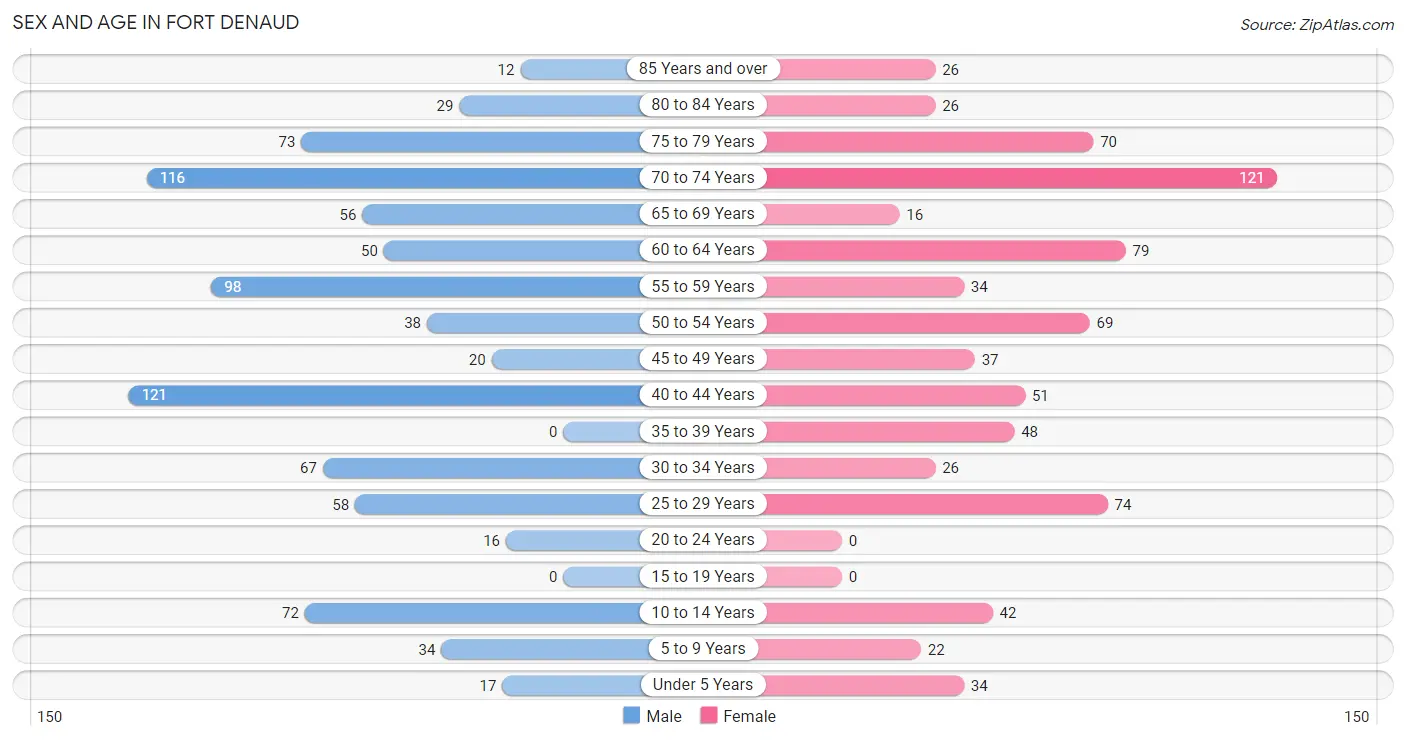
| Age Bracket | Male | Female |
| Under 5 Years | 17 (1.9%) | 34 (4.4%) |
| 5 to 9 Years | 34 (3.9%) | 22 (2.8%) |
| 10 to 14 Years | 72 (8.2%) | 42 (5.4%) |
| 15 to 19 Years | 0 (0.0%) | 0 (0.0%) |
| 20 to 24 Years | 16 (1.8%) | 0 (0.0%) |
| 25 to 29 Years | 58 (6.6%) | 74 (9.6%) |
| 30 to 34 Years | 67 (7.6%) | 26 (3.4%) |
| 35 to 39 Years | 0 (0.0%) | 48 (6.2%) |
| 40 to 44 Years | 121 (13.8%) | 51 (6.6%) |
| 45 to 49 Years | 20 (2.3%) | 37 (4.8%) |
| 50 to 54 Years | 38 (4.3%) | 69 (8.9%) |
| 55 to 59 Years | 98 (11.2%) | 34 (4.4%) |
| 60 to 64 Years | 50 (5.7%) | 79 (10.2%) |
| 65 to 69 Years | 56 (6.4%) | 16 (2.1%) |
| 70 to 74 Years | 116 (13.2%) | 121 (15.6%) |
| 75 to 79 Years | 73 (8.3%) | 70 (9.0%) |
| 80 to 84 Years | 29 (3.3%) | 26 (3.4%) |
| 85 Years and over | 12 (1.4%) | 26 (3.4%) |
| Total | 877 (100.0%) | 775 (100.0%) |
Families and Households in Fort Denaud
Median Family Size in Fort Denaud
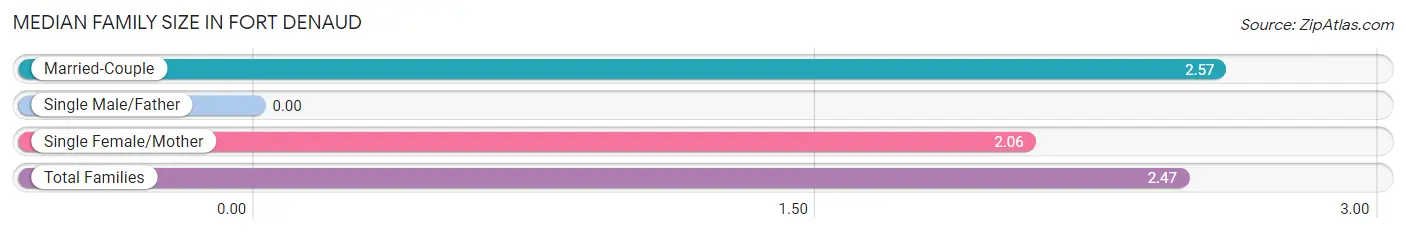
| Family Type | # Families | Family Size |
| Married-Couple | 477 (80.0%) | 2.57 |
| Single Male/Father | 0 (0.0%) | - |
| Single Female/Mother | 119 (20.0%) | 2.06 |
| Total Families | 596 (100.0%) | 2.47 |
Median Household Size in Fort Denaud
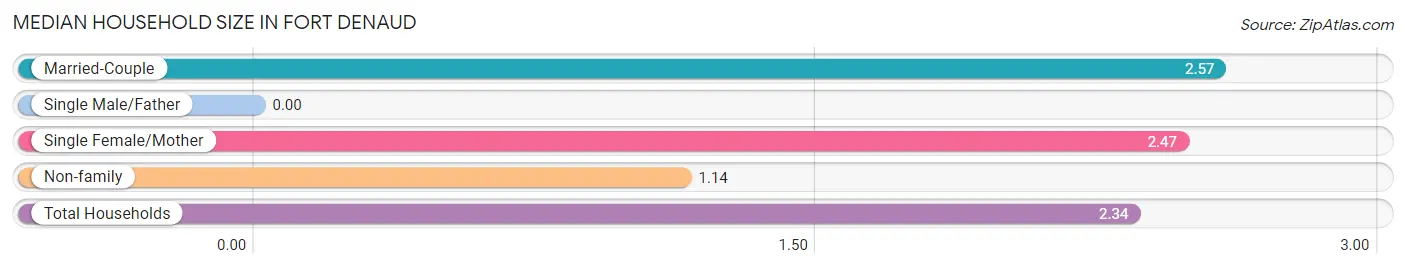
| Household Type | # Households | Household Size |
| Married-Couple | 477 (68.2%) | 2.57 |
| Single Male/Father | 0 (0.0%) | - |
| Single Female/Mother | 119 (17.0%) | 2.47 |
| Non-family | 103 (14.7%) | 1.14 |
| Total Households | 699 (100.0%) | 2.34 |
Household Size by Marriage Status in Fort Denaud
Out of a total of 699 households in Fort Denaud, 596 (85.3%) are family households, while 103 (14.7%) are nonfamily households. The most numerous type of family households are 2-person households, comprising 386, and the most common type of nonfamily households are 1-person households, comprising 81.
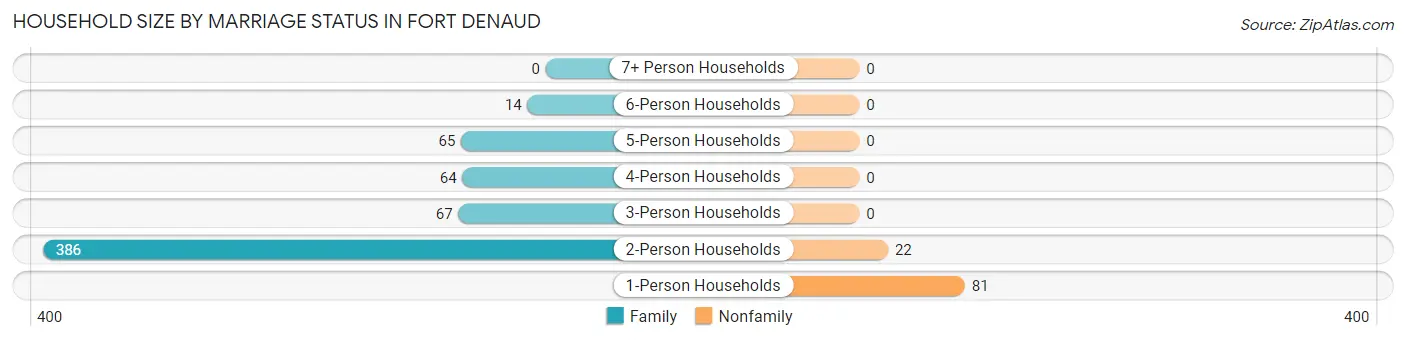
| Household Size | Family Households | Nonfamily Households |
| 1-Person Households | - | 81 (11.6%) |
| 2-Person Households | 386 (55.2%) | 22 (3.2%) |
| 3-Person Households | 67 (9.6%) | 0 (0.0%) |
| 4-Person Households | 64 (9.2%) | 0 (0.0%) |
| 5-Person Households | 65 (9.3%) | 0 (0.0%) |
| 6-Person Households | 14 (2.0%) | 0 (0.0%) |
| 7+ Person Households | 0 (0.0%) | 0 (0.0%) |
| Total | 596 (85.3%) | 103 (14.7%) |
Female Fertility in Fort Denaud
Fertility by Age in Fort Denaud
Average fertility rate in Fort Denaud is 38.0 births per 1,000 women. Women in the age bracket of 20 to 34 years have the highest fertility rate with 90.0 births per 1,000 women. Women in the age bracket of 20 to 34 years acount for 100.0% of all women with births.
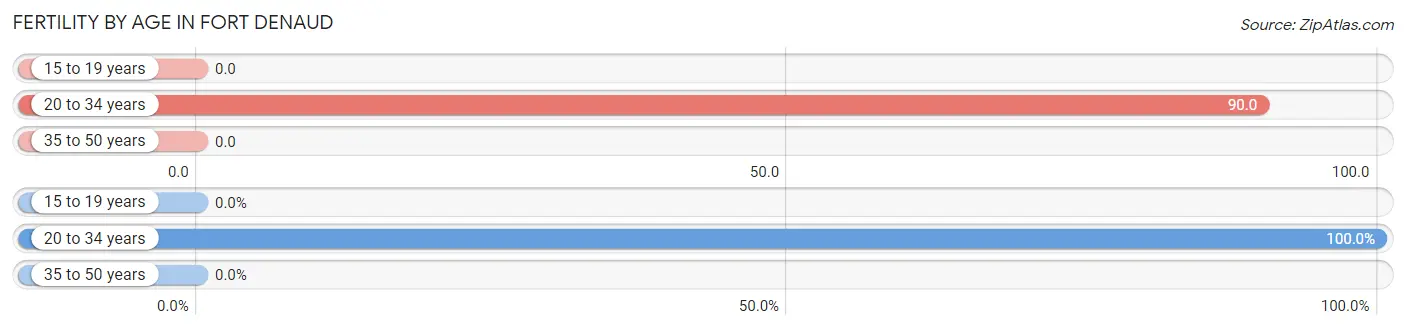
| Age Bracket | Women with Births | Births / 1,000 Women |
| 15 to 19 years | 0 (0.0%) | 0.0 |
| 20 to 34 years | 9 (100.0%) | 90.0 |
| 35 to 50 years | 0 (0.0%) | 0.0 |
| Total | 9 (100.0%) | 38.0 |
Fertility by Age by Marriage Status in Fort Denaud
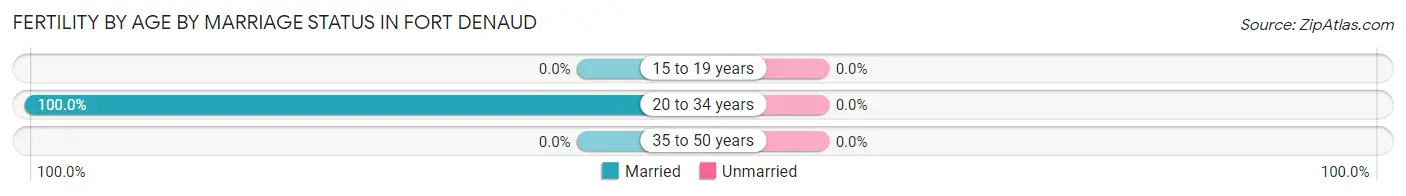
| Age Bracket | Married | Unmarried |
| 15 to 19 years | 0 (0.0%) | 0 (0.0%) |
| 20 to 34 years | 9 (100.0%) | 0 (0.0%) |
| 35 to 50 years | 0 (0.0%) | 0 (0.0%) |
| Total | 9 (100.0%) | 0 (0.0%) |
Fertility by Education in Fort Denaud
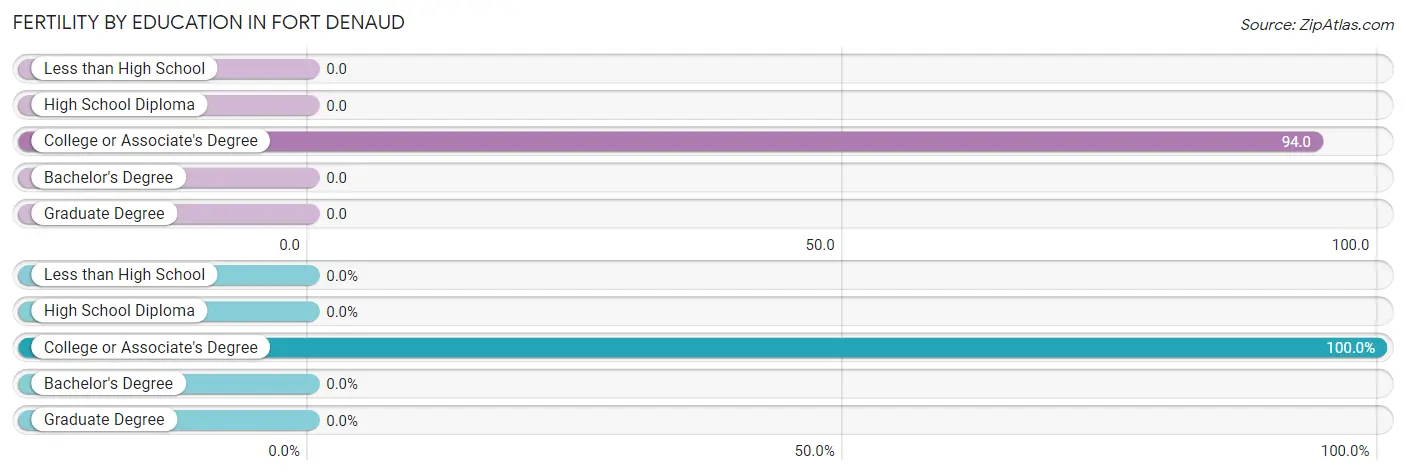
| Educational Attainment | Women with Births | Births / 1,000 Women |
| Less than High School | 0 (0.0%) | 0.0 |
| High School Diploma | 0 (0.0%) | 0.0 |
| College or Associate's Degree | 9 (100.0%) | 94.0 |
| Bachelor's Degree | 0 (0.0%) | 0.0 |
| Graduate Degree | 0 (0.0%) | 0.0 |
| Total | 9 (100.0%) | 38.0 |
Fertility by Education by Marriage Status in Fort Denaud
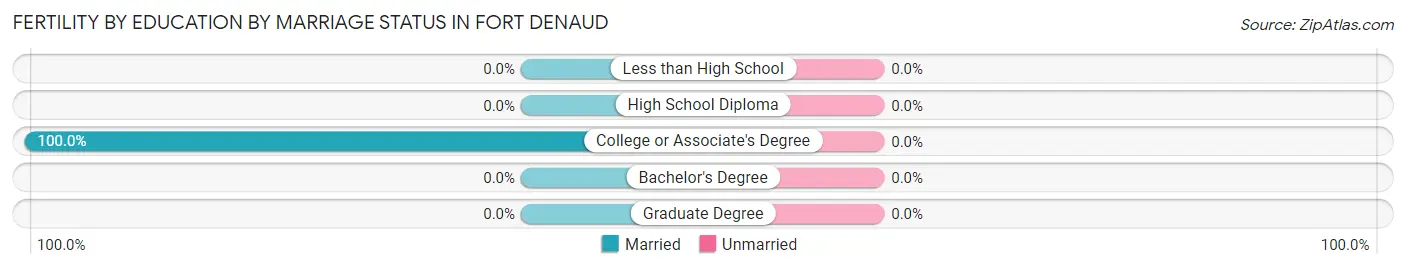
| Educational Attainment | Married | Unmarried |
| Less than High School | 0 (0.0%) | 0 (0.0%) |
| High School Diploma | 0 (0.0%) | 0 (0.0%) |
| College or Associate's Degree | 9 (100.0%) | 0 (0.0%) |
| Bachelor's Degree | 0 (0.0%) | 0 (0.0%) |
| Graduate Degree | 0 (0.0%) | 0 (0.0%) |
| Total | 9 (100.0%) | 0 (0.0%) |
Employment Characteristics in Fort Denaud
Employment by Class of Employer in Fort Denaud
Among the 673 employed individuals in Fort Denaud, private company employees (454 | 67.5%), self-employed (incorporated) (103 | 15.3%), and self-employed (not incorporated) (36 | 5.3%) make up the most common classes of employment.
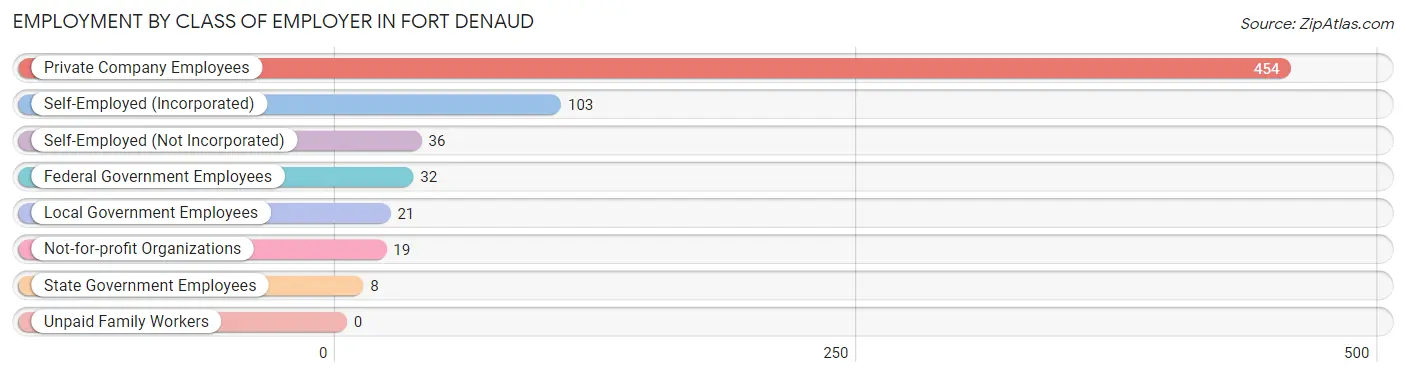
| Employer Class | # Employees | % Employees |
| Private Company Employees | 454 | 67.5% |
| Self-Employed (Incorporated) | 103 | 15.3% |
| Self-Employed (Not Incorporated) | 36 | 5.3% |
| Not-for-profit Organizations | 19 | 2.8% |
| Local Government Employees | 21 | 3.1% |
| State Government Employees | 8 | 1.2% |
| Federal Government Employees | 32 | 4.8% |
| Unpaid Family Workers | 0 | 0.0% |
| Total | 673 | 100.0% |
Employment Status by Age in Fort Denaud
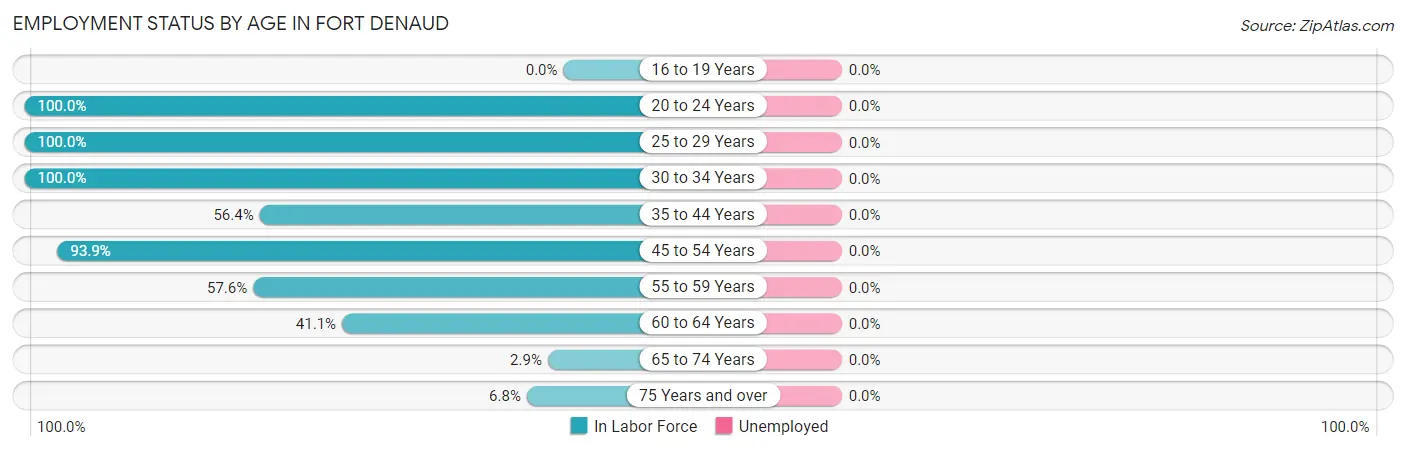
| Age Bracket | In Labor Force | Unemployed |
| 16 to 19 Years | 0 (0.0%) | 0 (0.0%) |
| 20 to 24 Years | 16 (100.0%) | 0 (0.0%) |
| 25 to 29 Years | 132 (100.0%) | 0 (0.0%) |
| 30 to 34 Years | 93 (100.0%) | 0 (0.0%) |
| 35 to 44 Years | 124 (56.4%) | 0 (0.0%) |
| 45 to 54 Years | 154 (93.9%) | 0 (0.0%) |
| 55 to 59 Years | 76 (57.6%) | 0 (0.0%) |
| 60 to 64 Years | 53 (41.1%) | 0 (0.0%) |
| 65 to 74 Years | 9 (2.9%) | 0 (0.0%) |
| 75 Years and over | 16 (6.8%) | 0 (0.0%) |
| Total | 673 (47.0%) | 0 (0.0%) |
Employment Status by Educational Attainment in Fort Denaud
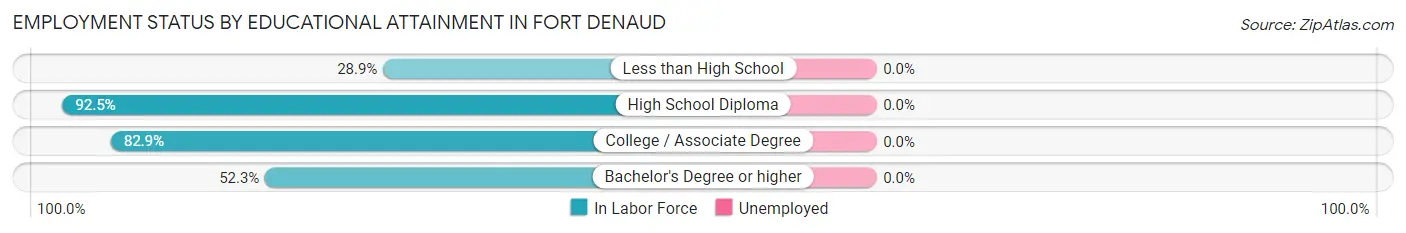
| Educational Attainment | In Labor Force | Unemployed |
| Less than High School | 26 (28.9%) | 0 (0.0%) |
| High School Diploma | 259 (92.5%) | 0 (0.0%) |
| College / Associate Degree | 232 (82.9%) | 0 (0.0%) |
| Bachelor's Degree or higher | 115 (52.3%) | 0 (0.0%) |
| Total | 632 (72.6%) | 0 (0.0%) |
Employment Occupations by Sex in Fort Denaud
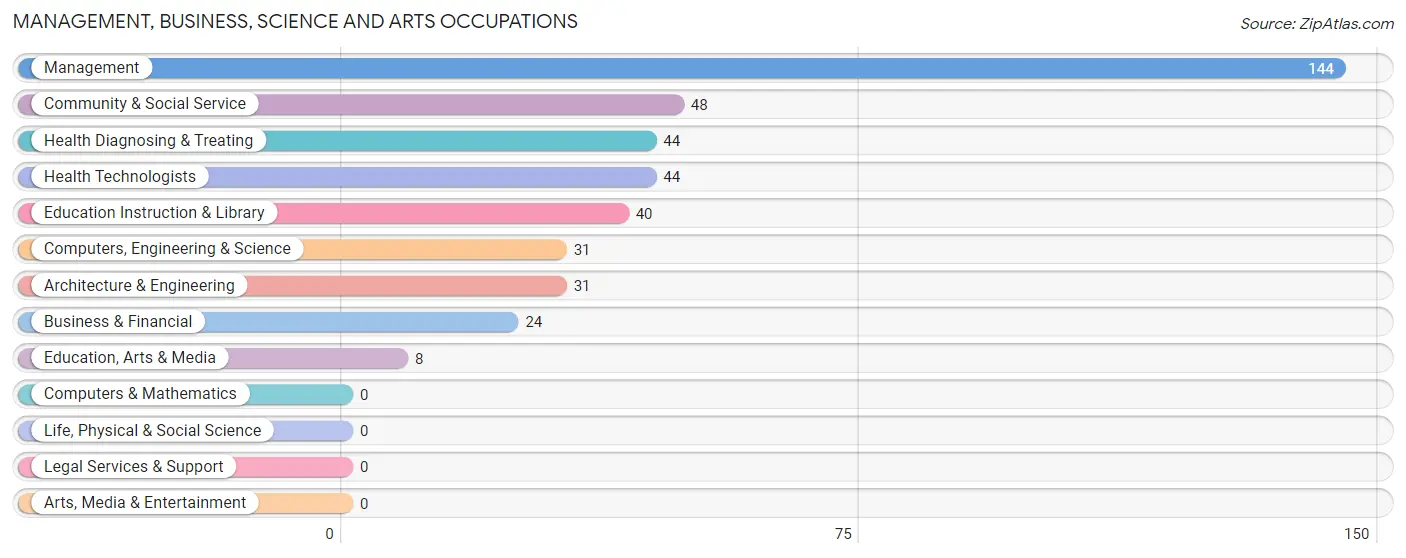
Management, Business, Science and Arts Occupations
The most common Management, Business, Science and Arts occupations in Fort Denaud are Management (144 | 21.4%), Community & Social Service (48 | 7.1%), Health Diagnosing & Treating (44 | 6.5%), Health Technologists (44 | 6.5%), and Education Instruction & Library (40 | 5.9%).
Management, Business, Science and Arts Occupations by Sex
Within the Management, Business, Science and Arts occupations in Fort Denaud, the most male-oriented occupations are Management (100.0%), Health Diagnosing & Treating (100.0%), and Health Technologists (100.0%), while the most female-oriented occupations are Computers, Engineering & Science (100.0%), Architecture & Engineering (100.0%), and Community & Social Service (100.0%).
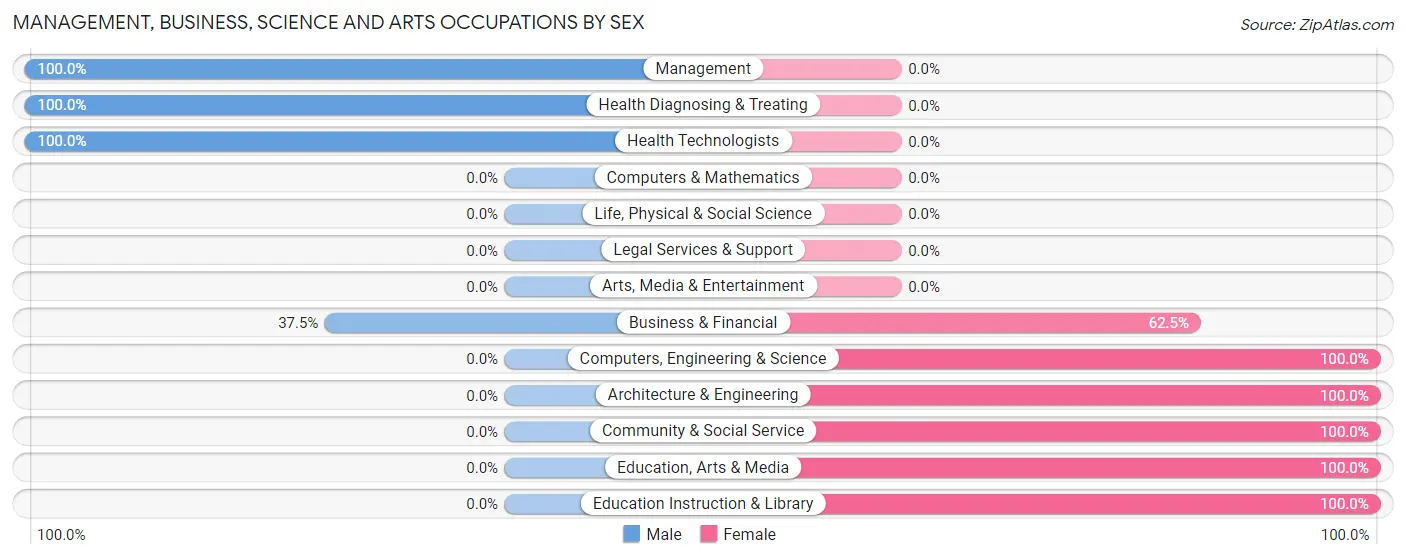
| Occupation | Male | Female |
| Management | 144 (100.0%) | 0 (0.0%) |
| Business & Financial | 9 (37.5%) | 15 (62.5%) |
| Computers, Engineering & Science | 0 (0.0%) | 31 (100.0%) |
| Computers & Mathematics | 0 (0.0%) | 0 (0.0%) |
| Architecture & Engineering | 0 (0.0%) | 31 (100.0%) |
| Life, Physical & Social Science | 0 (0.0%) | 0 (0.0%) |
| Community & Social Service | 0 (0.0%) | 48 (100.0%) |
| Education, Arts & Media | 0 (0.0%) | 8 (100.0%) |
| Legal Services & Support | 0 (0.0%) | 0 (0.0%) |
| Education Instruction & Library | 0 (0.0%) | 40 (100.0%) |
| Arts, Media & Entertainment | 0 (0.0%) | 0 (0.0%) |
| Health Diagnosing & Treating | 44 (100.0%) | 0 (0.0%) |
| Health Technologists | 44 (100.0%) | 0 (0.0%) |
| Total (Category) | 197 (67.7%) | 94 (32.3%) |
| Total (Overall) | 369 (54.8%) | 304 (45.2%) |
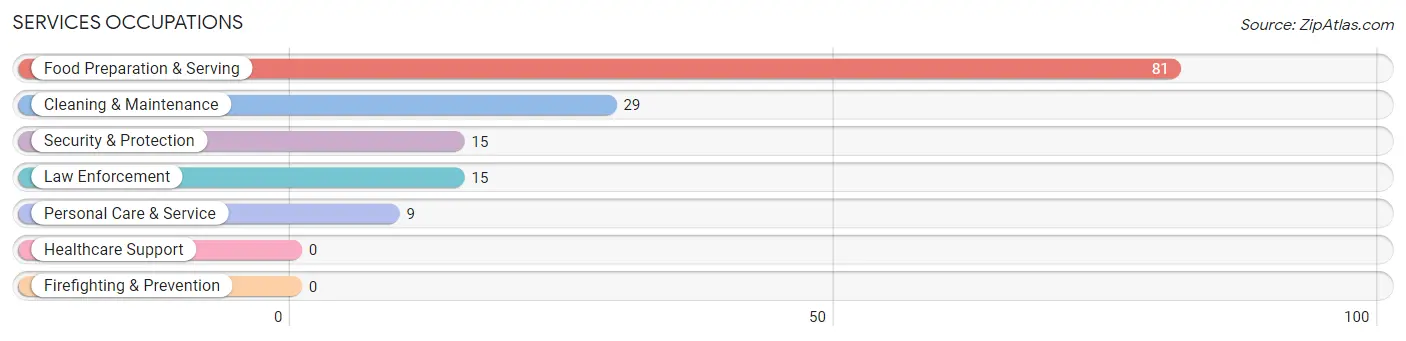
Services Occupations
The most common Services occupations in Fort Denaud are Food Preparation & Serving (81 | 12.0%), Cleaning & Maintenance (29 | 4.3%), Security & Protection (15 | 2.2%), Law Enforcement (15 | 2.2%), and Personal Care & Service (9 | 1.3%).
Services Occupations by Sex
Within the Services occupations in Fort Denaud, the most male-oriented occupations are Cleaning & Maintenance (100.0%), Security & Protection (40.0%), and Law Enforcement (40.0%), while the most female-oriented occupations are Personal Care & Service (100.0%), Food Preparation & Serving (80.2%), and Security & Protection (60.0%).
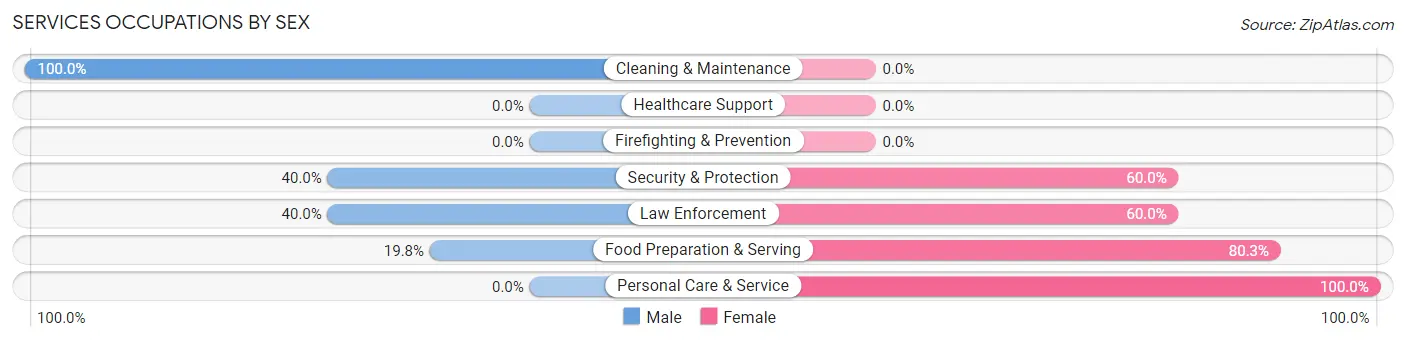
| Occupation | Male | Female |
| Healthcare Support | 0 (0.0%) | 0 (0.0%) |
| Security & Protection | 6 (40.0%) | 9 (60.0%) |
| Firefighting & Prevention | 0 (0.0%) | 0 (0.0%) |
| Law Enforcement | 6 (40.0%) | 9 (60.0%) |
| Food Preparation & Serving | 16 (19.8%) | 65 (80.2%) |
| Cleaning & Maintenance | 29 (100.0%) | 0 (0.0%) |
| Personal Care & Service | 0 (0.0%) | 9 (100.0%) |
| Total (Category) | 51 (38.1%) | 83 (61.9%) |
| Total (Overall) | 369 (54.8%) | 304 (45.2%) |
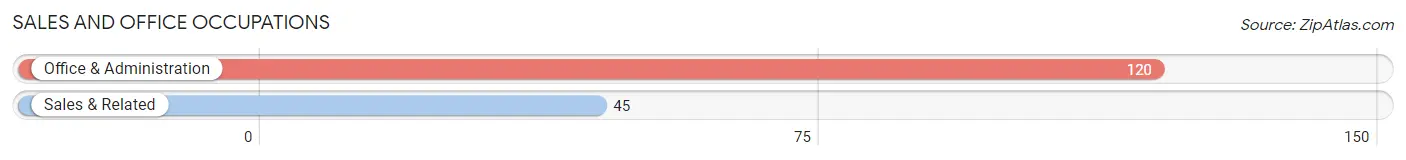
Sales and Office Occupations
The most common Sales and Office occupations in Fort Denaud are Office & Administration (120 | 17.8%), and Sales & Related (45 | 6.7%).
Sales and Office Occupations by Sex
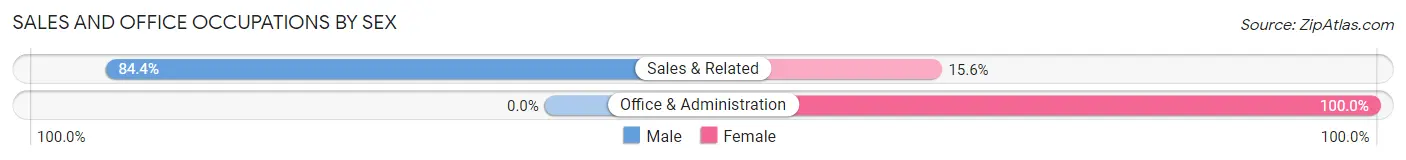
| Occupation | Male | Female |
| Sales & Related | 38 (84.4%) | 7 (15.6%) |
| Office & Administration | 0 (0.0%) | 120 (100.0%) |
| Total (Category) | 38 (23.0%) | 127 (77.0%) |
| Total (Overall) | 369 (54.8%) | 304 (45.2%) |
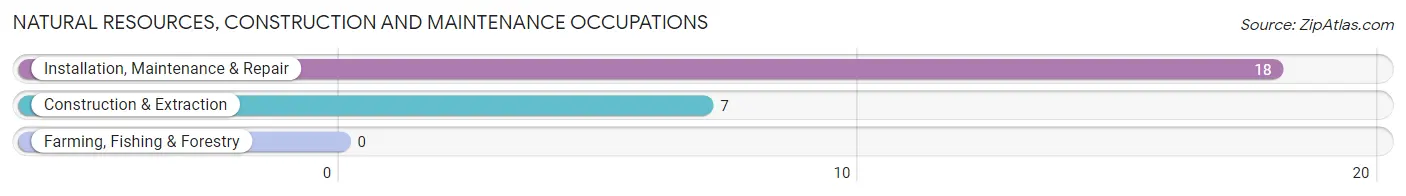
Natural Resources, Construction and Maintenance Occupations
The most common Natural Resources, Construction and Maintenance occupations in Fort Denaud are Installation, Maintenance & Repair (18 | 2.7%), and Construction & Extraction (7 | 1.0%).
Natural Resources, Construction and Maintenance Occupations by Sex
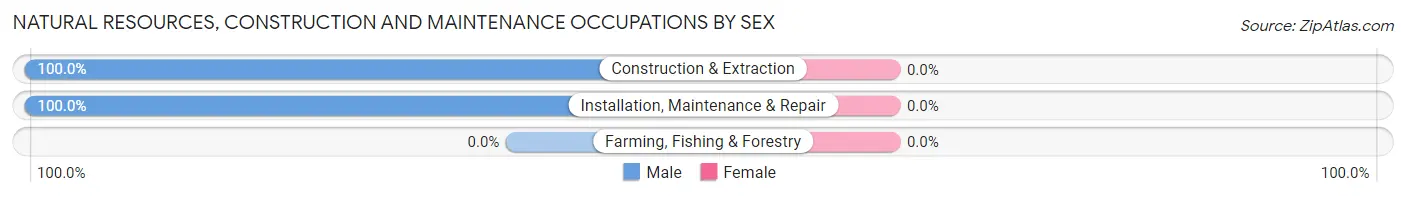
| Occupation | Male | Female |
| Farming, Fishing & Forestry | 0 (0.0%) | 0 (0.0%) |
| Construction & Extraction | 7 (100.0%) | 0 (0.0%) |
| Installation, Maintenance & Repair | 18 (100.0%) | 0 (0.0%) |
| Total (Category) | 25 (100.0%) | 0 (0.0%) |
| Total (Overall) | 369 (54.8%) | 304 (45.2%) |
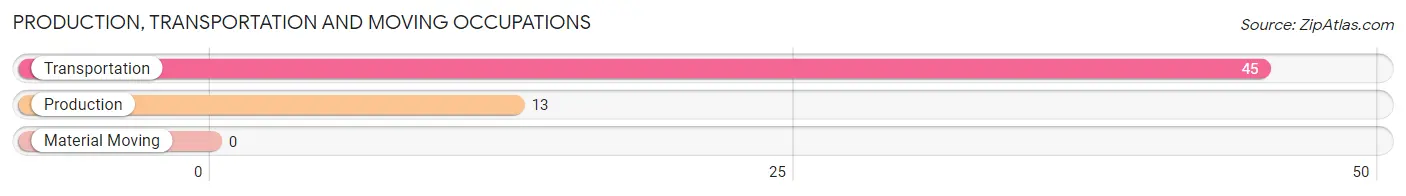
Production, Transportation and Moving Occupations
The most common Production, Transportation and Moving occupations in Fort Denaud are Transportation (45 | 6.7%), and Production (13 | 1.9%).
Production, Transportation and Moving Occupations by Sex
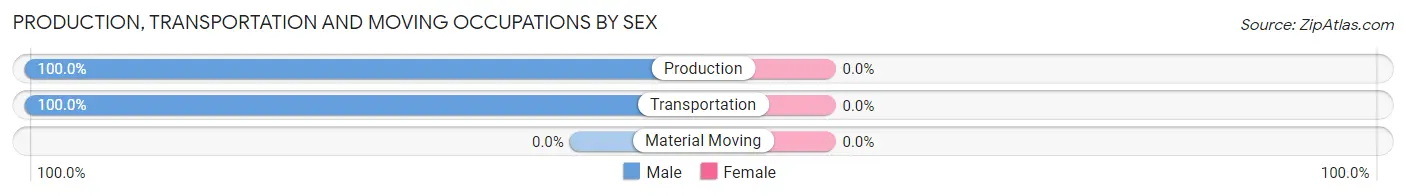
| Occupation | Male | Female |
| Production | 13 (100.0%) | 0 (0.0%) |
| Transportation | 45 (100.0%) | 0 (0.0%) |
| Material Moving | 0 (0.0%) | 0 (0.0%) |
| Total (Category) | 58 (100.0%) | 0 (0.0%) |
| Total (Overall) | 369 (54.8%) | 304 (45.2%) |
Employment Industries by Sex in Fort Denaud
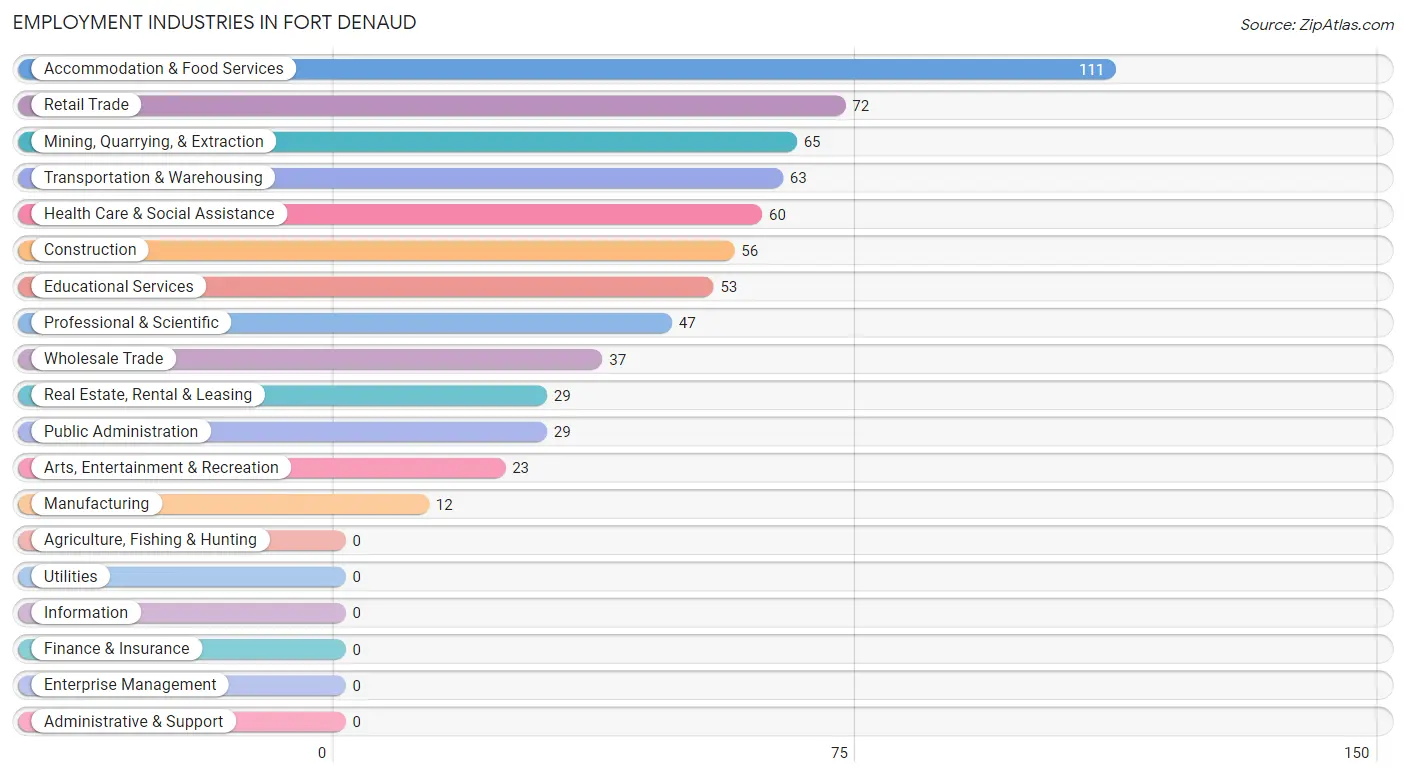
Employment Industries in Fort Denaud
The major employment industries in Fort Denaud include Accommodation & Food Services (111 | 16.5%), Retail Trade (72 | 10.7%), Mining, Quarrying, & Extraction (65 | 9.7%), Transportation & Warehousing (63 | 9.4%), and Health Care & Social Assistance (60 | 8.9%).
Employment Industries by Sex in Fort Denaud
The Fort Denaud industries that see more men than women are Manufacturing (100.0%), Real Estate, Rental & Leasing (100.0%), and Arts, Entertainment & Recreation (100.0%), whereas the industries that tend to have a higher number of women are Wholesale Trade (81.1%), Professional & Scientific (80.8%), and Public Administration (79.3%).
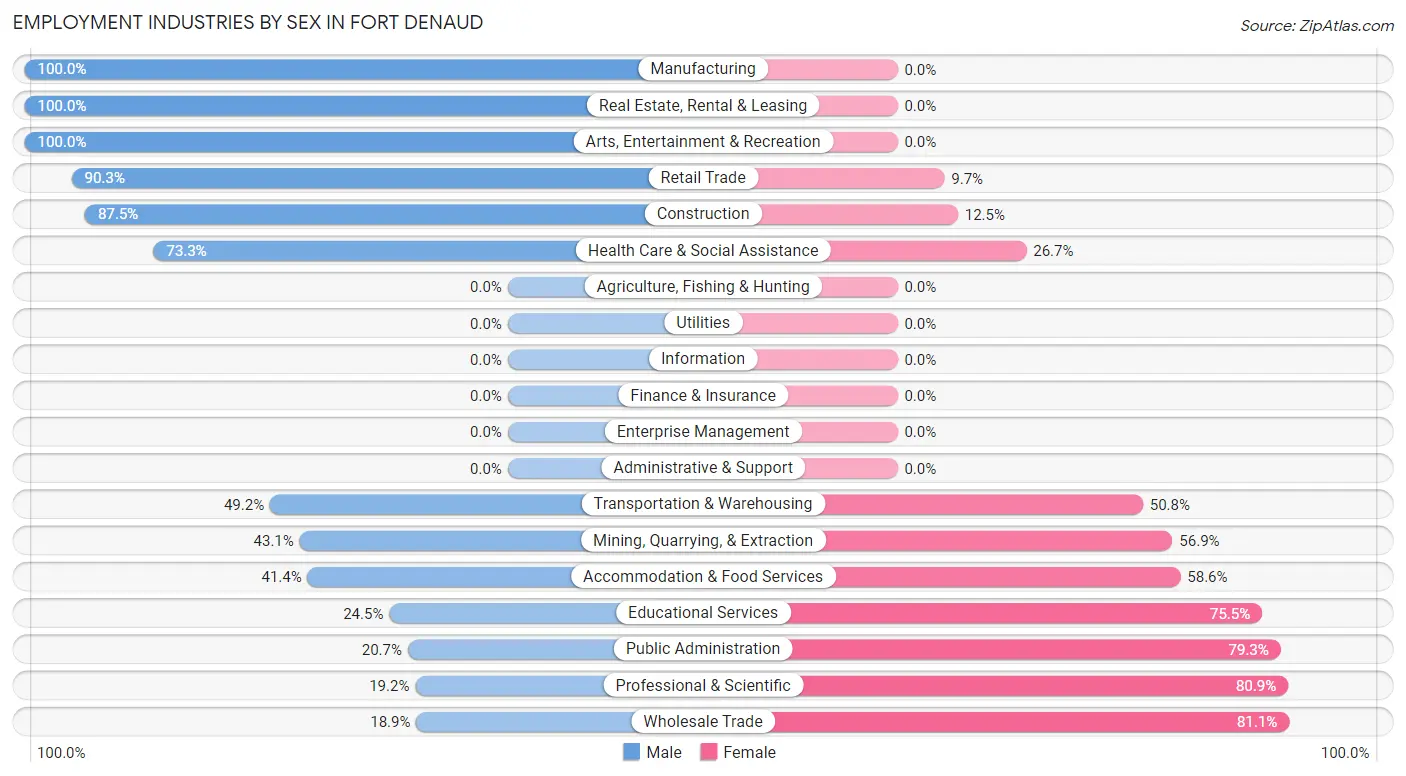
| Industry | Male | Female |
| Agriculture, Fishing & Hunting | 0 (0.0%) | 0 (0.0%) |
| Mining, Quarrying, & Extraction | 28 (43.1%) | 37 (56.9%) |
| Construction | 49 (87.5%) | 7 (12.5%) |
| Manufacturing | 12 (100.0%) | 0 (0.0%) |
| Wholesale Trade | 7 (18.9%) | 30 (81.1%) |
| Retail Trade | 65 (90.3%) | 7 (9.7%) |
| Transportation & Warehousing | 31 (49.2%) | 32 (50.8%) |
| Utilities | 0 (0.0%) | 0 (0.0%) |
| Information | 0 (0.0%) | 0 (0.0%) |
| Finance & Insurance | 0 (0.0%) | 0 (0.0%) |
| Real Estate, Rental & Leasing | 29 (100.0%) | 0 (0.0%) |
| Professional & Scientific | 9 (19.2%) | 38 (80.8%) |
| Enterprise Management | 0 (0.0%) | 0 (0.0%) |
| Administrative & Support | 0 (0.0%) | 0 (0.0%) |
| Educational Services | 13 (24.5%) | 40 (75.5%) |
| Health Care & Social Assistance | 44 (73.3%) | 16 (26.7%) |
| Arts, Entertainment & Recreation | 23 (100.0%) | 0 (0.0%) |
| Accommodation & Food Services | 46 (41.4%) | 65 (58.6%) |
| Public Administration | 6 (20.7%) | 23 (79.3%) |
| Total | 369 (54.8%) | 304 (45.2%) |
Education in Fort Denaud
School Enrollment in Fort Denaud
The most common levels of schooling among the 223 students in Fort Denaud are middle school (114 | 51.1%), college / undergraduate (53 | 23.8%), and elementary school (45 | 20.2%).
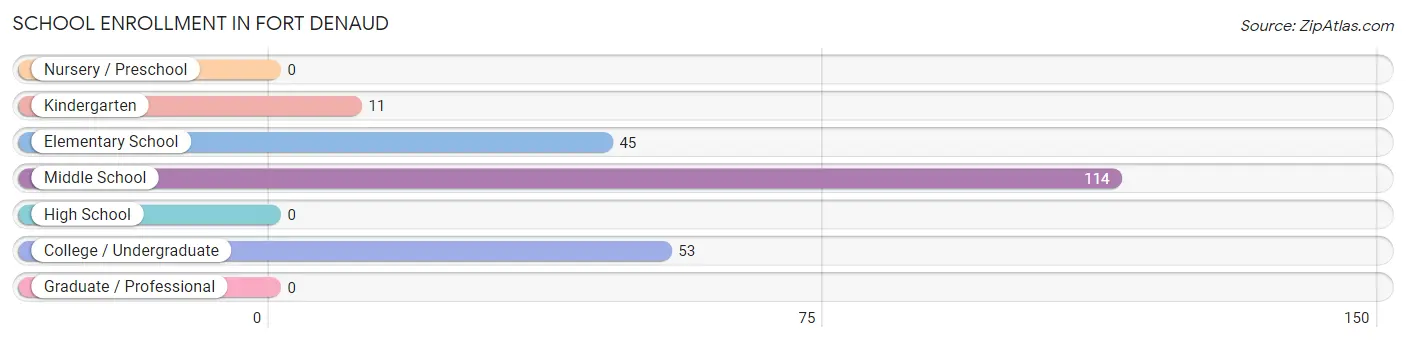
| School Level | # Students | % Students |
| Nursery / Preschool | 0 | 0.0% |
| Kindergarten | 11 | 4.9% |
| Elementary School | 45 | 20.2% |
| Middle School | 114 | 51.1% |
| High School | 0 | 0.0% |
| College / Undergraduate | 53 | 23.8% |
| Graduate / Professional | 0 | 0.0% |
| Total | 223 | 100.0% |
School Enrollment by Age by Funding Source in Fort Denaud
Out of a total of 223 students who are enrolled in schools in Fort Denaud, 112 (50.2%) attend a private institution, while the remaining 111 (49.8%) are enrolled in public schools. The age group of 25 to 34 year olds has the highest likelihood of being enrolled in private schools, with 44 (83.0% in the age bracket) enrolled. Conversely, the age group of 10 to 14 year olds has the lowest likelihood of being enrolled in a private school, with 80 (70.2% in the age bracket) attending a public institution.
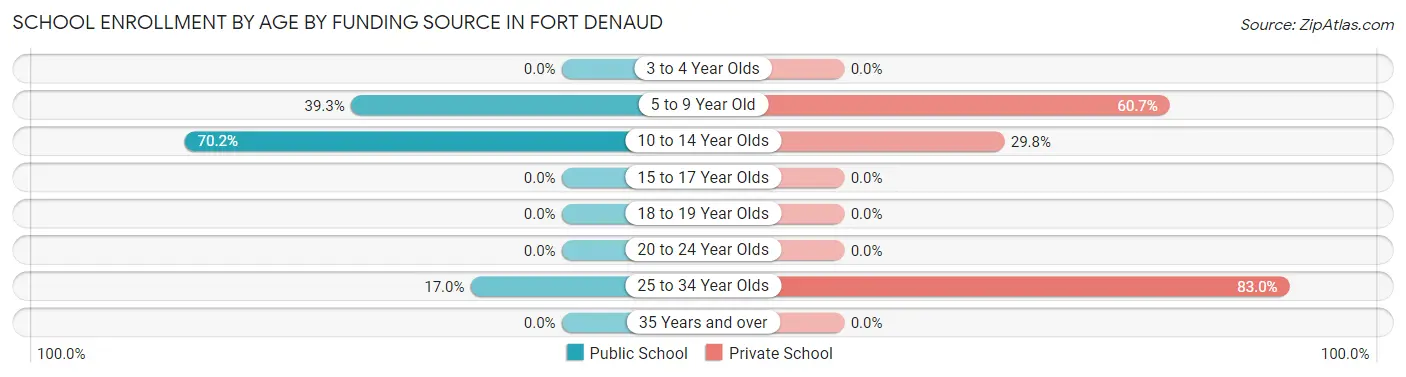
| Age Bracket | Public School | Private School |
| 3 to 4 Year Olds | 0 (0.0%) | 0 (0.0%) |
| 5 to 9 Year Old | 22 (39.3%) | 34 (60.7%) |
| 10 to 14 Year Olds | 80 (70.2%) | 34 (29.8%) |
| 15 to 17 Year Olds | 0 (0.0%) | 0 (0.0%) |
| 18 to 19 Year Olds | 0 (0.0%) | 0 (0.0%) |
| 20 to 24 Year Olds | 0 (0.0%) | 0 (0.0%) |
| 25 to 34 Year Olds | 9 (17.0%) | 44 (83.0%) |
| 35 Years and over | 0 (0.0%) | 0 (0.0%) |
| Total | 111 (49.8%) | 112 (50.2%) |
Educational Attainment by Field of Study in Fort Denaud
Business (59 | 18.8%), education (56 | 17.8%), science & technology (45 | 14.3%), liberal arts & history (37 | 11.8%), and arts & humanities (37 | 11.8%) are the most common fields of study among 314 individuals in Fort Denaud who have obtained a bachelor's degree or higher.
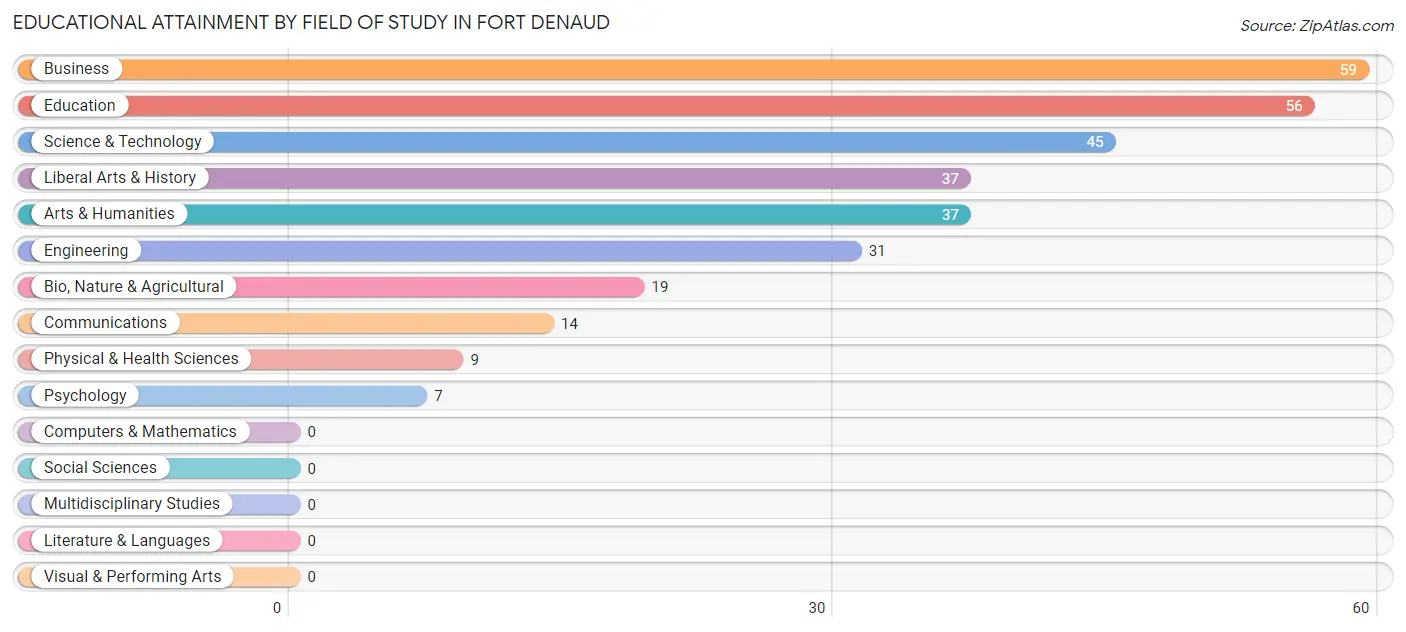
| Field of Study | # Graduates | % Graduates |
| Computers & Mathematics | 0 | 0.0% |
| Bio, Nature & Agricultural | 19 | 6.0% |
| Physical & Health Sciences | 9 | 2.9% |
| Psychology | 7 | 2.2% |
| Social Sciences | 0 | 0.0% |
| Engineering | 31 | 9.9% |
| Multidisciplinary Studies | 0 | 0.0% |
| Science & Technology | 45 | 14.3% |
| Business | 59 | 18.8% |
| Education | 56 | 17.8% |
| Literature & Languages | 0 | 0.0% |
| Liberal Arts & History | 37 | 11.8% |
| Visual & Performing Arts | 0 | 0.0% |
| Communications | 14 | 4.5% |
| Arts & Humanities | 37 | 11.8% |
| Total | 314 | 100.0% |
Transportation & Commute in Fort Denaud
Vehicle Availability by Sex in Fort Denaud
The most prevalent vehicle ownership categories in Fort Denaud are males with 2 vehicles (208, accounting for 58.4%) and females with 2 vehicles (148, making up 68.4%).
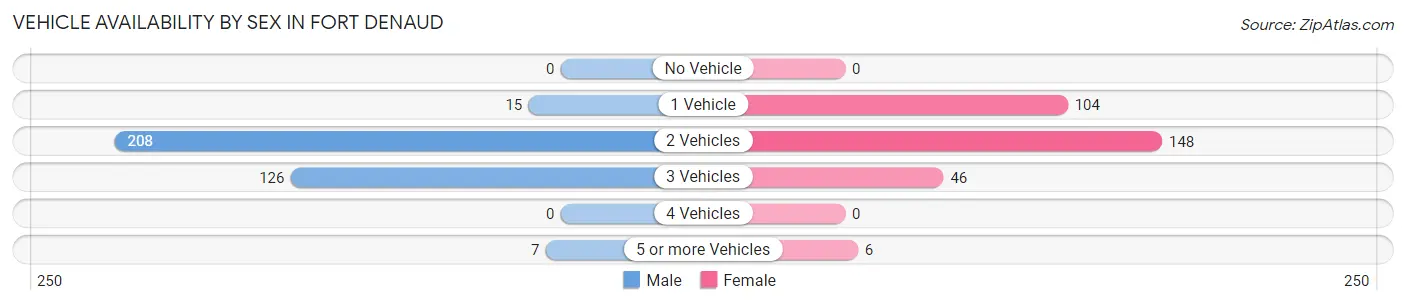
| Vehicles Available | Male | Female |
| No Vehicle | 0 (0.0%) | 0 (0.0%) |
| 1 Vehicle | 15 (4.2%) | 104 (34.2%) |
| 2 Vehicles | 208 (58.4%) | 148 (48.7%) |
| 3 Vehicles | 126 (35.4%) | 46 (15.1%) |
| 4 Vehicles | 0 (0.0%) | 0 (0.0%) |
| 5 or more Vehicles | 7 (2.0%) | 6 (2.0%) |
| Total | 356 (100.0%) | 304 (100.0%) |
Commute Time in Fort Denaud
The most frequently occuring commute durations in Fort Denaud are 15 to 19 minutes (111 commuters, 20.2%), 5 to 9 minutes (95 commuters, 17.2%), and 45 to 59 minutes (78 commuters, 14.2%).
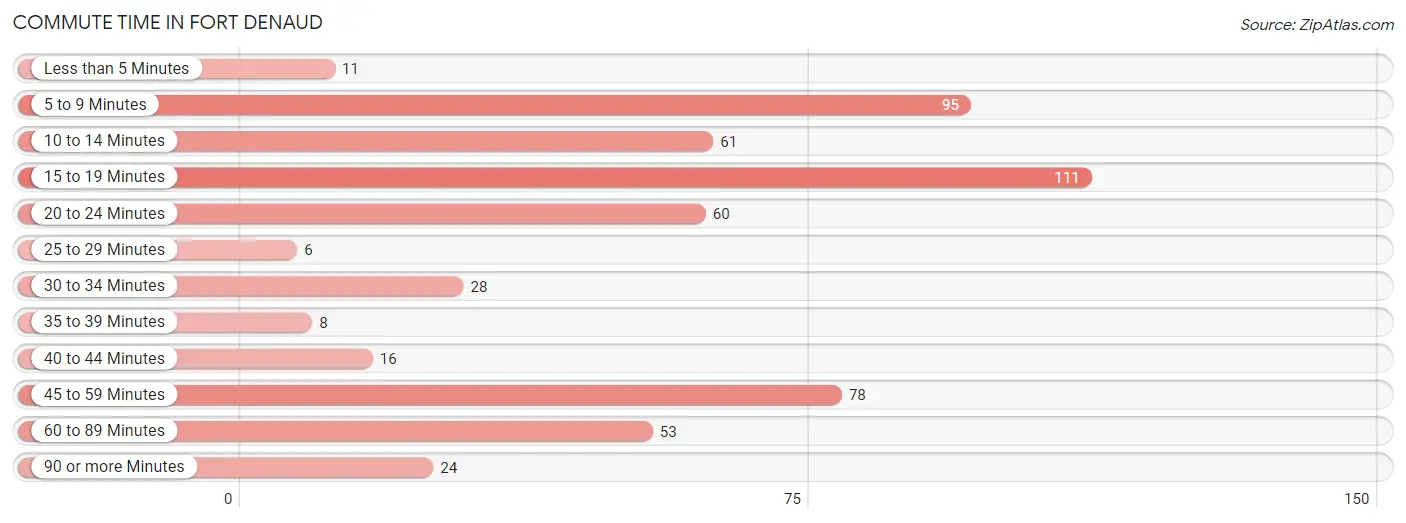
| Commute Time | # Commuters | % Commuters |
| Less than 5 Minutes | 11 | 2.0% |
| 5 to 9 Minutes | 95 | 17.2% |
| 10 to 14 Minutes | 61 | 11.1% |
| 15 to 19 Minutes | 111 | 20.2% |
| 20 to 24 Minutes | 60 | 10.9% |
| 25 to 29 Minutes | 6 | 1.1% |
| 30 to 34 Minutes | 28 | 5.1% |
| 35 to 39 Minutes | 8 | 1.5% |
| 40 to 44 Minutes | 16 | 2.9% |
| 45 to 59 Minutes | 78 | 14.2% |
| 60 to 89 Minutes | 53 | 9.6% |
| 90 or more Minutes | 24 | 4.4% |
Commute Time by Sex in Fort Denaud
The most common commute times in Fort Denaud are 5 to 9 minutes (95 commuters, 29.5%) for males and 15 to 19 minutes (81 commuters, 35.4%) for females.
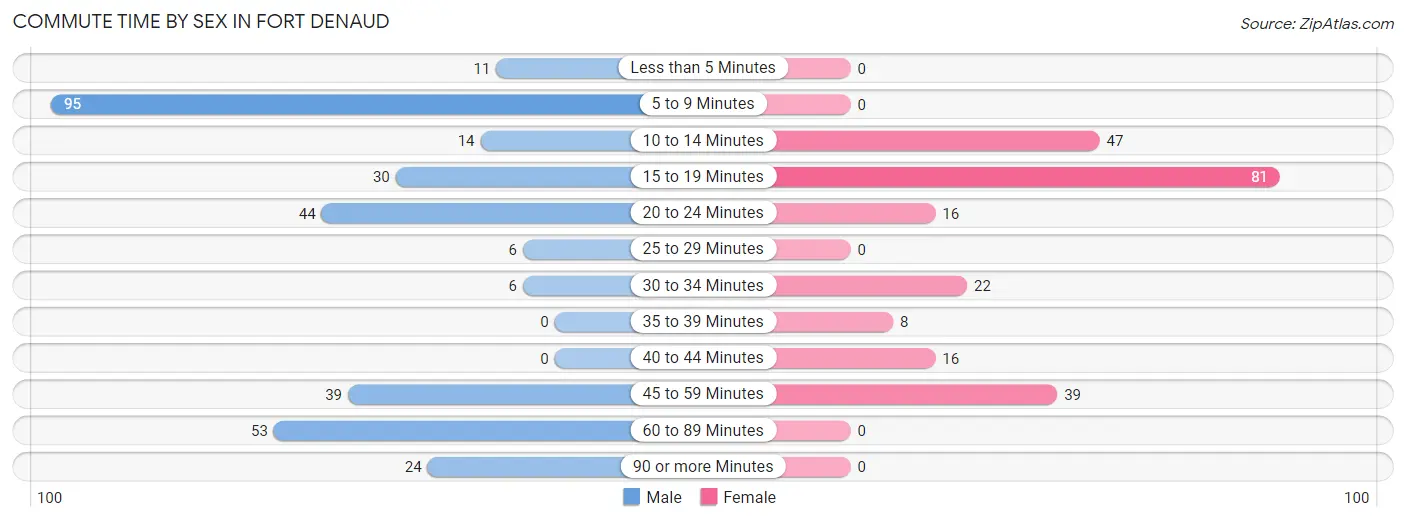
| Commute Time | Male | Female |
| Less than 5 Minutes | 11 (3.4%) | 0 (0.0%) |
| 5 to 9 Minutes | 95 (29.5%) | 0 (0.0%) |
| 10 to 14 Minutes | 14 (4.3%) | 47 (20.5%) |
| 15 to 19 Minutes | 30 (9.3%) | 81 (35.4%) |
| 20 to 24 Minutes | 44 (13.7%) | 16 (7.0%) |
| 25 to 29 Minutes | 6 (1.9%) | 0 (0.0%) |
| 30 to 34 Minutes | 6 (1.9%) | 22 (9.6%) |
| 35 to 39 Minutes | 0 (0.0%) | 8 (3.5%) |
| 40 to 44 Minutes | 0 (0.0%) | 16 (7.0%) |
| 45 to 59 Minutes | 39 (12.1%) | 39 (17.0%) |
| 60 to 89 Minutes | 53 (16.5%) | 0 (0.0%) |
| 90 or more Minutes | 24 (7.4%) | 0 (0.0%) |
Time of Departure to Work by Sex in Fort Denaud
The most frequent times of departure to work in Fort Denaud are 7:00 AM to 7:29 AM (85, 26.4%) for males and 6:30 AM to 6:59 AM (65, 28.4%) for females.
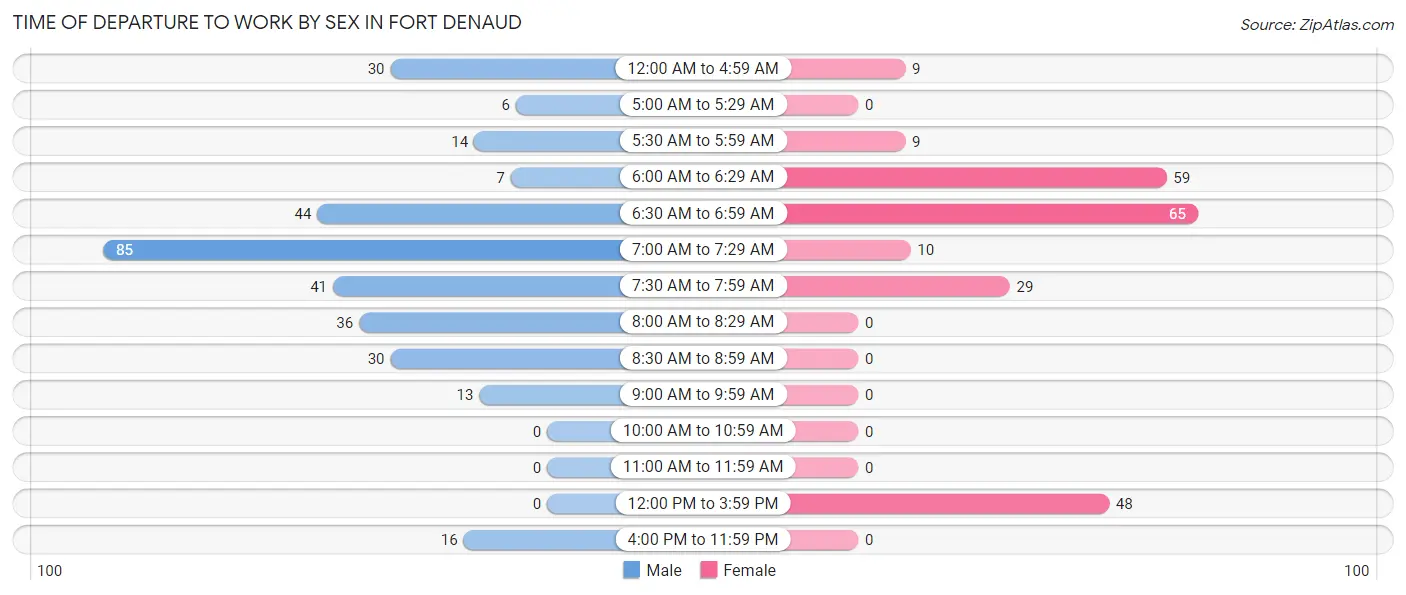
| Time of Departure | Male | Female |
| 12:00 AM to 4:59 AM | 30 (9.3%) | 9 (3.9%) |
| 5:00 AM to 5:29 AM | 6 (1.9%) | 0 (0.0%) |
| 5:30 AM to 5:59 AM | 14 (4.3%) | 9 (3.9%) |
| 6:00 AM to 6:29 AM | 7 (2.2%) | 59 (25.8%) |
| 6:30 AM to 6:59 AM | 44 (13.7%) | 65 (28.4%) |
| 7:00 AM to 7:29 AM | 85 (26.4%) | 10 (4.4%) |
| 7:30 AM to 7:59 AM | 41 (12.7%) | 29 (12.7%) |
| 8:00 AM to 8:29 AM | 36 (11.2%) | 0 (0.0%) |
| 8:30 AM to 8:59 AM | 30 (9.3%) | 0 (0.0%) |
| 9:00 AM to 9:59 AM | 13 (4.0%) | 0 (0.0%) |
| 10:00 AM to 10:59 AM | 0 (0.0%) | 0 (0.0%) |
| 11:00 AM to 11:59 AM | 0 (0.0%) | 0 (0.0%) |
| 12:00 PM to 3:59 PM | 0 (0.0%) | 48 (21.0%) |
| 4:00 PM to 11:59 PM | 16 (5.0%) | 0 (0.0%) |
| Total | 322 (100.0%) | 229 (100.0%) |
Housing Occupancy in Fort Denaud
Occupancy by Ownership in Fort Denaud
Of the total 699 dwellings in Fort Denaud, owner-occupied units account for 690 (98.7%), while renter-occupied units make up 9 (1.3%).
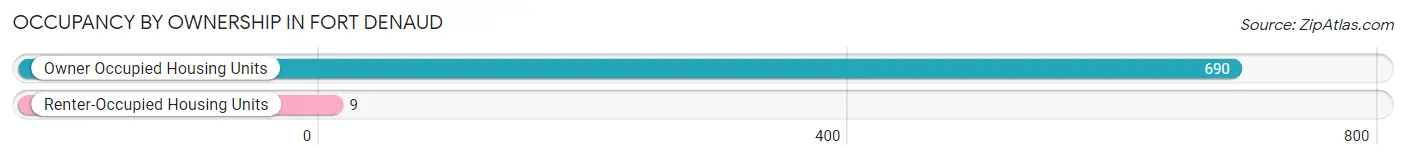
| Occupancy | # Housing Units | % Housing Units |
| Owner Occupied Housing Units | 690 | 98.7% |
| Renter-Occupied Housing Units | 9 | 1.3% |
| Total Occupied Housing Units | 699 | 100.0% |
Occupancy by Household Size in Fort Denaud
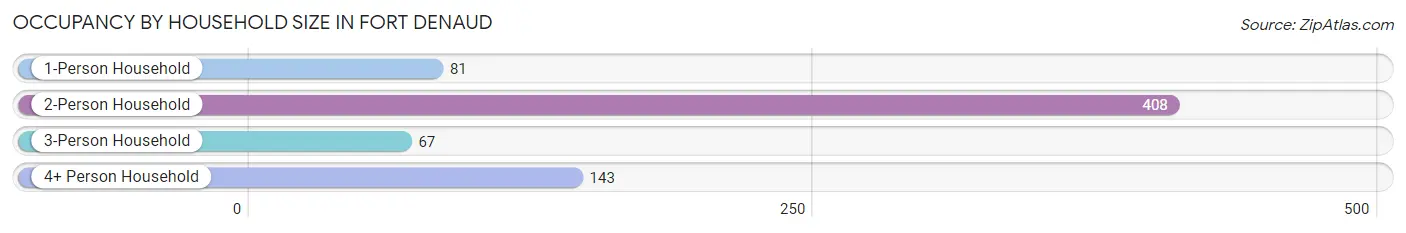
| Household Size | # Housing Units | % Housing Units |
| 1-Person Household | 81 | 11.6% |
| 2-Person Household | 408 | 58.4% |
| 3-Person Household | 67 | 9.6% |
| 4+ Person Household | 143 | 20.5% |
| Total Housing Units | 699 | 100.0% |
Occupancy by Ownership by Household Size in Fort Denaud
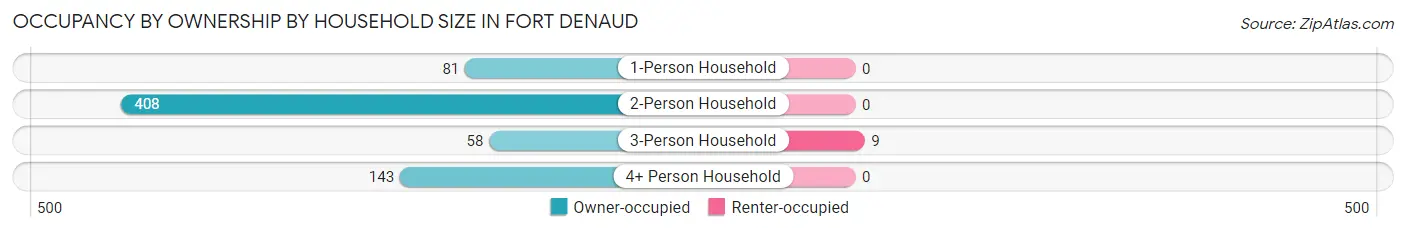
| Household Size | Owner-occupied | Renter-occupied |
| 1-Person Household | 81 (100.0%) | 0 (0.0%) |
| 2-Person Household | 408 (100.0%) | 0 (0.0%) |
| 3-Person Household | 58 (86.6%) | 9 (13.4%) |
| 4+ Person Household | 143 (100.0%) | 0 (0.0%) |
| Total Housing Units | 690 (98.7%) | 9 (1.3%) |
Occupancy by Educational Attainment in Fort Denaud
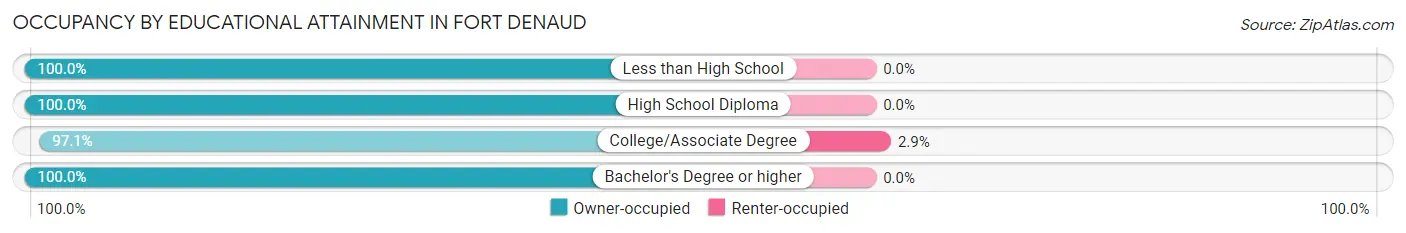
| Household Size | Owner-occupied | Renter-occupied |
| Less than High School | 48 (100.0%) | 0 (0.0%) |
| High School Diploma | 214 (100.0%) | 0 (0.0%) |
| College/Associate Degree | 297 (97.1%) | 9 (2.9%) |
| Bachelor's Degree or higher | 131 (100.0%) | 0 (0.0%) |
Occupancy by Age of Householder in Fort Denaud
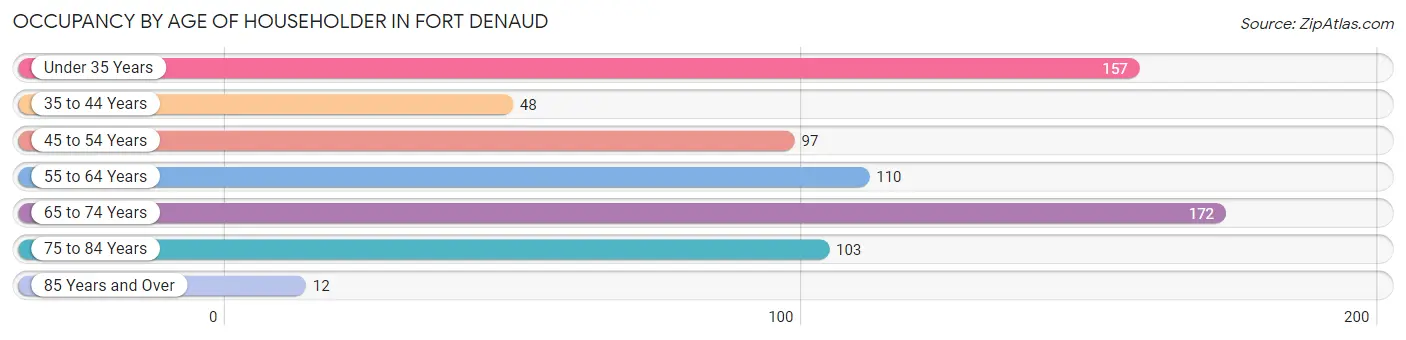
| Age Bracket | # Households | % Households |
| Under 35 Years | 157 | 22.5% |
| 35 to 44 Years | 48 | 6.9% |
| 45 to 54 Years | 97 | 13.9% |
| 55 to 64 Years | 110 | 15.7% |
| 65 to 74 Years | 172 | 24.6% |
| 75 to 84 Years | 103 | 14.7% |
| 85 Years and Over | 12 | 1.7% |
| Total | 699 | 100.0% |
Housing Finances in Fort Denaud
Median Income by Occupancy in Fort Denaud
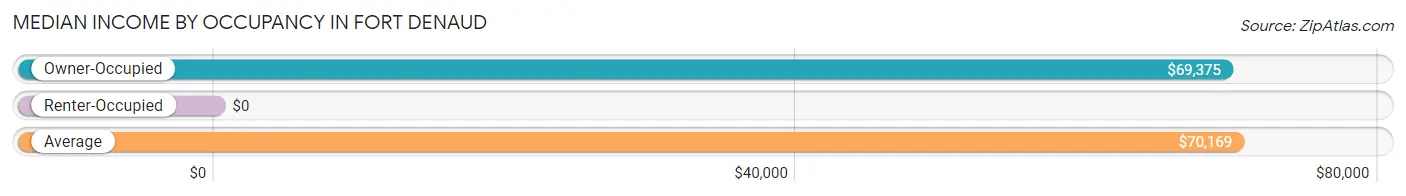
| Occupancy Type | # Households | Median Income |
| Owner-Occupied | 690 (98.7%) | $69,375 |
| Renter-Occupied | 9 (1.3%) | $0 |
| Average | 699 (100.0%) | $70,169 |
Occupancy by Householder Income Bracket in Fort Denaud
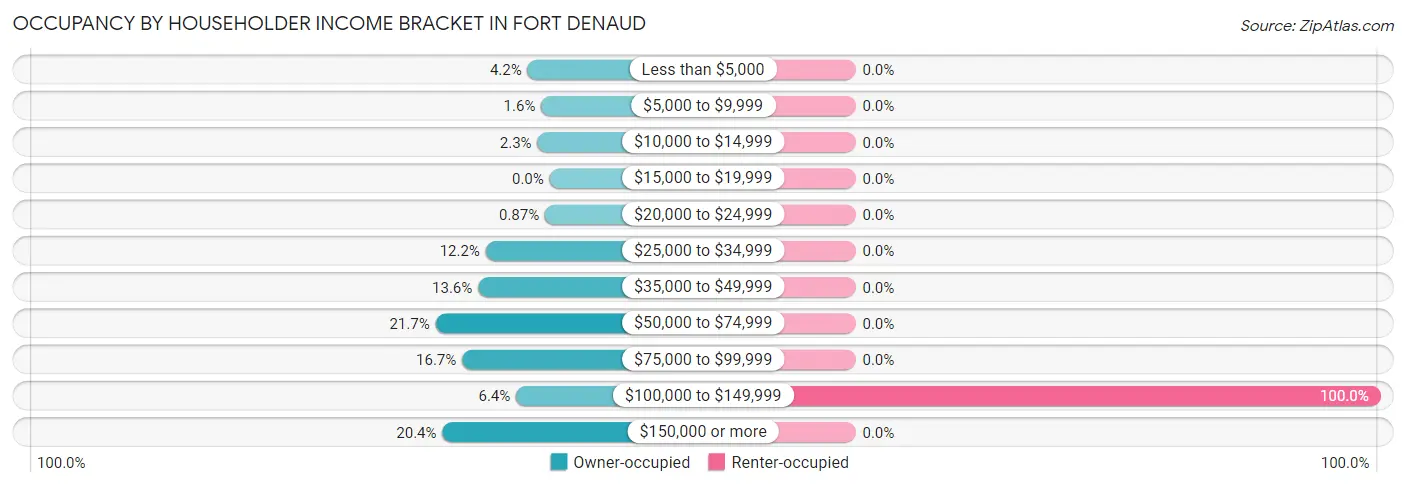
| Income Bracket | Owner-occupied | Renter-occupied |
| Less than $5,000 | 29 (4.2%) | 0 (0.0%) |
| $5,000 to $9,999 | 11 (1.6%) | 0 (0.0%) |
| $10,000 to $14,999 | 16 (2.3%) | 0 (0.0%) |
| $15,000 to $19,999 | 0 (0.0%) | 0 (0.0%) |
| $20,000 to $24,999 | 6 (0.9%) | 0 (0.0%) |
| $25,000 to $34,999 | 84 (12.2%) | 0 (0.0%) |
| $35,000 to $49,999 | 94 (13.6%) | 0 (0.0%) |
| $50,000 to $74,999 | 150 (21.7%) | 0 (0.0%) |
| $75,000 to $99,999 | 115 (16.7%) | 0 (0.0%) |
| $100,000 to $149,999 | 44 (6.4%) | 9 (100.0%) |
| $150,000 or more | 141 (20.4%) | 0 (0.0%) |
| Total | 690 (100.0%) | 9 (100.0%) |
Monthly Housing Cost Tiers in Fort Denaud
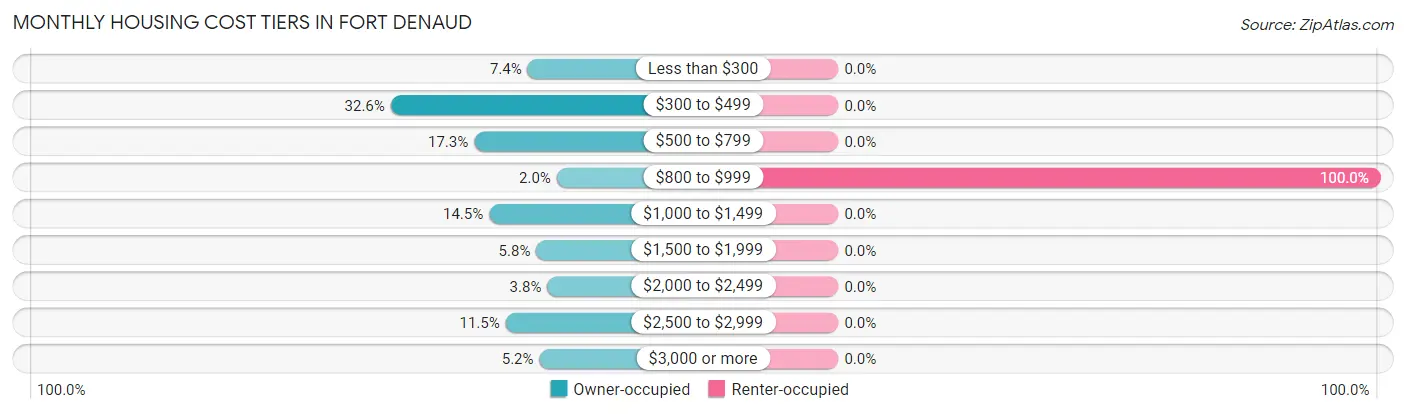
| Monthly Cost | Owner-occupied | Renter-occupied |
| Less than $300 | 51 (7.4%) | 0 (0.0%) |
| $300 to $499 | 225 (32.6%) | 0 (0.0%) |
| $500 to $799 | 119 (17.2%) | 0 (0.0%) |
| $800 to $999 | 14 (2.0%) | 9 (100.0%) |
| $1,000 to $1,499 | 100 (14.5%) | 0 (0.0%) |
| $1,500 to $1,999 | 40 (5.8%) | 0 (0.0%) |
| $2,000 to $2,499 | 26 (3.8%) | 0 (0.0%) |
| $2,500 to $2,999 | 79 (11.5%) | 0 (0.0%) |
| $3,000 or more | 36 (5.2%) | 0 (0.0%) |
| Total | 690 (100.0%) | 9 (100.0%) |
Physical Housing Characteristics in Fort Denaud
Housing Structures in Fort Denaud
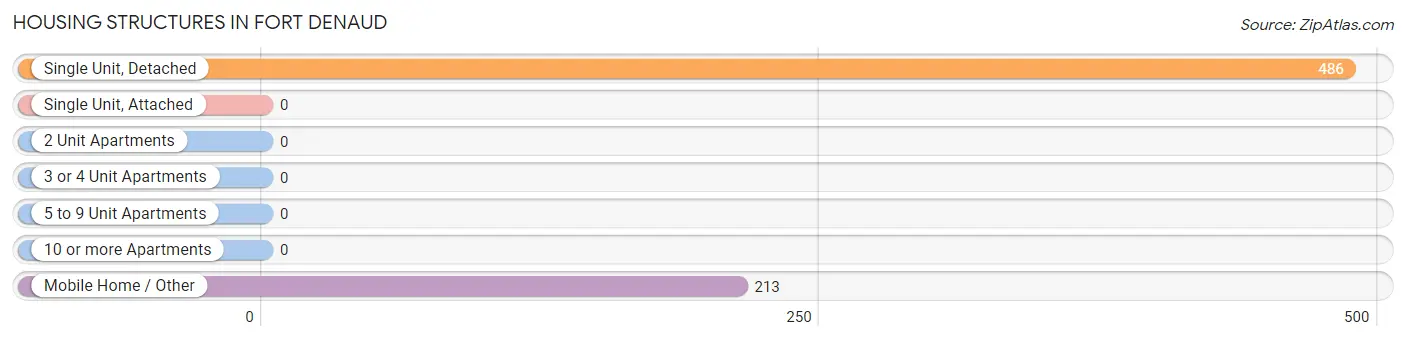
| Structure Type | # Housing Units | % Housing Units |
| Single Unit, Detached | 486 | 69.5% |
| Single Unit, Attached | 0 | 0.0% |
| 2 Unit Apartments | 0 | 0.0% |
| 3 or 4 Unit Apartments | 0 | 0.0% |
| 5 to 9 Unit Apartments | 0 | 0.0% |
| 10 or more Apartments | 0 | 0.0% |
| Mobile Home / Other | 213 | 30.5% |
| Total | 699 | 100.0% |
Housing Structures by Occupancy in Fort Denaud
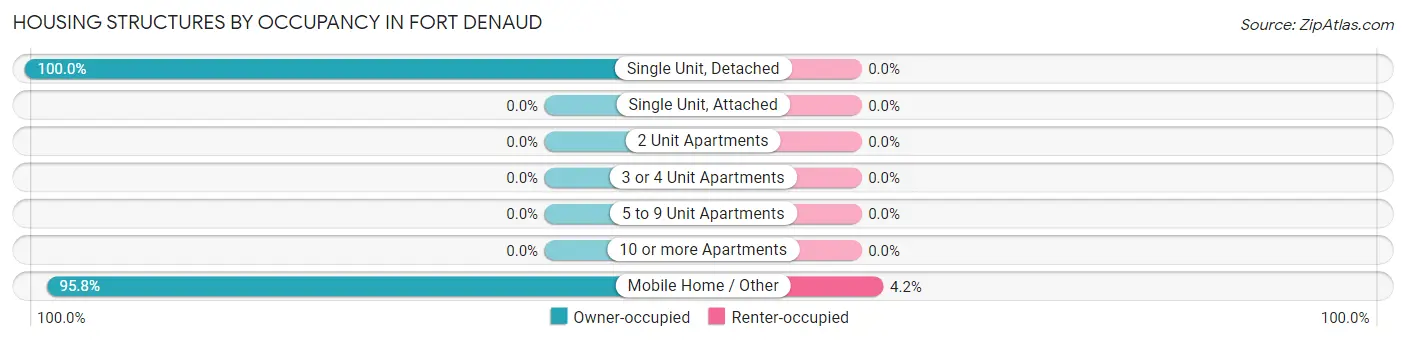
| Structure Type | Owner-occupied | Renter-occupied |
| Single Unit, Detached | 486 (100.0%) | 0 (0.0%) |
| Single Unit, Attached | 0 (0.0%) | 0 (0.0%) |
| 2 Unit Apartments | 0 (0.0%) | 0 (0.0%) |
| 3 or 4 Unit Apartments | 0 (0.0%) | 0 (0.0%) |
| 5 to 9 Unit Apartments | 0 (0.0%) | 0 (0.0%) |
| 10 or more Apartments | 0 (0.0%) | 0 (0.0%) |
| Mobile Home / Other | 204 (95.8%) | 9 (4.2%) |
| Total | 690 (98.7%) | 9 (1.3%) |
Housing Structures by Number of Rooms in Fort Denaud
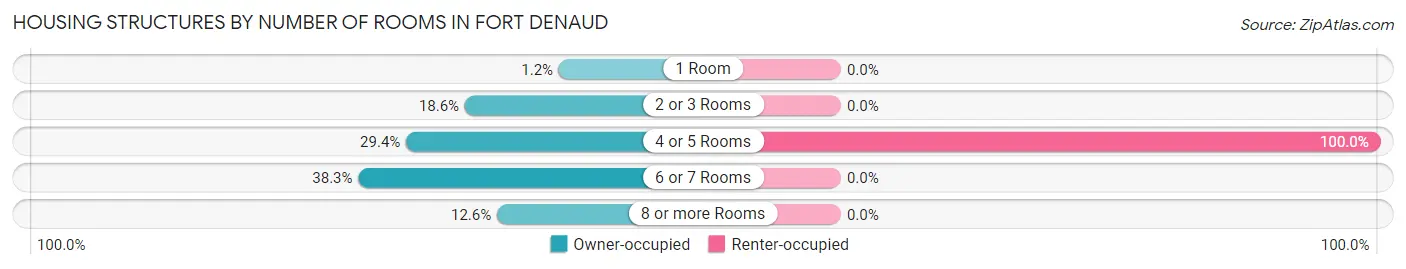
| Number of Rooms | Owner-occupied | Renter-occupied |
| 1 Room | 8 (1.2%) | 0 (0.0%) |
| 2 or 3 Rooms | 128 (18.5%) | 0 (0.0%) |
| 4 or 5 Rooms | 203 (29.4%) | 9 (100.0%) |
| 6 or 7 Rooms | 264 (38.3%) | 0 (0.0%) |
| 8 or more Rooms | 87 (12.6%) | 0 (0.0%) |
| Total | 690 (100.0%) | 9 (100.0%) |
Housing Structure by Heating Type in Fort Denaud
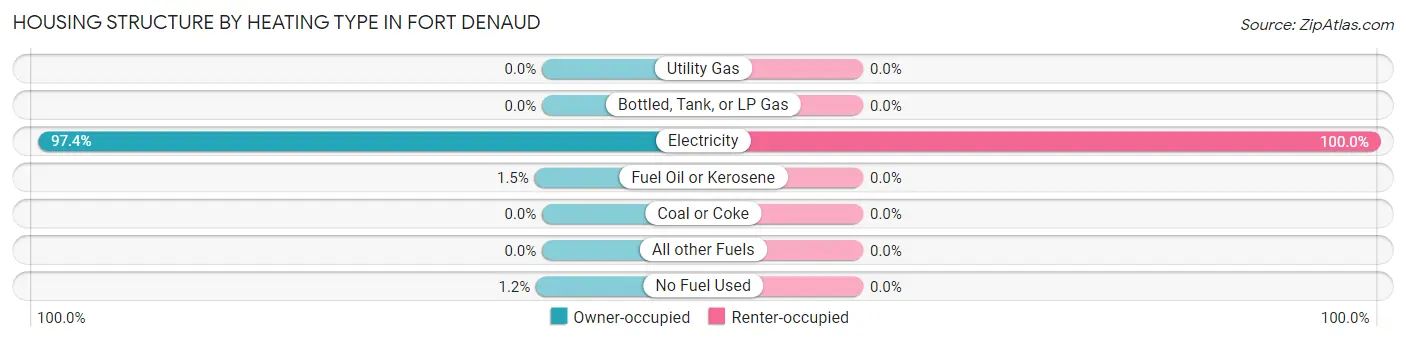
| Heating Type | Owner-occupied | Renter-occupied |
| Utility Gas | 0 (0.0%) | 0 (0.0%) |
| Bottled, Tank, or LP Gas | 0 (0.0%) | 0 (0.0%) |
| Electricity | 672 (97.4%) | 9 (100.0%) |
| Fuel Oil or Kerosene | 10 (1.5%) | 0 (0.0%) |
| Coal or Coke | 0 (0.0%) | 0 (0.0%) |
| All other Fuels | 0 (0.0%) | 0 (0.0%) |
| No Fuel Used | 8 (1.2%) | 0 (0.0%) |
| Total | 690 (100.0%) | 9 (100.0%) |
Household Vehicle Usage in Fort Denaud
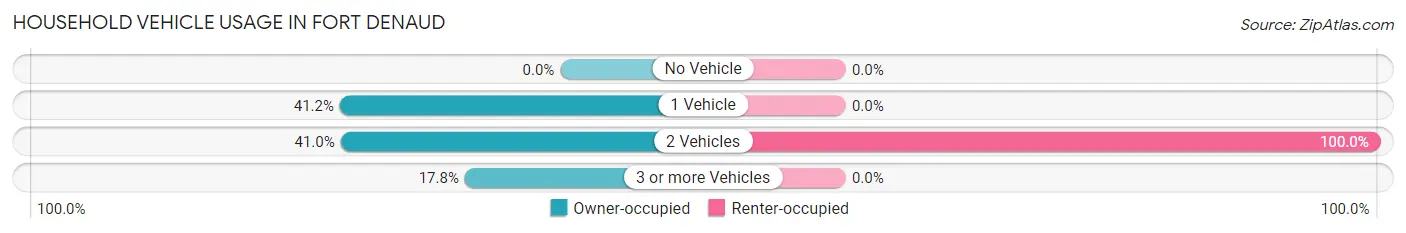
| Vehicles per Household | Owner-occupied | Renter-occupied |
| No Vehicle | 0 (0.0%) | 0 (0.0%) |
| 1 Vehicle | 284 (41.2%) | 0 (0.0%) |
| 2 Vehicles | 283 (41.0%) | 9 (100.0%) |
| 3 or more Vehicles | 123 (17.8%) | 0 (0.0%) |
| Total | 690 (100.0%) | 9 (100.0%) |
Real Estate & Mortgages in Fort Denaud
Real Estate and Mortgage Overview in Fort Denaud
| Characteristic | Without Mortgage | With Mortgage |
| Housing Units | 372 | 318 |
| Median Property Value | $226,500 | $368,800 |
| Median Household Income | $53,308 | $102 |
| Monthly Housing Costs | $445 | $36 |
| Real Estate Taxes | $2,236 | $28 |
Property Value by Mortgage Status in Fort Denaud
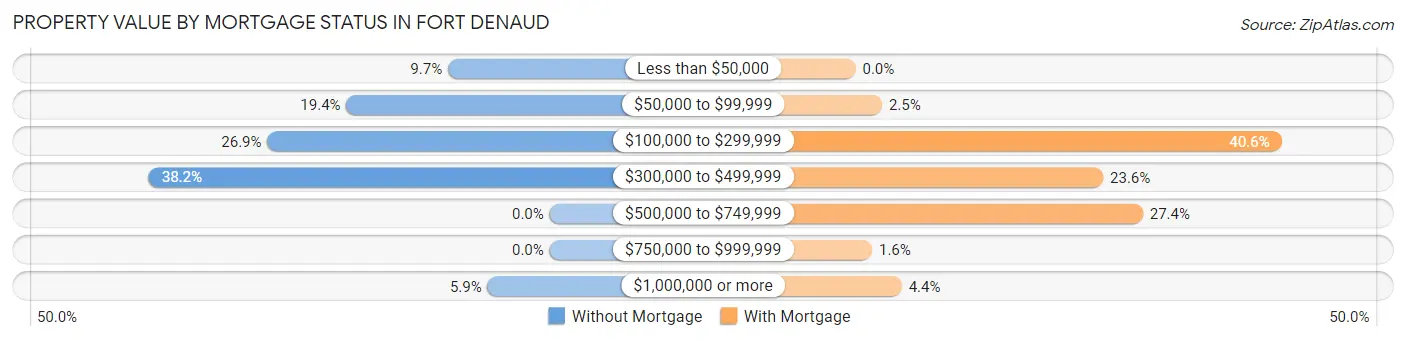
| Property Value | Without Mortgage | With Mortgage |
| Less than $50,000 | 36 (9.7%) | 0 (0.0%) |
| $50,000 to $99,999 | 72 (19.4%) | 8 (2.5%) |
| $100,000 to $299,999 | 100 (26.9%) | 129 (40.6%) |
| $300,000 to $499,999 | 142 (38.2%) | 75 (23.6%) |
| $500,000 to $749,999 | 0 (0.0%) | 87 (27.4%) |
| $750,000 to $999,999 | 0 (0.0%) | 5 (1.6%) |
| $1,000,000 or more | 22 (5.9%) | 14 (4.4%) |
| Total | 372 (100.0%) | 318 (100.0%) |
Household Income by Mortgage Status in Fort Denaud
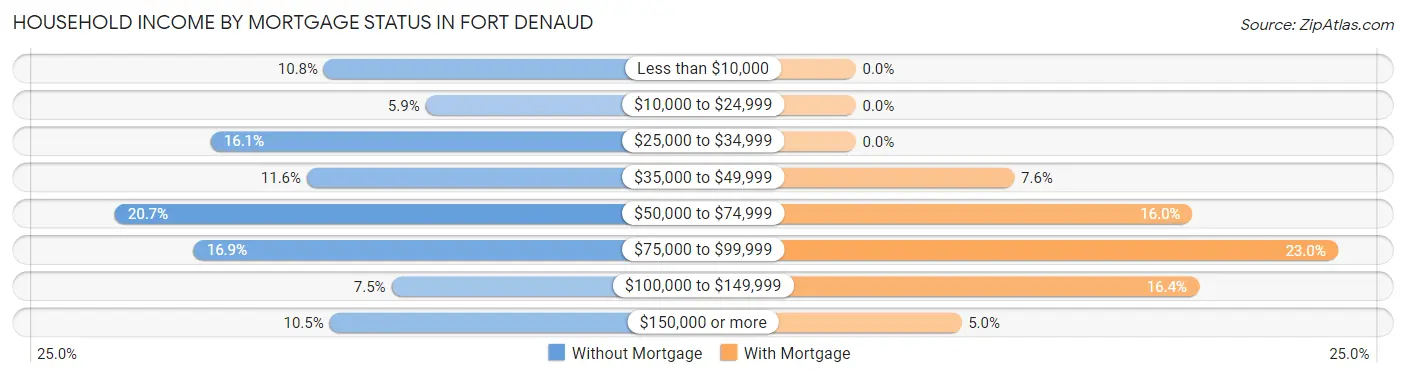
| Household Income | Without Mortgage | With Mortgage |
| Less than $10,000 | 40 (10.7%) | 0 (0.0%) |
| $10,000 to $24,999 | 22 (5.9%) | 0 (0.0%) |
| $25,000 to $34,999 | 60 (16.1%) | 0 (0.0%) |
| $35,000 to $49,999 | 43 (11.6%) | 24 (7.5%) |
| $50,000 to $74,999 | 77 (20.7%) | 51 (16.0%) |
| $75,000 to $99,999 | 63 (16.9%) | 73 (23.0%) |
| $100,000 to $149,999 | 28 (7.5%) | 52 (16.4%) |
| $150,000 or more | 39 (10.5%) | 16 (5.0%) |
| Total | 372 (100.0%) | 318 (100.0%) |
Property Value to Household Income Ratio in Fort Denaud
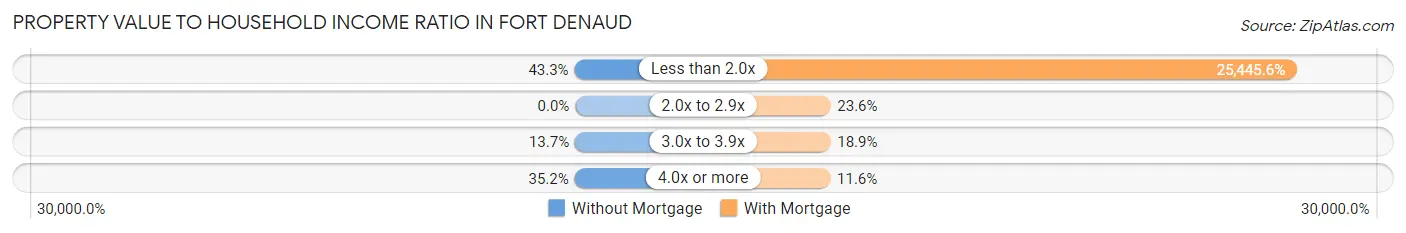
| Value-to-Income Ratio | Without Mortgage | With Mortgage |
| Less than 2.0x | 161 (43.3%) | 80,917 (25,445.6%) |
| 2.0x to 2.9x | 0 (0.0%) | 75 (23.6%) |
| 3.0x to 3.9x | 51 (13.7%) | 60 (18.9%) |
| 4.0x or more | 131 (35.2%) | 37 (11.6%) |
| Total | 372 (100.0%) | 318 (100.0%) |
Real Estate Taxes by Mortgage Status in Fort Denaud
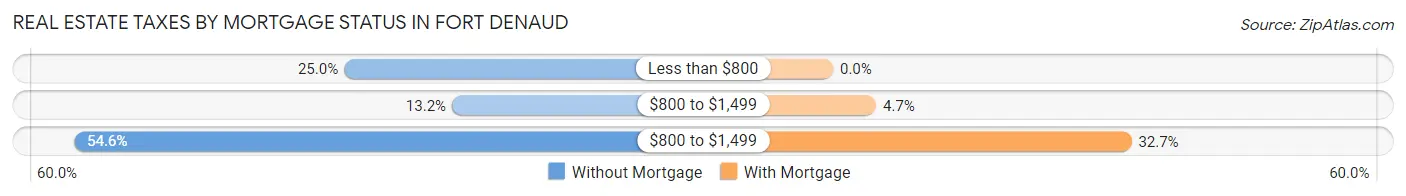
| Property Taxes | Without Mortgage | With Mortgage |
| Less than $800 | 93 (25.0%) | 0 (0.0%) |
| $800 to $1,499 | 49 (13.2%) | 15 (4.7%) |
| $800 to $1,499 | 203 (54.6%) | 104 (32.7%) |
| Total | 372 (100.0%) | 318 (100.0%) |
Health & Disability in Fort Denaud
Health Insurance Coverage by Age in Fort Denaud
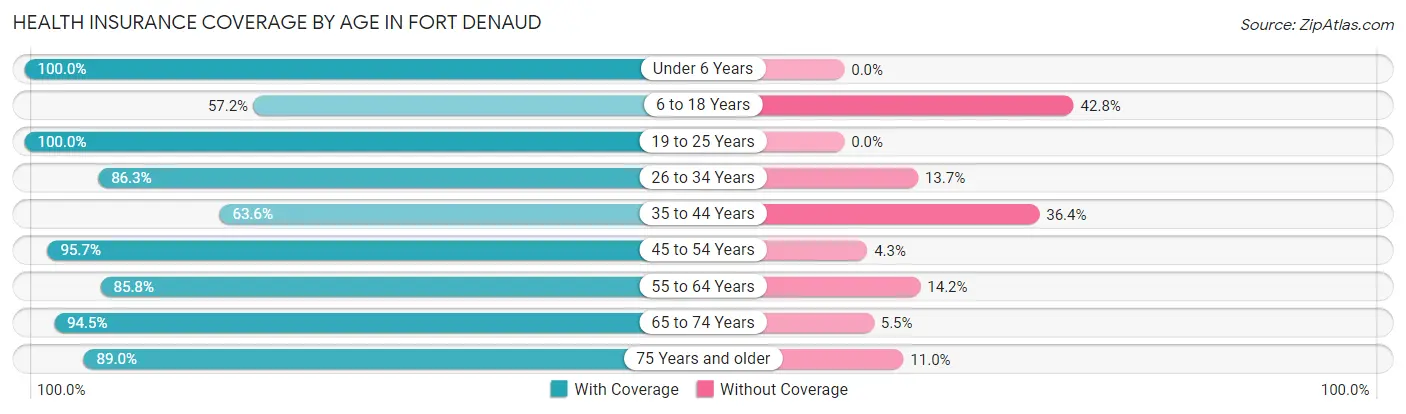
| Age Bracket | With Coverage | Without Coverage |
| Under 6 Years | 62 (100.0%) | 0 (0.0%) |
| 6 to 18 Years | 91 (57.2%) | 68 (42.8%) |
| 19 to 25 Years | 30 (100.0%) | 0 (0.0%) |
| 26 to 34 Years | 182 (86.3%) | 29 (13.7%) |
| 35 to 44 Years | 140 (63.6%) | 80 (36.4%) |
| 45 to 54 Years | 157 (95.7%) | 7 (4.3%) |
| 55 to 64 Years | 224 (85.8%) | 37 (14.2%) |
| 65 to 74 Years | 292 (94.5%) | 17 (5.5%) |
| 75 Years and older | 210 (89.0%) | 26 (11.0%) |
| Total | 1,388 (84.0%) | 264 (16.0%) |
Health Insurance Coverage by Citizenship Status in Fort Denaud
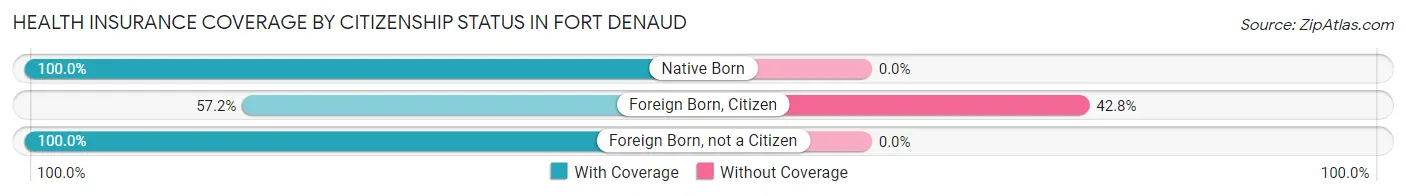
| Citizenship Status | With Coverage | Without Coverage |
| Native Born | 62 (100.0%) | 0 (0.0%) |
| Foreign Born, Citizen | 91 (57.2%) | 68 (42.8%) |
| Foreign Born, not a Citizen | 30 (100.0%) | 0 (0.0%) |
Health Insurance Coverage by Household Income in Fort Denaud
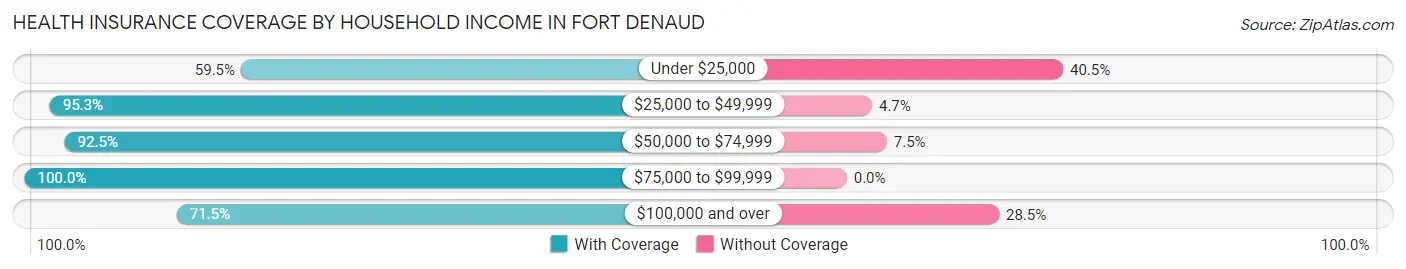
| Household Income | With Coverage | Without Coverage |
| Under $25,000 | 69 (59.5%) | 47 (40.5%) |
| $25,000 to $49,999 | 322 (95.3%) | 16 (4.7%) |
| $50,000 to $74,999 | 345 (92.5%) | 28 (7.5%) |
| $75,000 to $99,999 | 251 (100.0%) | 0 (0.0%) |
| $100,000 and over | 401 (71.5%) | 160 (28.5%) |
Public vs Private Health Insurance Coverage by Age in Fort Denaud
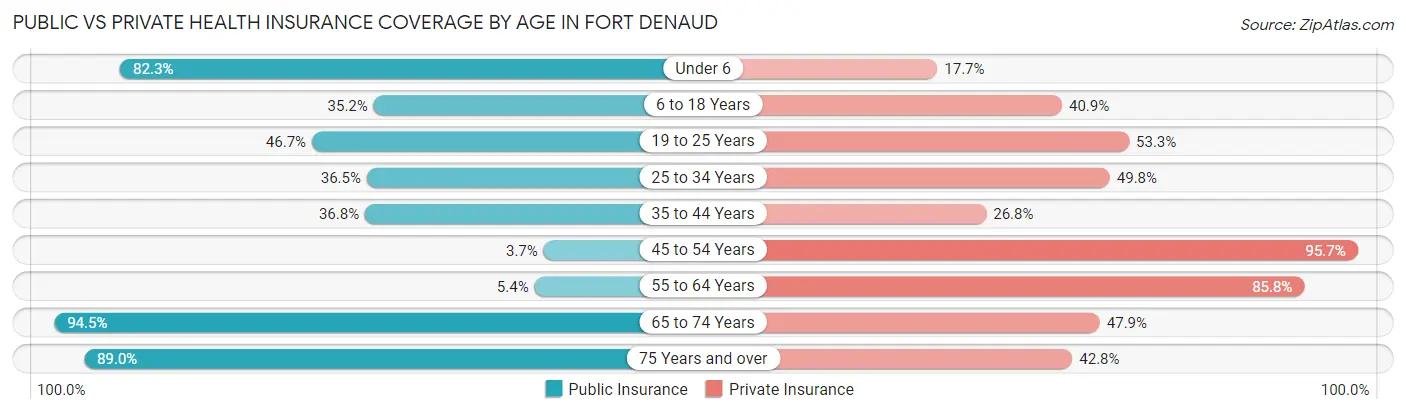
| Age Bracket | Public Insurance | Private Insurance |
| Under 6 | 51 (82.3%) | 11 (17.7%) |
| 6 to 18 Years | 56 (35.2%) | 65 (40.9%) |
| 19 to 25 Years | 14 (46.7%) | 16 (53.3%) |
| 25 to 34 Years | 77 (36.5%) | 105 (49.8%) |
| 35 to 44 Years | 81 (36.8%) | 59 (26.8%) |
| 45 to 54 Years | 6 (3.7%) | 157 (95.7%) |
| 55 to 64 Years | 14 (5.4%) | 224 (85.8%) |
| 65 to 74 Years | 292 (94.5%) | 148 (47.9%) |
| 75 Years and over | 210 (89.0%) | 101 (42.8%) |
| Total | 801 (48.5%) | 886 (53.6%) |
Disability Status by Sex by Age in Fort Denaud
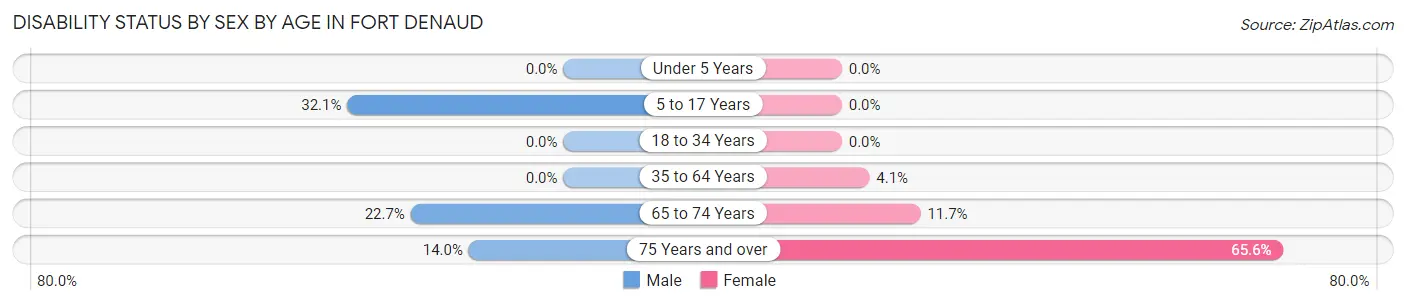
| Age Bracket | Male | Female |
| Under 5 Years | 0 (0.0%) | 0 (0.0%) |
| 5 to 17 Years | 34 (32.1%) | 0 (0.0%) |
| 18 to 34 Years | 0 (0.0%) | 0 (0.0%) |
| 35 to 64 Years | 0 (0.0%) | 13 (4.1%) |
| 65 to 74 Years | 39 (22.7%) | 16 (11.7%) |
| 75 Years and over | 16 (14.0%) | 80 (65.6%) |
Disability Class by Sex by Age in Fort Denaud
Disability Class: Hearing Difficulty
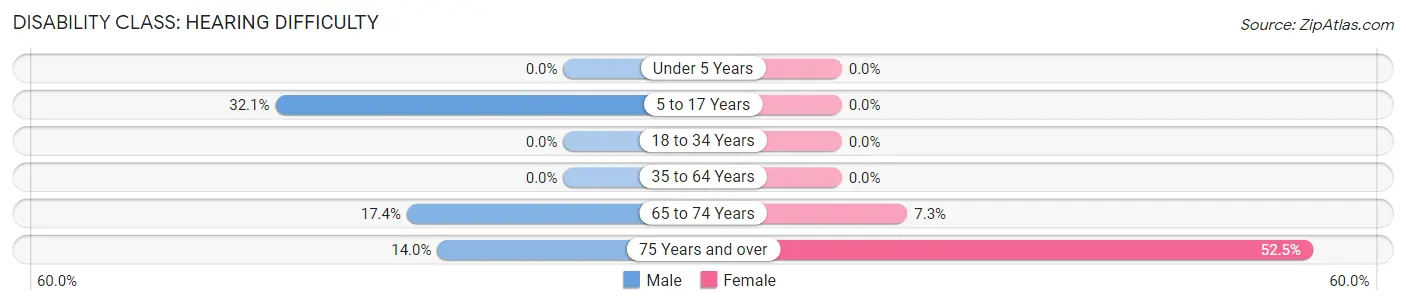
| Age Bracket | Male | Female |
| Under 5 Years | 0 (0.0%) | 0 (0.0%) |
| 5 to 17 Years | 34 (32.1%) | 0 (0.0%) |
| 18 to 34 Years | 0 (0.0%) | 0 (0.0%) |
| 35 to 64 Years | 0 (0.0%) | 0 (0.0%) |
| 65 to 74 Years | 30 (17.4%) | 10 (7.3%) |
| 75 Years and over | 16 (14.0%) | 64 (52.5%) |
Disability Class: Vision Difficulty
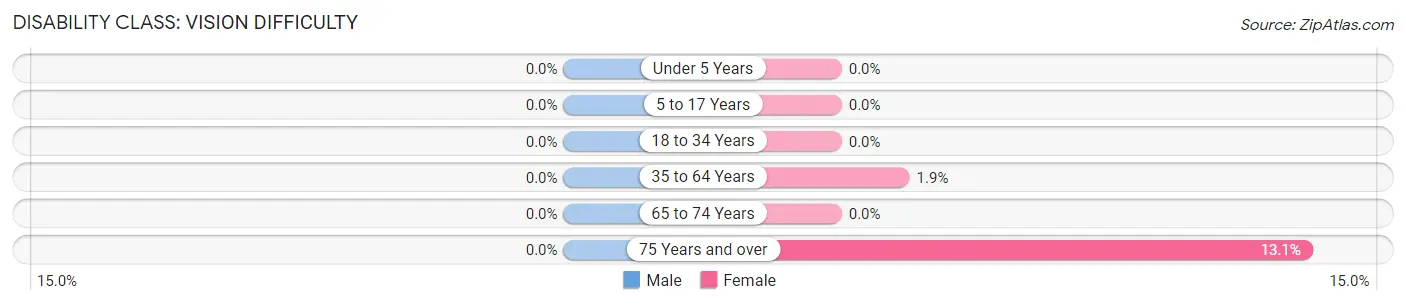
| Age Bracket | Male | Female |
| Under 5 Years | 0 (0.0%) | 0 (0.0%) |
| 5 to 17 Years | 0 (0.0%) | 0 (0.0%) |
| 18 to 34 Years | 0 (0.0%) | 0 (0.0%) |
| 35 to 64 Years | 0 (0.0%) | 6 (1.9%) |
| 65 to 74 Years | 0 (0.0%) | 0 (0.0%) |
| 75 Years and over | 0 (0.0%) | 16 (13.1%) |
Disability Class: Cognitive Difficulty
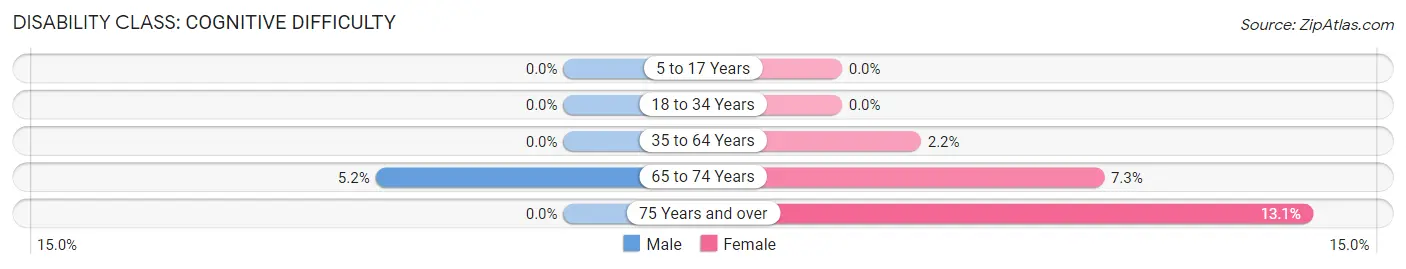
| Age Bracket | Male | Female |
| 5 to 17 Years | 0 (0.0%) | 0 (0.0%) |
| 18 to 34 Years | 0 (0.0%) | 0 (0.0%) |
| 35 to 64 Years | 0 (0.0%) | 7 (2.2%) |
| 65 to 74 Years | 9 (5.2%) | 10 (7.3%) |
| 75 Years and over | 0 (0.0%) | 16 (13.1%) |
Disability Class: Ambulatory Difficulty
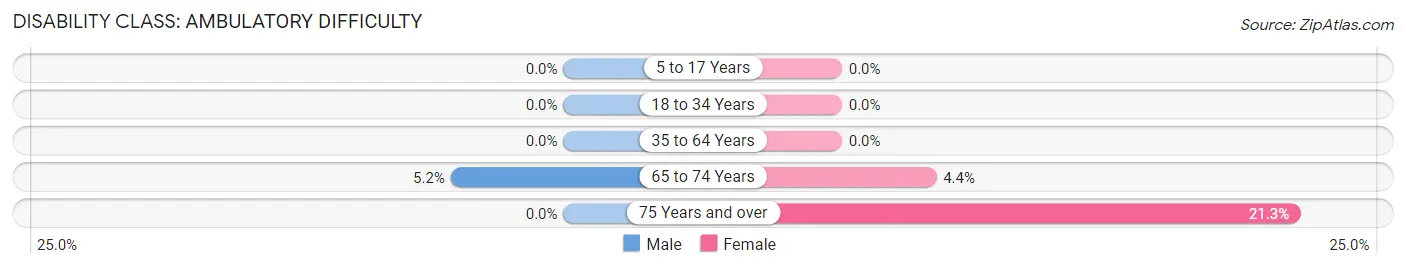
| Age Bracket | Male | Female |
| 5 to 17 Years | 0 (0.0%) | 0 (0.0%) |
| 18 to 34 Years | 0 (0.0%) | 0 (0.0%) |
| 35 to 64 Years | 0 (0.0%) | 0 (0.0%) |
| 65 to 74 Years | 9 (5.2%) | 6 (4.4%) |
| 75 Years and over | 0 (0.0%) | 26 (21.3%) |
Disability Class: Self-Care Difficulty
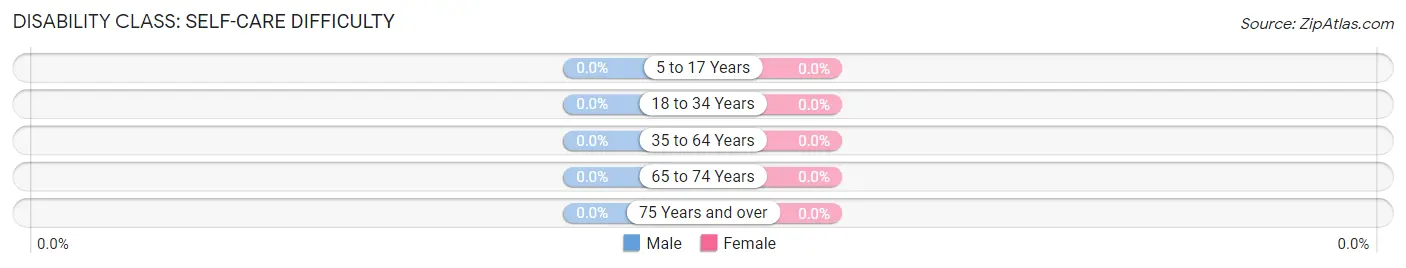
| Age Bracket | Male | Female |
| 5 to 17 Years | 0 (0.0%) | 0 (0.0%) |
| 18 to 34 Years | 0 (0.0%) | 0 (0.0%) |
| 35 to 64 Years | 0 (0.0%) | 0 (0.0%) |
| 65 to 74 Years | 0 (0.0%) | 0 (0.0%) |
| 75 Years and over | 0 (0.0%) | 0 (0.0%) |
Technology Access in Fort Denaud
Computing Device Access in Fort Denaud
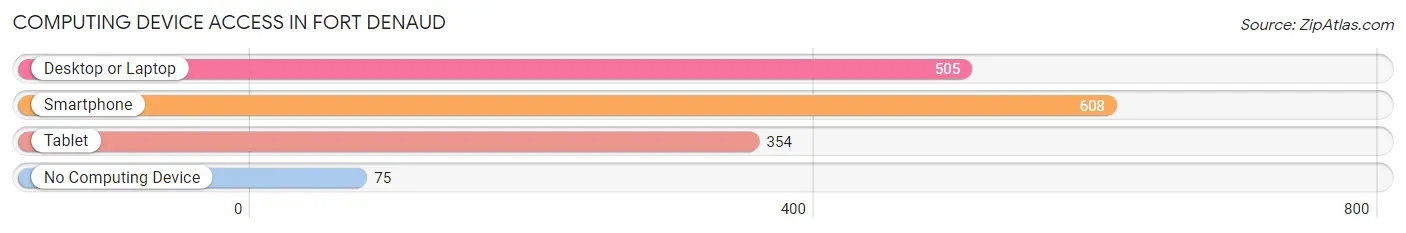
| Device Type | # Households | % Households |
| Desktop or Laptop | 505 | 72.3% |
| Smartphone | 608 | 87.0% |
| Tablet | 354 | 50.6% |
| No Computing Device | 75 | 10.7% |
| Total | 699 | 100.0% |
Internet Access in Fort Denaud
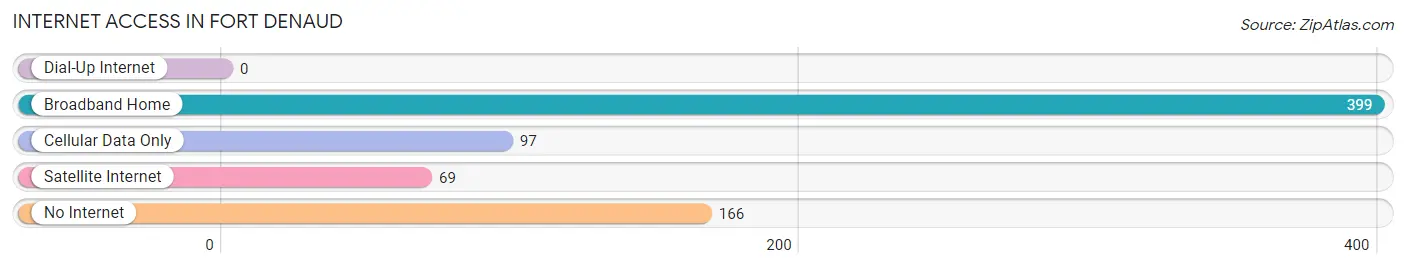
| Internet Type | # Households | % Households |
| Dial-Up Internet | 0 | 0.0% |
| Broadband Home | 399 | 57.1% |
| Cellular Data Only | 97 | 13.9% |
| Satellite Internet | 69 | 9.9% |
| No Internet | 166 | 23.7% |
| Total | 699 | 100.0% |
Fort Denaud Summary
Denaud is an unincorporated community located in Hendry County, Florida, United States. It is located on the Caloosahatchee River, about 10 miles east of LaBelle. The community is named after Fort Denaud, a fort built in 1838 by the United States Army to protect settlers from Seminole Indians.
History
The area around Fort Denaud was first inhabited by the Calusa Indians, who were the first Native American tribe to inhabit the area. The Calusa were a powerful tribe that controlled much of the area around the Caloosahatchee River. They were known for their advanced engineering skills, which they used to build large mounds and canals.
In the early 1800s, the United States government began to move into the area and establish forts to protect settlers from the Seminole Indians. Fort Denaud was one of these forts, built in 1838 by the United States Army. The fort was named after Major Charles Denaud, who was killed in the Second Seminole War.
The fort was used as a base of operations for the United States Army during the Second Seminole War. After the war, the fort was abandoned and the area around it was settled by settlers from the United States and Europe. The area became known as Denaud, and the community grew to include a post office, a school, and several stores.
Geography
Fort Denaud is located in Hendry County, Florida, about 10 miles east of LaBelle. The community is situated on the Caloosahatchee River, which is a major tributary of the Gulf of Mexico. The area around Fort Denaud is mostly flat, with some rolling hills. The soil is sandy and the climate is subtropical, with hot summers and mild winters.
Economy
The economy of Fort Denaud is largely based on agriculture. The area is known for its citrus production, with oranges, grapefruits, and tangerines being the main crops. Other crops grown in the area include sugarcane, corn, and soybeans.
The area is also home to several small businesses, including restaurants, convenience stores, and gas stations. There is also a small airport located in the area, which is used for private and commercial flights.
Demographics
As of the 2010 census, the population of Fort Denaud was 1,845. The population is mostly white, with a small Hispanic population. The median household income is $37,000, and the median home value is $125,000.
Conclusion
Fort Denaud is an unincorporated community located in Hendry County, Florida. It is located on the Caloosahatchee River, about 10 miles east of LaBelle. The community is named after Fort Denaud, a fort built in 1838 by the United States Army to protect settlers from Seminole Indians. The economy of Fort Denaud is largely based on agriculture, with citrus production being the main crop. The population of Fort Denaud is mostly white, with a small Hispanic population. The median household income is $37,000, and the median home value is $125,000.
Common Questions
What is Per Capita Income in Fort Denaud?
Per Capita income in Fort Denaud is $40,695.
What is the Median Family Income in Fort Denaud?
Median Family Income in Fort Denaud is $67,813.
What is the Median Household income in Fort Denaud?
Median Household Income in Fort Denaud is $70,169.
What is Income or Wage Gap in Fort Denaud?
Income or Wage Gap in Fort Denaud is 19.5%.
Women in Fort Denaud earn 80.5 cents for every dollar earned by a man.
What is Inequality or Gini Index in Fort Denaud?
Inequality or Gini Index in Fort Denaud is 0.46.
What is the Total Population of Fort Denaud?
Total Population of Fort Denaud is 1,652.
What is the Total Male Population of Fort Denaud?
Total Male Population of Fort Denaud is 877.
What is the Total Female Population of Fort Denaud?
Total Female Population of Fort Denaud is 775.
What is the Ratio of Males per 100 Females in Fort Denaud?
There are 113.16 Males per 100 Females in Fort Denaud.
What is the Ratio of Females per 100 Males in Fort Denaud?
There are 88.37 Females per 100 Males in Fort Denaud.
What is the Median Population Age in Fort Denaud?
Median Population Age in Fort Denaud is 54.6 Years.
What is the Average Family Size in Fort Denaud
Average Family Size in Fort Denaud is 2.5 People.
What is the Average Household Size in Fort Denaud
Average Household Size in Fort Denaud is 2.3 People.
How Large is the Labor Force in Fort Denaud?
There are 673 People in the Labor Forcein in Fort Denaud.
What is the Percentage of People in the Labor Force in Fort Denaud?
47.0% of People are in the Labor Force in Fort Denaud.