Canal Point, FL Map & Demographics
Canal Point Map
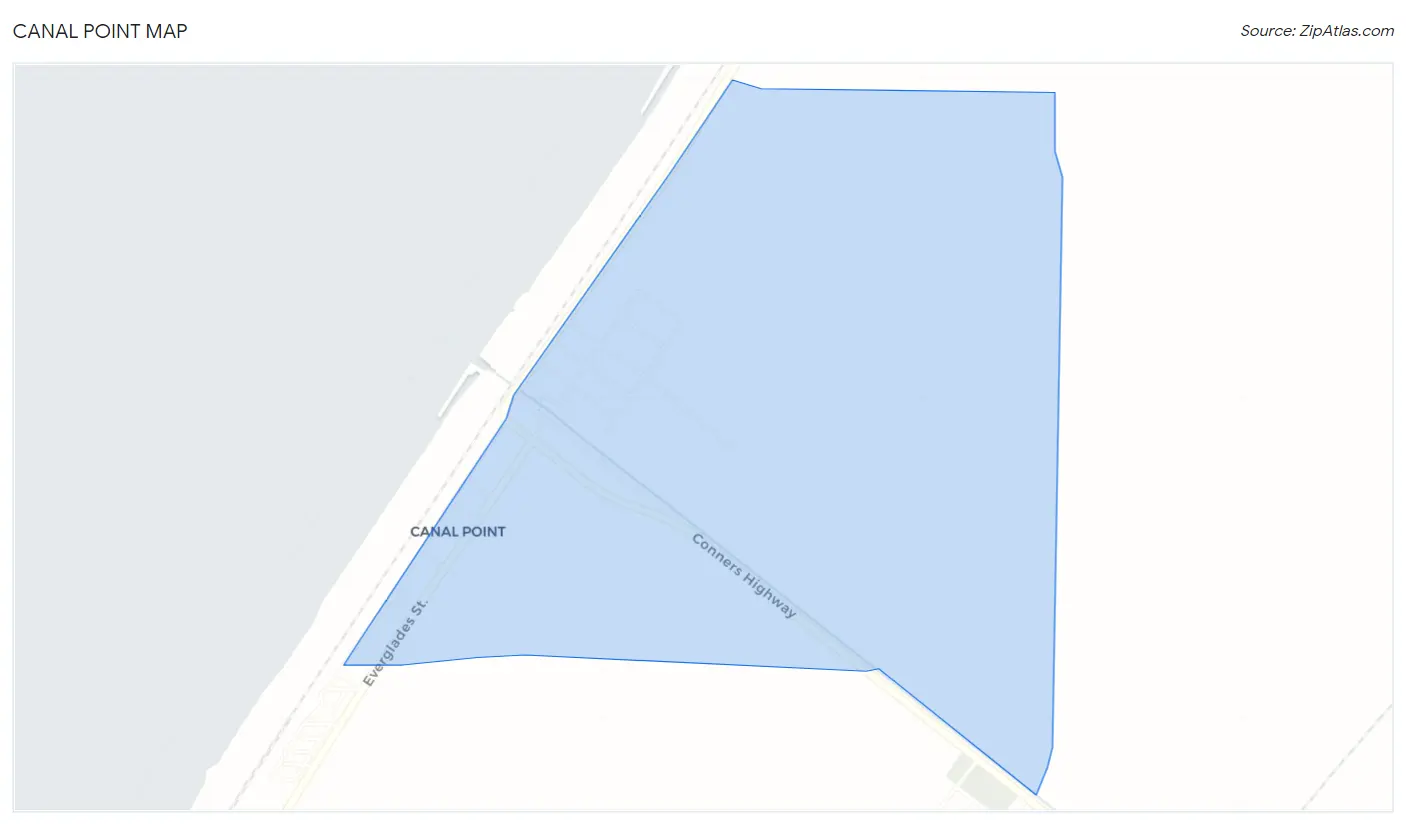
Canal Point Overview
$22,837
PER CAPITA INCOME
$103,095
AVG FAMILY INCOME
$102,679
AVG HOUSEHOLD INCOME
0.35
INEQUALITY / GINI INDEX
437
TOTAL POPULATION
206
MALE POPULATION
231
FEMALE POPULATION
89.18
MALES / 100 FEMALES
112.14
FEMALES / 100 MALES
32.9
MEDIAN AGE
4.1
AVG FAMILY SIZE
3.9
AVG HOUSEHOLD SIZE
276
LABOR FORCE [ PEOPLE ]
77.1%
PERCENT IN LABOR FORCE
14.5%
UNEMPLOYMENT RATE
Canal Point Zip Codes
Canal Point Area Codes
Income in Canal Point
Income Overview in Canal Point
Per Capita Income in Canal Point is $22,837, while median incomes of families and households are $103,095 and $102,679 respectively.
| Characteristic | Number | Measure |
| Per Capita Income | 437 | $22,837 |
| Median Family Income | 104 | $103,095 |
| Mean Family Income | 104 | $87,536 |
| Median Household Income | 111 | $102,679 |
| Mean Household Income | 111 | $84,163 |
| Income Deficit | 104 | $0 |
| Wage / Income Gap (%) | 437 | 0.00% |
| Wage / Income Gap ($) | 437 | 100.00¢ per $1 |
| Gini / Inequality Index | 437 | 0.35 |
Earnings by Sex in Canal Point
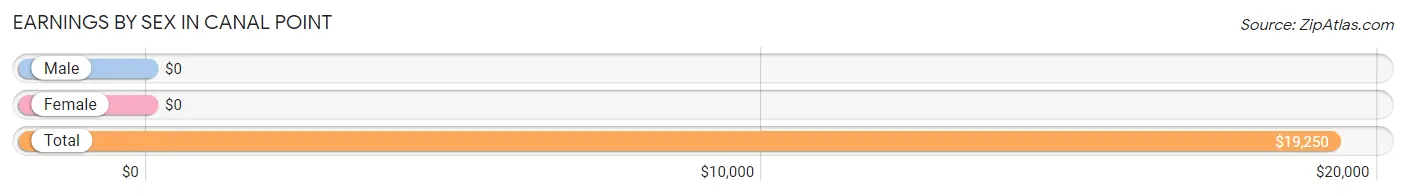
| Sex | Number | Average Earnings |
| Male | 196 (76.3%) | $0 |
| Female | 61 (23.7%) | $0 |
| Total | 257 (100.0%) | $19,250 |
Earnings by Sex by Income Bracket in Canal Point
The most common earnings brackets in Canal Point are $15,000 to $17,499 for men (43 | 21.9%) and $2,499 or less for women (21 | 34.4%).
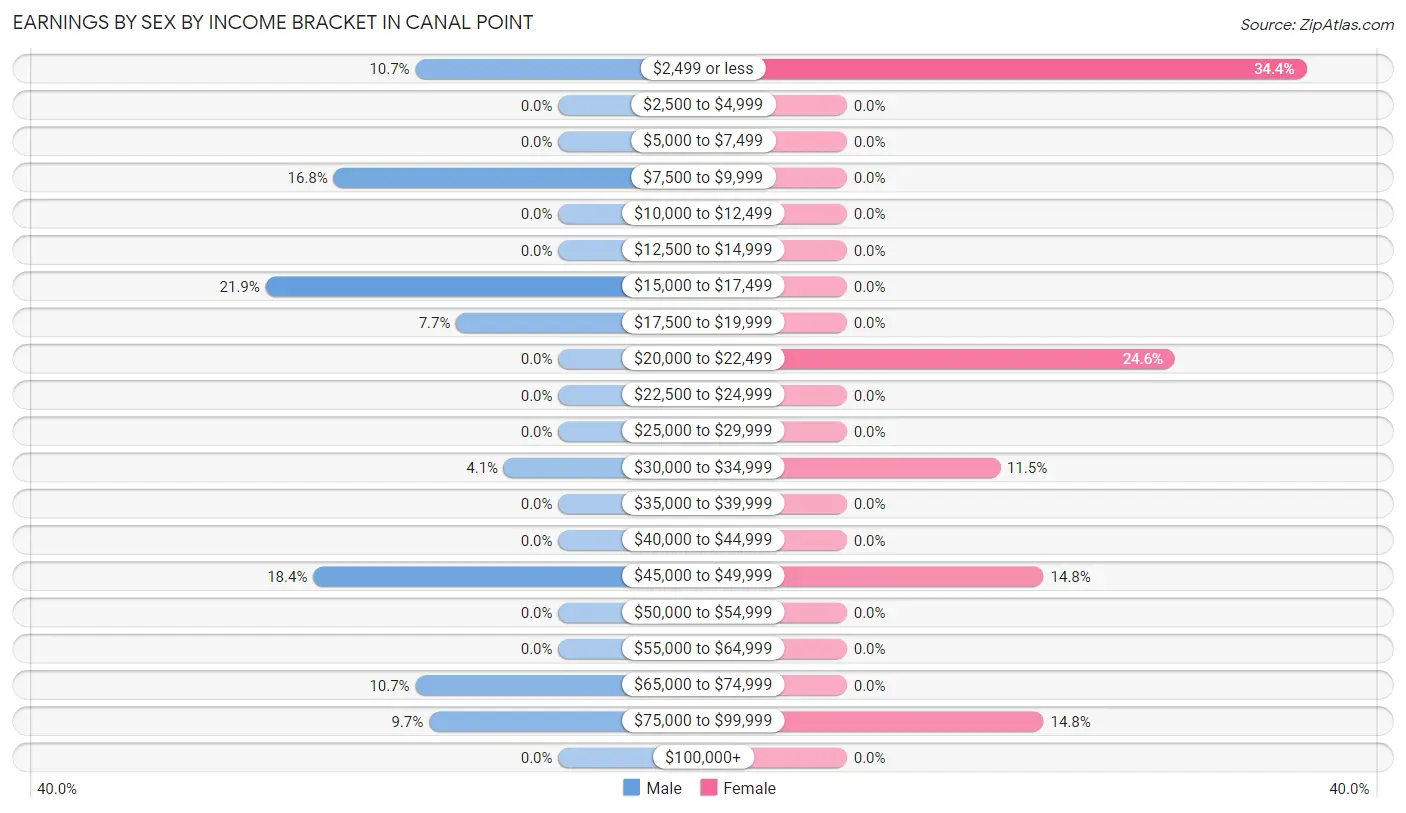
| Income | Male | Female |
| $2,499 or less | 21 (10.7%) | 21 (34.4%) |
| $2,500 to $4,999 | 0 (0.0%) | 0 (0.0%) |
| $5,000 to $7,499 | 0 (0.0%) | 0 (0.0%) |
| $7,500 to $9,999 | 33 (16.8%) | 0 (0.0%) |
| $10,000 to $12,499 | 0 (0.0%) | 0 (0.0%) |
| $12,500 to $14,999 | 0 (0.0%) | 0 (0.0%) |
| $15,000 to $17,499 | 43 (21.9%) | 0 (0.0%) |
| $17,500 to $19,999 | 15 (7.6%) | 0 (0.0%) |
| $20,000 to $22,499 | 0 (0.0%) | 15 (24.6%) |
| $22,500 to $24,999 | 0 (0.0%) | 0 (0.0%) |
| $25,000 to $29,999 | 0 (0.0%) | 0 (0.0%) |
| $30,000 to $34,999 | 8 (4.1%) | 7 (11.5%) |
| $35,000 to $39,999 | 0 (0.0%) | 0 (0.0%) |
| $40,000 to $44,999 | 0 (0.0%) | 0 (0.0%) |
| $45,000 to $49,999 | 36 (18.4%) | 9 (14.7%) |
| $50,000 to $54,999 | 0 (0.0%) | 0 (0.0%) |
| $55,000 to $64,999 | 0 (0.0%) | 0 (0.0%) |
| $65,000 to $74,999 | 21 (10.7%) | 0 (0.0%) |
| $75,000 to $99,999 | 19 (9.7%) | 9 (14.7%) |
| $100,000+ | 0 (0.0%) | 0 (0.0%) |
| Total | 196 (100.0%) | 61 (100.0%) |
Earnings by Sex by Educational Attainment in Canal Point
| Educational Attainment | Male Income | Female Income |
| Less than High School | - | - |
| High School Diploma | - | - |
| College or Associate's Degree | - | - |
| Bachelor's Degree | - | - |
| Graduate Degree | - | - |
| Total | - | - |
Family Income in Canal Point
Family Income Brackets in Canal Point
According to the Canal Point family income data, there are 38 families falling into the $100,000 to $149,999 income range, which is the most common income bracket and makes up 36.5% of all families.
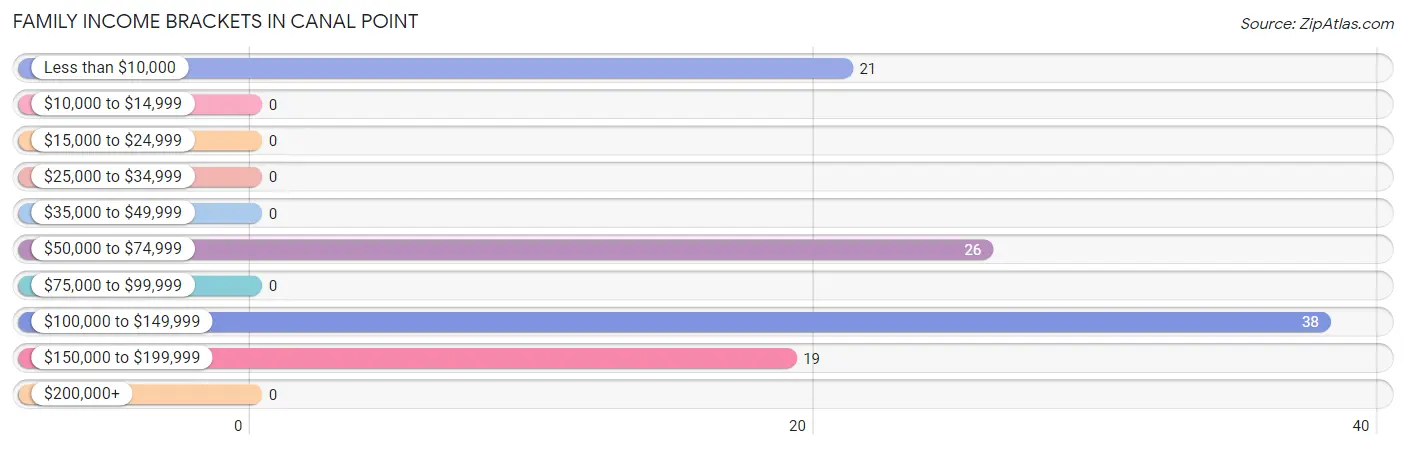
| Income Bracket | # Families | % Families |
| Less than $10,000 | 21 | 20.2% |
| $10,000 to $14,999 | 0 | 0.0% |
| $15,000 to $24,999 | 0 | 0.0% |
| $25,000 to $34,999 | 0 | 0.0% |
| $35,000 to $49,999 | 0 | 0.0% |
| $50,000 to $74,999 | 26 | 25.0% |
| $75,000 to $99,999 | 0 | 0.0% |
| $100,000 to $149,999 | 38 | 36.5% |
| $150,000 to $199,999 | 19 | 18.3% |
| $200,000+ | 0 | 0.0% |
Family Income by Famaliy Size in Canal Point
| Income Bracket | # Families | Median Income |
| 2-Person Families | 40 (38.5%) | $0 |
| 3-Person Families | 9 (8.6%) | $0 |
| 4-Person Families | 29 (27.9%) | $0 |
| 5-Person Families | 0 (0.0%) | $0 |
| 6-Person Families | 26 (25.0%) | $0 |
| 7+ Person Families | 0 (0.0%) | $0 |
| Total | 104 (100.0%) | $103,095 |
Family Income by Number of Earners in Canal Point
| Number of Earners | # Families | Median Income |
| No Earners | 0 (0.0%) | $0 |
| 1 Earner | 40 (38.5%) | $0 |
| 2 Earners | 30 (28.8%) | $0 |
| 3+ Earners | 34 (32.7%) | $0 |
| Total | 104 (100.0%) | $103,095 |
Household Income in Canal Point
Household Income Brackets in Canal Point
With 38 households falling in the category, the $100,000 to $149,999 income range is the most frequent in Canal Point, accounting for 34.2% of all households.
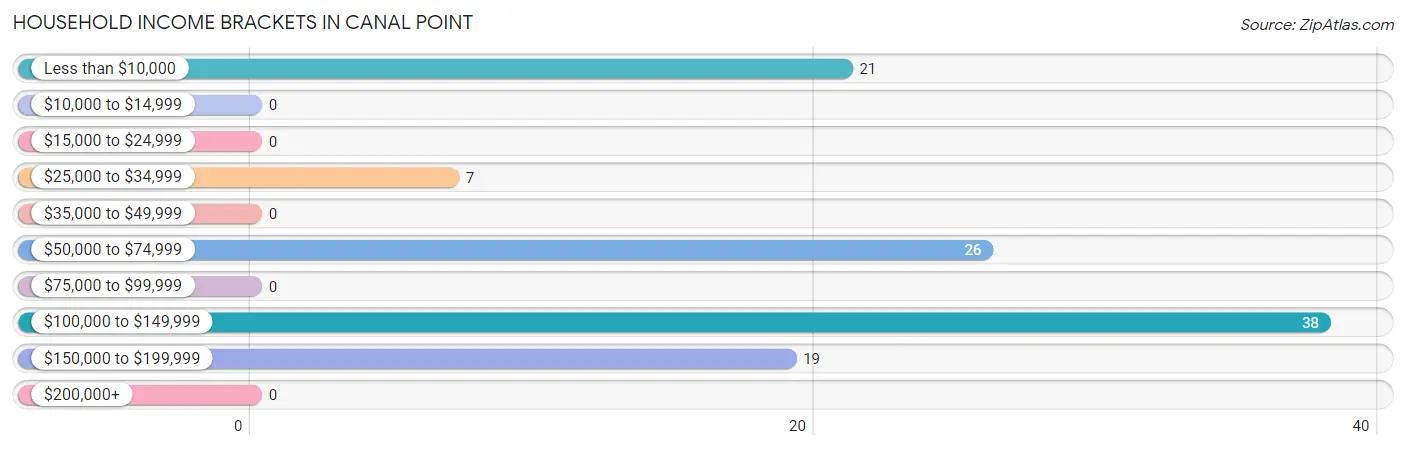
| Income Bracket | # Households | % Households |
| Less than $10,000 | 21 | 18.9% |
| $10,000 to $14,999 | 0 | 0.0% |
| $15,000 to $24,999 | 0 | 0.0% |
| $25,000 to $34,999 | 7 | 6.3% |
| $35,000 to $49,999 | 0 | 0.0% |
| $50,000 to $74,999 | 26 | 23.4% |
| $75,000 to $99,999 | 0 | 0.0% |
| $100,000 to $149,999 | 38 | 34.2% |
| $150,000 to $199,999 | 19 | 17.1% |
| $200,000+ | 0 | 0.0% |
Household Income by Householder Age in Canal Point
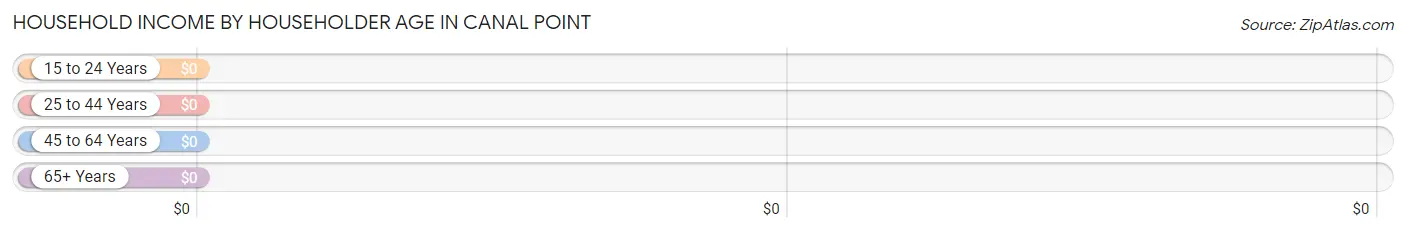
| Income Bracket | # Households | Median Income |
| 15 to 24 Years | 0 (0.0%) | $0 |
| 25 to 44 Years | 63 (56.8%) | $0 |
| 45 to 64 Years | 29 (26.1%) | $0 |
| 65+ Years | 19 (17.1%) | $0 |
| Total | 111 (100.0%) | $102,679 |
Poverty in Canal Point
Income Below Poverty by Sex and Age in Canal Point
With 10.2% poverty level for males and 25.5% for females among the residents of Canal Point, 25 to 34 year old males and under 5 year old females are the most vulnerable to poverty, with 21 males (33.9%) and 23 females (100.0%) in their respective age groups living below the poverty level.
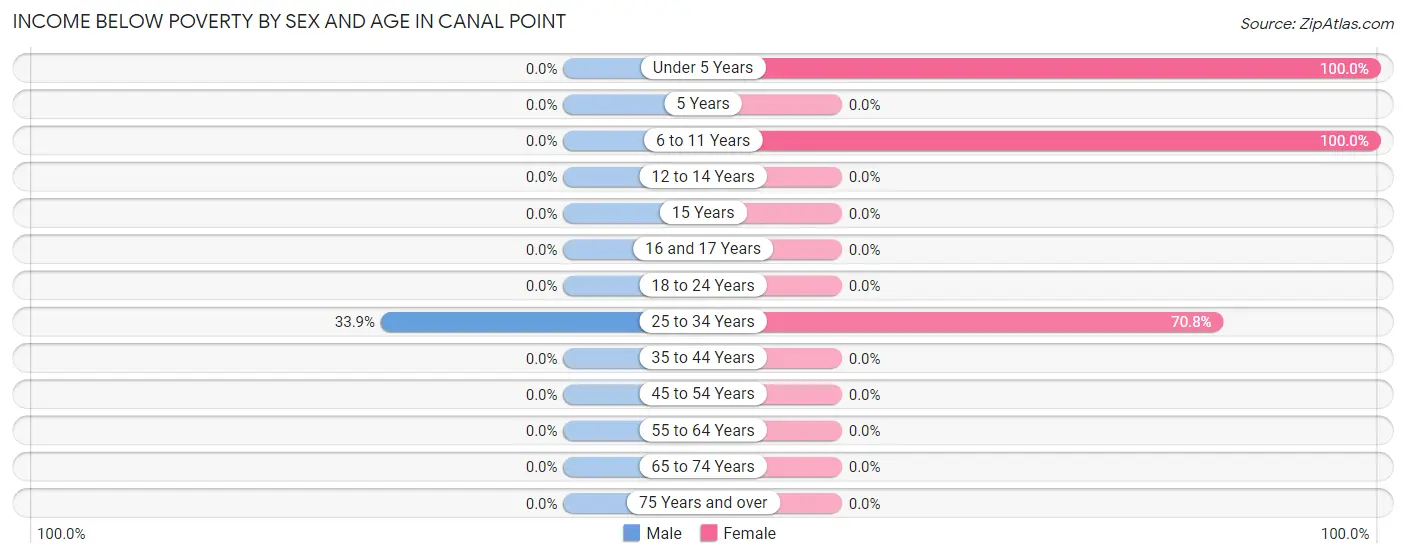
| Age Bracket | Male | Female |
| Under 5 Years | 0 (0.0%) | 23 (100.0%) |
| 5 Years | 0 (0.0%) | 0 (0.0%) |
| 6 to 11 Years | 0 (0.0%) | 19 (100.0%) |
| 12 to 14 Years | 0 (0.0%) | 0 (0.0%) |
| 15 Years | 0 (0.0%) | 0 (0.0%) |
| 16 and 17 Years | 0 (0.0%) | 0 (0.0%) |
| 18 to 24 Years | 0 (0.0%) | 0 (0.0%) |
| 25 to 34 Years | 21 (33.9%) | 17 (70.8%) |
| 35 to 44 Years | 0 (0.0%) | 0 (0.0%) |
| 45 to 54 Years | 0 (0.0%) | 0 (0.0%) |
| 55 to 64 Years | 0 (0.0%) | 0 (0.0%) |
| 65 to 74 Years | 0 (0.0%) | 0 (0.0%) |
| 75 Years and over | 0 (0.0%) | 0 (0.0%) |
| Total | 21 (10.2%) | 59 (25.5%) |
Income Above Poverty by Sex and Age in Canal Point
According to the poverty statistics in Canal Point, males aged 6 to 11 years and females aged 12 to 14 years are the age groups that are most secure financially, with 100.0% of males and 100.0% of females in these age groups living above the poverty line.
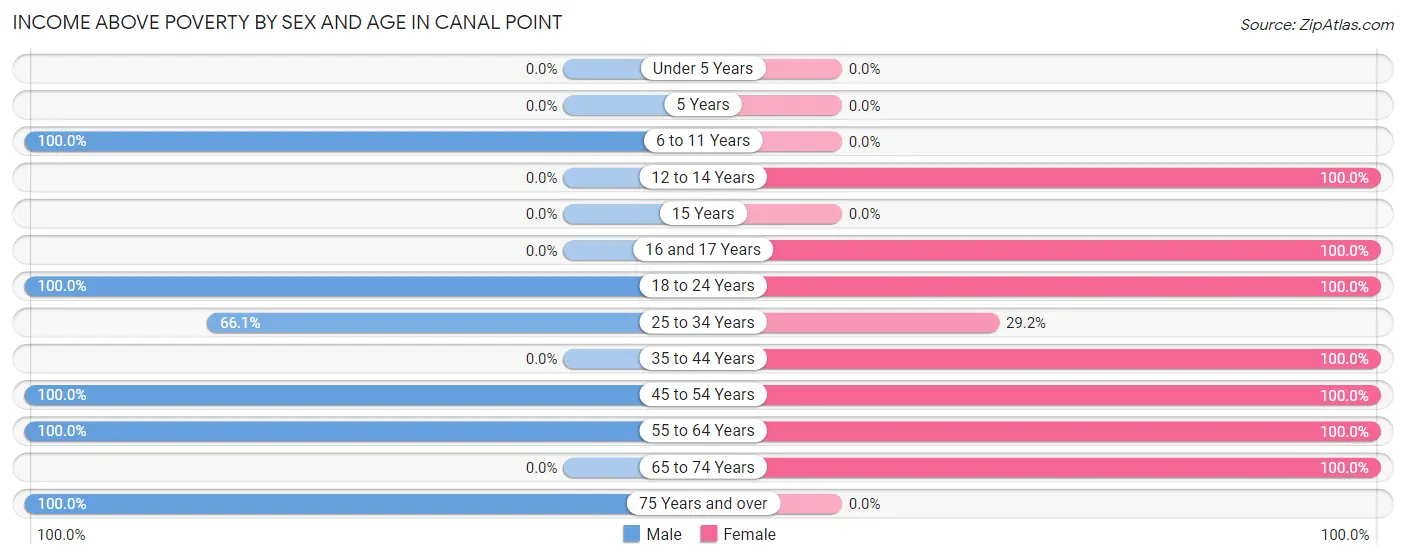
| Age Bracket | Male | Female |
| Under 5 Years | 0 (0.0%) | 0 (0.0%) |
| 5 Years | 0 (0.0%) | 0 (0.0%) |
| 6 to 11 Years | 10 (100.0%) | 0 (0.0%) |
| 12 to 14 Years | 0 (0.0%) | 27 (100.0%) |
| 15 Years | 0 (0.0%) | 0 (0.0%) |
| 16 and 17 Years | 0 (0.0%) | 27 (100.0%) |
| 18 to 24 Years | 33 (100.0%) | 15 (100.0%) |
| 25 to 34 Years | 41 (66.1%) | 7 (29.2%) |
| 35 to 44 Years | 0 (0.0%) | 9 (100.0%) |
| 45 to 54 Years | 10 (100.0%) | 40 (100.0%) |
| 55 to 64 Years | 72 (100.0%) | 30 (100.0%) |
| 65 to 74 Years | 0 (0.0%) | 17 (100.0%) |
| 75 Years and over | 19 (100.0%) | 0 (0.0%) |
| Total | 185 (89.8%) | 172 (74.5%) |
Income Below Poverty Among Married-Couple Families in Canal Point
The poverty statistics for married-couple families in Canal Point show that 26.9% or 21 of the total 78 families live below the poverty line. Families with 1 or 2 children have the highest poverty rate of 70.0%, comprising of 21 families. On the other hand, families with no children have the lowest poverty rate of 0.0%, which includes 0 families.
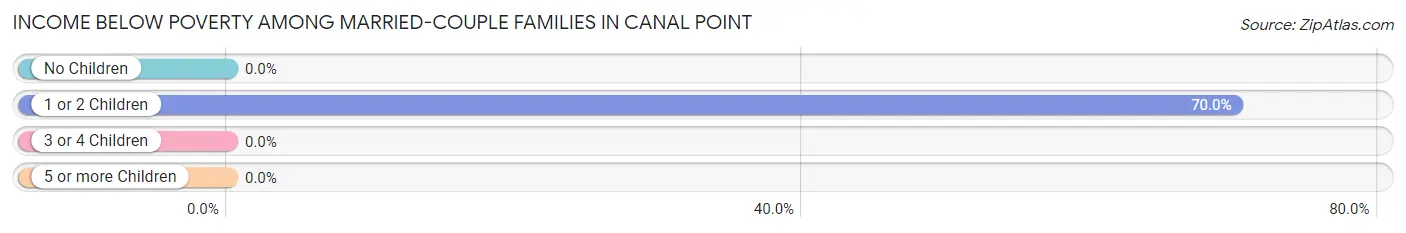
| Children | Above Poverty | Below Poverty |
| No Children | 48 (100.0%) | 0 (0.0%) |
| 1 or 2 Children | 9 (30.0%) | 21 (70.0%) |
| 3 or 4 Children | 0 (0.0%) | 0 (0.0%) |
| 5 or more Children | 0 (0.0%) | 0 (0.0%) |
| Total | 57 (73.1%) | 21 (26.9%) |
Income Below Poverty Among Single-Parent Households in Canal Point
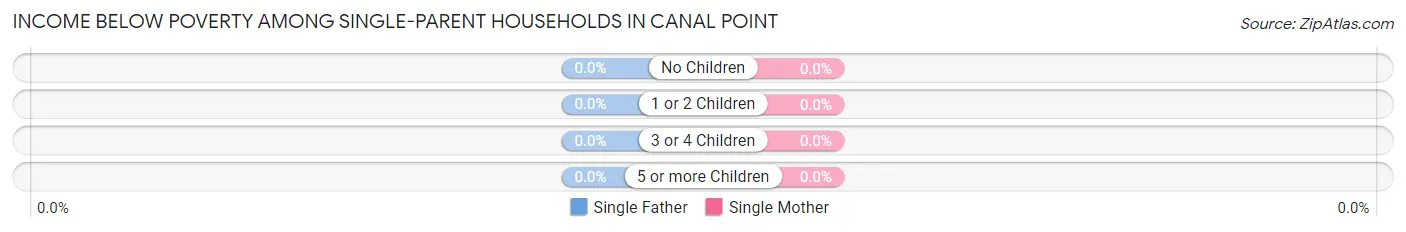
| Children | Single Father | Single Mother |
| No Children | 0 (0.0%) | 0 (0.0%) |
| 1 or 2 Children | 0 (0.0%) | 0 (0.0%) |
| 3 or 4 Children | 0 (0.0%) | 0 (0.0%) |
| 5 or more Children | 0 (0.0%) | 0 (0.0%) |
| Total | 0 (0.0%) | 0 (0.0%) |
Income Below Poverty Among Married-Couple vs Single-Parent Households in Canal Point
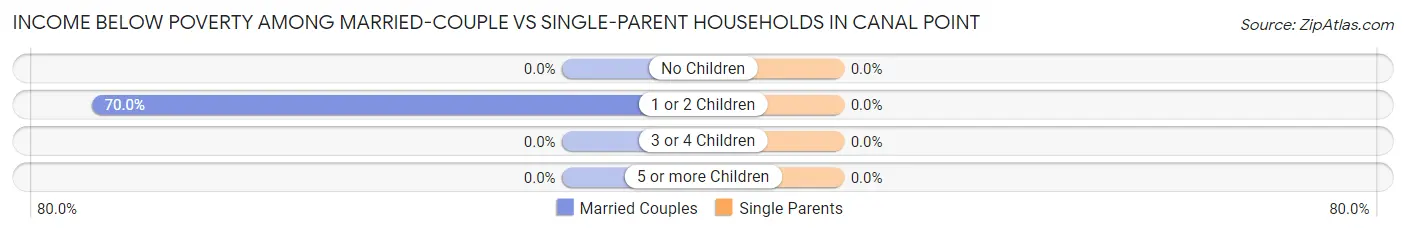
| Children | Married-Couple Families | Single-Parent Households |
| No Children | 0 (0.0%) | 0 (0.0%) |
| 1 or 2 Children | 21 (70.0%) | 0 (0.0%) |
| 3 or 4 Children | 0 (0.0%) | 0 (0.0%) |
| 5 or more Children | 0 (0.0%) | 0 (0.0%) |
| Total | 21 (26.9%) | 0 (0.0%) |
Race in Canal Point
The most populous races in Canal Point are White / Caucasian (357 | 81.7%), Hispanic or Latino (286 | 65.4%), and Two or more Races (80 | 18.3%).
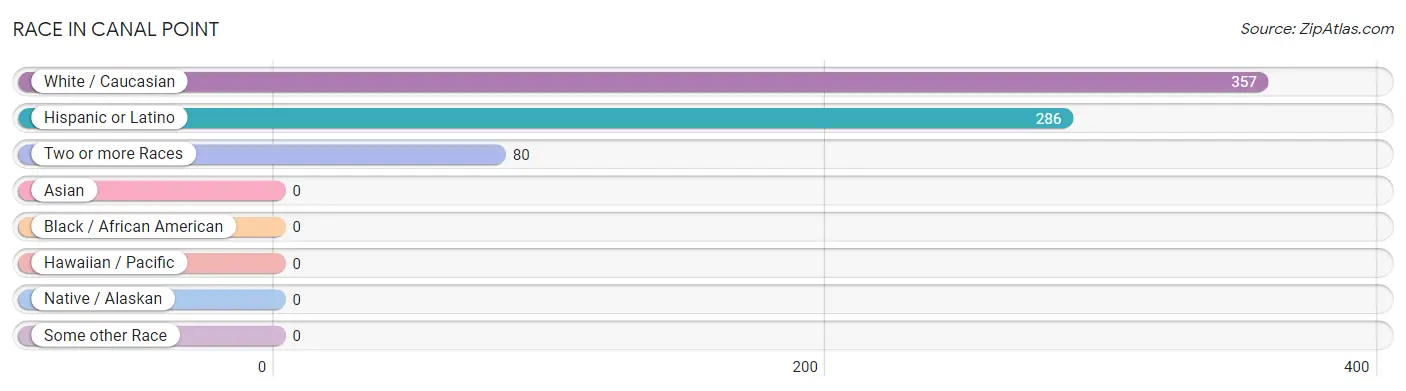
| Race | # Population | % Population |
| Asian | 0 | 0.0% |
| Black / African American | 0 | 0.0% |
| Hawaiian / Pacific | 0 | 0.0% |
| Hispanic or Latino | 286 | 65.4% |
| Native / Alaskan | 0 | 0.0% |
| White / Caucasian | 357 | 81.7% |
| Two or more Races | 80 | 18.3% |
| Some other Race | 0 | 0.0% |
| Total | 437 | 100.0% |
Ancestry in Canal Point
The most populous ancestries reported in Canal Point are Mexican (286 | 65.4%), American (78 | 17.8%), English (47 | 10.8%), Finnish (39 | 8.9%), and Italian (19 | 4.3%), together accounting for 107.3% of all Canal Point residents.
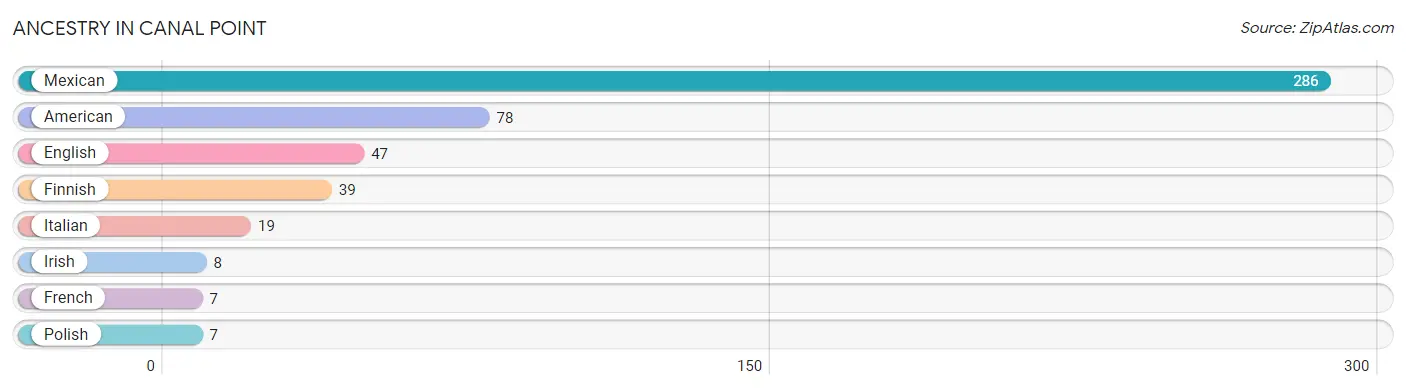
| Ancestry | # Population | % Population |
| American | 78 | 17.8% |
| English | 47 | 10.8% |
| Finnish | 39 | 8.9% |
| French | 7 | 1.6% |
| Irish | 8 | 1.8% |
| Italian | 19 | 4.3% |
| Mexican | 286 | 65.4% |
| Polish | 7 | 1.6% | View All 8 Rows |
Immigrants in Canal Point
The most numerous immigrant groups reported in Canal Point came from Central America (83 | 19.0%), Latin America (83 | 19.0%), and Mexico (83 | 19.0%), together accounting for 57.0% of all Canal Point residents.
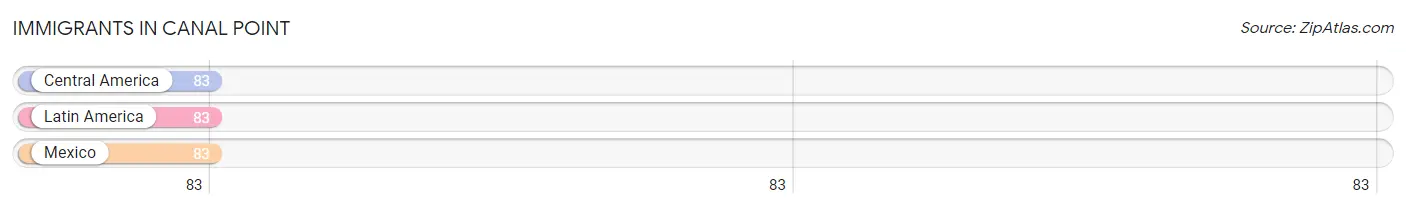
| Immigration Origin | # Population | % Population |
| Central America | 83 | 19.0% |
| Latin America | 83 | 19.0% |
| Mexico | 83 | 19.0% | View All 3 Rows |
Sex and Age in Canal Point
Sex and Age in Canal Point
The most populous age groups in Canal Point are 60 to 64 Years (64 | 31.1%) for men and 50 to 54 Years (40 | 17.3%) for women.
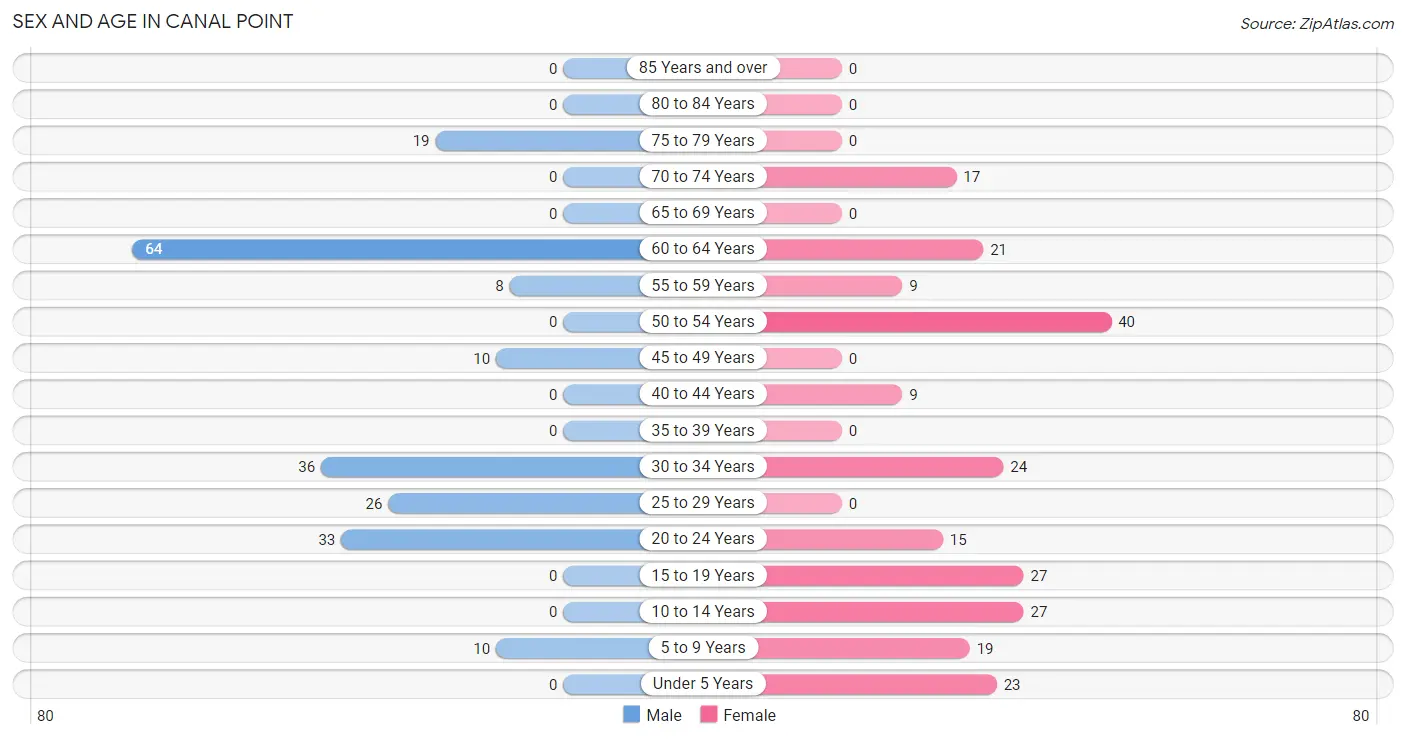
| Age Bracket | Male | Female |
| Under 5 Years | 0 (0.0%) | 23 (10.0%) |
| 5 to 9 Years | 10 (4.9%) | 19 (8.2%) |
| 10 to 14 Years | 0 (0.0%) | 27 (11.7%) |
| 15 to 19 Years | 0 (0.0%) | 27 (11.7%) |
| 20 to 24 Years | 33 (16.0%) | 15 (6.5%) |
| 25 to 29 Years | 26 (12.6%) | 0 (0.0%) |
| 30 to 34 Years | 36 (17.5%) | 24 (10.4%) |
| 35 to 39 Years | 0 (0.0%) | 0 (0.0%) |
| 40 to 44 Years | 0 (0.0%) | 9 (3.9%) |
| 45 to 49 Years | 10 (4.9%) | 0 (0.0%) |
| 50 to 54 Years | 0 (0.0%) | 40 (17.3%) |
| 55 to 59 Years | 8 (3.9%) | 9 (3.9%) |
| 60 to 64 Years | 64 (31.1%) | 21 (9.1%) |
| 65 to 69 Years | 0 (0.0%) | 0 (0.0%) |
| 70 to 74 Years | 0 (0.0%) | 17 (7.4%) |
| 75 to 79 Years | 19 (9.2%) | 0 (0.0%) |
| 80 to 84 Years | 0 (0.0%) | 0 (0.0%) |
| 85 Years and over | 0 (0.0%) | 0 (0.0%) |
| Total | 206 (100.0%) | 231 (100.0%) |
Families and Households in Canal Point
Median Family Size in Canal Point
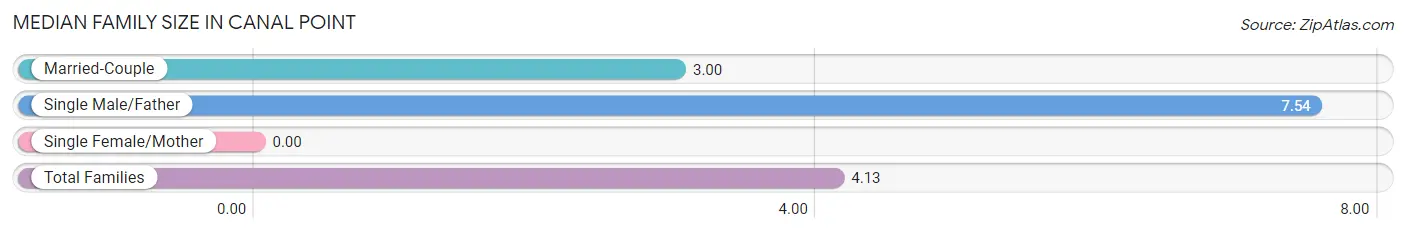
| Family Type | # Families | Family Size |
| Married-Couple | 78 (75.0%) | 3.00 |
| Single Male/Father | 26 (25.0%) | 7.54 |
| Single Female/Mother | 0 (0.0%) | - |
| Total Families | 104 (100.0%) | 4.13 |
Median Household Size in Canal Point
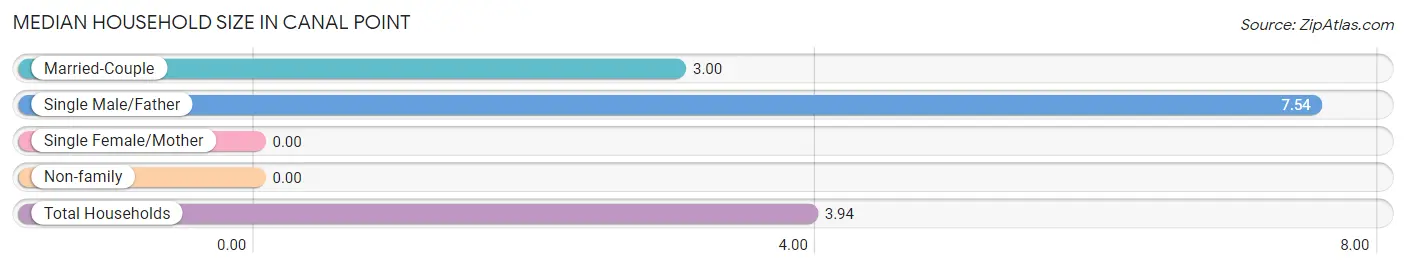
| Household Type | # Households | Household Size |
| Married-Couple | 78 (70.3%) | 3.00 |
| Single Male/Father | 26 (23.4%) | 7.54 |
| Single Female/Mother | 0 (0.0%) | - |
| Non-family | 7 (6.3%) | - |
| Total Households | 111 (100.0%) | 3.94 |
Household Size by Marriage Status in Canal Point
Out of a total of 111 households in Canal Point, 104 (93.7%) are family households, while 7 (6.3%) are nonfamily households. The most numerous type of family households are 2-person households, comprising 40, and the most common type of nonfamily households are 1-person households, comprising 7.
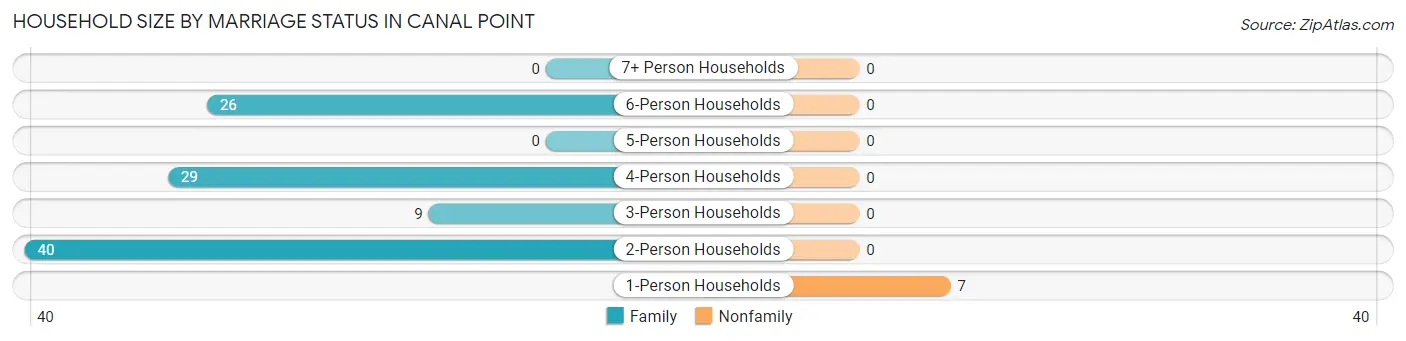
| Household Size | Family Households | Nonfamily Households |
| 1-Person Households | - | 7 (6.3%) |
| 2-Person Households | 40 (36.0%) | 0 (0.0%) |
| 3-Person Households | 9 (8.1%) | 0 (0.0%) |
| 4-Person Households | 29 (26.1%) | 0 (0.0%) |
| 5-Person Households | 0 (0.0%) | 0 (0.0%) |
| 6-Person Households | 26 (23.4%) | 0 (0.0%) |
| 7+ Person Households | 0 (0.0%) | 0 (0.0%) |
| Total | 104 (93.7%) | 7 (6.3%) |
Female Fertility in Canal Point
Fertility by Age in Canal Point
| Age Bracket | Women with Births | Births / 1,000 Women |
| 15 to 19 years | 0 (0.0%) | 0.0 |
| 20 to 34 years | 0 (0.0%) | 0.0 |
| 35 to 50 years | 0 (0.0%) | 0.0 |
| Total | 0 (0.0%) | 0.0 |
Fertility by Age by Marriage Status in Canal Point
| Age Bracket | Married | Unmarried |
| 15 to 19 years | 0 (0.0%) | 0 (0.0%) |
| 20 to 34 years | 0 (0.0%) | 0 (0.0%) |
| 35 to 50 years | 0 (0.0%) | 0 (0.0%) |
| Total | 0 (0.0%) | 0 (0.0%) |
Fertility by Education in Canal Point
| Educational Attainment | Women with Births | Births / 1,000 Women |
| Less than High School | 0 (0.0%) | 0.0 |
| High School Diploma | 0 (0.0%) | 0.0 |
| College or Associate's Degree | 0 (0.0%) | 0.0 |
| Bachelor's Degree | 0 (0.0%) | 0.0 |
| Graduate Degree | 0 (0.0%) | 0.0 |
| Total | 0 (0.0%) | 0.0 |
Fertility by Education by Marriage Status in Canal Point
| Educational Attainment | Married | Unmarried |
| Less than High School | 0 (0.0%) | 0 (0.0%) |
| High School Diploma | 0 (0.0%) | 0 (0.0%) |
| College or Associate's Degree | 0 (0.0%) | 0 (0.0%) |
| Bachelor's Degree | 0 (0.0%) | 0 (0.0%) |
| Graduate Degree | 0 (0.0%) | 0 (0.0%) |
| Total | 0 (0.0%) | 0 (0.0%) |
Employment Characteristics in Canal Point
Employment by Class of Employer in Canal Point
Among the 236 employed individuals in Canal Point, private company employees (124 | 52.5%), self-employed (not incorporated) (43 | 18.2%), and local government employees (36 | 15.2%) make up the most common classes of employment.
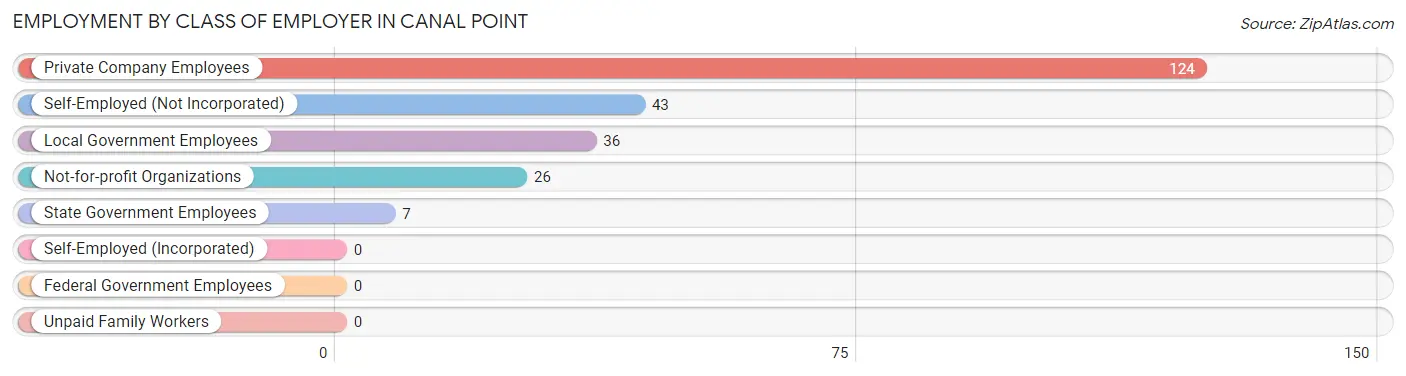
| Employer Class | # Employees | % Employees |
| Private Company Employees | 124 | 52.5% |
| Self-Employed (Incorporated) | 0 | 0.0% |
| Self-Employed (Not Incorporated) | 43 | 18.2% |
| Not-for-profit Organizations | 26 | 11.0% |
| Local Government Employees | 36 | 15.2% |
| State Government Employees | 7 | 3.0% |
| Federal Government Employees | 0 | 0.0% |
| Unpaid Family Workers | 0 | 0.0% |
| Total | 236 | 100.0% |
Employment Status by Age in Canal Point
According to the labor force statistics for Canal Point, out of the total population over 16 years of age (358), 77.1% or 276 individuals are in the labor force, with 14.5% or 40 of them unemployed. The age group with the highest labor force participation rate is 20 to 24 years, with 100.0% or 48 individuals in the labor force. Within the labor force, the 45 to 54 years age range has the highest percentage of unemployed individuals, with 80.0% or 40 of them being unemployed.
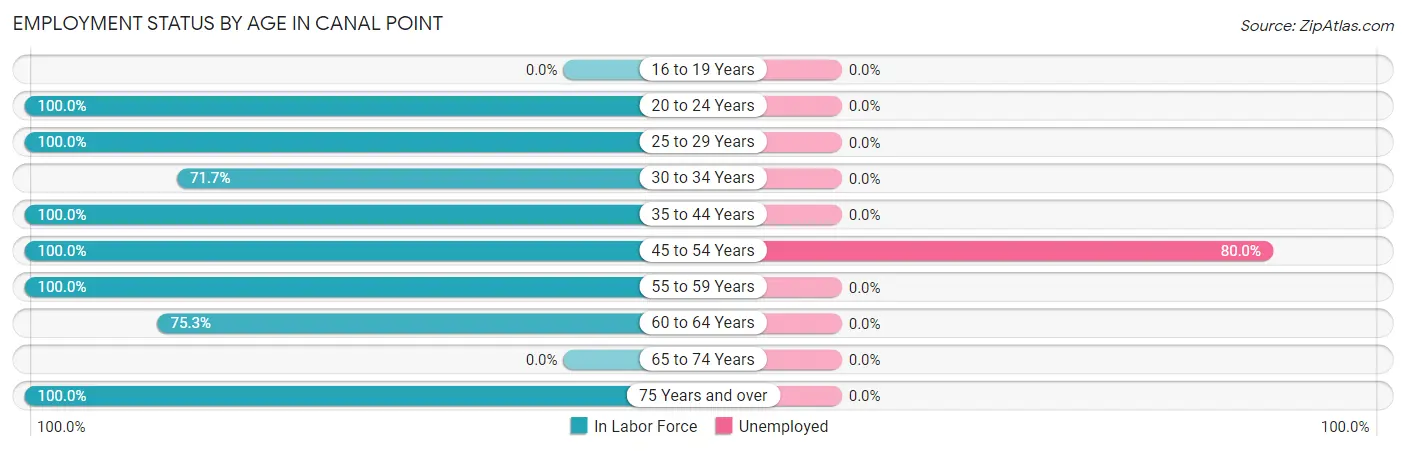
| Age Bracket | In Labor Force | Unemployed |
| 16 to 19 Years | 0 (0.0%) | 0 (0.0%) |
| 20 to 24 Years | 48 (100.0%) | 0 (0.0%) |
| 25 to 29 Years | 26 (100.0%) | 0 (0.0%) |
| 30 to 34 Years | 43 (71.7%) | 0 (0.0%) |
| 35 to 44 Years | 9 (100.0%) | 0 (0.0%) |
| 45 to 54 Years | 50 (100.0%) | 40 (80.0%) |
| 55 to 59 Years | 17 (100.0%) | 0 (0.0%) |
| 60 to 64 Years | 64 (75.3%) | 0 (0.0%) |
| 65 to 74 Years | 0 (0.0%) | 0 (0.0%) |
| 75 Years and over | 19 (100.0%) | 0 (0.0%) |
| Total | 276 (77.1%) | 40 (14.5%) |
Employment Status by Educational Attainment in Canal Point
According to labor force statistics for Canal Point, 84.6% of individuals (209) out of the total population between 25 and 64 years of age (247) are in the labor force, with 19.1% or 40 of them being unemployed. The group with the highest labor force participation rate are those with the educational attainment of college / associate degree, with 100.0% or 9 individuals in the labor force. Within the labor force, individuals with high school diploma education have the highest percentage of unemployment, with 27.6% or 40 of them being unemployed.
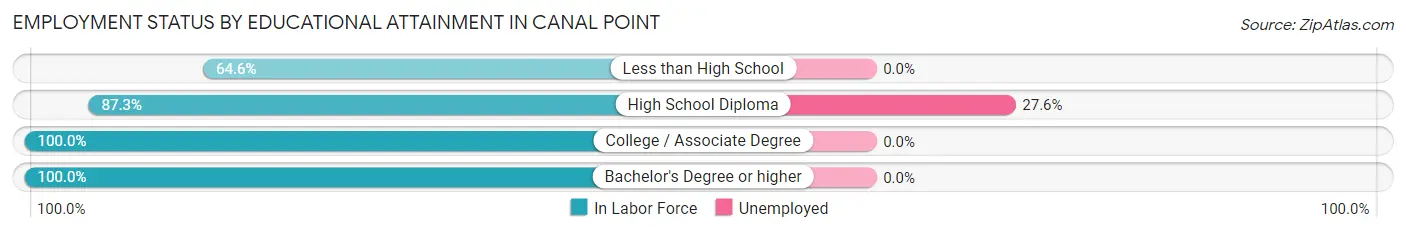
| Educational Attainment | In Labor Force | Unemployed |
| Less than High School | 31 (64.6%) | 0 (0.0%) |
| High School Diploma | 145 (87.3%) | 46 (27.6%) |
| College / Associate Degree | 9 (100.0%) | 0 (0.0%) |
| Bachelor's Degree or higher | 24 (100.0%) | 0 (0.0%) |
| Total | 209 (84.6%) | 47 (19.1%) |
Employment Occupations by Sex in Canal Point
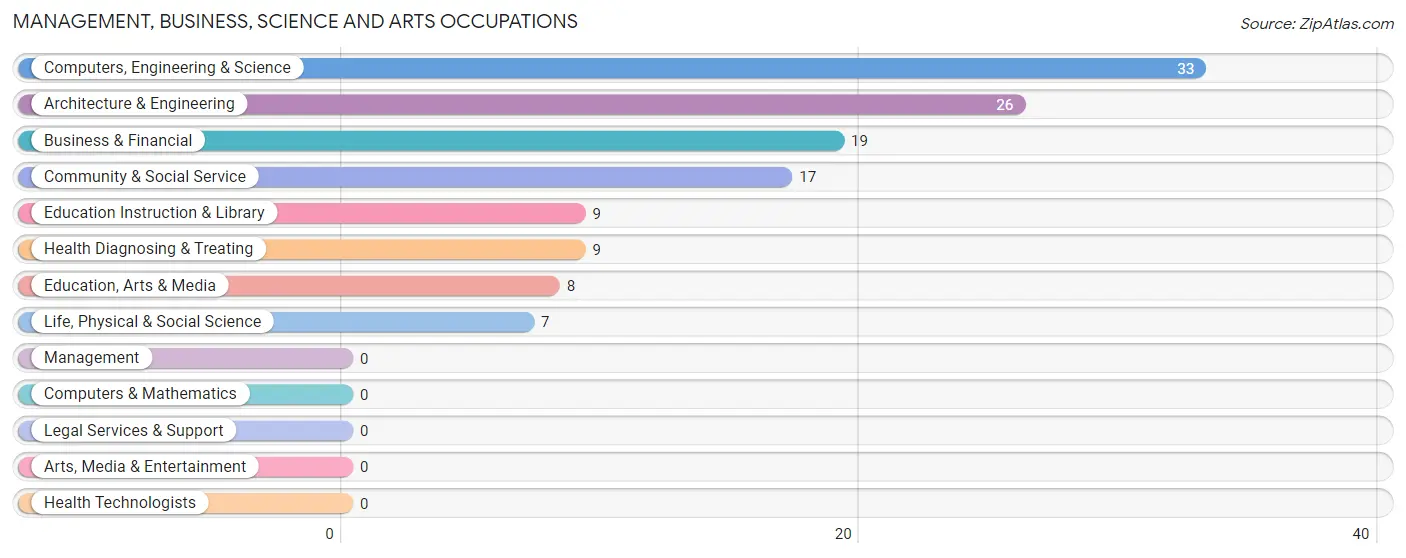
Management, Business, Science and Arts Occupations
The most common Management, Business, Science and Arts occupations in Canal Point are Computers, Engineering & Science (33 | 14.0%), Architecture & Engineering (26 | 11.0%), Business & Financial (19 | 8.1%), Community & Social Service (17 | 7.2%), and Education Instruction & Library (9 | 3.8%).
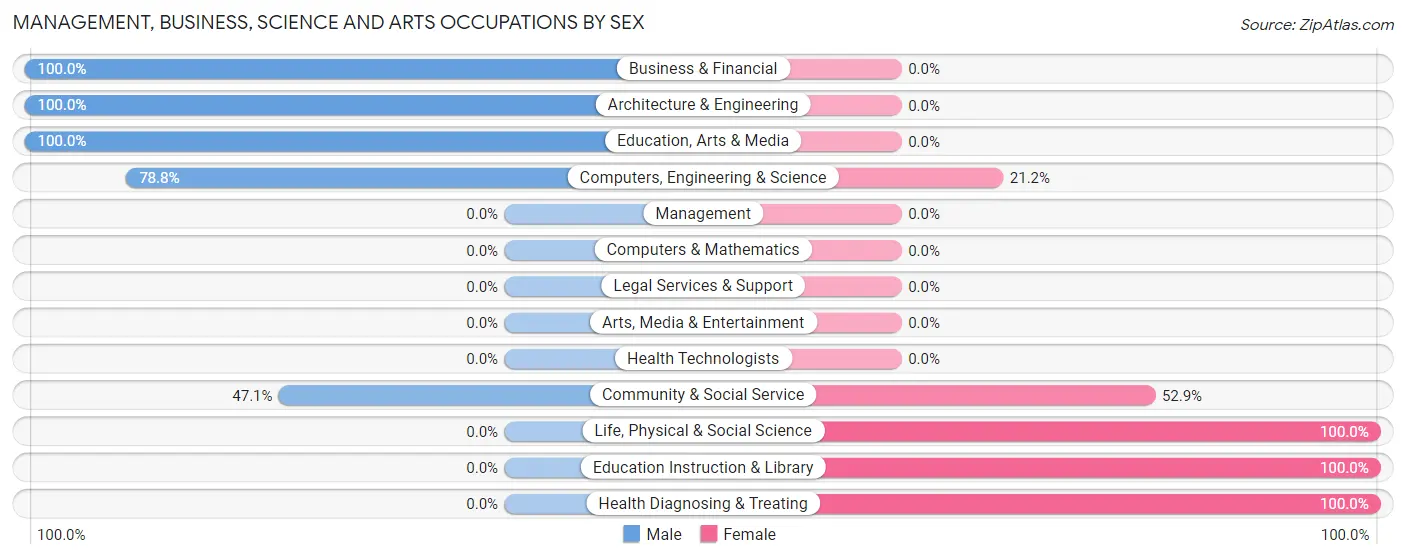
Management, Business, Science and Arts Occupations by Sex
Within the Management, Business, Science and Arts occupations in Canal Point, the most male-oriented occupations are Business & Financial (100.0%), Architecture & Engineering (100.0%), and Education, Arts & Media (100.0%), while the most female-oriented occupations are Life, Physical & Social Science (100.0%), Education Instruction & Library (100.0%), and Health Diagnosing & Treating (100.0%).
| Occupation | Male | Female |
| Management | 0 (0.0%) | 0 (0.0%) |
| Business & Financial | 19 (100.0%) | 0 (0.0%) |
| Computers, Engineering & Science | 26 (78.8%) | 7 (21.2%) |
| Computers & Mathematics | 0 (0.0%) | 0 (0.0%) |
| Architecture & Engineering | 26 (100.0%) | 0 (0.0%) |
| Life, Physical & Social Science | 0 (0.0%) | 7 (100.0%) |
| Community & Social Service | 8 (47.1%) | 9 (52.9%) |
| Education, Arts & Media | 8 (100.0%) | 0 (0.0%) |
| Legal Services & Support | 0 (0.0%) | 0 (0.0%) |
| Education Instruction & Library | 0 (0.0%) | 9 (100.0%) |
| Arts, Media & Entertainment | 0 (0.0%) | 0 (0.0%) |
| Health Diagnosing & Treating | 0 (0.0%) | 9 (100.0%) |
| Health Technologists | 0 (0.0%) | 0 (0.0%) |
| Total (Category) | 53 (67.9%) | 25 (32.1%) |
| Total (Overall) | 196 (83.1%) | 40 (17.0%) |
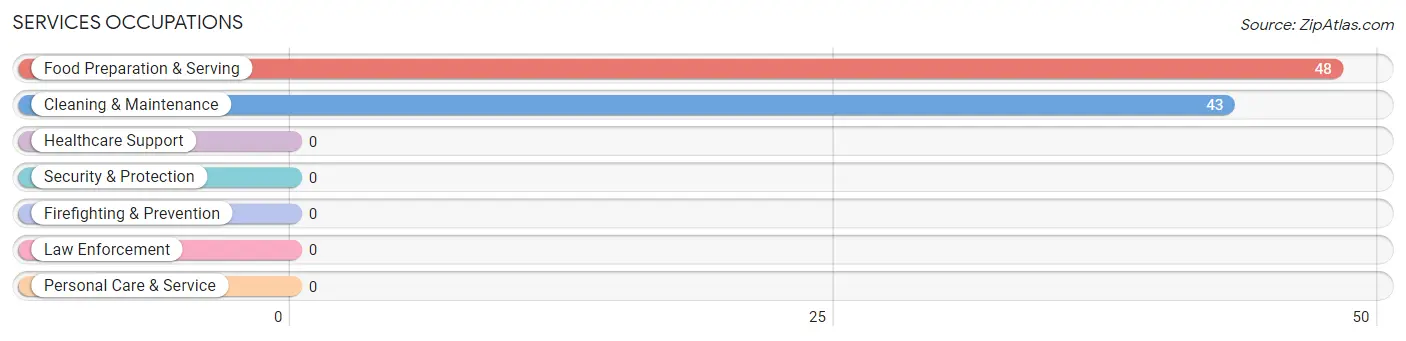
Services Occupations
The most common Services occupations in Canal Point are Food Preparation & Serving (48 | 20.3%), and Cleaning & Maintenance (43 | 18.2%).
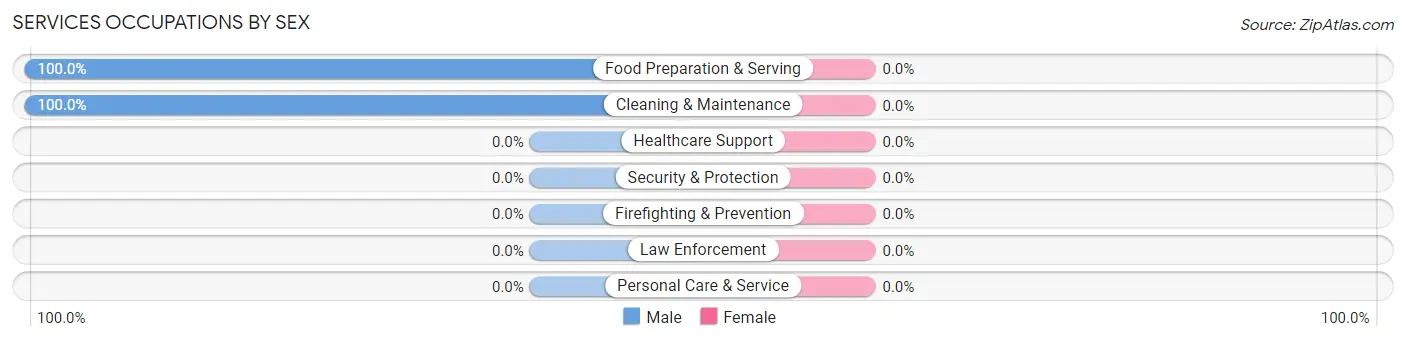
Services Occupations by Sex
| Occupation | Male | Female |
| Healthcare Support | 0 (0.0%) | 0 (0.0%) |
| Security & Protection | 0 (0.0%) | 0 (0.0%) |
| Firefighting & Prevention | 0 (0.0%) | 0 (0.0%) |
| Law Enforcement | 0 (0.0%) | 0 (0.0%) |
| Food Preparation & Serving | 48 (100.0%) | 0 (0.0%) |
| Cleaning & Maintenance | 43 (100.0%) | 0 (0.0%) |
| Personal Care & Service | 0 (0.0%) | 0 (0.0%) |
| Total (Category) | 91 (100.0%) | 0 (0.0%) |
| Total (Overall) | 196 (83.1%) | 40 (17.0%) |
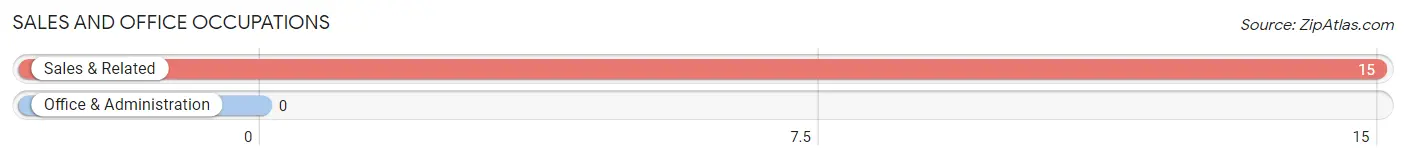
Sales and Office Occupations
The most common Sales and Office occupations in Canal Point are , and Sales & Related (15 | 6.4%).
Sales and Office Occupations by Sex
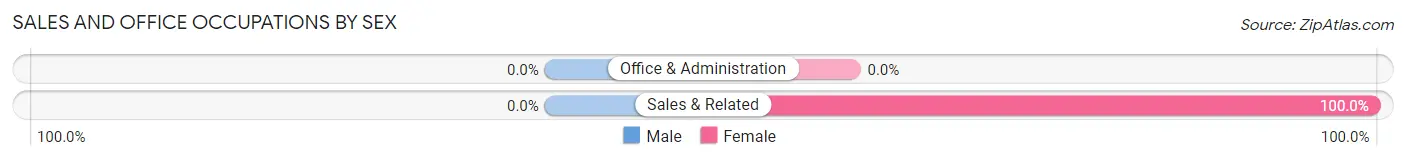
| Occupation | Male | Female |
| Sales & Related | 0 (0.0%) | 15 (100.0%) |
| Office & Administration | 0 (0.0%) | 0 (0.0%) |
| Total (Category) | 0 (0.0%) | 15 (100.0%) |
| Total (Overall) | 196 (83.1%) | 40 (17.0%) |
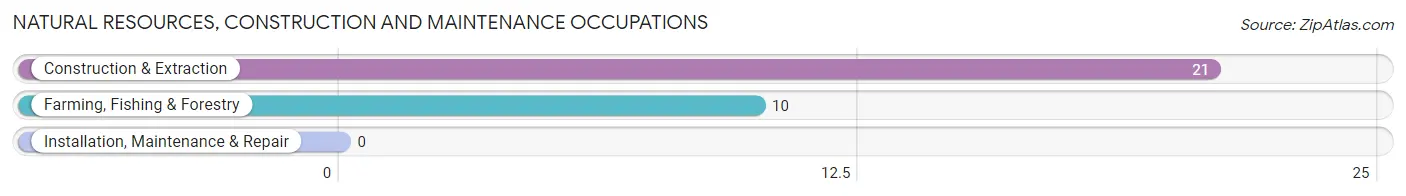
Natural Resources, Construction and Maintenance Occupations
The most common Natural Resources, Construction and Maintenance occupations in Canal Point are Construction & Extraction (21 | 8.9%), and Farming, Fishing & Forestry (10 | 4.2%).
Natural Resources, Construction and Maintenance Occupations by Sex
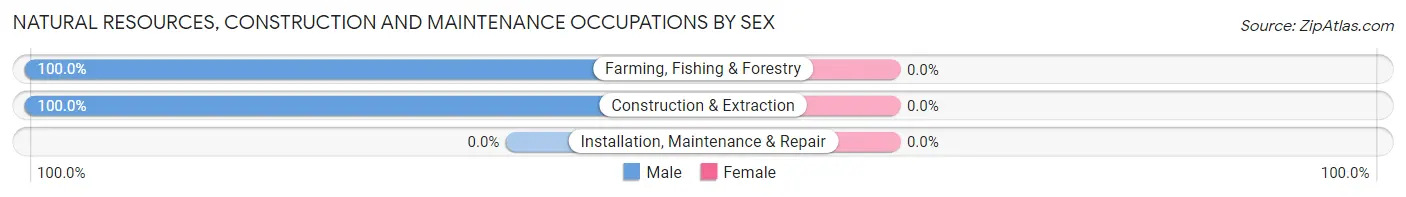
| Occupation | Male | Female |
| Farming, Fishing & Forestry | 10 (100.0%) | 0 (0.0%) |
| Construction & Extraction | 21 (100.0%) | 0 (0.0%) |
| Installation, Maintenance & Repair | 0 (0.0%) | 0 (0.0%) |
| Total (Category) | 31 (100.0%) | 0 (0.0%) |
| Total (Overall) | 196 (83.1%) | 40 (17.0%) |
Production, Transportation and Moving Occupations
The most common Production, Transportation and Moving occupations in Canal Point are , and Production (21 | 8.9%).
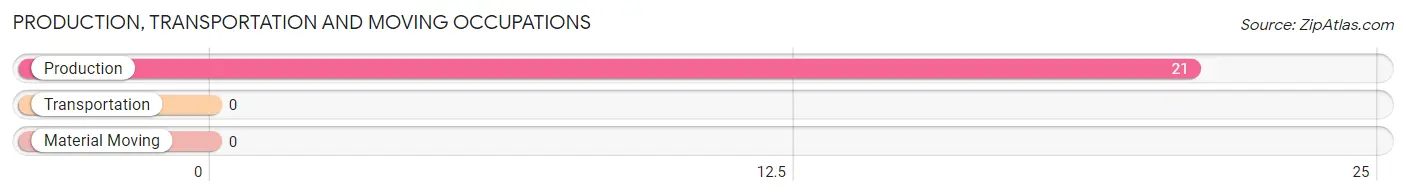
Production, Transportation and Moving Occupations by Sex
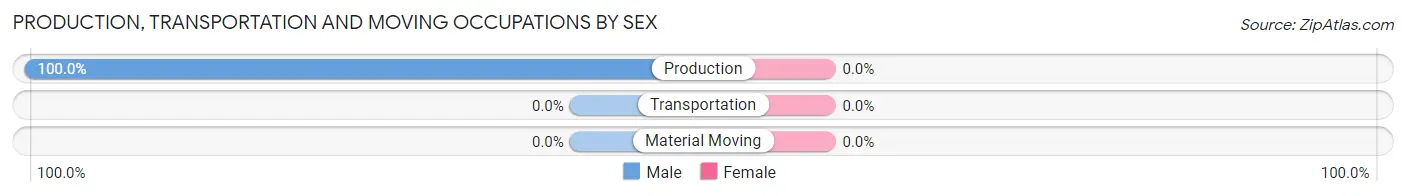
| Occupation | Male | Female |
| Production | 21 (100.0%) | 0 (0.0%) |
| Transportation | 0 (0.0%) | 0 (0.0%) |
| Material Moving | 0 (0.0%) | 0 (0.0%) |
| Total (Category) | 21 (100.0%) | 0 (0.0%) |
| Total (Overall) | 196 (83.1%) | 40 (17.0%) |
Employment Industries by Sex in Canal Point
Employment Industries in Canal Point
The major employment industries in Canal Point include Administrative & Support (43 | 18.2%), Accommodation & Food Services (33 | 14.0%), Agriculture, Fishing & Hunting (31 | 13.1%), Educational Services (30 | 12.7%), and Manufacturing (26 | 11.0%).
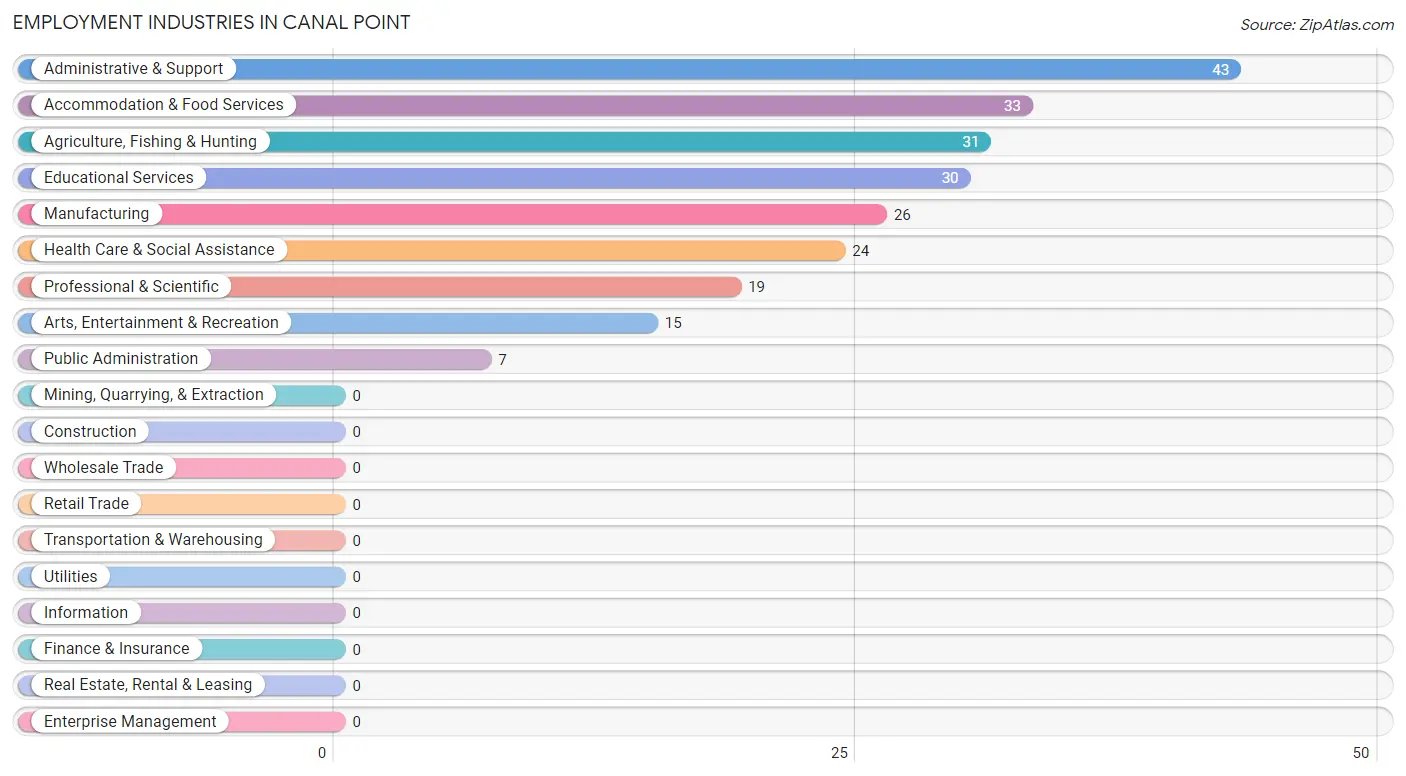
Employment Industries by Sex in Canal Point
The Canal Point industries that see more men than women are Agriculture, Fishing & Hunting (100.0%), Manufacturing (100.0%), and Professional & Scientific (100.0%), whereas the industries that tend to have a higher number of women are Arts, Entertainment & Recreation (100.0%), Public Administration (100.0%), and Health Care & Social Assistance (37.5%).
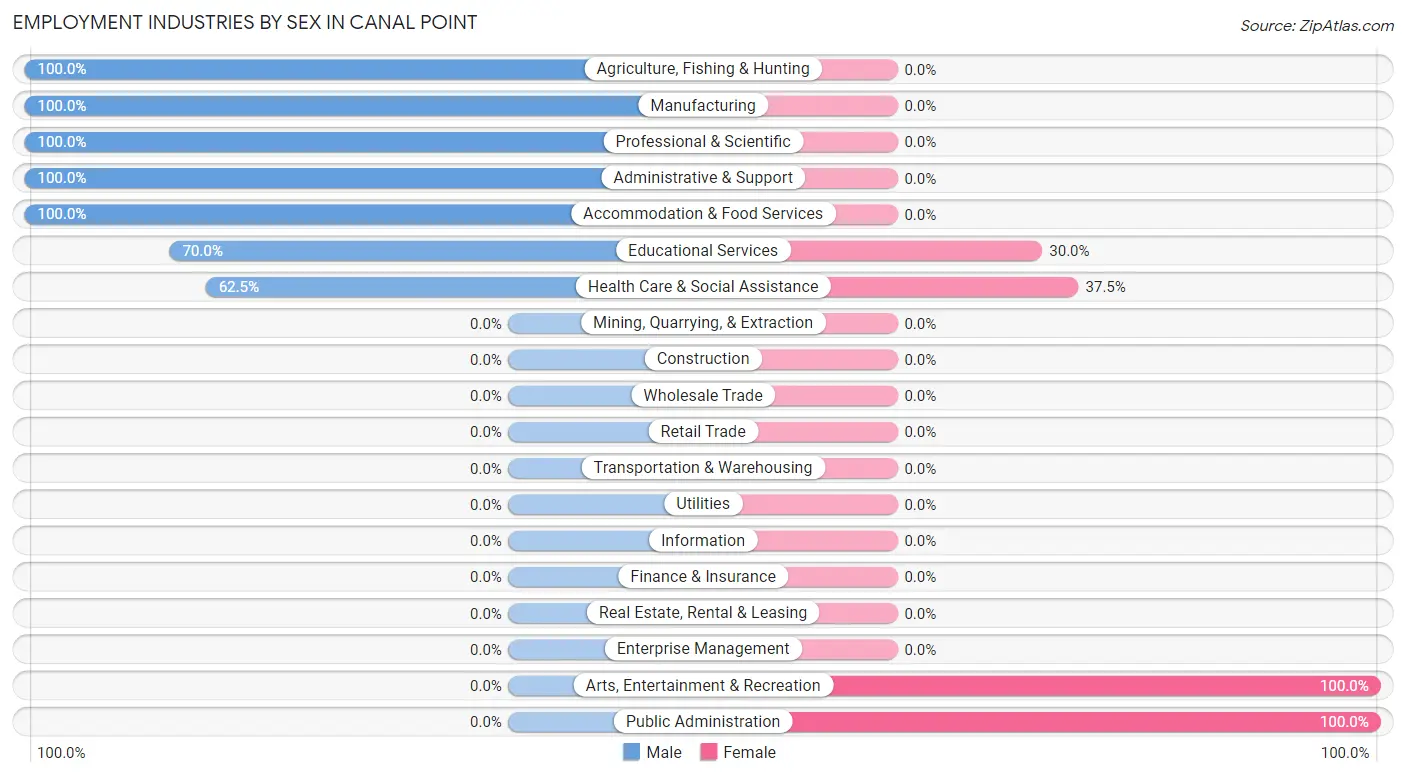
| Industry | Male | Female |
| Agriculture, Fishing & Hunting | 31 (100.0%) | 0 (0.0%) |
| Mining, Quarrying, & Extraction | 0 (0.0%) | 0 (0.0%) |
| Construction | 0 (0.0%) | 0 (0.0%) |
| Manufacturing | 26 (100.0%) | 0 (0.0%) |
| Wholesale Trade | 0 (0.0%) | 0 (0.0%) |
| Retail Trade | 0 (0.0%) | 0 (0.0%) |
| Transportation & Warehousing | 0 (0.0%) | 0 (0.0%) |
| Utilities | 0 (0.0%) | 0 (0.0%) |
| Information | 0 (0.0%) | 0 (0.0%) |
| Finance & Insurance | 0 (0.0%) | 0 (0.0%) |
| Real Estate, Rental & Leasing | 0 (0.0%) | 0 (0.0%) |
| Professional & Scientific | 19 (100.0%) | 0 (0.0%) |
| Enterprise Management | 0 (0.0%) | 0 (0.0%) |
| Administrative & Support | 43 (100.0%) | 0 (0.0%) |
| Educational Services | 21 (70.0%) | 9 (30.0%) |
| Health Care & Social Assistance | 15 (62.5%) | 9 (37.5%) |
| Arts, Entertainment & Recreation | 0 (0.0%) | 15 (100.0%) |
| Accommodation & Food Services | 33 (100.0%) | 0 (0.0%) |
| Public Administration | 0 (0.0%) | 7 (100.0%) |
| Total | 196 (83.1%) | 40 (17.0%) |
Education in Canal Point
School Enrollment in Canal Point
The most common levels of schooling among the 109 students in Canal Point are elementary school (29 | 26.6%), middle school (27 | 24.8%), and high school (27 | 24.8%).
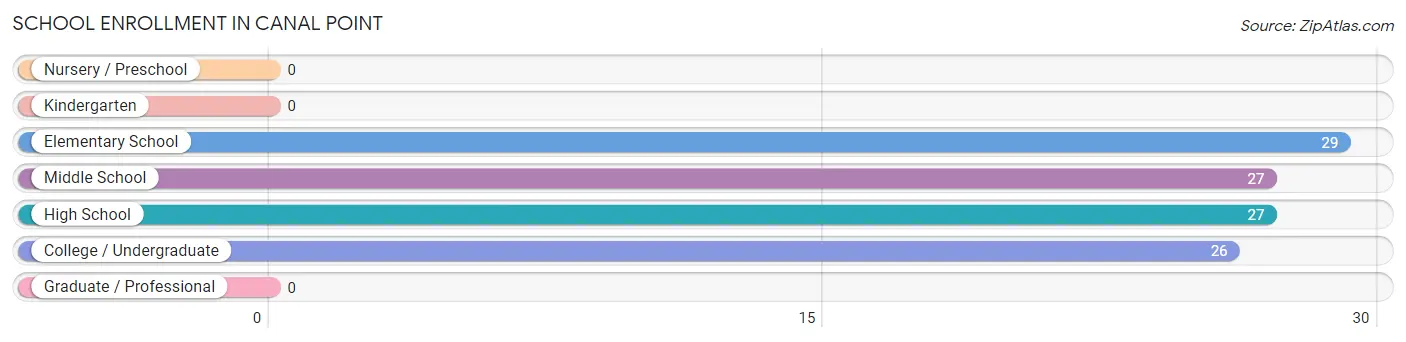
| School Level | # Students | % Students |
| Nursery / Preschool | 0 | 0.0% |
| Kindergarten | 0 | 0.0% |
| Elementary School | 29 | 26.6% |
| Middle School | 27 | 24.8% |
| High School | 27 | 24.8% |
| College / Undergraduate | 26 | 23.8% |
| Graduate / Professional | 0 | 0.0% |
| Total | 109 | 100.0% |
School Enrollment by Age by Funding Source in Canal Point
Out of a total of 109 students who are enrolled in schools in Canal Point, 37 (33.9%) attend a private institution, while the remaining 72 (66.1%) are enrolled in public schools. The age group of 15 to 17 year olds has the highest likelihood of being enrolled in private schools, with 27 (100.0% in the age bracket) enrolled. Conversely, the age group of 10 to 14 year olds has the lowest likelihood of being enrolled in a private school, with 27 (100.0% in the age bracket) attending a public institution.
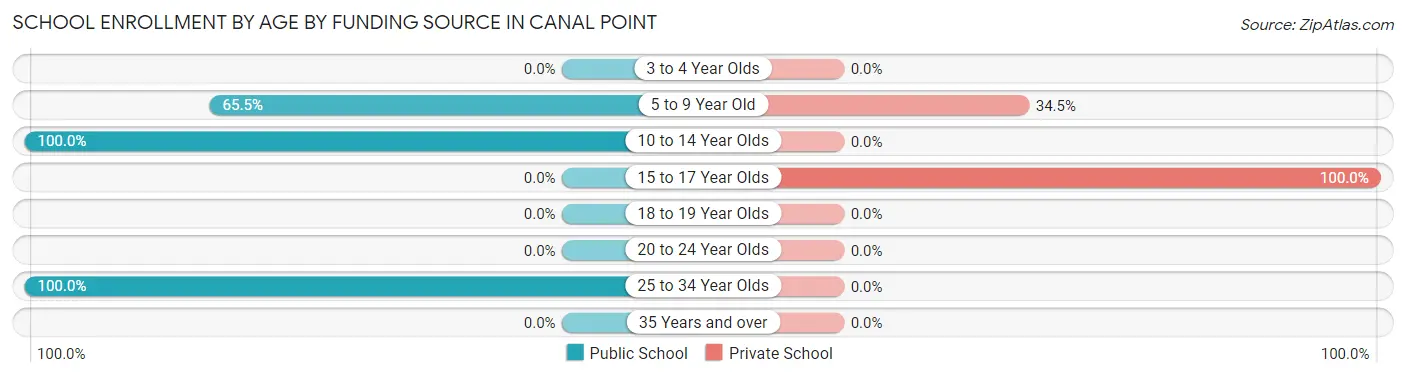
| Age Bracket | Public School | Private School |
| 3 to 4 Year Olds | 0 (0.0%) | 0 (0.0%) |
| 5 to 9 Year Old | 19 (65.5%) | 10 (34.5%) |
| 10 to 14 Year Olds | 27 (100.0%) | 0 (0.0%) |
| 15 to 17 Year Olds | 0 (0.0%) | 27 (100.0%) |
| 18 to 19 Year Olds | 0 (0.0%) | 0 (0.0%) |
| 20 to 24 Year Olds | 0 (0.0%) | 0 (0.0%) |
| 25 to 34 Year Olds | 26 (100.0%) | 0 (0.0%) |
| 35 Years and over | 0 (0.0%) | 0 (0.0%) |
| Total | 72 (66.1%) | 37 (33.9%) |
Educational Attainment by Field of Study in Canal Point
Science & technology (19 | 44.2%), education (9 | 20.9%), liberal arts & history (8 | 18.6%), and physical & health sciences (7 | 16.3%) are the most common fields of study among 43 individuals in Canal Point who have obtained a bachelor's degree or higher.
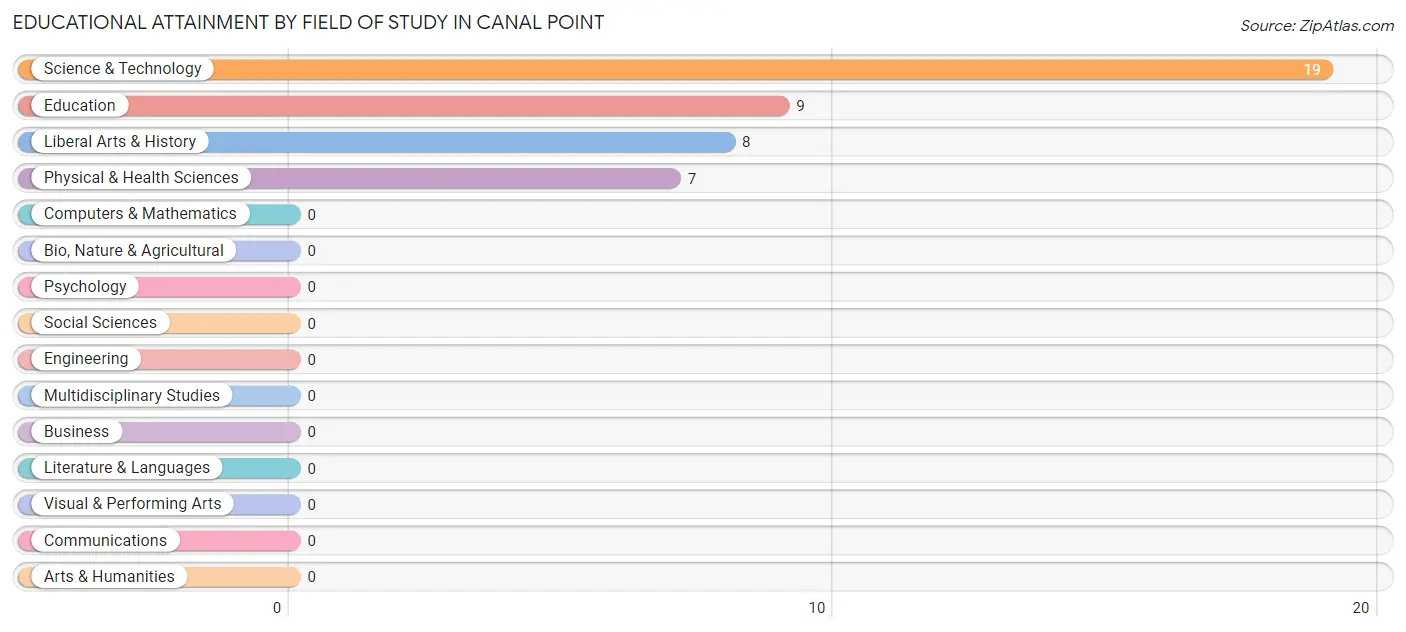
| Field of Study | # Graduates | % Graduates |
| Computers & Mathematics | 0 | 0.0% |
| Bio, Nature & Agricultural | 0 | 0.0% |
| Physical & Health Sciences | 7 | 16.3% |
| Psychology | 0 | 0.0% |
| Social Sciences | 0 | 0.0% |
| Engineering | 0 | 0.0% |
| Multidisciplinary Studies | 0 | 0.0% |
| Science & Technology | 19 | 44.2% |
| Business | 0 | 0.0% |
| Education | 9 | 20.9% |
| Literature & Languages | 0 | 0.0% |
| Liberal Arts & History | 8 | 18.6% |
| Visual & Performing Arts | 0 | 0.0% |
| Communications | 0 | 0.0% |
| Arts & Humanities | 0 | 0.0% |
| Total | 43 | 100.0% |
Transportation & Commute in Canal Point
Vehicle Availability by Sex in Canal Point
The most prevalent vehicle ownership categories in Canal Point are males with 2 vehicles (154, accounting for 78.6%) and females with 2 vehicles (9, making up 385.0%).
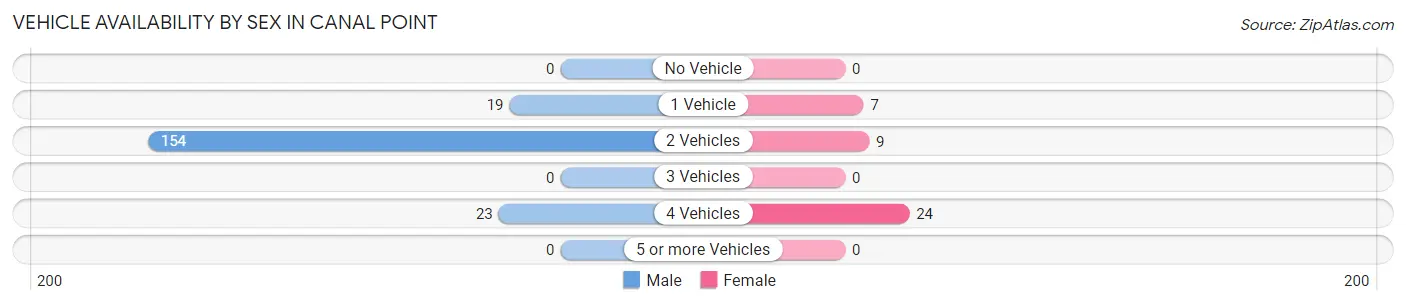
| Vehicles Available | Male | Female |
| No Vehicle | 0 (0.0%) | 0 (0.0%) |
| 1 Vehicle | 19 (9.7%) | 7 (17.5%) |
| 2 Vehicles | 154 (78.6%) | 9 (22.5%) |
| 3 Vehicles | 0 (0.0%) | 0 (0.0%) |
| 4 Vehicles | 23 (11.7%) | 24 (60.0%) |
| 5 or more Vehicles | 0 (0.0%) | 0 (0.0%) |
| Total | 196 (100.0%) | 40 (100.0%) |
Commute Time in Canal Point
The most frequently occuring commute durations in Canal Point are 20 to 24 minutes (100 commuters, 42.4%), 40 to 44 minutes (59 commuters, 25.0%), and less than 5 minutes (27 commuters, 11.4%).
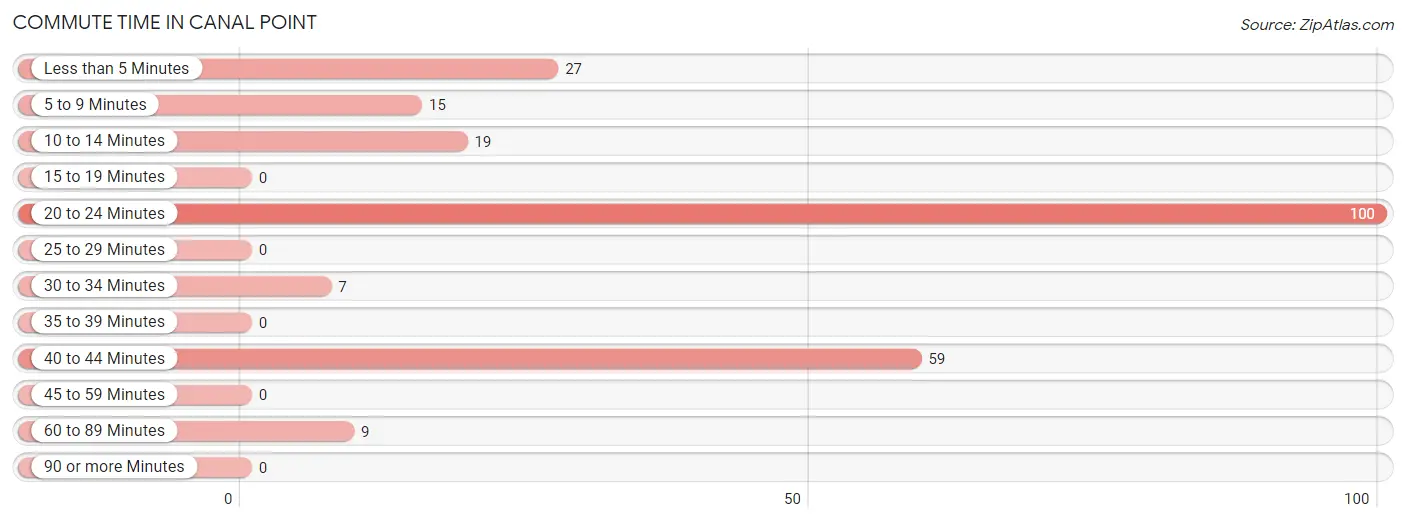
| Commute Time | # Commuters | % Commuters |
| Less than 5 Minutes | 27 | 11.4% |
| 5 to 9 Minutes | 15 | 6.4% |
| 10 to 14 Minutes | 19 | 8.1% |
| 15 to 19 Minutes | 0 | 0.0% |
| 20 to 24 Minutes | 100 | 42.4% |
| 25 to 29 Minutes | 0 | 0.0% |
| 30 to 34 Minutes | 7 | 3.0% |
| 35 to 39 Minutes | 0 | 0.0% |
| 40 to 44 Minutes | 59 | 25.0% |
| 45 to 59 Minutes | 0 | 0.0% |
| 60 to 89 Minutes | 9 | 3.8% |
| 90 or more Minutes | 0 | 0.0% |
Commute Time by Sex in Canal Point
The most common commute times in Canal Point are 20 to 24 minutes (85 commuters, 43.4%) for males and 20 to 24 minutes (15 commuters, 37.5%) for females.
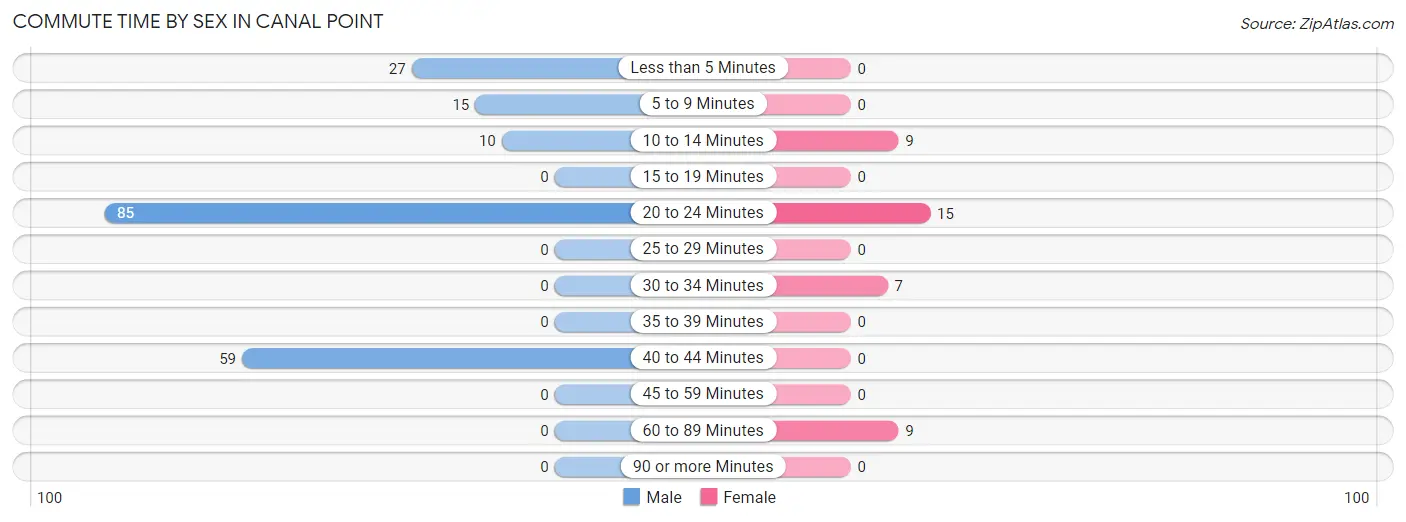
| Commute Time | Male | Female |
| Less than 5 Minutes | 27 (13.8%) | 0 (0.0%) |
| 5 to 9 Minutes | 15 (7.6%) | 0 (0.0%) |
| 10 to 14 Minutes | 10 (5.1%) | 9 (22.5%) |
| 15 to 19 Minutes | 0 (0.0%) | 0 (0.0%) |
| 20 to 24 Minutes | 85 (43.4%) | 15 (37.5%) |
| 25 to 29 Minutes | 0 (0.0%) | 0 (0.0%) |
| 30 to 34 Minutes | 0 (0.0%) | 7 (17.5%) |
| 35 to 39 Minutes | 0 (0.0%) | 0 (0.0%) |
| 40 to 44 Minutes | 59 (30.1%) | 0 (0.0%) |
| 45 to 59 Minutes | 0 (0.0%) | 0 (0.0%) |
| 60 to 89 Minutes | 0 (0.0%) | 9 (22.5%) |
| 90 or more Minutes | 0 (0.0%) | 0 (0.0%) |
Time of Departure to Work by Sex in Canal Point
The most frequent times of departure to work in Canal Point are 5:30 AM to 5:59 AM (80, 40.8%) for males and 7:30 AM to 7:59 AM (16, 40.0%) for females.
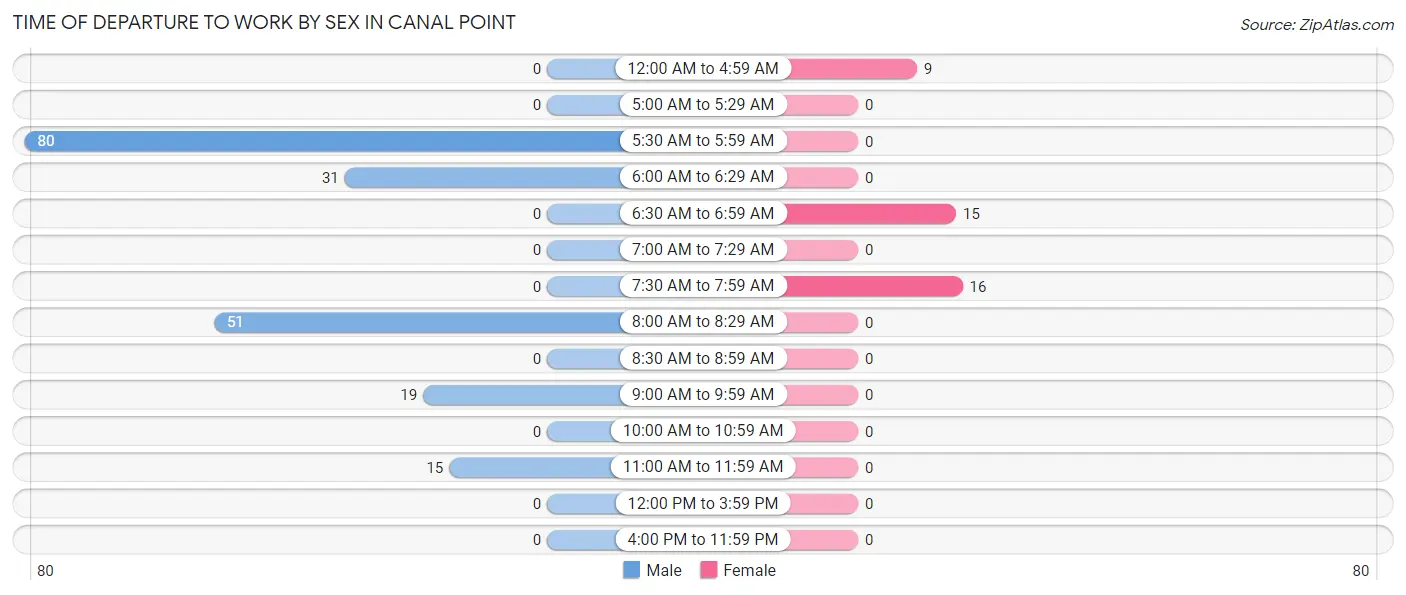
| Time of Departure | Male | Female |
| 12:00 AM to 4:59 AM | 0 (0.0%) | 9 (22.5%) |
| 5:00 AM to 5:29 AM | 0 (0.0%) | 0 (0.0%) |
| 5:30 AM to 5:59 AM | 80 (40.8%) | 0 (0.0%) |
| 6:00 AM to 6:29 AM | 31 (15.8%) | 0 (0.0%) |
| 6:30 AM to 6:59 AM | 0 (0.0%) | 15 (37.5%) |
| 7:00 AM to 7:29 AM | 0 (0.0%) | 0 (0.0%) |
| 7:30 AM to 7:59 AM | 0 (0.0%) | 16 (40.0%) |
| 8:00 AM to 8:29 AM | 51 (26.0%) | 0 (0.0%) |
| 8:30 AM to 8:59 AM | 0 (0.0%) | 0 (0.0%) |
| 9:00 AM to 9:59 AM | 19 (9.7%) | 0 (0.0%) |
| 10:00 AM to 10:59 AM | 0 (0.0%) | 0 (0.0%) |
| 11:00 AM to 11:59 AM | 15 (7.6%) | 0 (0.0%) |
| 12:00 PM to 3:59 PM | 0 (0.0%) | 0 (0.0%) |
| 4:00 PM to 11:59 PM | 0 (0.0%) | 0 (0.0%) |
| Total | 196 (100.0%) | 40 (100.0%) |
Housing Occupancy in Canal Point
Occupancy by Ownership in Canal Point
Of the total 111 dwellings in Canal Point, owner-occupied units account for 75 (67.6%), while renter-occupied units make up 36 (32.4%).
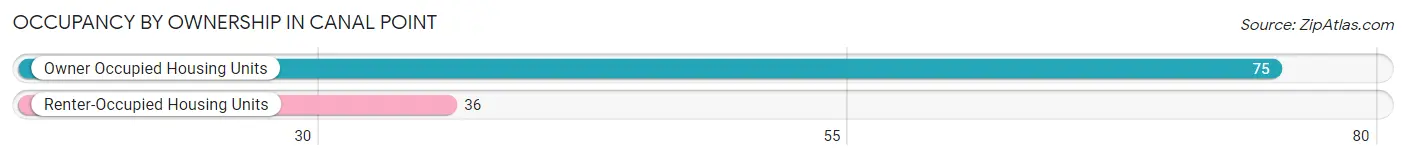
| Occupancy | # Housing Units | % Housing Units |
| Owner Occupied Housing Units | 75 | 67.6% |
| Renter-Occupied Housing Units | 36 | 32.4% |
| Total Occupied Housing Units | 111 | 100.0% |
Occupancy by Household Size in Canal Point
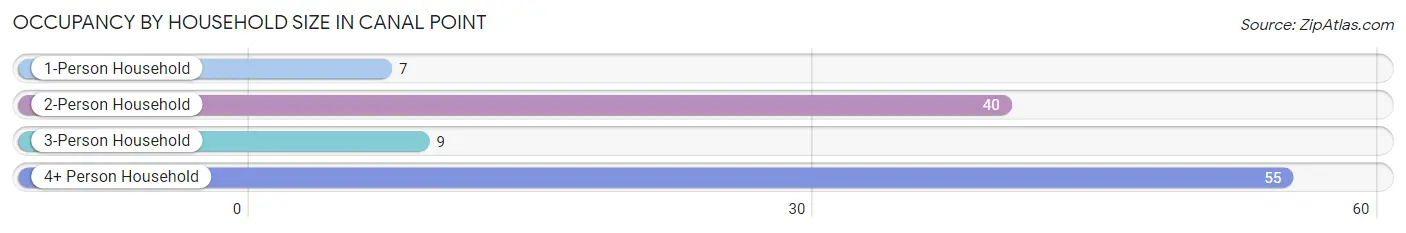
| Household Size | # Housing Units | % Housing Units |
| 1-Person Household | 7 | 6.3% |
| 2-Person Household | 40 | 36.0% |
| 3-Person Household | 9 | 8.1% |
| 4+ Person Household | 55 | 49.5% |
| Total Housing Units | 111 | 100.0% |
Occupancy by Ownership by Household Size in Canal Point

| Household Size | Owner-occupied | Renter-occupied |
| 1-Person Household | 0 (0.0%) | 7 (100.0%) |
| 2-Person Household | 40 (100.0%) | 0 (0.0%) |
| 3-Person Household | 9 (100.0%) | 0 (0.0%) |
| 4+ Person Household | 26 (47.3%) | 29 (52.7%) |
| Total Housing Units | 75 (67.6%) | 36 (32.4%) |
Occupancy by Educational Attainment in Canal Point
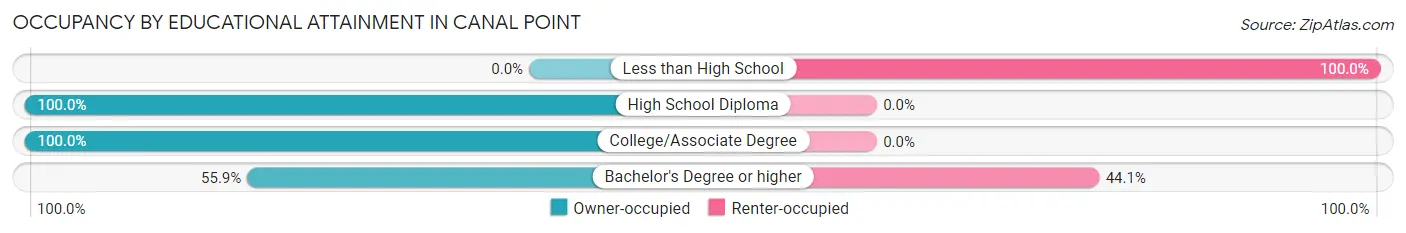
| Household Size | Owner-occupied | Renter-occupied |
| Less than High School | 0 (0.0%) | 21 (100.0%) |
| High School Diploma | 47 (100.0%) | 0 (0.0%) |
| College/Associate Degree | 9 (100.0%) | 0 (0.0%) |
| Bachelor's Degree or higher | 19 (55.9%) | 15 (44.1%) |
Occupancy by Age of Householder in Canal Point
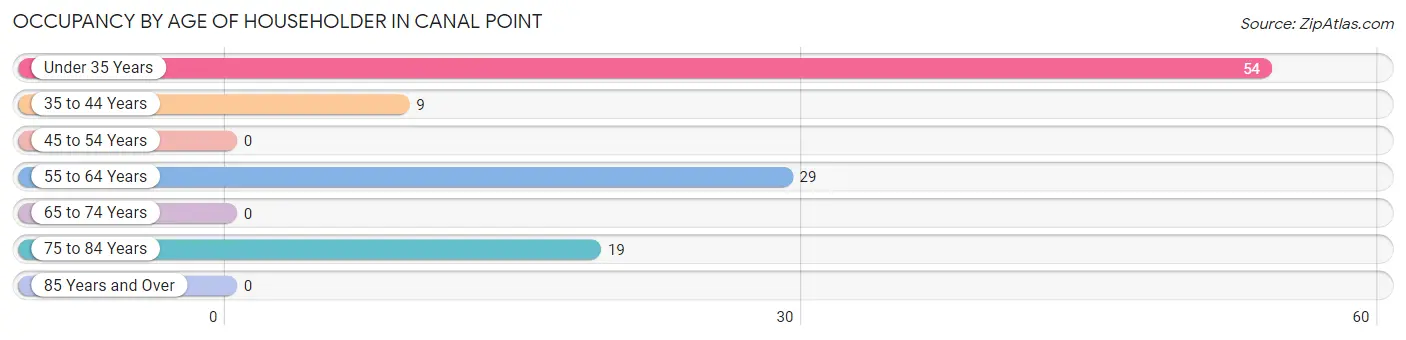
| Age Bracket | # Households | % Households |
| Under 35 Years | 54 | 48.6% |
| 35 to 44 Years | 9 | 8.1% |
| 45 to 54 Years | 0 | 0.0% |
| 55 to 64 Years | 29 | 26.1% |
| 65 to 74 Years | 0 | 0.0% |
| 75 to 84 Years | 19 | 17.1% |
| 85 Years and Over | 0 | 0.0% |
| Total | 111 | 100.0% |
Housing Finances in Canal Point
Median Income by Occupancy in Canal Point
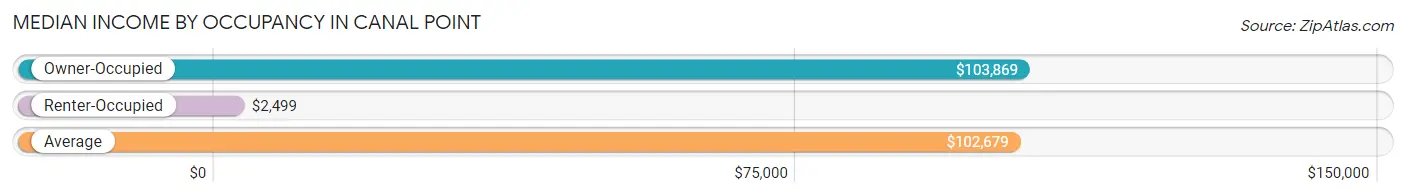
| Occupancy Type | # Households | Median Income |
| Owner-Occupied | 75 (67.6%) | $103,869 |
| Renter-Occupied | 36 (32.4%) | $2,499 |
| Average | 111 (100.0%) | $102,679 |
Occupancy by Householder Income Bracket in Canal Point
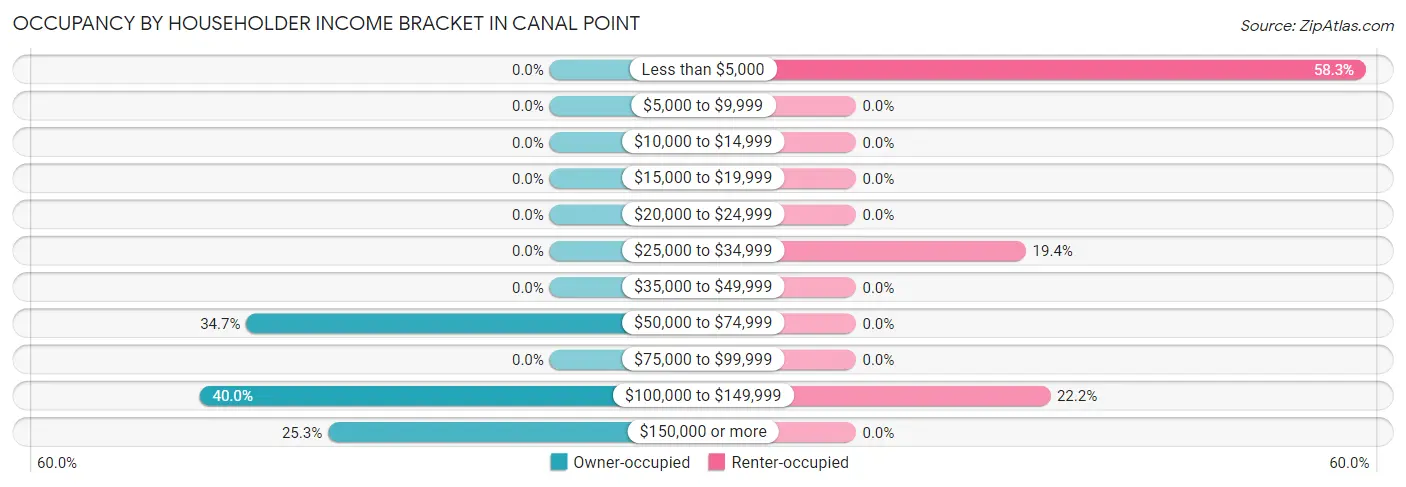
| Income Bracket | Owner-occupied | Renter-occupied |
| Less than $5,000 | 0 (0.0%) | 21 (58.3%) |
| $5,000 to $9,999 | 0 (0.0%) | 0 (0.0%) |
| $10,000 to $14,999 | 0 (0.0%) | 0 (0.0%) |
| $15,000 to $19,999 | 0 (0.0%) | 0 (0.0%) |
| $20,000 to $24,999 | 0 (0.0%) | 0 (0.0%) |
| $25,000 to $34,999 | 0 (0.0%) | 7 (19.4%) |
| $35,000 to $49,999 | 0 (0.0%) | 0 (0.0%) |
| $50,000 to $74,999 | 26 (34.7%) | 0 (0.0%) |
| $75,000 to $99,999 | 0 (0.0%) | 0 (0.0%) |
| $100,000 to $149,999 | 30 (40.0%) | 8 (22.2%) |
| $150,000 or more | 19 (25.3%) | 0 (0.0%) |
| Total | 75 (100.0%) | 36 (100.0%) |
Monthly Housing Cost Tiers in Canal Point
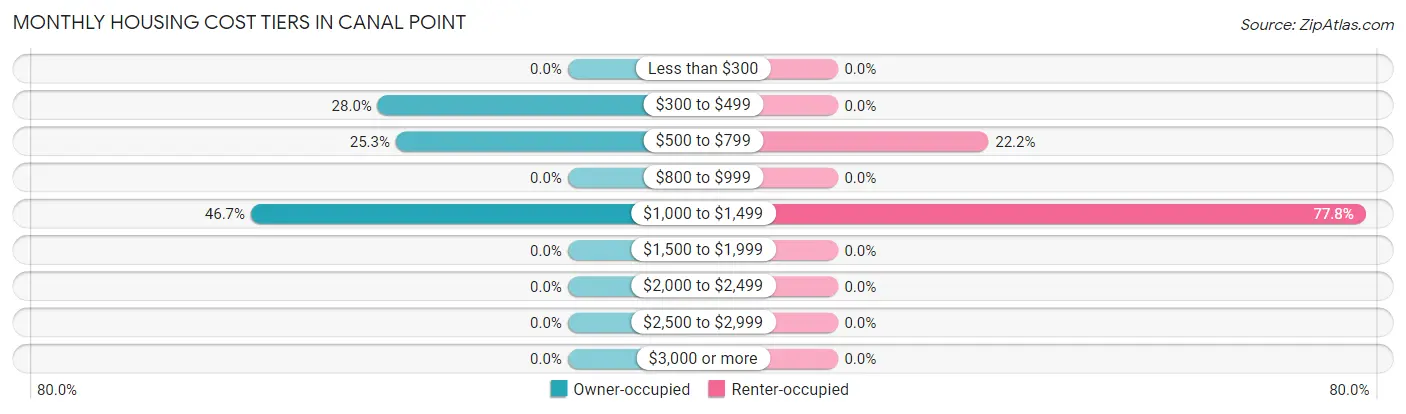
| Monthly Cost | Owner-occupied | Renter-occupied |
| Less than $300 | 0 (0.0%) | 0 (0.0%) |
| $300 to $499 | 21 (28.0%) | 0 (0.0%) |
| $500 to $799 | 19 (25.3%) | 8 (22.2%) |
| $800 to $999 | 0 (0.0%) | 0 (0.0%) |
| $1,000 to $1,499 | 35 (46.7%) | 28 (77.8%) |
| $1,500 to $1,999 | 0 (0.0%) | 0 (0.0%) |
| $2,000 to $2,499 | 0 (0.0%) | 0 (0.0%) |
| $2,500 to $2,999 | 0 (0.0%) | 0 (0.0%) |
| $3,000 or more | 0 (0.0%) | 0 (0.0%) |
| Total | 75 (100.0%) | 36 (100.0%) |
Physical Housing Characteristics in Canal Point
Housing Structures in Canal Point
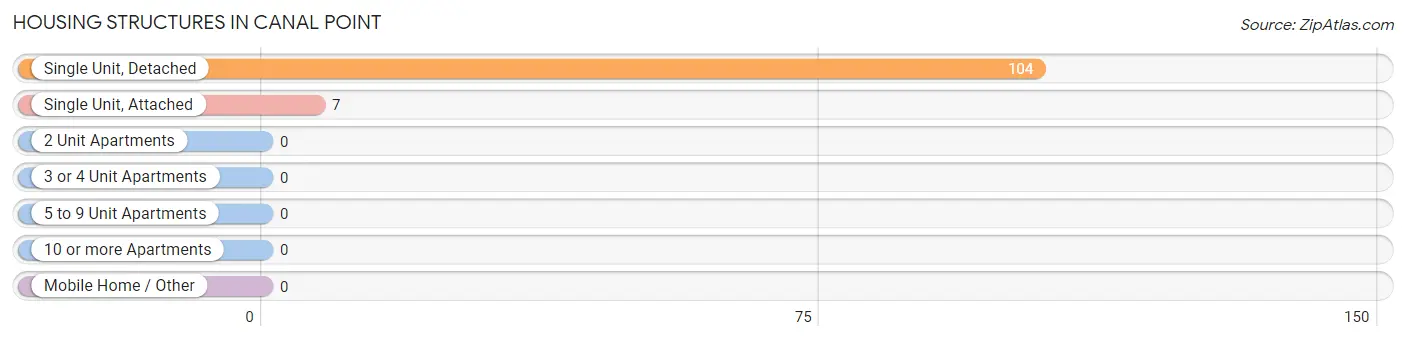
| Structure Type | # Housing Units | % Housing Units |
| Single Unit, Detached | 104 | 93.7% |
| Single Unit, Attached | 7 | 6.3% |
| 2 Unit Apartments | 0 | 0.0% |
| 3 or 4 Unit Apartments | 0 | 0.0% |
| 5 to 9 Unit Apartments | 0 | 0.0% |
| 10 or more Apartments | 0 | 0.0% |
| Mobile Home / Other | 0 | 0.0% |
| Total | 111 | 100.0% |
Housing Structures by Occupancy in Canal Point
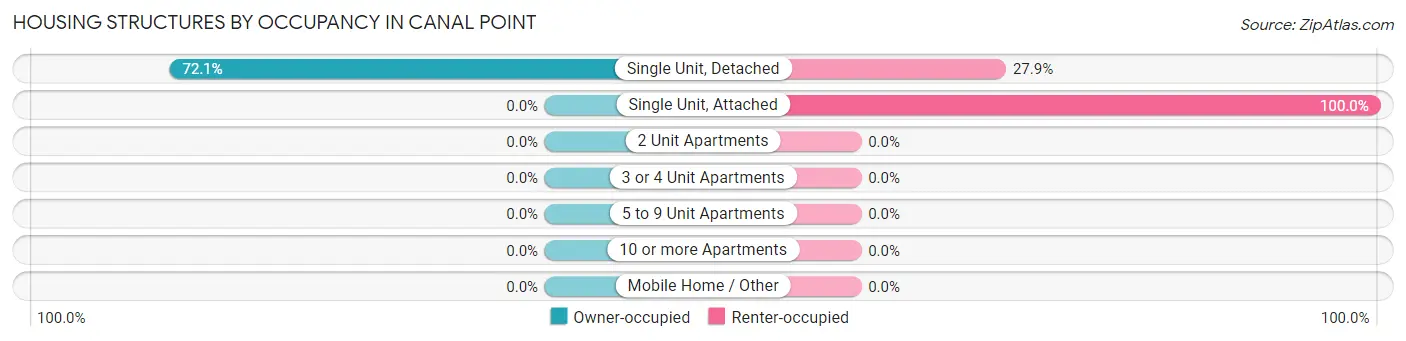
| Structure Type | Owner-occupied | Renter-occupied |
| Single Unit, Detached | 75 (72.1%) | 29 (27.9%) |
| Single Unit, Attached | 0 (0.0%) | 7 (100.0%) |
| 2 Unit Apartments | 0 (0.0%) | 0 (0.0%) |
| 3 or 4 Unit Apartments | 0 (0.0%) | 0 (0.0%) |
| 5 to 9 Unit Apartments | 0 (0.0%) | 0 (0.0%) |
| 10 or more Apartments | 0 (0.0%) | 0 (0.0%) |
| Mobile Home / Other | 0 (0.0%) | 0 (0.0%) |
| Total | 75 (67.6%) | 36 (32.4%) |
Housing Structures by Number of Rooms in Canal Point
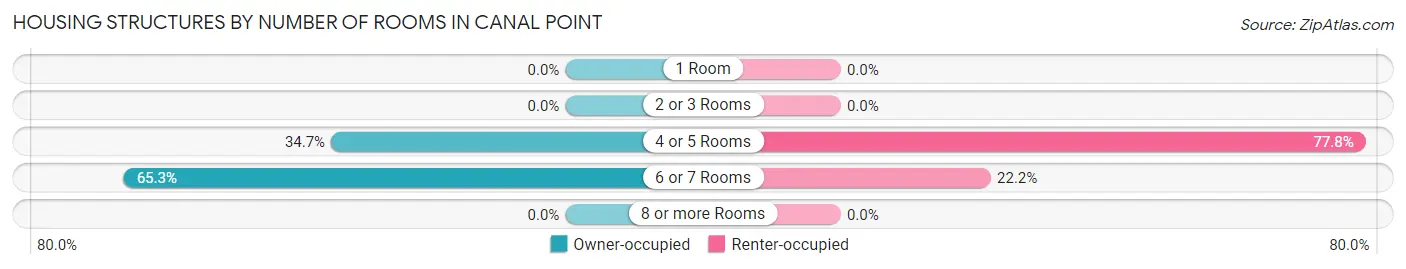
| Number of Rooms | Owner-occupied | Renter-occupied |
| 1 Room | 0 (0.0%) | 0 (0.0%) |
| 2 or 3 Rooms | 0 (0.0%) | 0 (0.0%) |
| 4 or 5 Rooms | 26 (34.7%) | 28 (77.8%) |
| 6 or 7 Rooms | 49 (65.3%) | 8 (22.2%) |
| 8 or more Rooms | 0 (0.0%) | 0 (0.0%) |
| Total | 75 (100.0%) | 36 (100.0%) |
Housing Structure by Heating Type in Canal Point
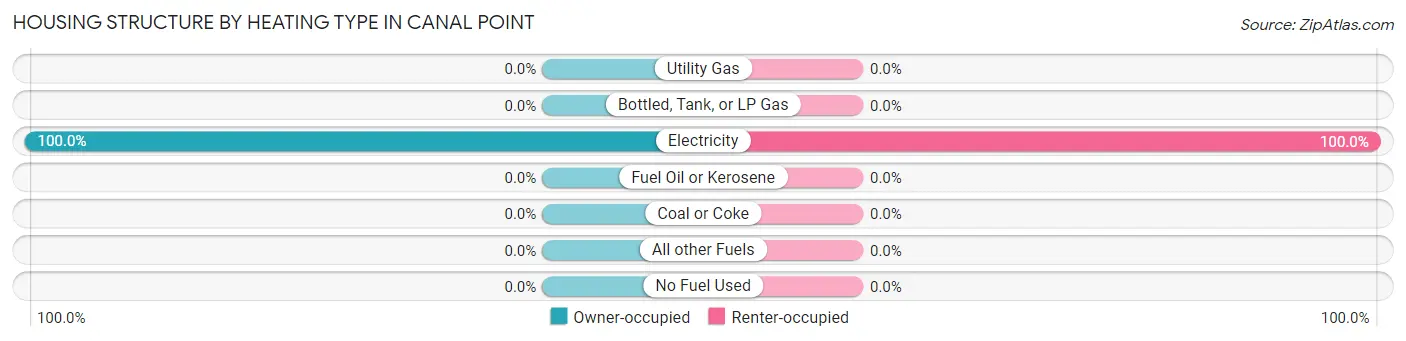
| Heating Type | Owner-occupied | Renter-occupied |
| Utility Gas | 0 (0.0%) | 0 (0.0%) |
| Bottled, Tank, or LP Gas | 0 (0.0%) | 0 (0.0%) |
| Electricity | 75 (100.0%) | 36 (100.0%) |
| Fuel Oil or Kerosene | 0 (0.0%) | 0 (0.0%) |
| Coal or Coke | 0 (0.0%) | 0 (0.0%) |
| All other Fuels | 0 (0.0%) | 0 (0.0%) |
| No Fuel Used | 0 (0.0%) | 0 (0.0%) |
| Total | 75 (100.0%) | 36 (100.0%) |
Household Vehicle Usage in Canal Point
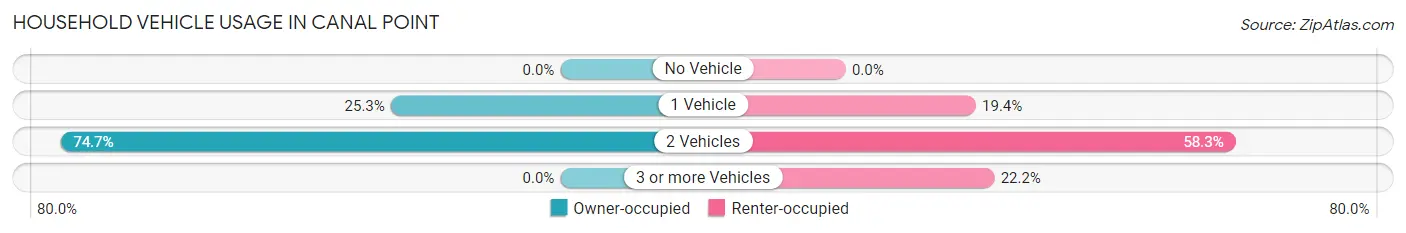
| Vehicles per Household | Owner-occupied | Renter-occupied |
| No Vehicle | 0 (0.0%) | 0 (0.0%) |
| 1 Vehicle | 19 (25.3%) | 7 (19.4%) |
| 2 Vehicles | 56 (74.7%) | 21 (58.3%) |
| 3 or more Vehicles | 0 (0.0%) | 8 (22.2%) |
| Total | 75 (100.0%) | 36 (100.0%) |
Real Estate & Mortgages in Canal Point
Real Estate and Mortgage Overview in Canal Point
| Characteristic | Without Mortgage | With Mortgage |
| Housing Units | 40 | 35 |
| Median Property Value | - | - |
| Median Household Income | - | - |
| Monthly Housing Costs | - | - |
| Real Estate Taxes | - | - |
Property Value by Mortgage Status in Canal Point
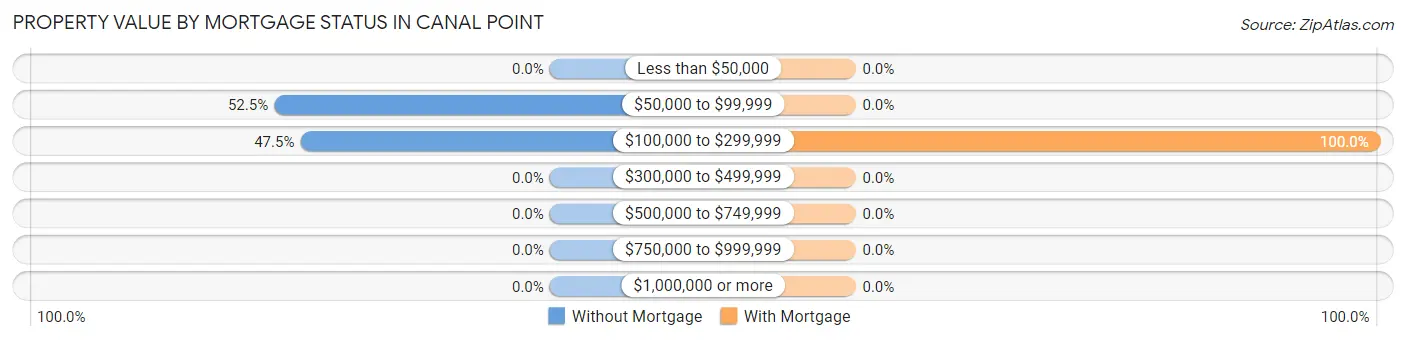
| Property Value | Without Mortgage | With Mortgage |
| Less than $50,000 | 0 (0.0%) | 0 (0.0%) |
| $50,000 to $99,999 | 21 (52.5%) | 0 (0.0%) |
| $100,000 to $299,999 | 19 (47.5%) | 35 (100.0%) |
| $300,000 to $499,999 | 0 (0.0%) | 0 (0.0%) |
| $500,000 to $749,999 | 0 (0.0%) | 0 (0.0%) |
| $750,000 to $999,999 | 0 (0.0%) | 0 (0.0%) |
| $1,000,000 or more | 0 (0.0%) | 0 (0.0%) |
| Total | 40 (100.0%) | 35 (100.0%) |
Household Income by Mortgage Status in Canal Point
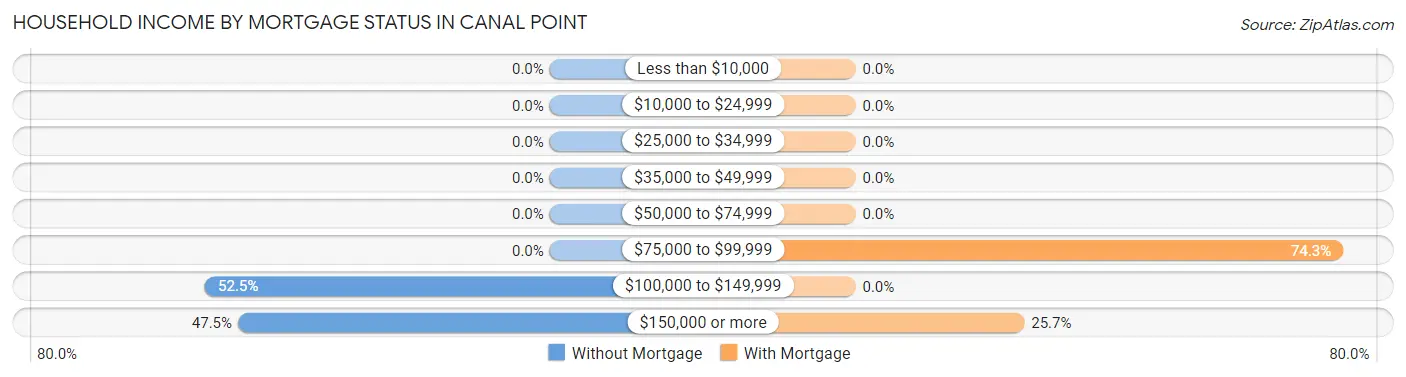
| Household Income | Without Mortgage | With Mortgage |
| Less than $10,000 | 0 (0.0%) | 0 (0.0%) |
| $10,000 to $24,999 | 0 (0.0%) | 0 (0.0%) |
| $25,000 to $34,999 | 0 (0.0%) | 0 (0.0%) |
| $35,000 to $49,999 | 0 (0.0%) | 0 (0.0%) |
| $50,000 to $74,999 | 0 (0.0%) | 0 (0.0%) |
| $75,000 to $99,999 | 0 (0.0%) | 26 (74.3%) |
| $100,000 to $149,999 | 21 (52.5%) | 0 (0.0%) |
| $150,000 or more | 19 (47.5%) | 9 (25.7%) |
| Total | 40 (100.0%) | 35 (100.0%) |
Property Value to Household Income Ratio in Canal Point
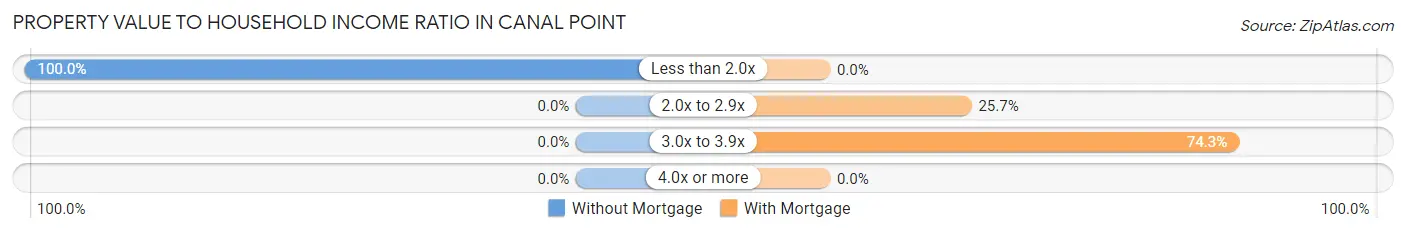
| Value-to-Income Ratio | Without Mortgage | With Mortgage |
| Less than 2.0x | 40 (100.0%) | 0 (0.0%) |
| 2.0x to 2.9x | 0 (0.0%) | 9 (25.7%) |
| 3.0x to 3.9x | 0 (0.0%) | 26 (74.3%) |
| 4.0x or more | 0 (0.0%) | 0 (0.0%) |
| Total | 40 (100.0%) | 35 (100.0%) |
Real Estate Taxes by Mortgage Status in Canal Point
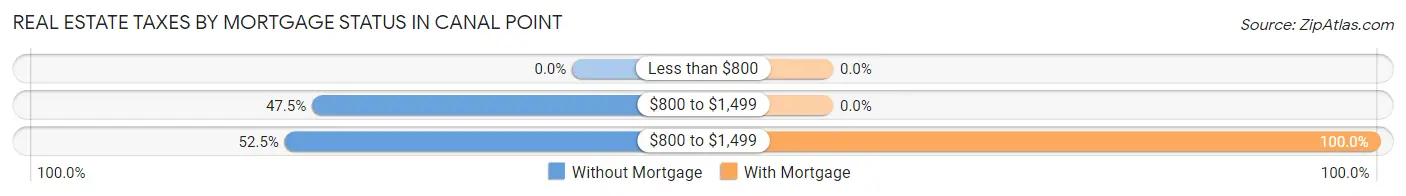
| Property Taxes | Without Mortgage | With Mortgage |
| Less than $800 | 0 (0.0%) | 0 (0.0%) |
| $800 to $1,499 | 19 (47.5%) | 0 (0.0%) |
| $800 to $1,499 | 21 (52.5%) | 35 (100.0%) |
| Total | 40 (100.0%) | 35 (100.0%) |
Health & Disability in Canal Point
Health Insurance Coverage by Age in Canal Point
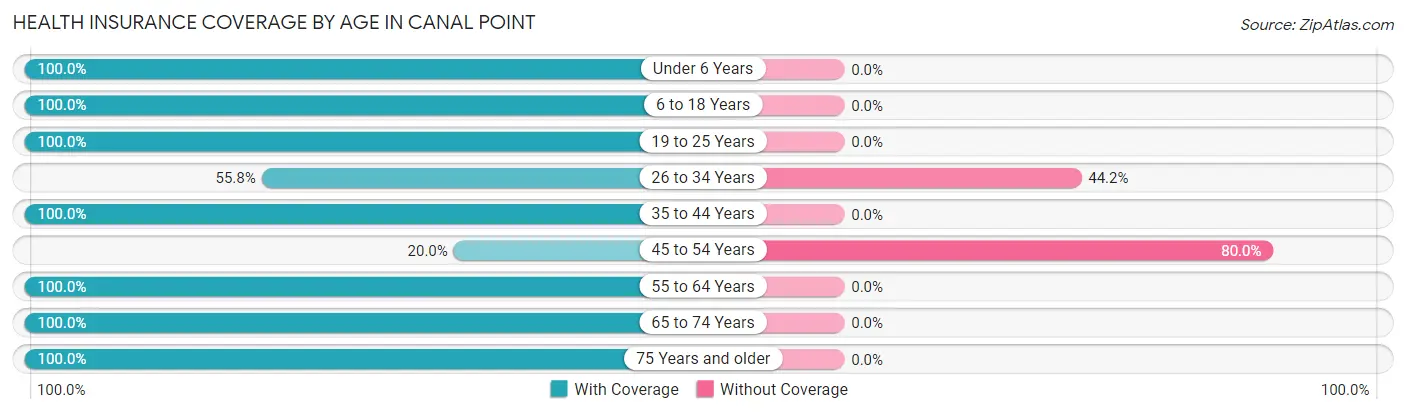
| Age Bracket | With Coverage | Without Coverage |
| Under 6 Years | 23 (100.0%) | 0 (0.0%) |
| 6 to 18 Years | 83 (100.0%) | 0 (0.0%) |
| 19 to 25 Years | 48 (100.0%) | 0 (0.0%) |
| 26 to 34 Years | 48 (55.8%) | 38 (44.2%) |
| 35 to 44 Years | 9 (100.0%) | 0 (0.0%) |
| 45 to 54 Years | 10 (20.0%) | 40 (80.0%) |
| 55 to 64 Years | 102 (100.0%) | 0 (0.0%) |
| 65 to 74 Years | 17 (100.0%) | 0 (0.0%) |
| 75 Years and older | 19 (100.0%) | 0 (0.0%) |
| Total | 359 (82.2%) | 78 (17.8%) |
Health Insurance Coverage by Citizenship Status in Canal Point
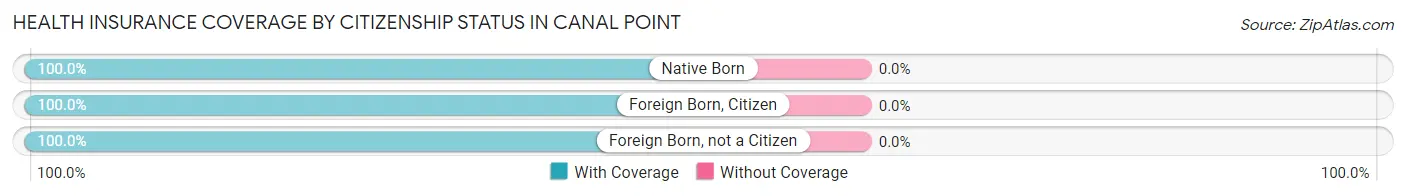
| Citizenship Status | With Coverage | Without Coverage |
| Native Born | 23 (100.0%) | 0 (0.0%) |
| Foreign Born, Citizen | 83 (100.0%) | 0 (0.0%) |
| Foreign Born, not a Citizen | 48 (100.0%) | 0 (0.0%) |
Health Insurance Coverage by Household Income in Canal Point
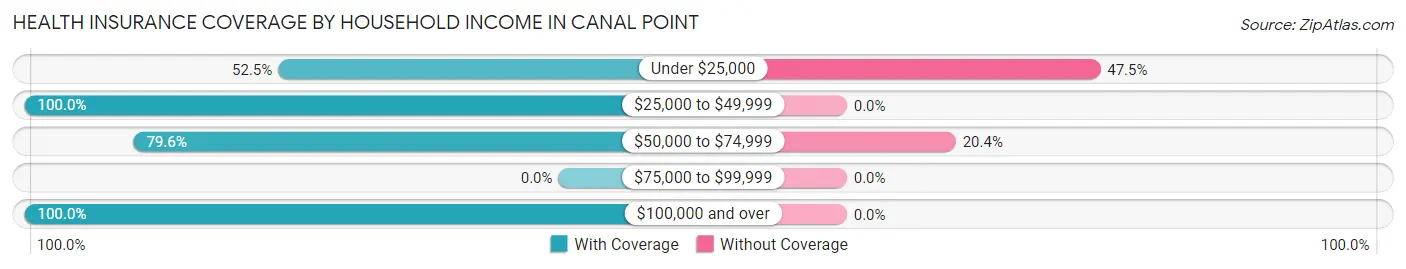
| Household Income | With Coverage | Without Coverage |
| Under $25,000 | 42 (52.5%) | 38 (47.5%) |
| $25,000 to $49,999 | 7 (100.0%) | 0 (0.0%) |
| $50,000 to $74,999 | 156 (79.6%) | 40 (20.4%) |
| $75,000 to $99,999 | 0 (0.0%) | 0 (0.0%) |
| $100,000 and over | 154 (100.0%) | 0 (0.0%) |
Public vs Private Health Insurance Coverage by Age in Canal Point
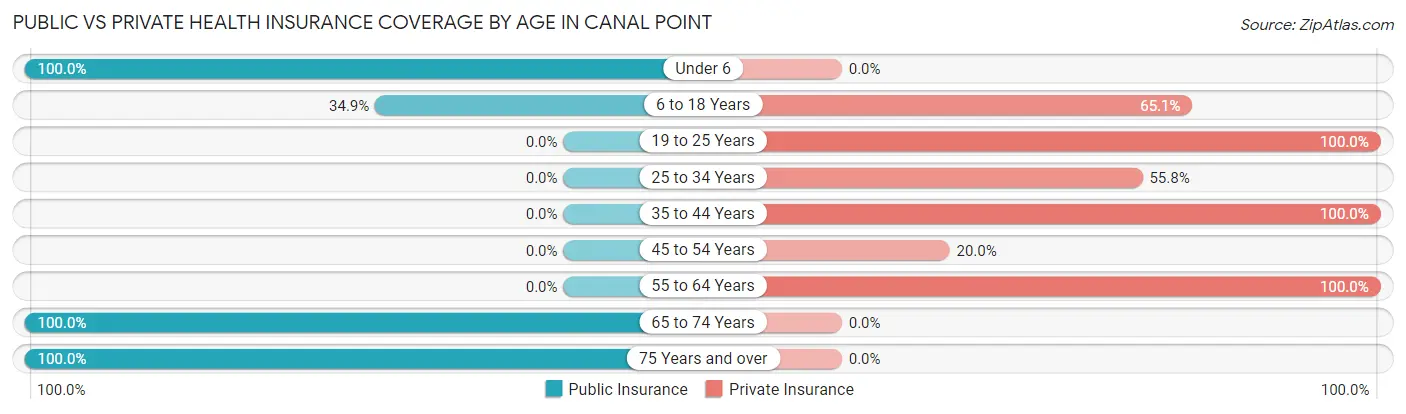
| Age Bracket | Public Insurance | Private Insurance |
| Under 6 | 23 (100.0%) | 0 (0.0%) |
| 6 to 18 Years | 29 (34.9%) | 54 (65.1%) |
| 19 to 25 Years | 0 (0.0%) | 48 (100.0%) |
| 25 to 34 Years | 0 (0.0%) | 48 (55.8%) |
| 35 to 44 Years | 0 (0.0%) | 9 (100.0%) |
| 45 to 54 Years | 0 (0.0%) | 10 (20.0%) |
| 55 to 64 Years | 0 (0.0%) | 102 (100.0%) |
| 65 to 74 Years | 17 (100.0%) | 0 (0.0%) |
| 75 Years and over | 19 (100.0%) | 0 (0.0%) |
| Total | 88 (20.1%) | 271 (62.0%) |
Disability Status by Sex by Age in Canal Point
| Age Bracket | Male | Female |
| Under 5 Years | 0 (0.0%) | 0 (0.0%) |
| 5 to 17 Years | 0 (0.0%) | 0 (0.0%) |
| 18 to 34 Years | 0 (0.0%) | 0 (0.0%) |
| 35 to 64 Years | 0 (0.0%) | 0 (0.0%) |
| 65 to 74 Years | 0 (0.0%) | 0 (0.0%) |
| 75 Years and over | 0 (0.0%) | 0 (0.0%) |
Disability Class by Sex by Age in Canal Point
Disability Class: Hearing Difficulty
| Age Bracket | Male | Female |
| Under 5 Years | 0 (0.0%) | 0 (0.0%) |
| 5 to 17 Years | 0 (0.0%) | 0 (0.0%) |
| 18 to 34 Years | 0 (0.0%) | 0 (0.0%) |
| 35 to 64 Years | 0 (0.0%) | 0 (0.0%) |
| 65 to 74 Years | 0 (0.0%) | 0 (0.0%) |
| 75 Years and over | 0 (0.0%) | 0 (0.0%) |
Disability Class: Vision Difficulty
| Age Bracket | Male | Female |
| Under 5 Years | 0 (0.0%) | 0 (0.0%) |
| 5 to 17 Years | 0 (0.0%) | 0 (0.0%) |
| 18 to 34 Years | 0 (0.0%) | 0 (0.0%) |
| 35 to 64 Years | 0 (0.0%) | 0 (0.0%) |
| 65 to 74 Years | 0 (0.0%) | 0 (0.0%) |
| 75 Years and over | 0 (0.0%) | 0 (0.0%) |
Disability Class: Cognitive Difficulty
| Age Bracket | Male | Female |
| 5 to 17 Years | 0 (0.0%) | 0 (0.0%) |
| 18 to 34 Years | 0 (0.0%) | 0 (0.0%) |
| 35 to 64 Years | 0 (0.0%) | 0 (0.0%) |
| 65 to 74 Years | 0 (0.0%) | 0 (0.0%) |
| 75 Years and over | 0 (0.0%) | 0 (0.0%) |
Disability Class: Ambulatory Difficulty
| Age Bracket | Male | Female |
| 5 to 17 Years | 0 (0.0%) | 0 (0.0%) |
| 18 to 34 Years | 0 (0.0%) | 0 (0.0%) |
| 35 to 64 Years | 0 (0.0%) | 0 (0.0%) |
| 65 to 74 Years | 0 (0.0%) | 0 (0.0%) |
| 75 Years and over | 0 (0.0%) | 0 (0.0%) |
Disability Class: Self-Care Difficulty
| Age Bracket | Male | Female |
| 5 to 17 Years | 0 (0.0%) | 0 (0.0%) |
| 18 to 34 Years | 0 (0.0%) | 0 (0.0%) |
| 35 to 64 Years | 0 (0.0%) | 0 (0.0%) |
| 65 to 74 Years | 0 (0.0%) | 0 (0.0%) |
| 75 Years and over | 0 (0.0%) | 0 (0.0%) |
Technology Access in Canal Point
Computing Device Access in Canal Point
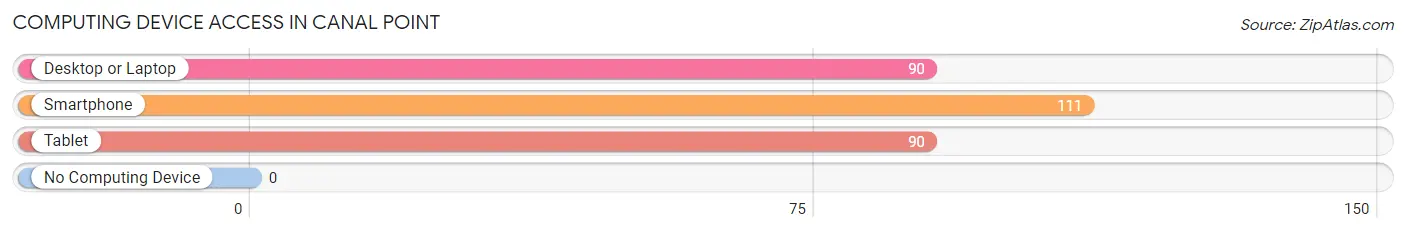
| Device Type | # Households | % Households |
| Desktop or Laptop | 90 | 81.1% |
| Smartphone | 111 | 100.0% |
| Tablet | 90 | 81.1% |
| No Computing Device | 0 | 0.0% |
| Total | 111 | 100.0% |
Internet Access in Canal Point
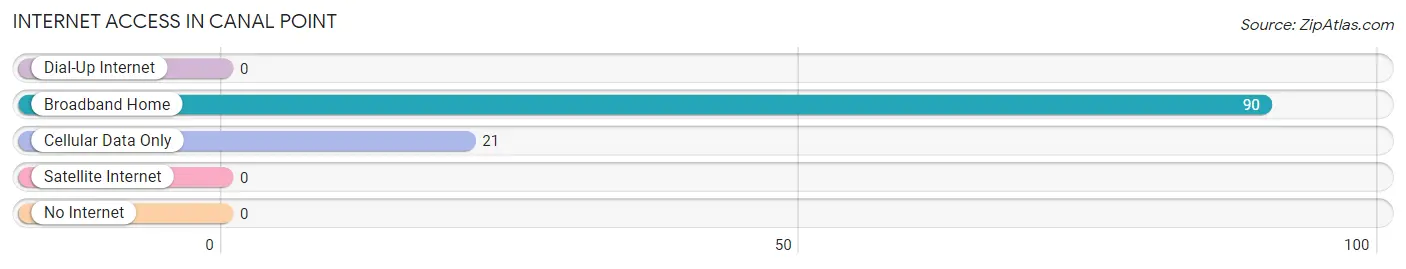
| Internet Type | # Households | % Households |
| Dial-Up Internet | 0 | 0.0% |
| Broadband Home | 90 | 81.1% |
| Cellular Data Only | 21 | 18.9% |
| Satellite Internet | 0 | 0.0% |
| No Internet | 0 | 0.0% |
| Total | 111 | 100.0% |
Canal Point Summary
Canal Point is a small unincorporated community located in Palm Beach County, Florida, United States. It is situated on the eastern shore of Lake Okeechobee, approximately 15 miles south of the city of Pahokee. The population of Canal Point was 1,890 at the 2010 census.
History
Canal Point was first settled in the late 19th century by settlers from the Bahamas. The settlement was originally known as “The Narrows” due to its location at the narrowest point of the lake. In the early 1900s, the Florida East Coast Railway built a line through the area, connecting it to the rest of the state. The town was officially incorporated in 1925 and renamed Canal Point.
The town was a major hub for the sugar industry in the early 20th century. The Florida Sugar Cane Growers Cooperative was established in Canal Point in 1927, and the town was home to several sugar mills and refineries. The town also served as a major shipping port for the sugar industry, with ships carrying sugar to ports around the world.
Geography
Canal Point is located at 26°51'25" North, 80°41'17" West (26.856944, -80.688056). The town is situated on the eastern shore of Lake Okeechobee, approximately 15 miles south of the city of Pahokee. The town is bordered by the lake to the east, the town of Pahokee to the north, and the town of South Bay to the south.
The town has a total area of 1.2 square miles, all of which is land. The terrain is mostly flat, with some low hills in the northern part of town. The town is located in a humid subtropical climate zone, with hot, humid summers and mild winters.
Economy
Canal Point’s economy is largely based on agriculture. The town is home to several sugar mills and refineries, as well as a number of other agricultural businesses. The town is also home to a number of small businesses, including restaurants, retail stores, and service providers.
The town is also home to a number of tourist attractions, including the Lake Okeechobee Scenic Trail, the Lake Okeechobee Lighthouse, and the Lake Okeechobee Airboat Tours.
Demographics
As of the 2010 census, there were 1,890 people, 690 households, and 486 families residing in Canal Point. The population density was 1,567.2 people per square mile. The racial makeup of the town was 79.2% White, 15.2% African American, 0.5% Native American, 0.7% Asian, 0.1% Pacific Islander, 2.2% from other races, and 2.2% from two or more races. Hispanic or Latino of any race were 8.2% of the population.
The median income for a household in Canal Point was $35,938, and the median income for a family was $41,250. Males had a median income of $30,000 versus $21,250 for females. The per capita income for the town was $15,938. About 14.2% of families and 17.2% of the population were below the poverty line, including 25.2% of those under age 18 and 11.2% of those age 65 or over.
Common Questions
What is Per Capita Income in Canal Point?
Per Capita income in Canal Point is $22,837.
What is the Median Family Income in Canal Point?
Median Family Income in Canal Point is $103,095.
What is the Median Household income in Canal Point?
Median Household Income in Canal Point is $102,679.
What is Inequality or Gini Index in Canal Point?
Inequality or Gini Index in Canal Point is 0.35.
What is the Total Population of Canal Point?
Total Population of Canal Point is 437.
What is the Total Male Population of Canal Point?
Total Male Population of Canal Point is 206.
What is the Total Female Population of Canal Point?
Total Female Population of Canal Point is 231.
What is the Ratio of Males per 100 Females in Canal Point?
There are 89.18 Males per 100 Females in Canal Point.
What is the Ratio of Females per 100 Males in Canal Point?
There are 112.14 Females per 100 Males in Canal Point.
What is the Median Population Age in Canal Point?
Median Population Age in Canal Point is 32.9 Years.
What is the Average Family Size in Canal Point
Average Family Size in Canal Point is 4.1 People.
What is the Average Household Size in Canal Point
Average Household Size in Canal Point is 3.9 People.
How Large is the Labor Force in Canal Point?
There are 276 People in the Labor Forcein in Canal Point.
What is the Percentage of People in the Labor Force in Canal Point?
77.1% of People are in the Labor Force in Canal Point.
What is the Unemployment Rate in Canal Point?
Unemployment Rate in Canal Point is 14.5%.