Layton, FL Map & Demographics
Layton Map
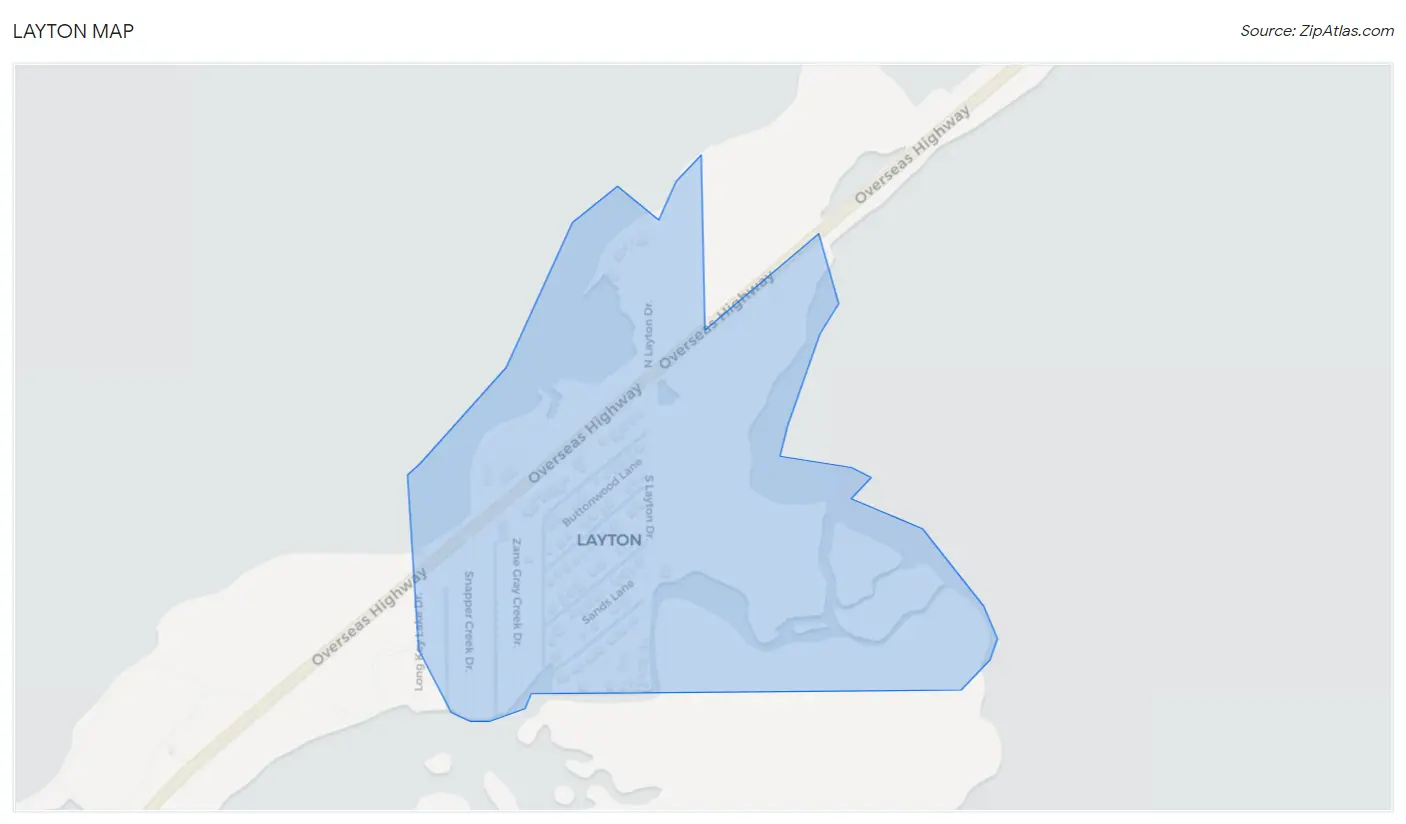
Layton Overview
$33,964
PER CAPITA INCOME
$68,250
AVG FAMILY INCOME
$63,542
AVG HOUSEHOLD INCOME
11.8%
WAGE / INCOME GAP [ % ]
88.2¢/ $1
WAGE / INCOME GAP [ $ ]
0.44
INEQUALITY / GINI INDEX
144
TOTAL POPULATION
79
MALE POPULATION
65
FEMALE POPULATION
121.54
MALES / 100 FEMALES
82.28
FEMALES / 100 MALES
52.2
MEDIAN AGE
3.4
AVG FAMILY SIZE
2.4
AVG HOUSEHOLD SIZE
73
LABOR FORCE [ PEOPLE ]
53.7%
PERCENT IN LABOR FORCE
Income in Layton
Income Overview in Layton
Per Capita Income in Layton is $33,964, while median incomes of families and households are $68,250 and $63,542 respectively.
| Characteristic | Number | Measure |
| Per Capita Income | 144 | $33,964 |
| Median Family Income | 35 | $68,250 |
| Mean Family Income | 35 | $98,560 |
| Median Household Income | 59 | $63,542 |
| Mean Household Income | 59 | $76,508 |
| Income Deficit | 35 | $0 |
| Wage / Income Gap (%) | 144 | 11.78% |
| Wage / Income Gap ($) | 144 | 88.22¢ per $1 |
| Gini / Inequality Index | 144 | 0.44 |
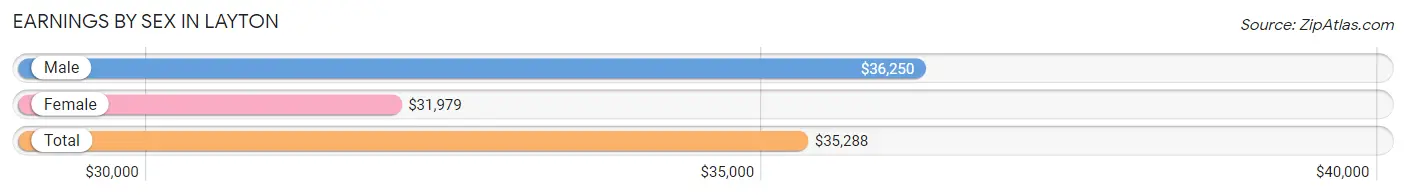
Earnings by Sex in Layton
Average Earnings in Layton are $35,288, $36,250 for men and $31,979 for women, a difference of 11.8%.
| Sex | Number | Average Earnings |
| Male | 38 (52.0%) | $36,250 |
| Female | 35 (47.9%) | $31,979 |
| Total | 73 (100.0%) | $35,288 |
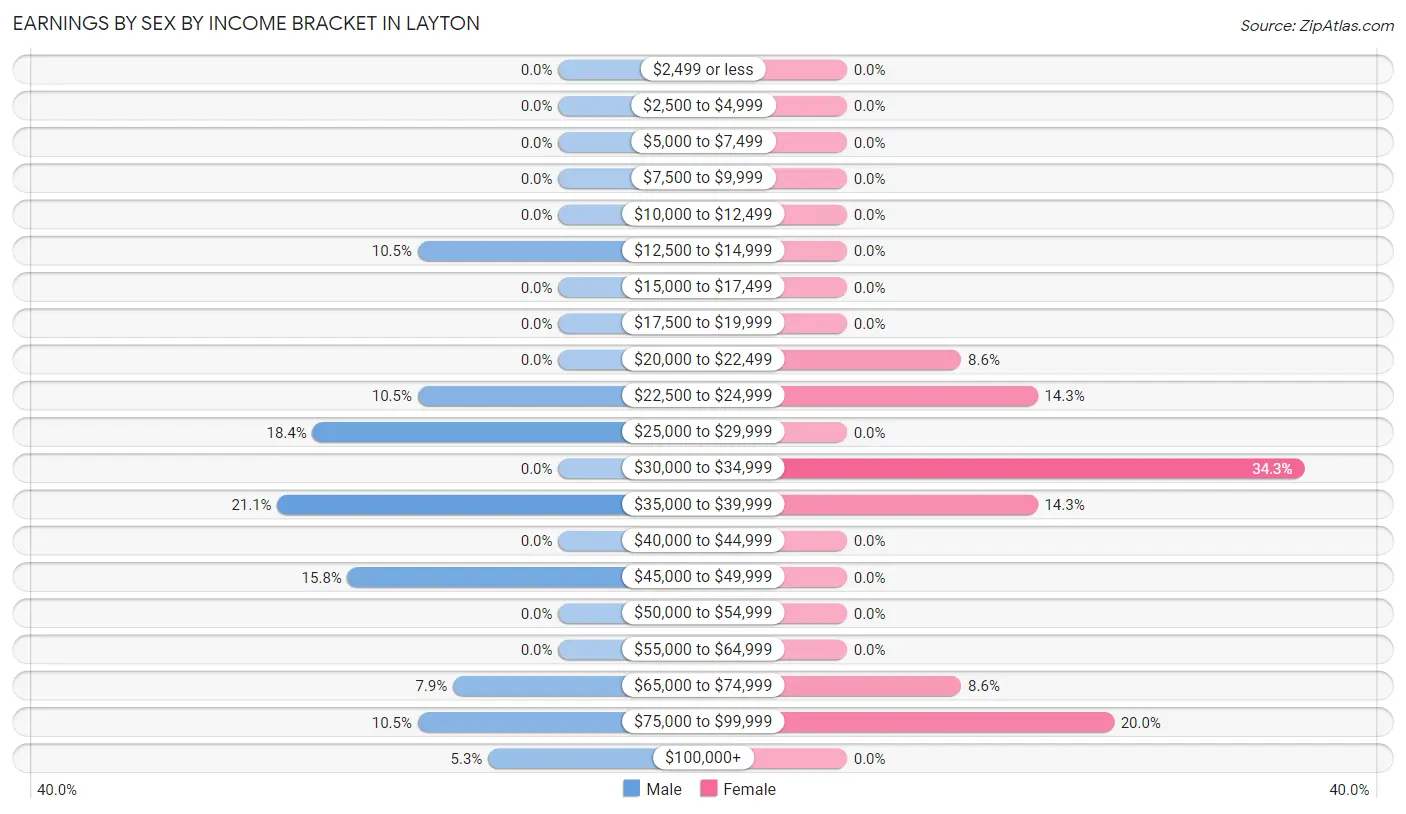
Earnings by Sex by Income Bracket in Layton
The most common earnings brackets in Layton are $35,000 to $39,999 for men (8 | 21.0%) and $30,000 to $34,999 for women (12 | 34.3%).
| Income | Male | Female |
| $2,499 or less | 0 (0.0%) | 0 (0.0%) |
| $2,500 to $4,999 | 0 (0.0%) | 0 (0.0%) |
| $5,000 to $7,499 | 0 (0.0%) | 0 (0.0%) |
| $7,500 to $9,999 | 0 (0.0%) | 0 (0.0%) |
| $10,000 to $12,499 | 0 (0.0%) | 0 (0.0%) |
| $12,500 to $14,999 | 4 (10.5%) | 0 (0.0%) |
| $15,000 to $17,499 | 0 (0.0%) | 0 (0.0%) |
| $17,500 to $19,999 | 0 (0.0%) | 0 (0.0%) |
| $20,000 to $22,499 | 0 (0.0%) | 3 (8.6%) |
| $22,500 to $24,999 | 4 (10.5%) | 5 (14.3%) |
| $25,000 to $29,999 | 7 (18.4%) | 0 (0.0%) |
| $30,000 to $34,999 | 0 (0.0%) | 12 (34.3%) |
| $35,000 to $39,999 | 8 (21.0%) | 5 (14.3%) |
| $40,000 to $44,999 | 0 (0.0%) | 0 (0.0%) |
| $45,000 to $49,999 | 6 (15.8%) | 0 (0.0%) |
| $50,000 to $54,999 | 0 (0.0%) | 0 (0.0%) |
| $55,000 to $64,999 | 0 (0.0%) | 0 (0.0%) |
| $65,000 to $74,999 | 3 (7.9%) | 3 (8.6%) |
| $75,000 to $99,999 | 4 (10.5%) | 7 (20.0%) |
| $100,000+ | 2 (5.3%) | 0 (0.0%) |
| Total | 38 (100.0%) | 35 (100.0%) |
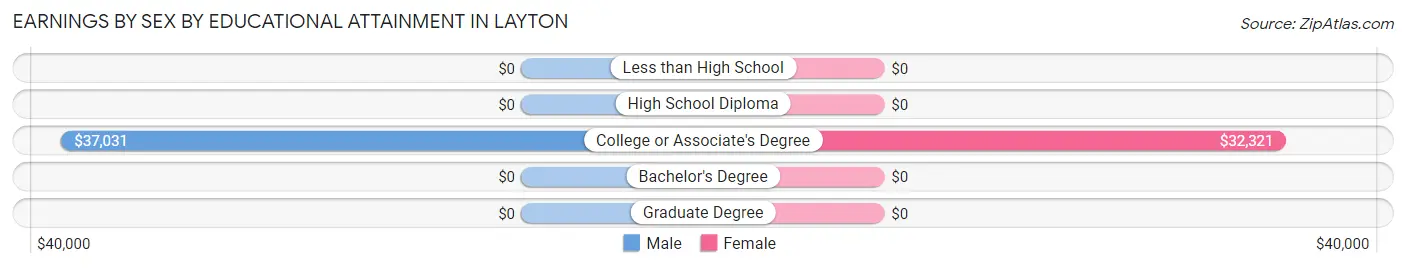
Earnings by Sex by Educational Attainment in Layton
Average earnings in Layton are $36,250 for men and $31,979 for women, a difference of 11.8%. Men with an educational attainment of college or associate's degree enjoy the highest average annual earnings of $37,031, while those with college or associate's degree education earn the least with $37,031. Women with an educational attainment of college or associate's degree earn the most with the average annual earnings of $32,321, while those with college or associate's degree education have the smallest earnings of $32,321.
| Educational Attainment | Male Income | Female Income |
| Less than High School | - | - |
| High School Diploma | - | - |
| College or Associate's Degree | $37,031 | $32,321 |
| Bachelor's Degree | - | - |
| Graduate Degree | - | - |
| Total | $36,250 | $31,979 |
Family Income in Layton
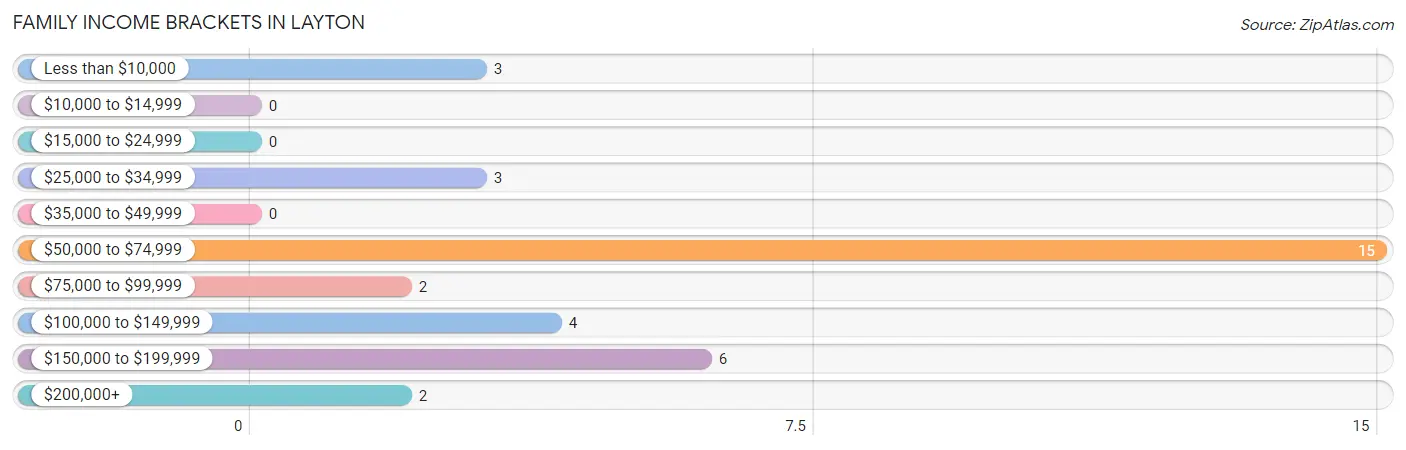
Family Income Brackets in Layton
According to the Layton family income data, there are 15 families falling into the $50,000 to $74,999 income range, which is the most common income bracket and makes up 42.9% of all families.
| Income Bracket | # Families | % Families |
| Less than $10,000 | 3 | 8.6% |
| $10,000 to $14,999 | 0 | 0.0% |
| $15,000 to $24,999 | 0 | 0.0% |
| $25,000 to $34,999 | 3 | 8.6% |
| $35,000 to $49,999 | 0 | 0.0% |
| $50,000 to $74,999 | 15 | 42.9% |
| $75,000 to $99,999 | 2 | 5.7% |
| $100,000 to $149,999 | 4 | 11.4% |
| $150,000 to $199,999 | 6 | 17.1% |
| $200,000+ | 2 | 5.7% |
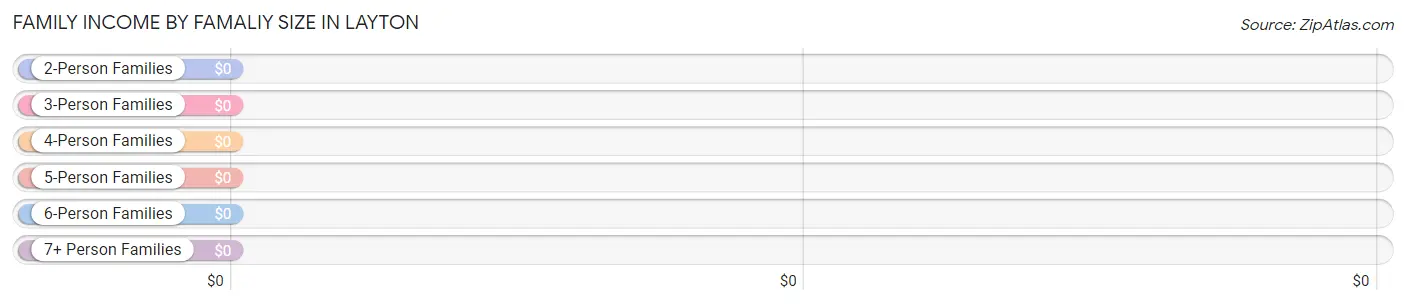
Family Income by Famaliy Size in Layton
| Income Bracket | # Families | Median Income |
| 2-Person Families | 17 (48.6%) | $0 |
| 3-Person Families | 11 (31.4%) | $0 |
| 4-Person Families | 3 (8.6%) | $0 |
| 5-Person Families | 4 (11.4%) | $0 |
| 6-Person Families | 0 (0.0%) | $0 |
| 7+ Person Families | 0 (0.0%) | $0 |
| Total | 35 (100.0%) | $68,250 |
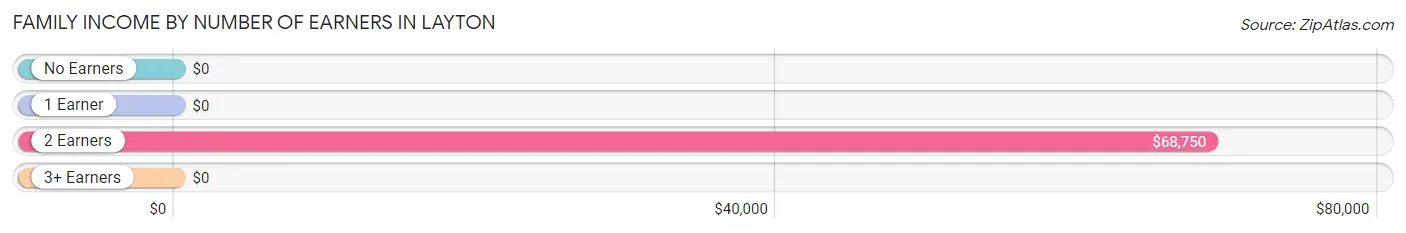
Family Income by Number of Earners in Layton
| Number of Earners | # Families | Median Income |
| No Earners | 8 (22.9%) | $0 |
| 1 Earner | 8 (22.9%) | $0 |
| 2 Earners | 13 (37.1%) | $68,750 |
| 3+ Earners | 6 (17.1%) | $0 |
| Total | 35 (100.0%) | $68,250 |
Household Income in Layton
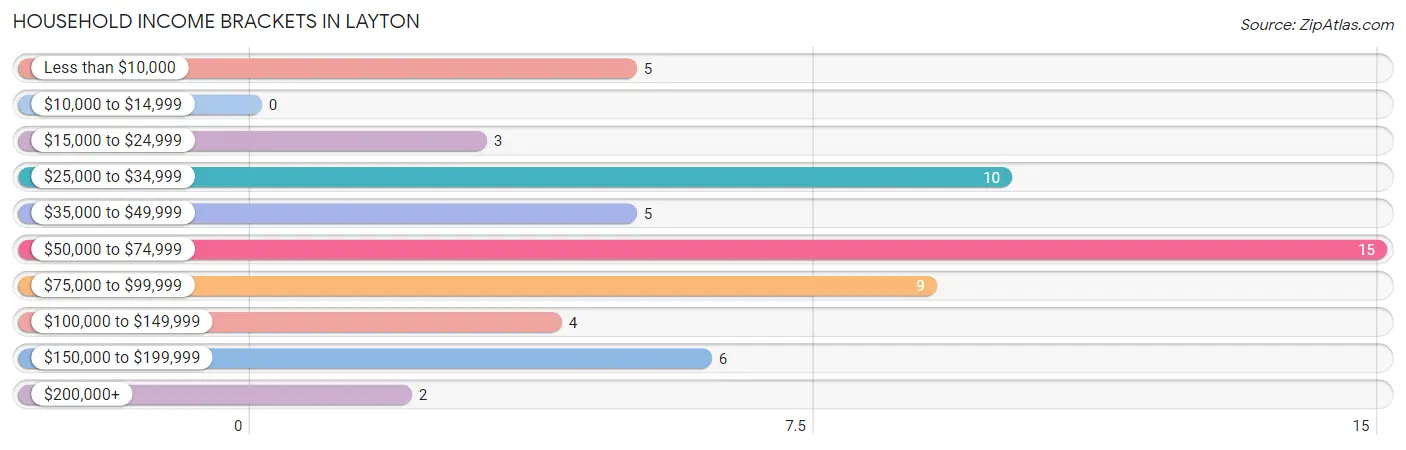
Household Income Brackets in Layton
With 15 households falling in the category, the $50,000 to $74,999 income range is the most frequent in Layton, accounting for 25.4% of all households.
| Income Bracket | # Households | % Households |
| Less than $10,000 | 5 | 8.5% |
| $10,000 to $14,999 | 0 | 0.0% |
| $15,000 to $24,999 | 3 | 5.1% |
| $25,000 to $34,999 | 10 | 16.9% |
| $35,000 to $49,999 | 5 | 8.5% |
| $50,000 to $74,999 | 15 | 25.4% |
| $75,000 to $99,999 | 9 | 15.3% |
| $100,000 to $149,999 | 4 | 6.8% |
| $150,000 to $199,999 | 6 | 10.2% |
| $200,000+ | 2 | 3.4% |
Household Income by Householder Age in Layton
The median household income in Layton is $63,542, with the highest median household income of $63,750 found in the 65+ years age bracket for the primary householder. A total of 24 households (40.7%) fall into this category.
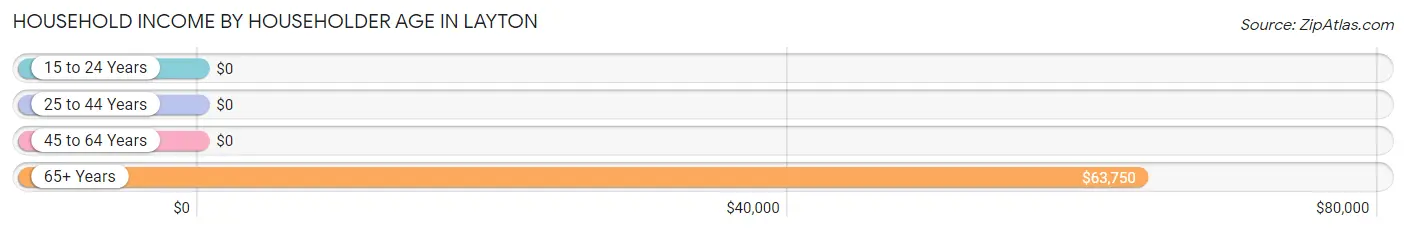
| Income Bracket | # Households | Median Income |
| 15 to 24 Years | 0 (0.0%) | $0 |
| 25 to 44 Years | 12 (20.3%) | $0 |
| 45 to 64 Years | 23 (39.0%) | $0 |
| 65+ Years | 24 (40.7%) | $63,750 |
| Total | 59 (100.0%) | $63,542 |
Poverty in Layton
Income Below Poverty by Sex and Age in Layton
With 6.3% poverty level for males and 6.1% for females among the residents of Layton, 65 to 74 year old males and 55 to 64 year old females are the most vulnerable to poverty, with 3 males (17.6%) and 4 females (22.2%) in their respective age groups living below the poverty level.
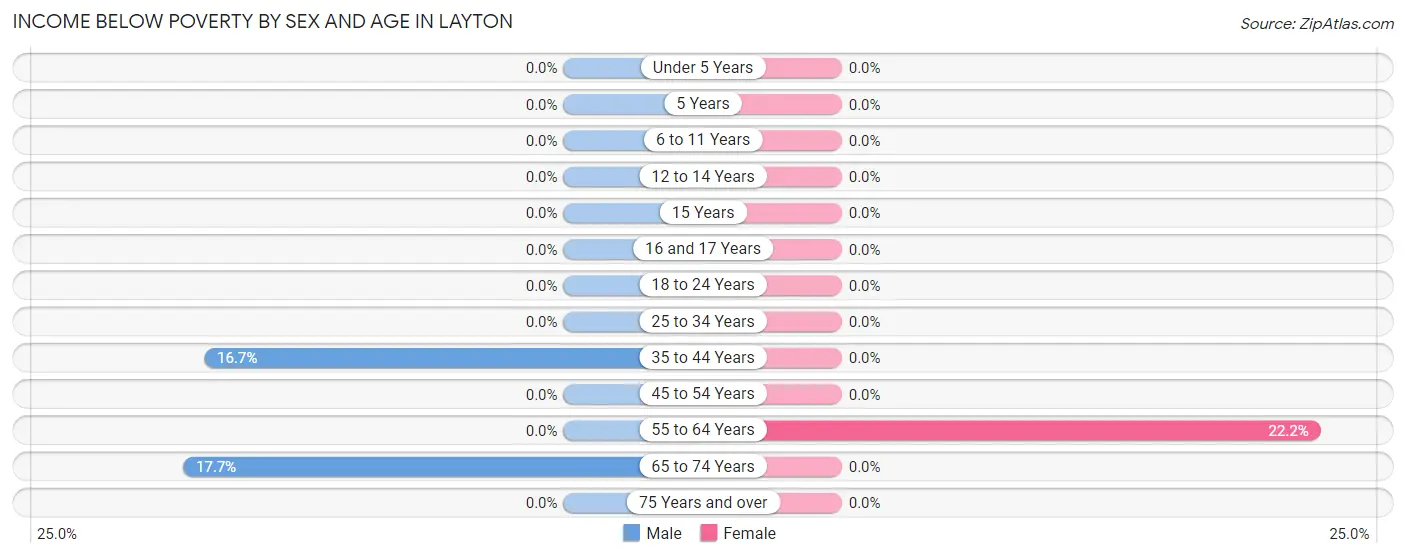
| Age Bracket | Male | Female |
| Under 5 Years | 0 (0.0%) | 0 (0.0%) |
| 5 Years | 0 (0.0%) | 0 (0.0%) |
| 6 to 11 Years | 0 (0.0%) | 0 (0.0%) |
| 12 to 14 Years | 0 (0.0%) | 0 (0.0%) |
| 15 Years | 0 (0.0%) | 0 (0.0%) |
| 16 and 17 Years | 0 (0.0%) | 0 (0.0%) |
| 18 to 24 Years | 0 (0.0%) | 0 (0.0%) |
| 25 to 34 Years | 0 (0.0%) | 0 (0.0%) |
| 35 to 44 Years | 2 (16.7%) | 0 (0.0%) |
| 45 to 54 Years | 0 (0.0%) | 0 (0.0%) |
| 55 to 64 Years | 0 (0.0%) | 4 (22.2%) |
| 65 to 74 Years | 3 (17.6%) | 0 (0.0%) |
| 75 Years and over | 0 (0.0%) | 0 (0.0%) |
| Total | 5 (6.3%) | 4 (6.1%) |
Income Above Poverty by Sex and Age in Layton
According to the poverty statistics in Layton, males aged under 5 years and females aged 35 to 44 years are the age groups that are most secure financially, with 100.0% of males and 100.0% of females in these age groups living above the poverty line.
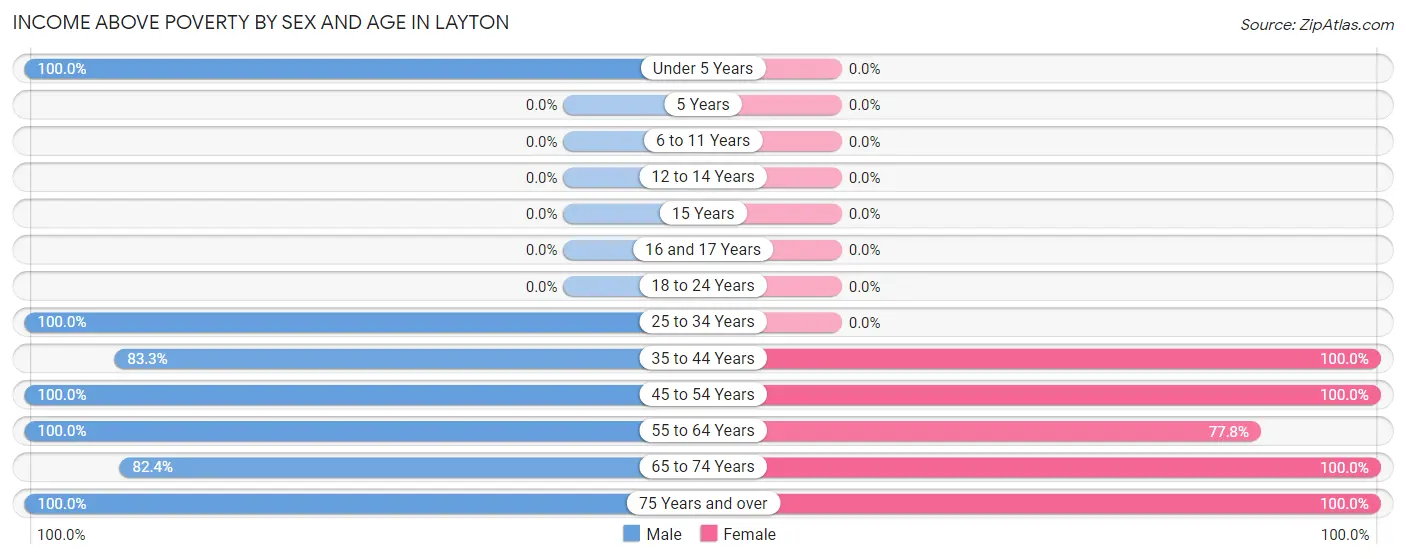
| Age Bracket | Male | Female |
| Under 5 Years | 8 (100.0%) | 0 (0.0%) |
| 5 Years | 0 (0.0%) | 0 (0.0%) |
| 6 to 11 Years | 0 (0.0%) | 0 (0.0%) |
| 12 to 14 Years | 0 (0.0%) | 0 (0.0%) |
| 15 Years | 0 (0.0%) | 0 (0.0%) |
| 16 and 17 Years | 0 (0.0%) | 0 (0.0%) |
| 18 to 24 Years | 0 (0.0%) | 0 (0.0%) |
| 25 to 34 Years | 19 (100.0%) | 0 (0.0%) |
| 35 to 44 Years | 10 (83.3%) | 11 (100.0%) |
| 45 to 54 Years | 7 (100.0%) | 19 (100.0%) |
| 55 to 64 Years | 2 (100.0%) | 14 (77.8%) |
| 65 to 74 Years | 14 (82.4%) | 8 (100.0%) |
| 75 Years and over | 14 (100.0%) | 9 (100.0%) |
| Total | 74 (93.7%) | 61 (93.9%) |
Income Below Poverty Among Married-Couple Families in Layton
The poverty statistics for married-couple families in Layton show that 11.1% or 3 of the total 27 families live below the poverty line. Families with no children have the highest poverty rate of 13.0%, comprising of 3 families. On the other hand, families with 1 or 2 children have the lowest poverty rate of 0.0%, which includes 0 families.
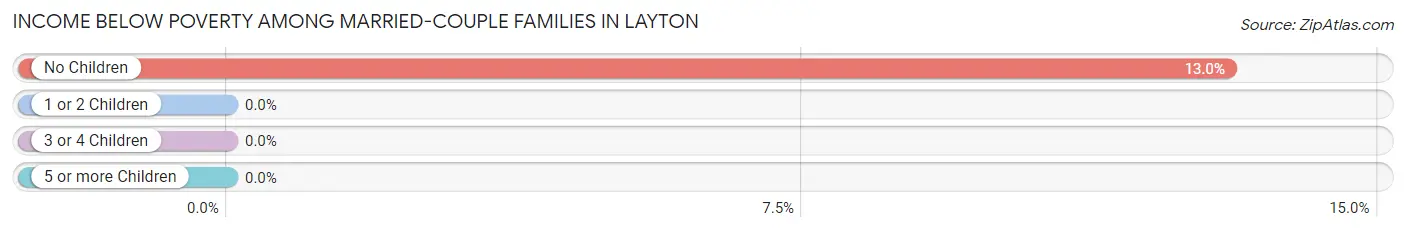
| Children | Above Poverty | Below Poverty |
| No Children | 20 (87.0%) | 3 (13.0%) |
| 1 or 2 Children | 4 (100.0%) | 0 (0.0%) |
| 3 or 4 Children | 0 (0.0%) | 0 (0.0%) |
| 5 or more Children | 0 (0.0%) | 0 (0.0%) |
| Total | 24 (88.9%) | 3 (11.1%) |
Income Below Poverty Among Single-Parent Households in Layton
| Children | Single Father | Single Mother |
| No Children | 0 (0.0%) | 0 (0.0%) |
| 1 or 2 Children | 0 (0.0%) | 0 (0.0%) |
| 3 or 4 Children | 0 (0.0%) | 0 (0.0%) |
| 5 or more Children | 0 (0.0%) | 0 (0.0%) |
| Total | 0 (0.0%) | 0 (0.0%) |
Income Below Poverty Among Married-Couple vs Single-Parent Households in Layton
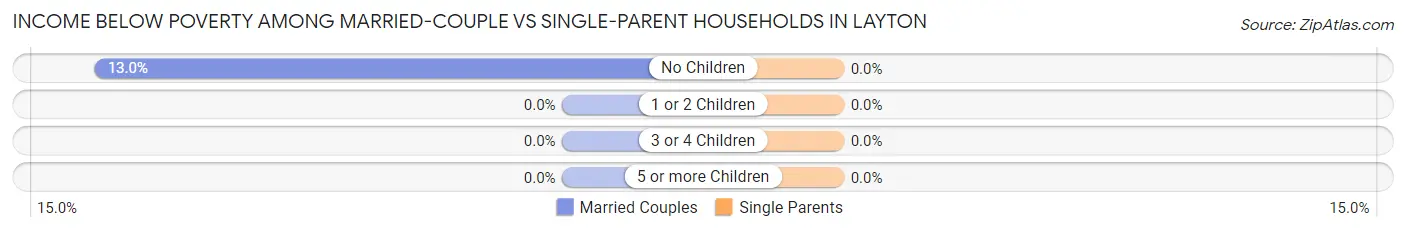
| Children | Married-Couple Families | Single-Parent Households |
| No Children | 3 (13.0%) | 0 (0.0%) |
| 1 or 2 Children | 0 (0.0%) | 0 (0.0%) |
| 3 or 4 Children | 0 (0.0%) | 0 (0.0%) |
| 5 or more Children | 0 (0.0%) | 0 (0.0%) |
| Total | 3 (11.1%) | 0 (0.0%) |
Race in Layton
The most populous races in Layton are White / Caucasian (113 | 78.5%), Some other Race (31 | 21.5%), and Hispanic or Latino (7 | 4.9%).
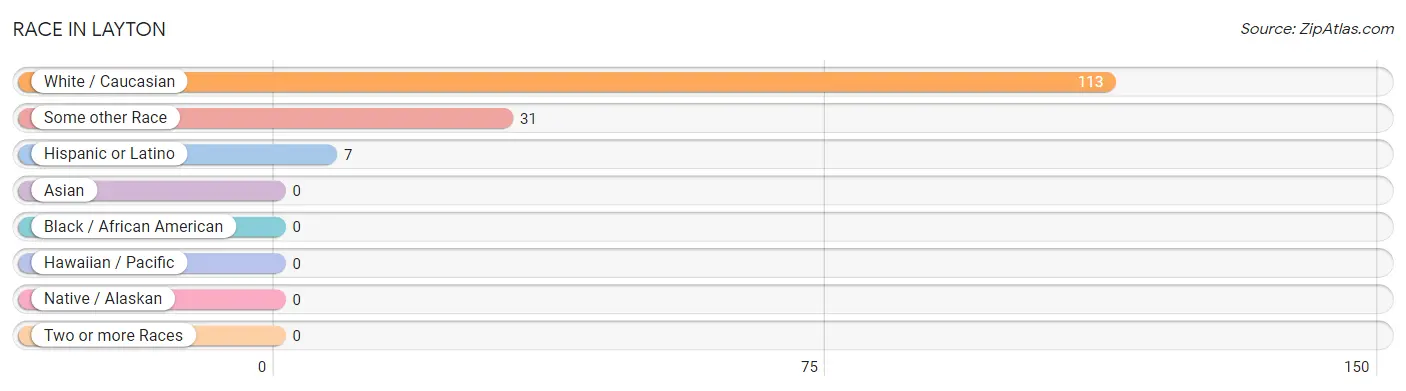
| Race | # Population | % Population |
| Asian | 0 | 0.0% |
| Black / African American | 0 | 0.0% |
| Hawaiian / Pacific | 0 | 0.0% |
| Hispanic or Latino | 7 | 4.9% |
| Native / Alaskan | 0 | 0.0% |
| White / Caucasian | 113 | 78.5% |
| Two or more Races | 0 | 0.0% |
| Some other Race | 31 | 21.5% |
| Total | 144 | 100.0% |
Ancestry in Layton
The most populous ancestries reported in Layton are Irish (37 | 25.7%), German (19 | 13.2%), Italian (15 | 10.4%), English (12 | 8.3%), and Slovak (7 | 4.9%), together accounting for 62.5% of all Layton residents.
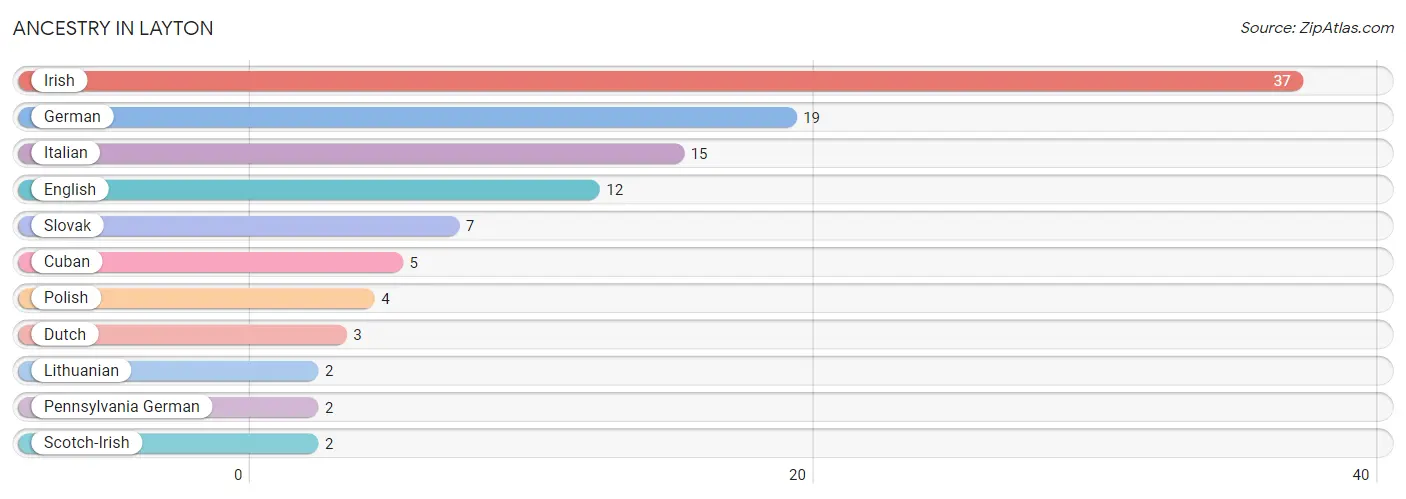
| Ancestry | # Population | % Population |
| Cuban | 5 | 3.5% |
| Dutch | 3 | 2.1% |
| English | 12 | 8.3% |
| German | 19 | 13.2% |
| Irish | 37 | 25.7% |
| Italian | 15 | 10.4% |
| Lithuanian | 2 | 1.4% |
| Pennsylvania German | 2 | 1.4% |
| Polish | 4 | 2.8% |
| Scotch-Irish | 2 | 1.4% |
| Slovak | 7 | 4.9% | View All 11 Rows |
Immigrants in Layton
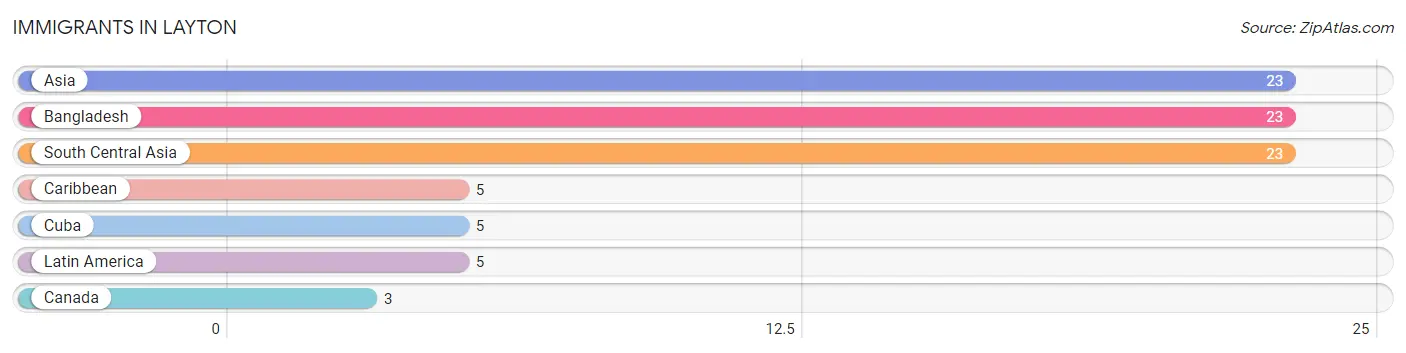
The most numerous immigrant groups reported in Layton came from Asia (23 | 16.0%), Bangladesh (23 | 16.0%), South Central Asia (23 | 16.0%), Caribbean (5 | 3.5%), and Cuba (5 | 3.5%), together accounting for 54.8% of all Layton residents.
| Immigration Origin | # Population | % Population |
| Asia | 23 | 16.0% |
| Bangladesh | 23 | 16.0% |
| Canada | 3 | 2.1% |
| Caribbean | 5 | 3.5% |
| Cuba | 5 | 3.5% |
| Latin America | 5 | 3.5% |
| South Central Asia | 23 | 16.0% | View All 7 Rows |
Sex and Age in Layton
Sex and Age in Layton
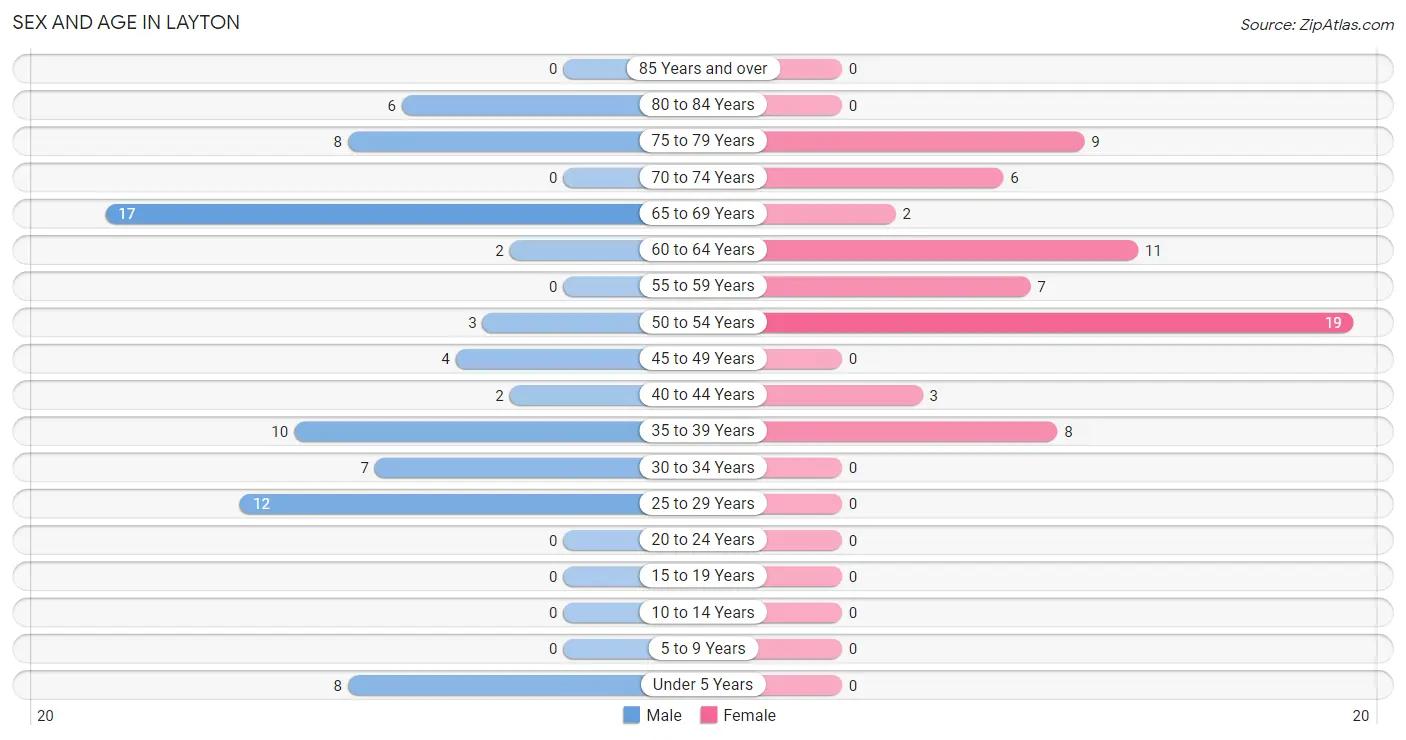
The most populous age groups in Layton are 65 to 69 Years (17 | 21.5%) for men and 50 to 54 Years (19 | 29.2%) for women.
| Age Bracket | Male | Female |
| Under 5 Years | 8 (10.1%) | 0 (0.0%) |
| 5 to 9 Years | 0 (0.0%) | 0 (0.0%) |
| 10 to 14 Years | 0 (0.0%) | 0 (0.0%) |
| 15 to 19 Years | 0 (0.0%) | 0 (0.0%) |
| 20 to 24 Years | 0 (0.0%) | 0 (0.0%) |
| 25 to 29 Years | 12 (15.2%) | 0 (0.0%) |
| 30 to 34 Years | 7 (8.9%) | 0 (0.0%) |
| 35 to 39 Years | 10 (12.7%) | 8 (12.3%) |
| 40 to 44 Years | 2 (2.5%) | 3 (4.6%) |
| 45 to 49 Years | 4 (5.1%) | 0 (0.0%) |
| 50 to 54 Years | 3 (3.8%) | 19 (29.2%) |
| 55 to 59 Years | 0 (0.0%) | 7 (10.8%) |
| 60 to 64 Years | 2 (2.5%) | 11 (16.9%) |
| 65 to 69 Years | 17 (21.5%) | 2 (3.1%) |
| 70 to 74 Years | 0 (0.0%) | 6 (9.2%) |
| 75 to 79 Years | 8 (10.1%) | 9 (13.9%) |
| 80 to 84 Years | 6 (7.6%) | 0 (0.0%) |
| 85 Years and over | 0 (0.0%) | 0 (0.0%) |
| Total | 79 (100.0%) | 65 (100.0%) |
Families and Households in Layton
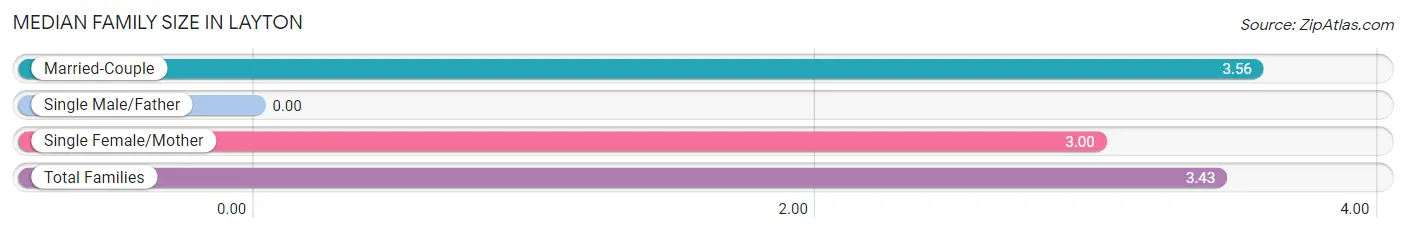
Median Family Size in Layton
| Family Type | # Families | Family Size |
| Married-Couple | 27 (77.1%) | 3.56 |
| Single Male/Father | 0 (0.0%) | - |
| Single Female/Mother | 8 (22.9%) | 3.00 |
| Total Families | 35 (100.0%) | 3.43 |
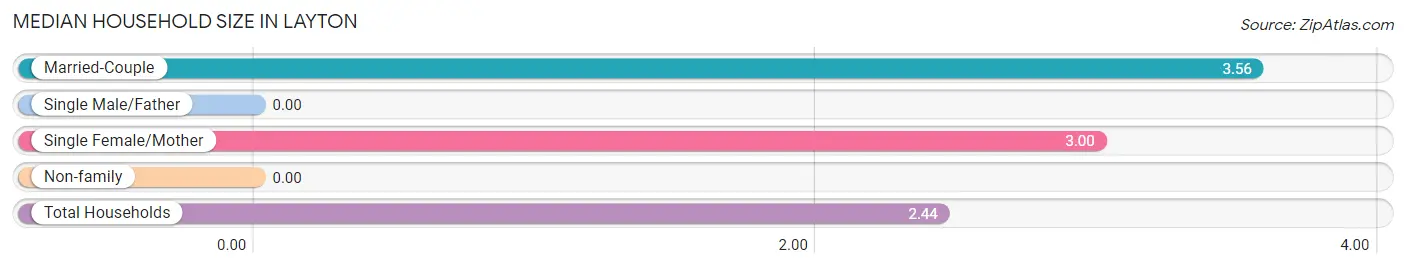
Median Household Size in Layton
| Household Type | # Households | Household Size |
| Married-Couple | 27 (45.8%) | 3.56 |
| Single Male/Father | 0 (0.0%) | - |
| Single Female/Mother | 8 (13.6%) | 3.00 |
| Non-family | 24 (40.7%) | - |
| Total Households | 59 (100.0%) | 2.44 |
Household Size by Marriage Status in Layton
Out of a total of 59 households in Layton, 35 (59.3%) are family households, while 24 (40.7%) are nonfamily households. The most numerous type of family households are 2-person households, comprising 17, and the most common type of nonfamily households are 1-person households, comprising 24.
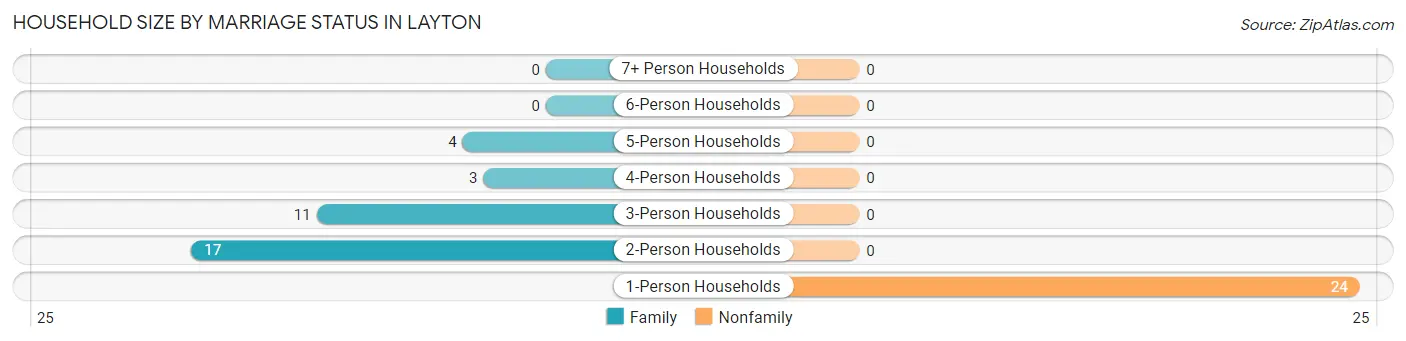
| Household Size | Family Households | Nonfamily Households |
| 1-Person Households | - | 24 (40.7%) |
| 2-Person Households | 17 (28.8%) | 0 (0.0%) |
| 3-Person Households | 11 (18.6%) | 0 (0.0%) |
| 4-Person Households | 3 (5.1%) | 0 (0.0%) |
| 5-Person Households | 4 (6.8%) | 0 (0.0%) |
| 6-Person Households | 0 (0.0%) | 0 (0.0%) |
| 7+ Person Households | 0 (0.0%) | 0 (0.0%) |
| Total | 35 (59.3%) | 24 (40.7%) |
Female Fertility in Layton
Fertility by Age in Layton
| Age Bracket | Women with Births | Births / 1,000 Women |
| 15 to 19 years | 0 (0.0%) | 0.0 |
| 20 to 34 years | 0 (0.0%) | 0.0 |
| 35 to 50 years | 0 (0.0%) | 0.0 |
| Total | 0 (0.0%) | 0.0 |
Fertility by Age by Marriage Status in Layton
| Age Bracket | Married | Unmarried |
| 15 to 19 years | 0 (0.0%) | 0 (0.0%) |
| 20 to 34 years | 0 (0.0%) | 0 (0.0%) |
| 35 to 50 years | 0 (0.0%) | 0 (0.0%) |
| Total | 0 (0.0%) | 0 (0.0%) |
Fertility by Education in Layton
| Educational Attainment | Women with Births | Births / 1,000 Women |
| Less than High School | 0 (0.0%) | 0.0 |
| High School Diploma | 0 (0.0%) | 0.0 |
| College or Associate's Degree | 0 (0.0%) | 0.0 |
| Bachelor's Degree | 0 (0.0%) | 0.0 |
| Graduate Degree | 0 (0.0%) | 0.0 |
| Total | 0 (0.0%) | 0.0 |
Fertility by Education by Marriage Status in Layton
| Educational Attainment | Married | Unmarried |
| Less than High School | 0 (0.0%) | 0 (0.0%) |
| High School Diploma | 0 (0.0%) | 0 (0.0%) |
| College or Associate's Degree | 0 (0.0%) | 0 (0.0%) |
| Bachelor's Degree | 0 (0.0%) | 0 (0.0%) |
| Graduate Degree | 0 (0.0%) | 0 (0.0%) |
| Total | 0 (0.0%) | 0 (0.0%) |
Employment Characteristics in Layton
Employment by Class of Employer in Layton
Among the 73 employed individuals in Layton, private company employees (60 | 82.2%), self-employed (not incorporated) (6 | 8.2%), and not-for-profit organizations (4 | 5.5%) make up the most common classes of employment.
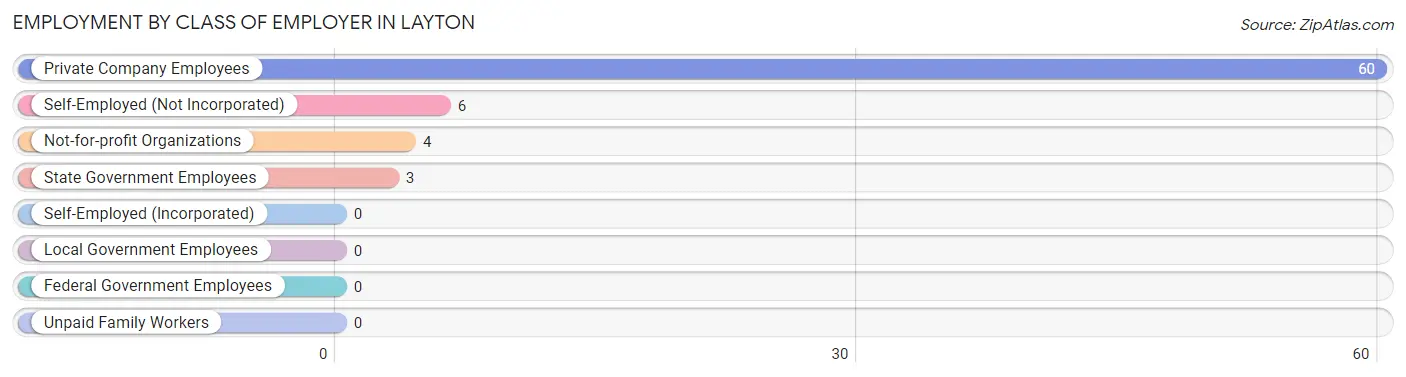
| Employer Class | # Employees | % Employees |
| Private Company Employees | 60 | 82.2% |
| Self-Employed (Incorporated) | 0 | 0.0% |
| Self-Employed (Not Incorporated) | 6 | 8.2% |
| Not-for-profit Organizations | 4 | 5.5% |
| Local Government Employees | 0 | 0.0% |
| State Government Employees | 3 | 4.1% |
| Federal Government Employees | 0 | 0.0% |
| Unpaid Family Workers | 0 | 0.0% |
| Total | 73 | 100.0% |
Employment Status by Age in Layton
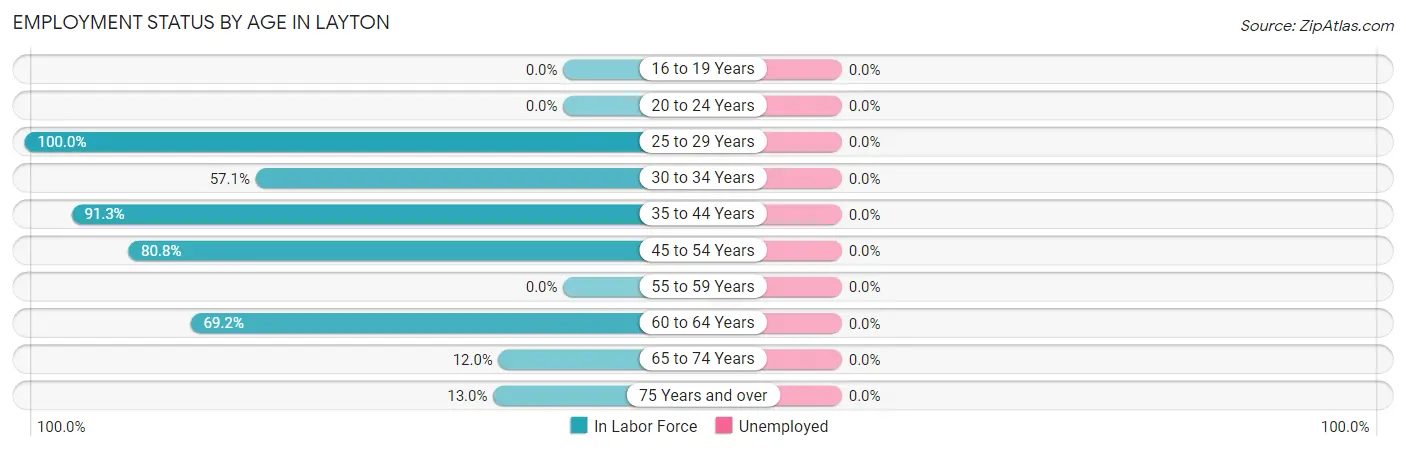
| Age Bracket | In Labor Force | Unemployed |
| 16 to 19 Years | 0 (0.0%) | 0 (0.0%) |
| 20 to 24 Years | 0 (0.0%) | 0 (0.0%) |
| 25 to 29 Years | 12 (100.0%) | 0 (0.0%) |
| 30 to 34 Years | 4 (57.1%) | 0 (0.0%) |
| 35 to 44 Years | 21 (91.3%) | 0 (0.0%) |
| 45 to 54 Years | 21 (80.8%) | 0 (0.0%) |
| 55 to 59 Years | 0 (0.0%) | 0 (0.0%) |
| 60 to 64 Years | 9 (69.2%) | 0 (0.0%) |
| 65 to 74 Years | 3 (12.0%) | 0 (0.0%) |
| 75 Years and over | 3 (13.0%) | 0 (0.0%) |
| Total | 73 (53.7%) | 0 (0.0%) |
Employment Status by Educational Attainment in Layton
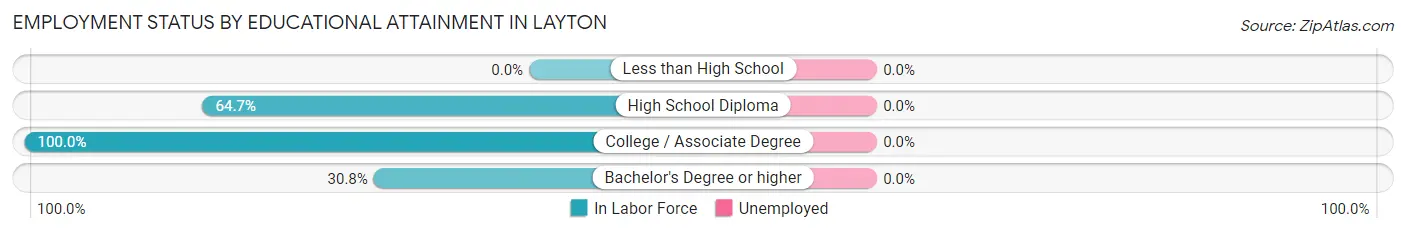
| Educational Attainment | In Labor Force | Unemployed |
| Less than High School | 0 (0.0%) | 0 (0.0%) |
| High School Diploma | 22 (64.7%) | 0 (0.0%) |
| College / Associate Degree | 41 (100.0%) | 0 (0.0%) |
| Bachelor's Degree or higher | 4 (30.8%) | 0 (0.0%) |
| Total | 67 (76.1%) | 0 (0.0%) |
Employment Occupations by Sex in Layton
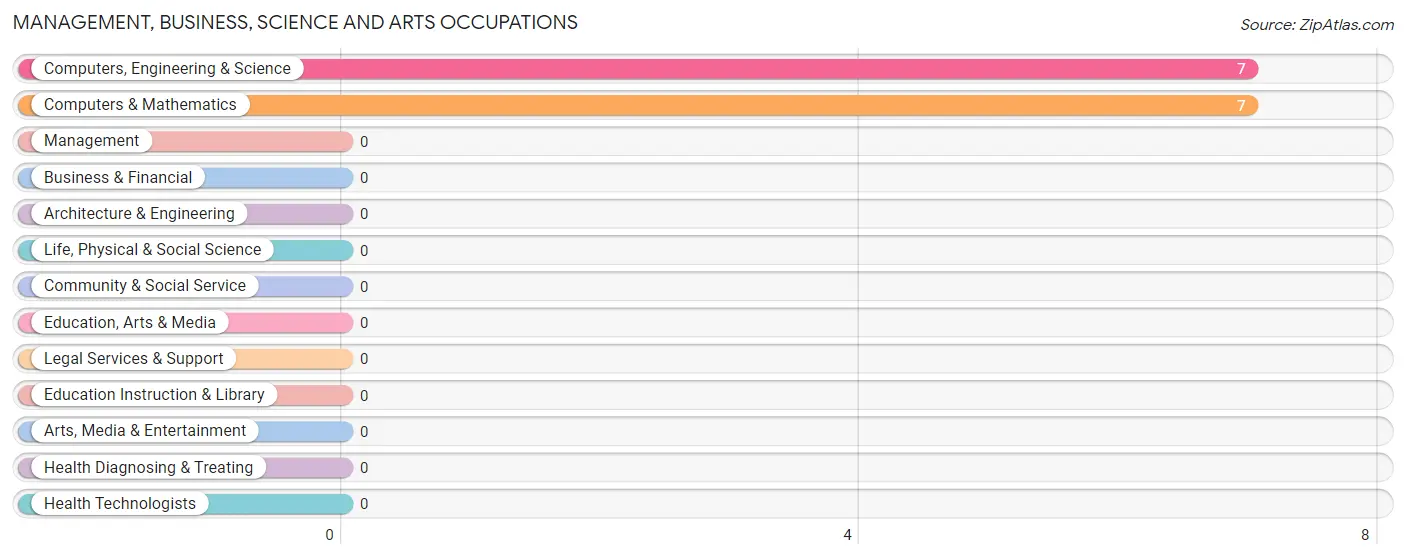
Management, Business, Science and Arts Occupations
The most common Management, Business, Science and Arts occupations in Layton are Computers, Engineering & Science (7 | 9.6%), and Computers & Mathematics (7 | 9.6%).
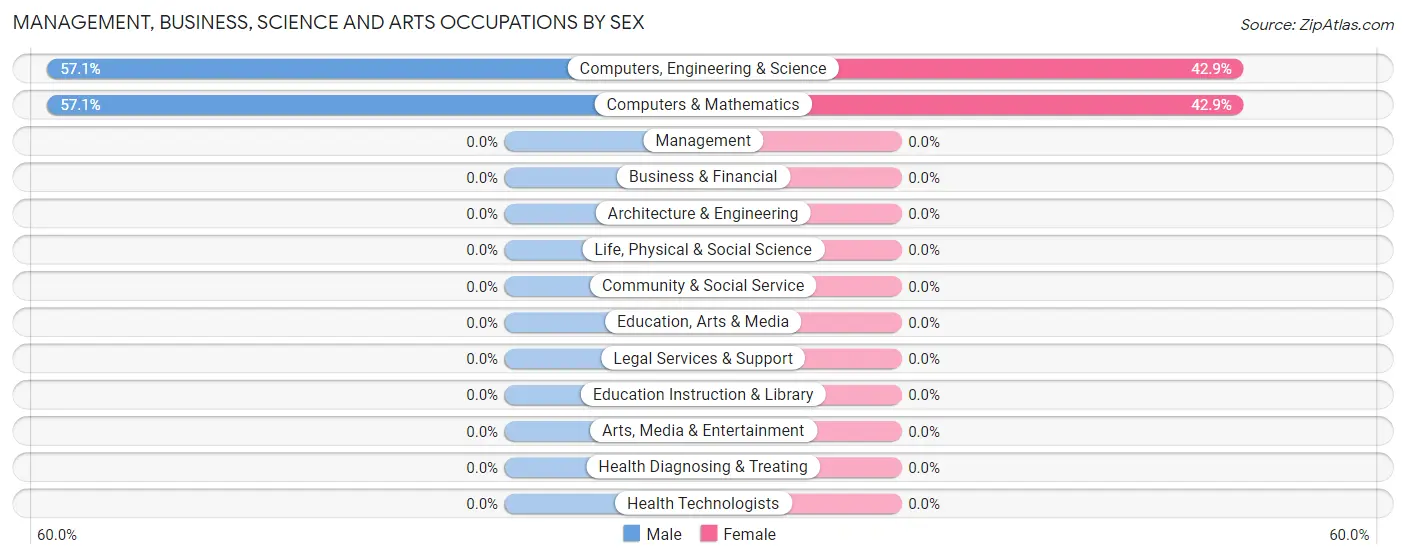
Management, Business, Science and Arts Occupations by Sex
Within the Management, Business, Science and Arts occupations in Layton, the most male-oriented occupations are Computers, Engineering & Science (57.1%), and Computers & Mathematics (57.1%), while the most female-oriented occupations are Computers, Engineering & Science (42.9%), and Computers & Mathematics (42.9%).
| Occupation | Male | Female |
| Management | 0 (0.0%) | 0 (0.0%) |
| Business & Financial | 0 (0.0%) | 0 (0.0%) |
| Computers, Engineering & Science | 4 (57.1%) | 3 (42.9%) |
| Computers & Mathematics | 4 (57.1%) | 3 (42.9%) |
| Architecture & Engineering | 0 (0.0%) | 0 (0.0%) |
| Life, Physical & Social Science | 0 (0.0%) | 0 (0.0%) |
| Community & Social Service | 0 (0.0%) | 0 (0.0%) |
| Education, Arts & Media | 0 (0.0%) | 0 (0.0%) |
| Legal Services & Support | 0 (0.0%) | 0 (0.0%) |
| Education Instruction & Library | 0 (0.0%) | 0 (0.0%) |
| Arts, Media & Entertainment | 0 (0.0%) | 0 (0.0%) |
| Health Diagnosing & Treating | 0 (0.0%) | 0 (0.0%) |
| Health Technologists | 0 (0.0%) | 0 (0.0%) |
| Total (Category) | 4 (57.1%) | 3 (42.9%) |
| Total (Overall) | 38 (52.0%) | 35 (47.9%) |
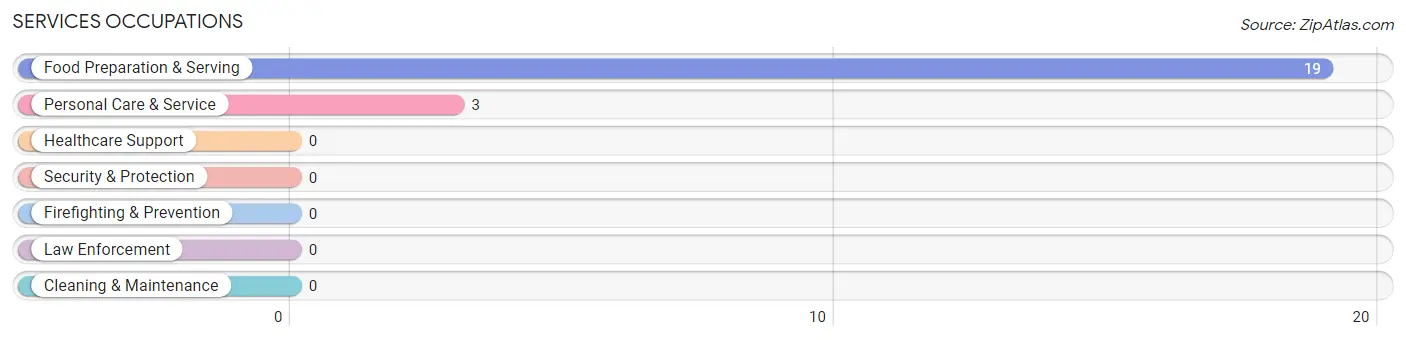
Services Occupations
The most common Services occupations in Layton are Food Preparation & Serving (19 | 26.0%), and Personal Care & Service (3 | 4.1%).
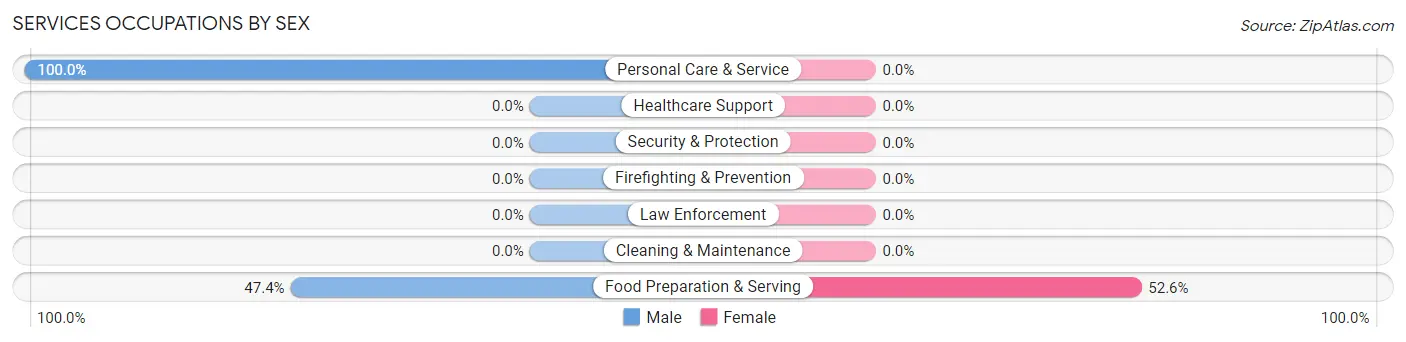
Services Occupations by Sex
| Occupation | Male | Female |
| Healthcare Support | 0 (0.0%) | 0 (0.0%) |
| Security & Protection | 0 (0.0%) | 0 (0.0%) |
| Firefighting & Prevention | 0 (0.0%) | 0 (0.0%) |
| Law Enforcement | 0 (0.0%) | 0 (0.0%) |
| Food Preparation & Serving | 9 (47.4%) | 10 (52.6%) |
| Cleaning & Maintenance | 0 (0.0%) | 0 (0.0%) |
| Personal Care & Service | 3 (100.0%) | 0 (0.0%) |
| Total (Category) | 12 (54.5%) | 10 (45.5%) |
| Total (Overall) | 38 (52.0%) | 35 (47.9%) |
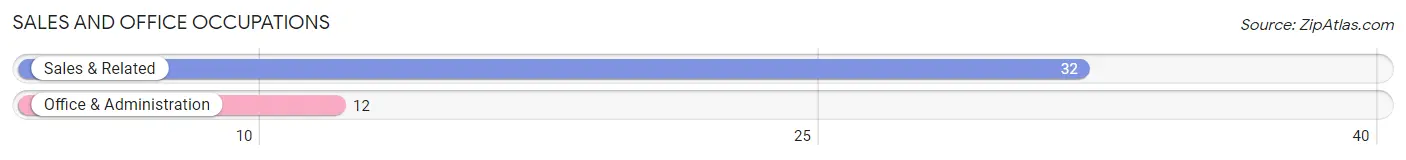
Sales and Office Occupations
The most common Sales and Office occupations in Layton are Sales & Related (32 | 43.8%), and Office & Administration (12 | 16.4%).
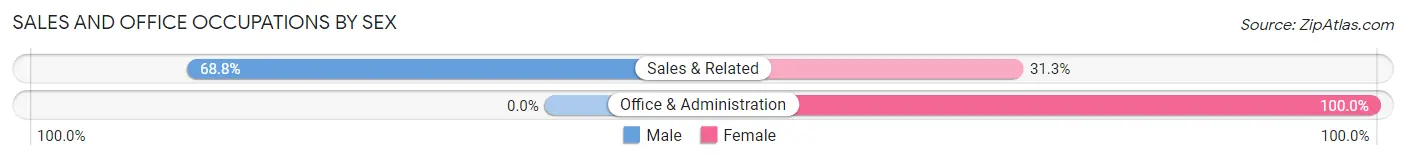
Sales and Office Occupations by Sex
| Occupation | Male | Female |
| Sales & Related | 22 (68.8%) | 10 (31.2%) |
| Office & Administration | 0 (0.0%) | 12 (100.0%) |
| Total (Category) | 22 (50.0%) | 22 (50.0%) |
| Total (Overall) | 38 (52.0%) | 35 (47.9%) |
Natural Resources, Construction and Maintenance Occupations
Natural Resources, Construction and Maintenance Occupations by Sex
| Occupation | Male | Female |
| Farming, Fishing & Forestry | 0 (0.0%) | 0 (0.0%) |
| Construction & Extraction | 0 (0.0%) | 0 (0.0%) |
| Installation, Maintenance & Repair | 0 (0.0%) | 0 (0.0%) |
| Total (Category) | 0 (0.0%) | 0 (0.0%) |
| Total (Overall) | 38 (52.0%) | 35 (47.9%) |
Production, Transportation and Moving Occupations
Production, Transportation and Moving Occupations by Sex
| Occupation | Male | Female |
| Production | 0 (0.0%) | 0 (0.0%) |
| Transportation | 0 (0.0%) | 0 (0.0%) |
| Material Moving | 0 (0.0%) | 0 (0.0%) |
| Total (Category) | 0 (0.0%) | 0 (0.0%) |
| Total (Overall) | 38 (52.0%) | 35 (47.9%) |
Employment Industries by Sex in Layton
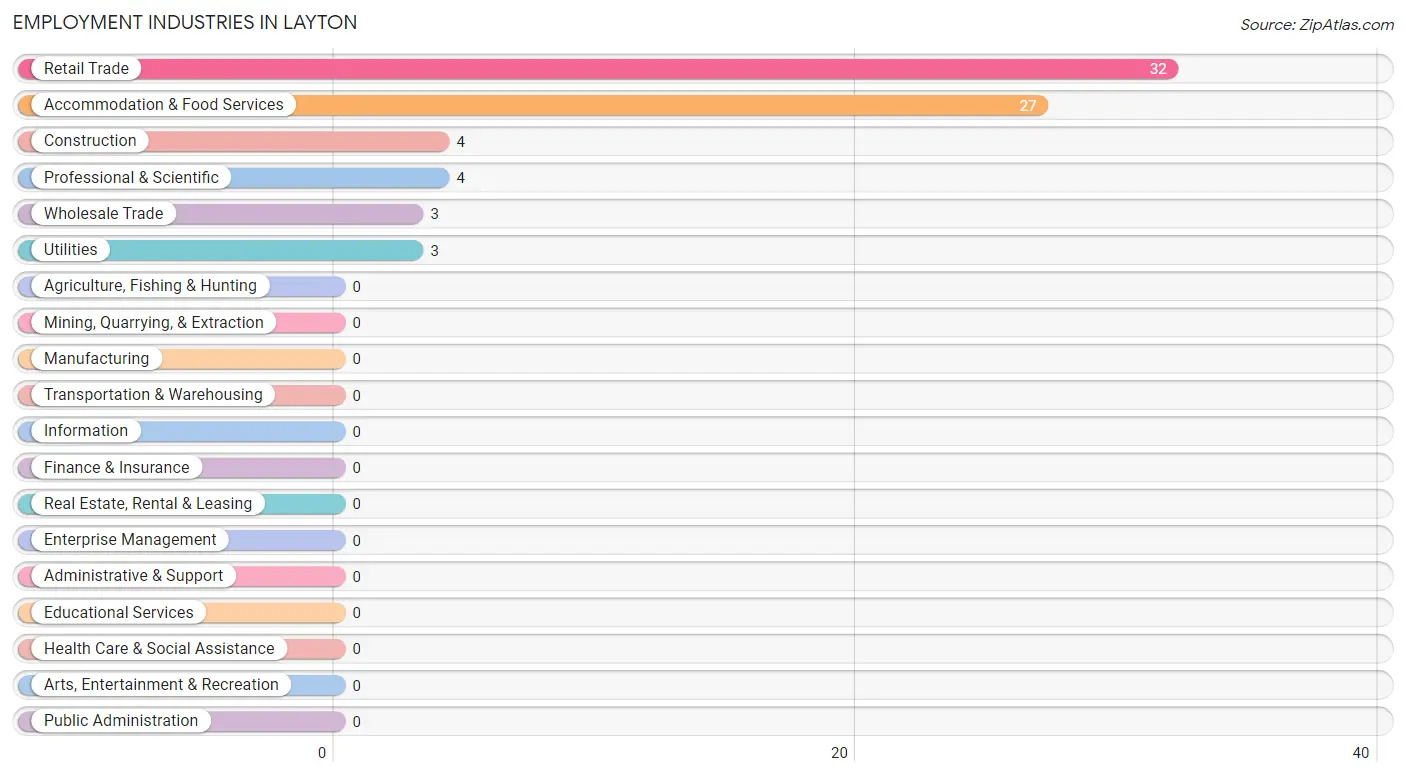
Employment Industries in Layton
The major employment industries in Layton include Retail Trade (32 | 43.8%), Accommodation & Food Services (27 | 37.0%), Construction (4 | 5.5%), Professional & Scientific (4 | 5.5%), and Wholesale Trade (3 | 4.1%).
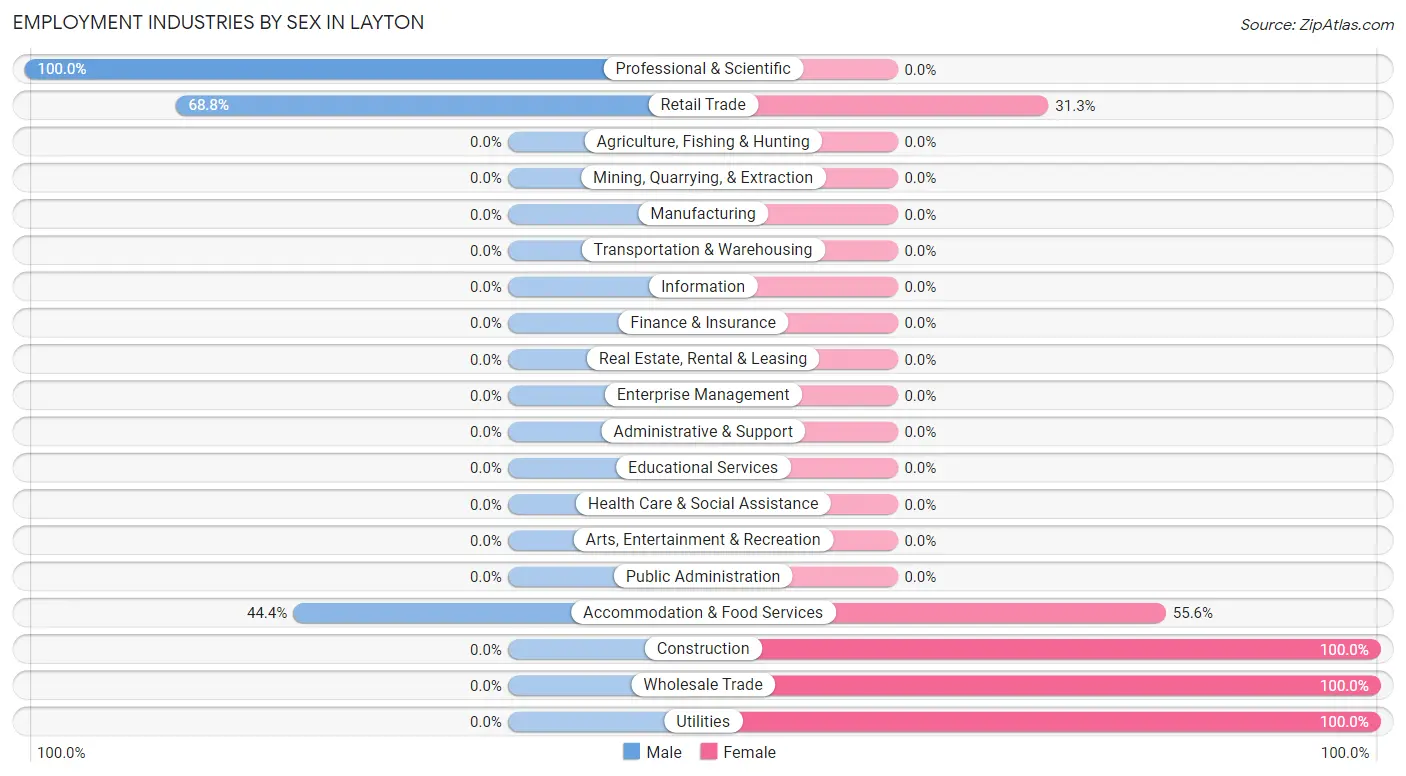
Employment Industries by Sex in Layton
The Layton industries that see more men than women are Professional & Scientific (100.0%), Retail Trade (68.8%), and Accommodation & Food Services (44.4%), whereas the industries that tend to have a higher number of women are Construction (100.0%), Wholesale Trade (100.0%), and Utilities (100.0%).
| Industry | Male | Female |
| Agriculture, Fishing & Hunting | 0 (0.0%) | 0 (0.0%) |
| Mining, Quarrying, & Extraction | 0 (0.0%) | 0 (0.0%) |
| Construction | 0 (0.0%) | 4 (100.0%) |
| Manufacturing | 0 (0.0%) | 0 (0.0%) |
| Wholesale Trade | 0 (0.0%) | 3 (100.0%) |
| Retail Trade | 22 (68.8%) | 10 (31.2%) |
| Transportation & Warehousing | 0 (0.0%) | 0 (0.0%) |
| Utilities | 0 (0.0%) | 3 (100.0%) |
| Information | 0 (0.0%) | 0 (0.0%) |
| Finance & Insurance | 0 (0.0%) | 0 (0.0%) |
| Real Estate, Rental & Leasing | 0 (0.0%) | 0 (0.0%) |
| Professional & Scientific | 4 (100.0%) | 0 (0.0%) |
| Enterprise Management | 0 (0.0%) | 0 (0.0%) |
| Administrative & Support | 0 (0.0%) | 0 (0.0%) |
| Educational Services | 0 (0.0%) | 0 (0.0%) |
| Health Care & Social Assistance | 0 (0.0%) | 0 (0.0%) |
| Arts, Entertainment & Recreation | 0 (0.0%) | 0 (0.0%) |
| Accommodation & Food Services | 12 (44.4%) | 15 (55.6%) |
| Public Administration | 0 (0.0%) | 0 (0.0%) |
| Total | 38 (52.0%) | 35 (47.9%) |
Education in Layton
School Enrollment in Layton
| School Level | # Students | % Students |
| Nursery / Preschool | 0 | 0.0% |
| Kindergarten | 0 | 0.0% |
| Elementary School | 0 | 0.0% |
| Middle School | 0 | 0.0% |
| High School | 0 | 0.0% |
| College / Undergraduate | 0 | 0.0% |
| Graduate / Professional | 0 | 0.0% |
| Total | 0 | 0.0% |
School Enrollment by Age by Funding Source in Layton
| Age Bracket | Public School | Private School |
| 3 to 4 Year Olds | 0 (0.0%) | 0 (0.0%) |
| 5 to 9 Year Old | 0 (0.0%) | 0 (0.0%) |
| 10 to 14 Year Olds | 0 (0.0%) | 0 (0.0%) |
| 15 to 17 Year Olds | 0 (0.0%) | 0 (0.0%) |
| 18 to 19 Year Olds | 0 (0.0%) | 0 (0.0%) |
| 20 to 24 Year Olds | 0 (0.0%) | 0 (0.0%) |
| 25 to 34 Year Olds | 0 (0.0%) | 0 (0.0%) |
| 35 Years and over | 0 (0.0%) | 0 (0.0%) |
| Total | 0 (0.0%) | 0 (0.0%) |
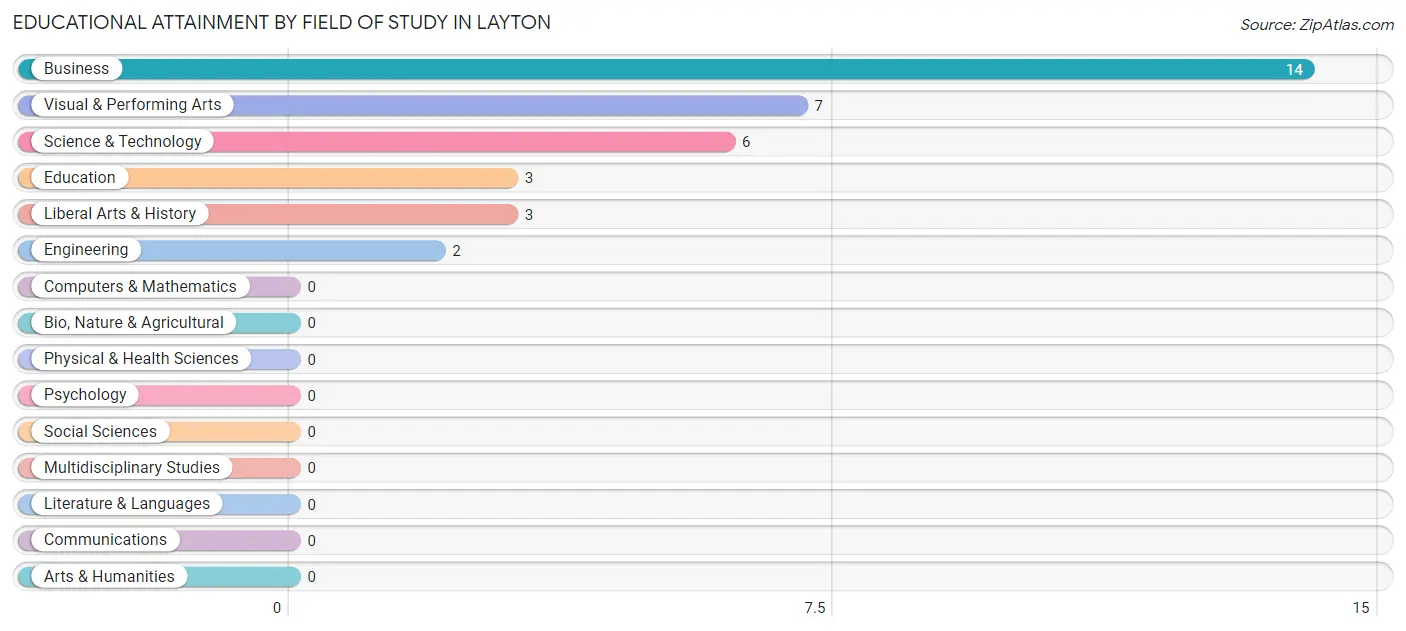
Educational Attainment by Field of Study in Layton
Business (14 | 40.0%), visual & performing arts (7 | 20.0%), science & technology (6 | 17.1%), education (3 | 8.6%), and liberal arts & history (3 | 8.6%) are the most common fields of study among 35 individuals in Layton who have obtained a bachelor's degree or higher.
| Field of Study | # Graduates | % Graduates |
| Computers & Mathematics | 0 | 0.0% |
| Bio, Nature & Agricultural | 0 | 0.0% |
| Physical & Health Sciences | 0 | 0.0% |
| Psychology | 0 | 0.0% |
| Social Sciences | 0 | 0.0% |
| Engineering | 2 | 5.7% |
| Multidisciplinary Studies | 0 | 0.0% |
| Science & Technology | 6 | 17.1% |
| Business | 14 | 40.0% |
| Education | 3 | 8.6% |
| Literature & Languages | 0 | 0.0% |
| Liberal Arts & History | 3 | 8.6% |
| Visual & Performing Arts | 7 | 20.0% |
| Communications | 0 | 0.0% |
| Arts & Humanities | 0 | 0.0% |
| Total | 35 | 100.0% |
Transportation & Commute in Layton
Vehicle Availability by Sex in Layton
The most prevalent vehicle ownership categories in Layton are males with 3 vehicles (14, accounting for 36.8%) and females with 3 vehicles (5, making up 40.0%).
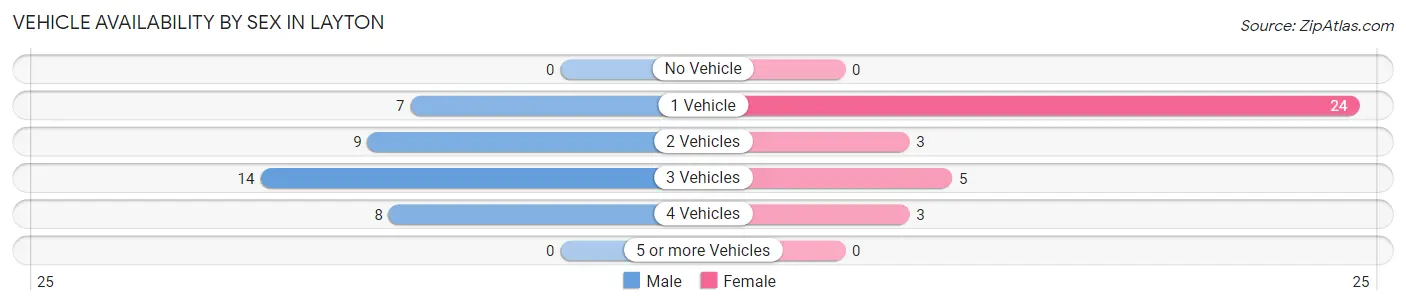
| Vehicles Available | Male | Female |
| No Vehicle | 0 (0.0%) | 0 (0.0%) |
| 1 Vehicle | 7 (18.4%) | 24 (68.6%) |
| 2 Vehicles | 9 (23.7%) | 3 (8.6%) |
| 3 Vehicles | 14 (36.8%) | 5 (14.3%) |
| 4 Vehicles | 8 (21.0%) | 3 (8.6%) |
| 5 or more Vehicles | 0 (0.0%) | 0 (0.0%) |
| Total | 38 (100.0%) | 35 (100.0%) |
Commute Time in Layton
The most frequently occuring commute durations in Layton are 20 to 24 minutes (29 commuters, 39.7%), less than 5 minutes (21 commuters, 28.8%), and 5 to 9 minutes (7 commuters, 9.6%).
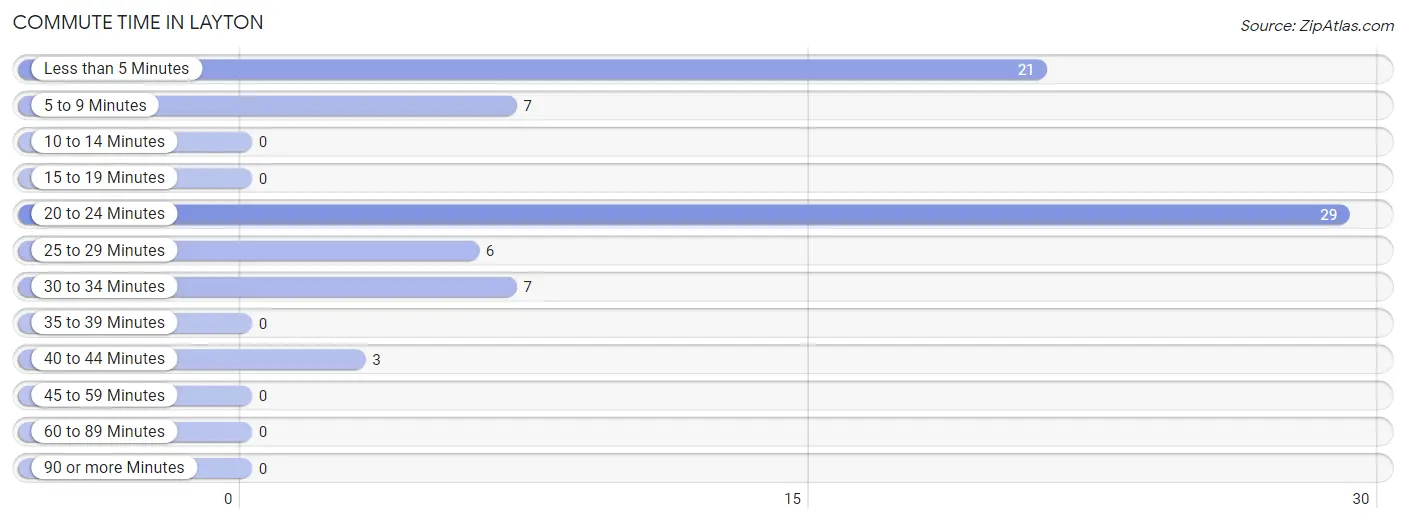
| Commute Time | # Commuters | % Commuters |
| Less than 5 Minutes | 21 | 28.8% |
| 5 to 9 Minutes | 7 | 9.6% |
| 10 to 14 Minutes | 0 | 0.0% |
| 15 to 19 Minutes | 0 | 0.0% |
| 20 to 24 Minutes | 29 | 39.7% |
| 25 to 29 Minutes | 6 | 8.2% |
| 30 to 34 Minutes | 7 | 9.6% |
| 35 to 39 Minutes | 0 | 0.0% |
| 40 to 44 Minutes | 3 | 4.1% |
| 45 to 59 Minutes | 0 | 0.0% |
| 60 to 89 Minutes | 0 | 0.0% |
| 90 or more Minutes | 0 | 0.0% |
Commute Time by Sex in Layton
The most common commute times in Layton are 20 to 24 minutes (23 commuters, 60.5%) for males and less than 5 minutes (17 commuters, 48.6%) for females.
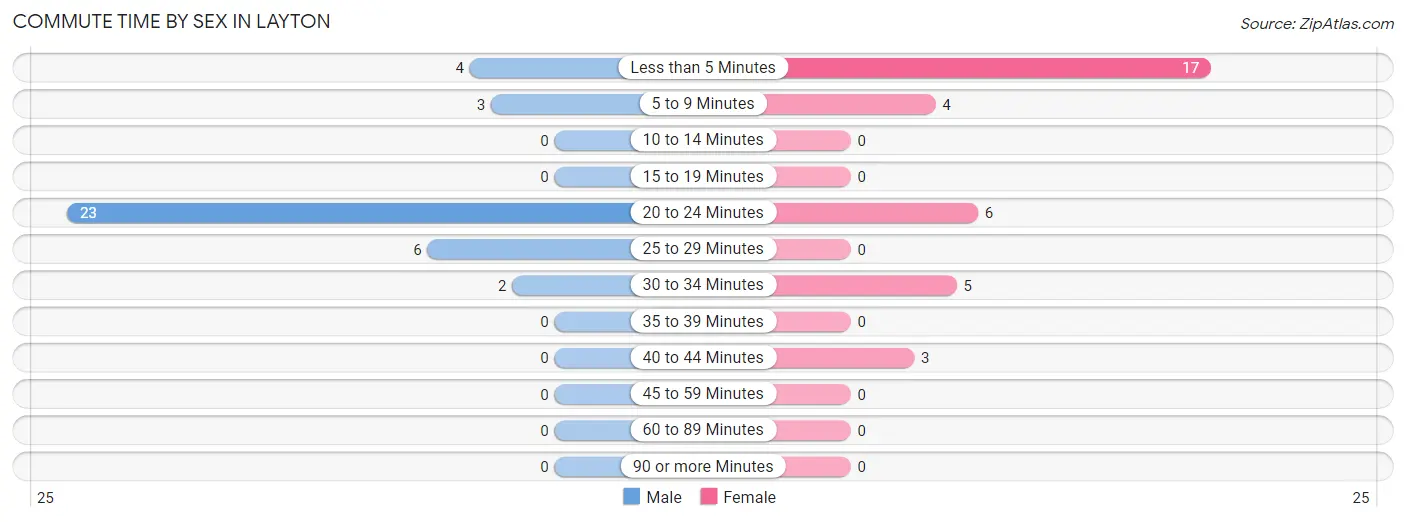
| Commute Time | Male | Female |
| Less than 5 Minutes | 4 (10.5%) | 17 (48.6%) |
| 5 to 9 Minutes | 3 (7.9%) | 4 (11.4%) |
| 10 to 14 Minutes | 0 (0.0%) | 0 (0.0%) |
| 15 to 19 Minutes | 0 (0.0%) | 0 (0.0%) |
| 20 to 24 Minutes | 23 (60.5%) | 6 (17.1%) |
| 25 to 29 Minutes | 6 (15.8%) | 0 (0.0%) |
| 30 to 34 Minutes | 2 (5.3%) | 5 (14.3%) |
| 35 to 39 Minutes | 0 (0.0%) | 0 (0.0%) |
| 40 to 44 Minutes | 0 (0.0%) | 3 (8.6%) |
| 45 to 59 Minutes | 0 (0.0%) | 0 (0.0%) |
| 60 to 89 Minutes | 0 (0.0%) | 0 (0.0%) |
| 90 or more Minutes | 0 (0.0%) | 0 (0.0%) |
Time of Departure to Work by Sex in Layton
The most frequent times of departure to work in Layton are 9:00 AM to 9:59 AM (8, 21.0%) for males and 12:00 PM to 3:59 PM (12, 34.3%) for females.
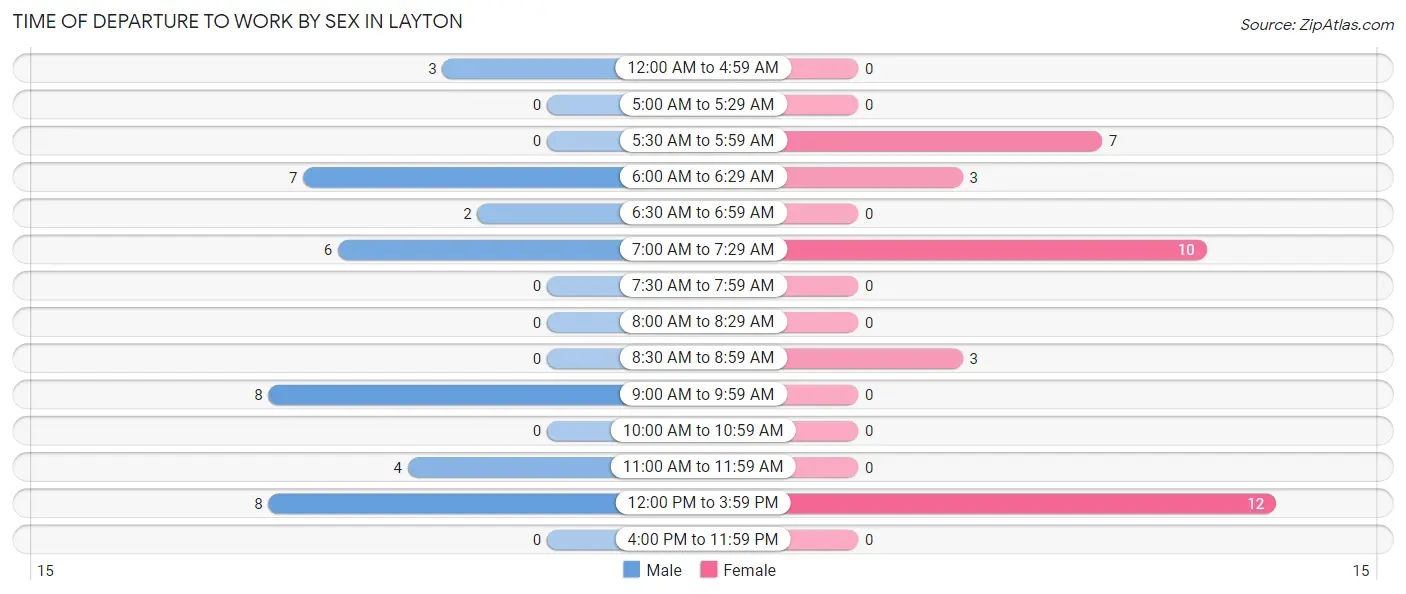
| Time of Departure | Male | Female |
| 12:00 AM to 4:59 AM | 3 (7.9%) | 0 (0.0%) |
| 5:00 AM to 5:29 AM | 0 (0.0%) | 0 (0.0%) |
| 5:30 AM to 5:59 AM | 0 (0.0%) | 7 (20.0%) |
| 6:00 AM to 6:29 AM | 7 (18.4%) | 3 (8.6%) |
| 6:30 AM to 6:59 AM | 2 (5.3%) | 0 (0.0%) |
| 7:00 AM to 7:29 AM | 6 (15.8%) | 10 (28.6%) |
| 7:30 AM to 7:59 AM | 0 (0.0%) | 0 (0.0%) |
| 8:00 AM to 8:29 AM | 0 (0.0%) | 0 (0.0%) |
| 8:30 AM to 8:59 AM | 0 (0.0%) | 3 (8.6%) |
| 9:00 AM to 9:59 AM | 8 (21.0%) | 0 (0.0%) |
| 10:00 AM to 10:59 AM | 0 (0.0%) | 0 (0.0%) |
| 11:00 AM to 11:59 AM | 4 (10.5%) | 0 (0.0%) |
| 12:00 PM to 3:59 PM | 8 (21.0%) | 12 (34.3%) |
| 4:00 PM to 11:59 PM | 0 (0.0%) | 0 (0.0%) |
| Total | 38 (100.0%) | 35 (100.0%) |
Housing Occupancy in Layton
Occupancy by Ownership in Layton
Of the total 59 dwellings in Layton, owner-occupied units account for 22 (37.3%), while renter-occupied units make up 37 (62.7%).
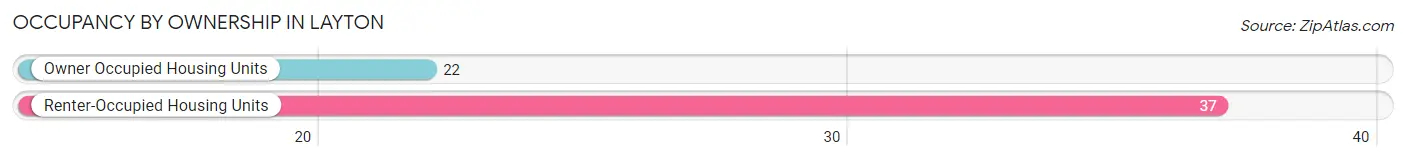
| Occupancy | # Housing Units | % Housing Units |
| Owner Occupied Housing Units | 22 | 37.3% |
| Renter-Occupied Housing Units | 37 | 62.7% |
| Total Occupied Housing Units | 59 | 100.0% |
Occupancy by Household Size in Layton
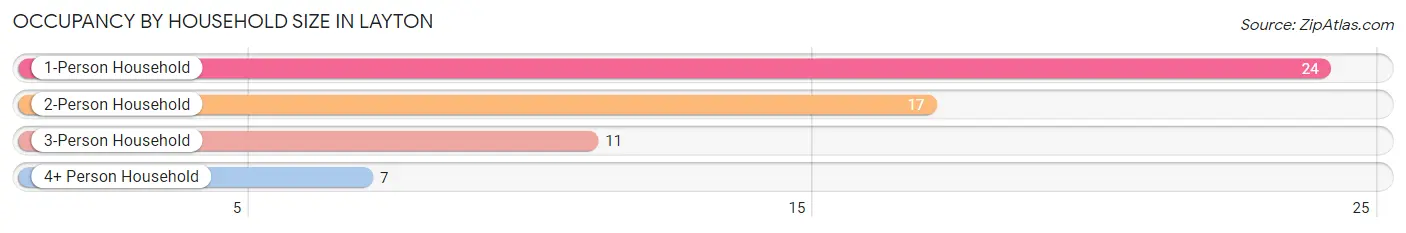
| Household Size | # Housing Units | % Housing Units |
| 1-Person Household | 24 | 40.7% |
| 2-Person Household | 17 | 28.8% |
| 3-Person Household | 11 | 18.6% |
| 4+ Person Household | 7 | 11.9% |
| Total Housing Units | 59 | 100.0% |
Occupancy by Ownership by Household Size in Layton
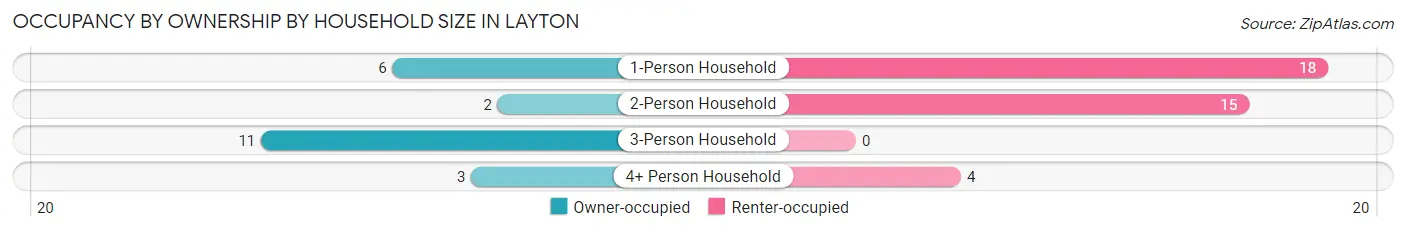
| Household Size | Owner-occupied | Renter-occupied |
| 1-Person Household | 6 (25.0%) | 18 (75.0%) |
| 2-Person Household | 2 (11.8%) | 15 (88.2%) |
| 3-Person Household | 11 (100.0%) | 0 (0.0%) |
| 4+ Person Household | 3 (42.9%) | 4 (57.1%) |
| Total Housing Units | 22 (37.3%) | 37 (62.7%) |
Occupancy by Educational Attainment in Layton
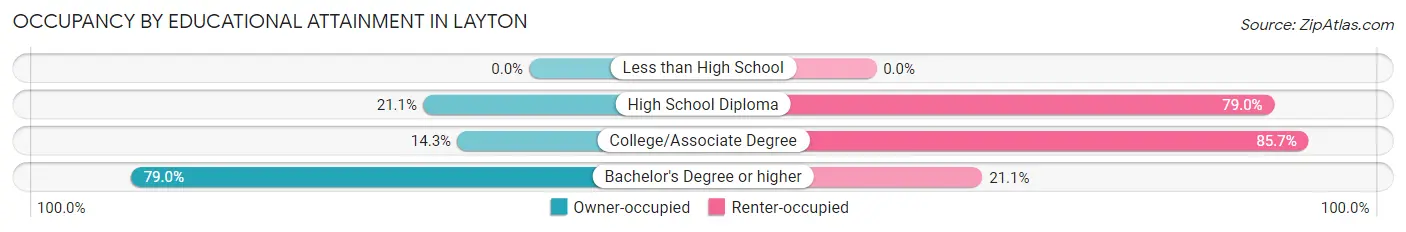
| Household Size | Owner-occupied | Renter-occupied |
| Less than High School | 0 (0.0%) | 0 (0.0%) |
| High School Diploma | 4 (21.0%) | 15 (78.9%) |
| College/Associate Degree | 3 (14.3%) | 18 (85.7%) |
| Bachelor's Degree or higher | 15 (78.9%) | 4 (21.0%) |
Occupancy by Age of Householder in Layton
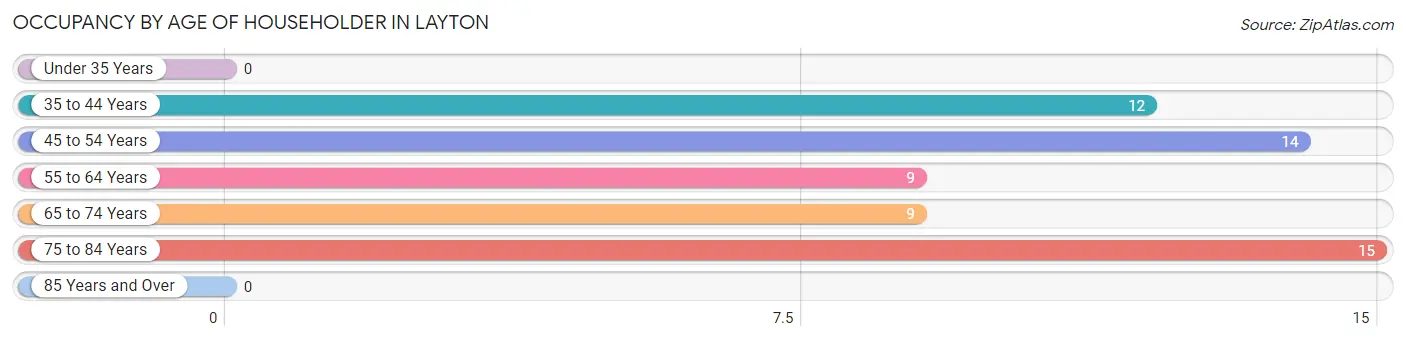
| Age Bracket | # Households | % Households |
| Under 35 Years | 0 | 0.0% |
| 35 to 44 Years | 12 | 20.3% |
| 45 to 54 Years | 14 | 23.7% |
| 55 to 64 Years | 9 | 15.2% |
| 65 to 74 Years | 9 | 15.2% |
| 75 to 84 Years | 15 | 25.4% |
| 85 Years and Over | 0 | 0.0% |
| Total | 59 | 100.0% |
Housing Finances in Layton
Median Income by Occupancy in Layton
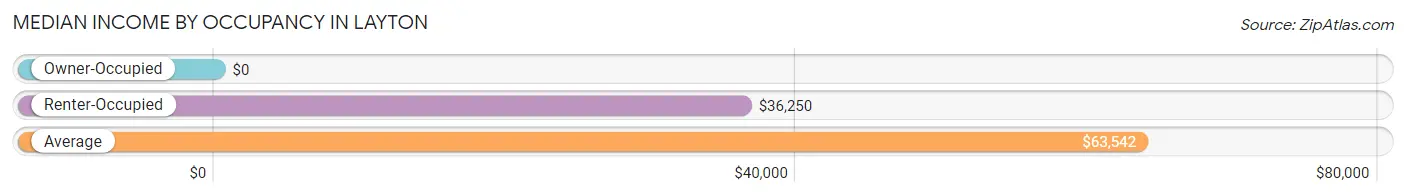
| Occupancy Type | # Households | Median Income |
| Owner-Occupied | 22 (37.3%) | $0 |
| Renter-Occupied | 37 (62.7%) | $36,250 |
| Average | 59 (100.0%) | $63,542 |
Occupancy by Householder Income Bracket in Layton
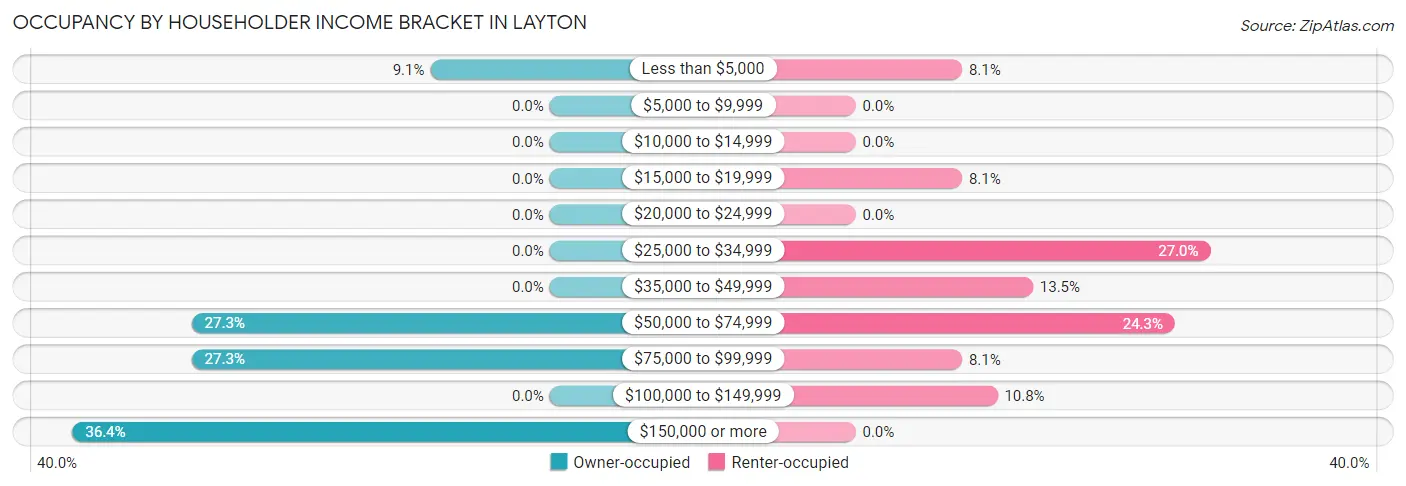
| Income Bracket | Owner-occupied | Renter-occupied |
| Less than $5,000 | 2 (9.1%) | 3 (8.1%) |
| $5,000 to $9,999 | 0 (0.0%) | 0 (0.0%) |
| $10,000 to $14,999 | 0 (0.0%) | 0 (0.0%) |
| $15,000 to $19,999 | 0 (0.0%) | 3 (8.1%) |
| $20,000 to $24,999 | 0 (0.0%) | 0 (0.0%) |
| $25,000 to $34,999 | 0 (0.0%) | 10 (27.0%) |
| $35,000 to $49,999 | 0 (0.0%) | 5 (13.5%) |
| $50,000 to $74,999 | 6 (27.3%) | 9 (24.3%) |
| $75,000 to $99,999 | 6 (27.3%) | 3 (8.1%) |
| $100,000 to $149,999 | 0 (0.0%) | 4 (10.8%) |
| $150,000 or more | 8 (36.4%) | 0 (0.0%) |
| Total | 22 (100.0%) | 37 (100.0%) |
Monthly Housing Cost Tiers in Layton
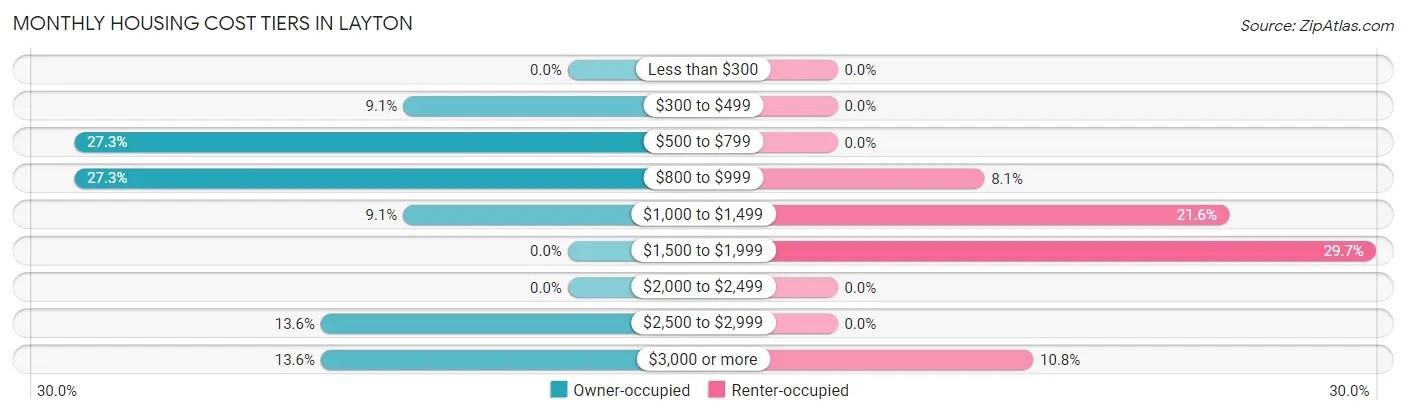
| Monthly Cost | Owner-occupied | Renter-occupied |
| Less than $300 | 0 (0.0%) | 0 (0.0%) |
| $300 to $499 | 2 (9.1%) | 0 (0.0%) |
| $500 to $799 | 6 (27.3%) | 0 (0.0%) |
| $800 to $999 | 6 (27.3%) | 3 (8.1%) |
| $1,000 to $1,499 | 2 (9.1%) | 8 (21.6%) |
| $1,500 to $1,999 | 0 (0.0%) | 11 (29.7%) |
| $2,000 to $2,499 | 0 (0.0%) | 0 (0.0%) |
| $2,500 to $2,999 | 3 (13.6%) | 0 (0.0%) |
| $3,000 or more | 3 (13.6%) | 4 (10.8%) |
| Total | 22 (100.0%) | 37 (100.0%) |
Physical Housing Characteristics in Layton
Housing Structures in Layton
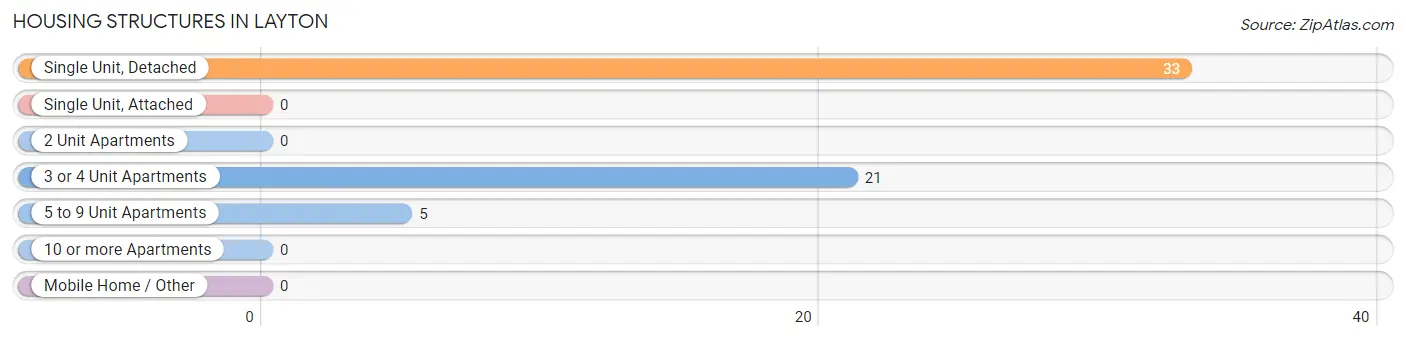
| Structure Type | # Housing Units | % Housing Units |
| Single Unit, Detached | 33 | 55.9% |
| Single Unit, Attached | 0 | 0.0% |
| 2 Unit Apartments | 0 | 0.0% |
| 3 or 4 Unit Apartments | 21 | 35.6% |
| 5 to 9 Unit Apartments | 5 | 8.5% |
| 10 or more Apartments | 0 | 0.0% |
| Mobile Home / Other | 0 | 0.0% |
| Total | 59 | 100.0% |
Housing Structures by Occupancy in Layton
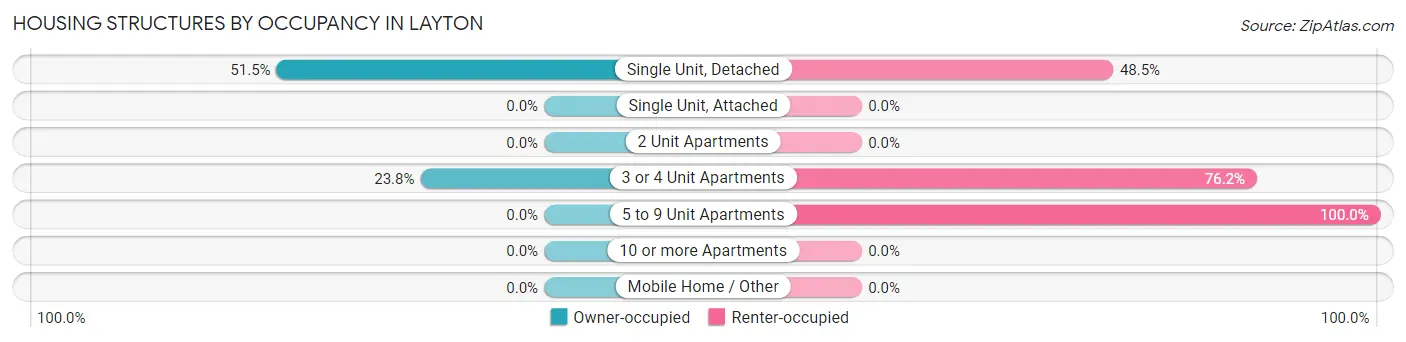
| Structure Type | Owner-occupied | Renter-occupied |
| Single Unit, Detached | 17 (51.5%) | 16 (48.5%) |
| Single Unit, Attached | 0 (0.0%) | 0 (0.0%) |
| 2 Unit Apartments | 0 (0.0%) | 0 (0.0%) |
| 3 or 4 Unit Apartments | 5 (23.8%) | 16 (76.2%) |
| 5 to 9 Unit Apartments | 0 (0.0%) | 5 (100.0%) |
| 10 or more Apartments | 0 (0.0%) | 0 (0.0%) |
| Mobile Home / Other | 0 (0.0%) | 0 (0.0%) |
| Total | 22 (37.3%) | 37 (62.7%) |
Housing Structures by Number of Rooms in Layton
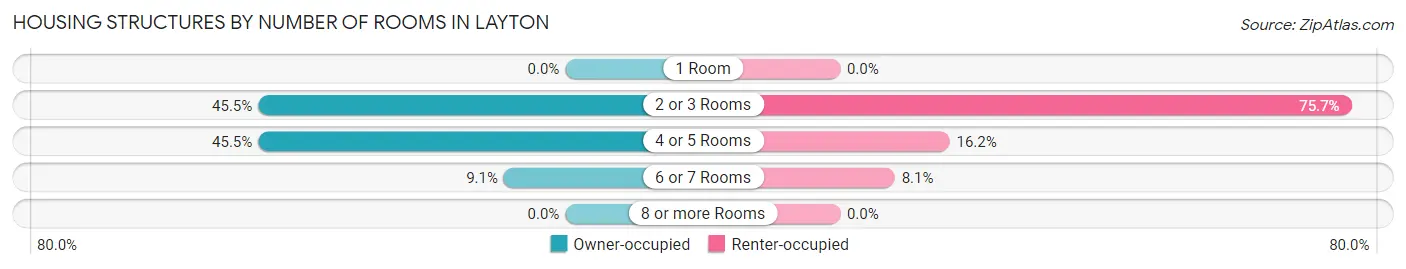
| Number of Rooms | Owner-occupied | Renter-occupied |
| 1 Room | 0 (0.0%) | 0 (0.0%) |
| 2 or 3 Rooms | 10 (45.5%) | 28 (75.7%) |
| 4 or 5 Rooms | 10 (45.5%) | 6 (16.2%) |
| 6 or 7 Rooms | 2 (9.1%) | 3 (8.1%) |
| 8 or more Rooms | 0 (0.0%) | 0 (0.0%) |
| Total | 22 (100.0%) | 37 (100.0%) |
Housing Structure by Heating Type in Layton
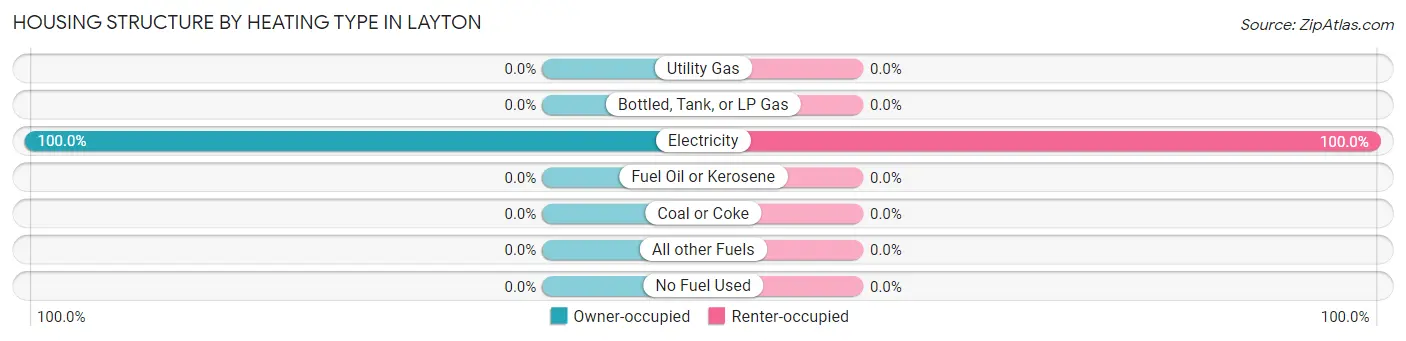
| Heating Type | Owner-occupied | Renter-occupied |
| Utility Gas | 0 (0.0%) | 0 (0.0%) |
| Bottled, Tank, or LP Gas | 0 (0.0%) | 0 (0.0%) |
| Electricity | 22 (100.0%) | 37 (100.0%) |
| Fuel Oil or Kerosene | 0 (0.0%) | 0 (0.0%) |
| Coal or Coke | 0 (0.0%) | 0 (0.0%) |
| All other Fuels | 0 (0.0%) | 0 (0.0%) |
| No Fuel Used | 0 (0.0%) | 0 (0.0%) |
| Total | 22 (100.0%) | 37 (100.0%) |
Household Vehicle Usage in Layton
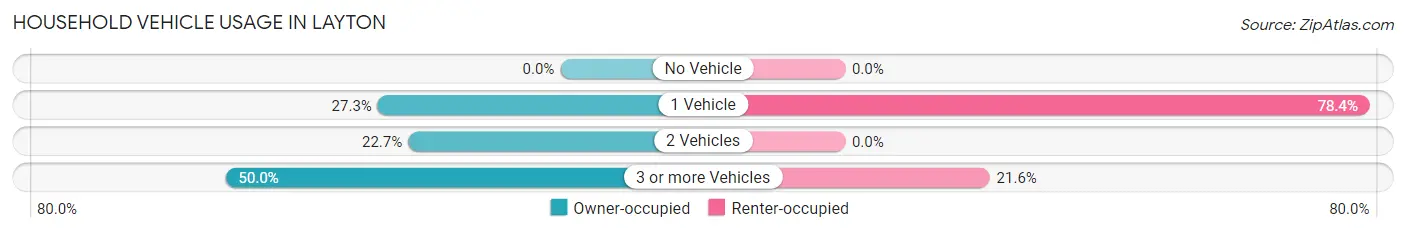
| Vehicles per Household | Owner-occupied | Renter-occupied |
| No Vehicle | 0 (0.0%) | 0 (0.0%) |
| 1 Vehicle | 6 (27.3%) | 29 (78.4%) |
| 2 Vehicles | 5 (22.7%) | 0 (0.0%) |
| 3 or more Vehicles | 11 (50.0%) | 8 (21.6%) |
| Total | 22 (100.0%) | 37 (100.0%) |
Real Estate & Mortgages in Layton
Real Estate and Mortgage Overview in Layton
| Characteristic | Without Mortgage | With Mortgage |
| Housing Units | 16 | 6 |
| Median Property Value | $625,000 | $0 |
| Median Household Income | $76,250 | $6 |
| Monthly Housing Costs | $750 | $3 |
| Real Estate Taxes | $3,500 | $0 |
Property Value by Mortgage Status in Layton
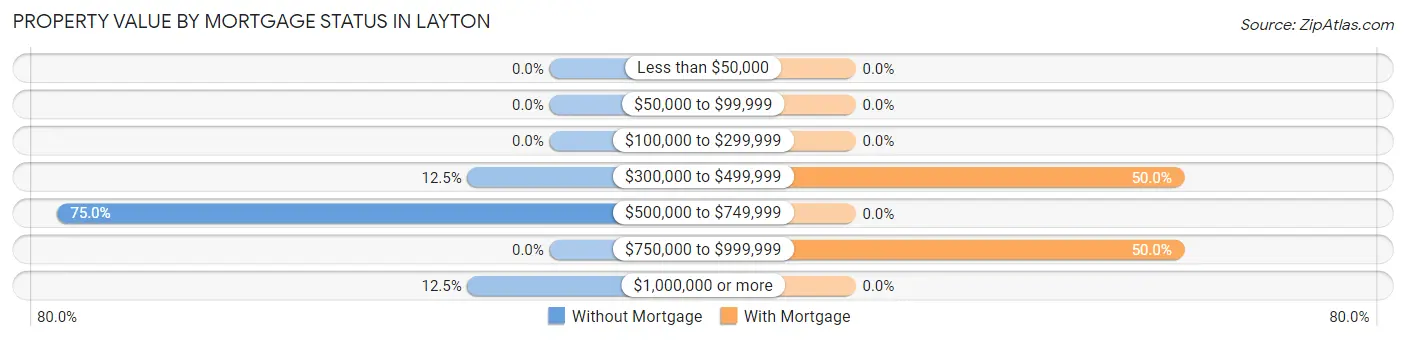
| Property Value | Without Mortgage | With Mortgage |
| Less than $50,000 | 0 (0.0%) | 0 (0.0%) |
| $50,000 to $99,999 | 0 (0.0%) | 0 (0.0%) |
| $100,000 to $299,999 | 0 (0.0%) | 0 (0.0%) |
| $300,000 to $499,999 | 2 (12.5%) | 3 (50.0%) |
| $500,000 to $749,999 | 12 (75.0%) | 0 (0.0%) |
| $750,000 to $999,999 | 0 (0.0%) | 3 (50.0%) |
| $1,000,000 or more | 2 (12.5%) | 0 (0.0%) |
| Total | 16 (100.0%) | 6 (100.0%) |
Household Income by Mortgage Status in Layton
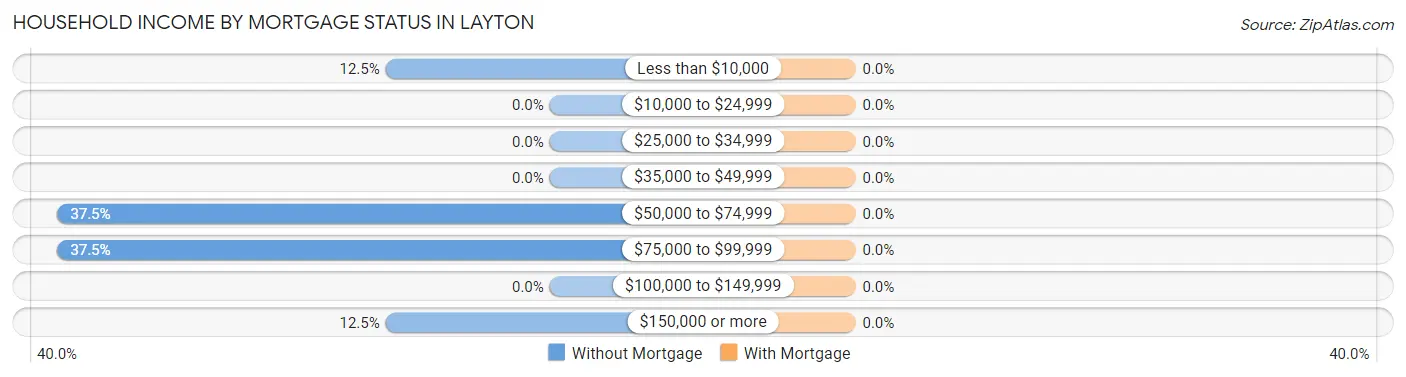
| Household Income | Without Mortgage | With Mortgage |
| Less than $10,000 | 2 (12.5%) | 0 (0.0%) |
| $10,000 to $24,999 | 0 (0.0%) | 0 (0.0%) |
| $25,000 to $34,999 | 0 (0.0%) | 0 (0.0%) |
| $35,000 to $49,999 | 0 (0.0%) | 0 (0.0%) |
| $50,000 to $74,999 | 6 (37.5%) | 0 (0.0%) |
| $75,000 to $99,999 | 6 (37.5%) | 0 (0.0%) |
| $100,000 to $149,999 | 0 (0.0%) | 0 (0.0%) |
| $150,000 or more | 2 (12.5%) | 0 (0.0%) |
| Total | 16 (100.0%) | 6 (100.0%) |
Property Value to Household Income Ratio in Layton
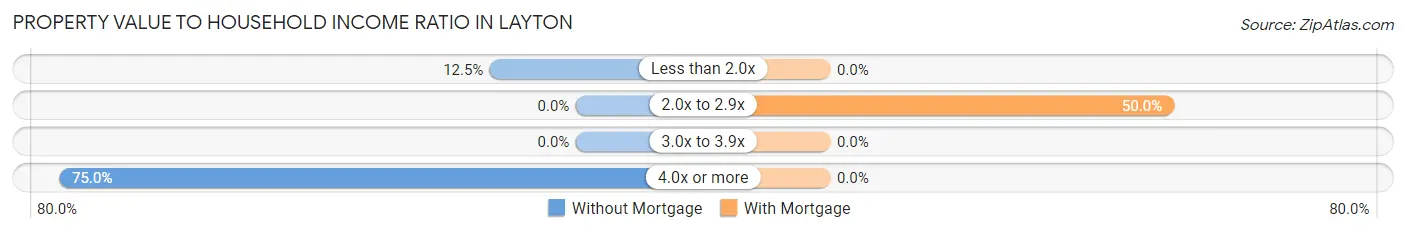
| Value-to-Income Ratio | Without Mortgage | With Mortgage |
| Less than 2.0x | 2 (12.5%) | 0 (0.0%) |
| 2.0x to 2.9x | 0 (0.0%) | 3 (50.0%) |
| 3.0x to 3.9x | 0 (0.0%) | 0 (0.0%) |
| 4.0x or more | 12 (75.0%) | 0 (0.0%) |
| Total | 16 (100.0%) | 6 (100.0%) |
Real Estate Taxes by Mortgage Status in Layton
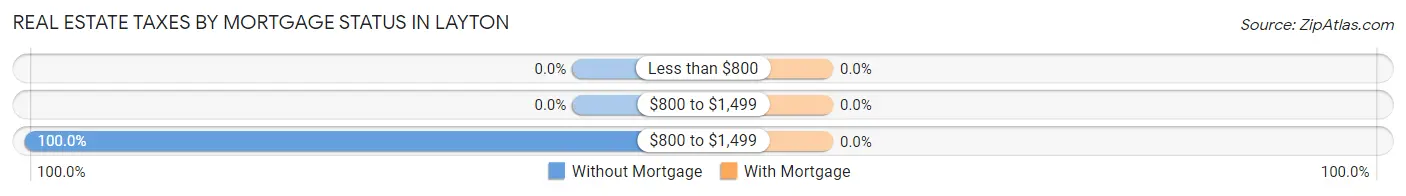
| Property Taxes | Without Mortgage | With Mortgage |
| Less than $800 | 0 (0.0%) | 0 (0.0%) |
| $800 to $1,499 | 0 (0.0%) | 0 (0.0%) |
| $800 to $1,499 | 16 (100.0%) | 0 (0.0%) |
| Total | 16 (100.0%) | 6 (100.0%) |
Health & Disability in Layton
Health Insurance Coverage by Age in Layton
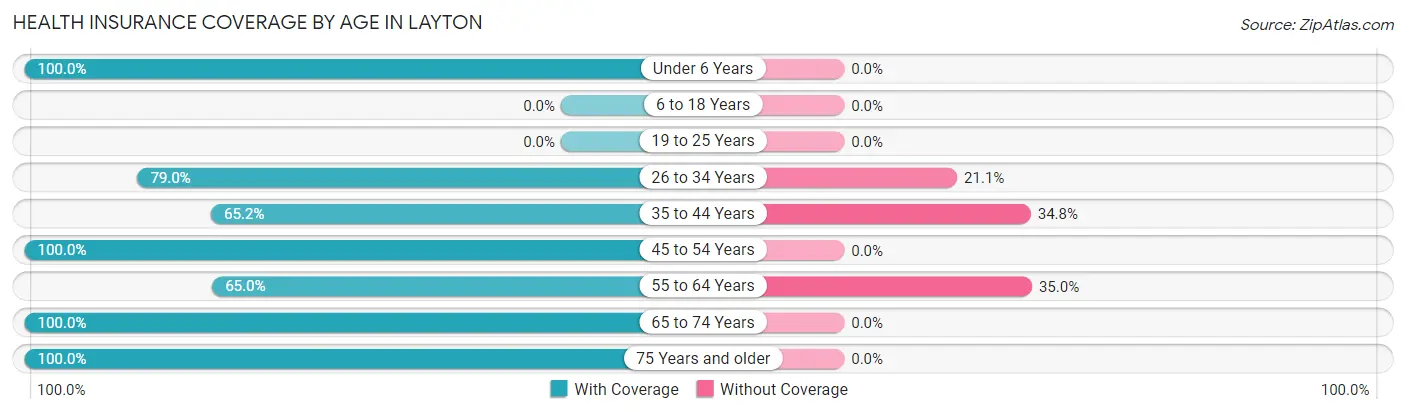
| Age Bracket | With Coverage | Without Coverage |
| Under 6 Years | 8 (100.0%) | 0 (0.0%) |
| 6 to 18 Years | 0 (0.0%) | 0 (0.0%) |
| 19 to 25 Years | 0 (0.0%) | 0 (0.0%) |
| 26 to 34 Years | 15 (78.9%) | 4 (21.0%) |
| 35 to 44 Years | 15 (65.2%) | 8 (34.8%) |
| 45 to 54 Years | 26 (100.0%) | 0 (0.0%) |
| 55 to 64 Years | 13 (65.0%) | 7 (35.0%) |
| 65 to 74 Years | 25 (100.0%) | 0 (0.0%) |
| 75 Years and older | 23 (100.0%) | 0 (0.0%) |
| Total | 125 (86.8%) | 19 (13.2%) |
Health Insurance Coverage by Citizenship Status in Layton
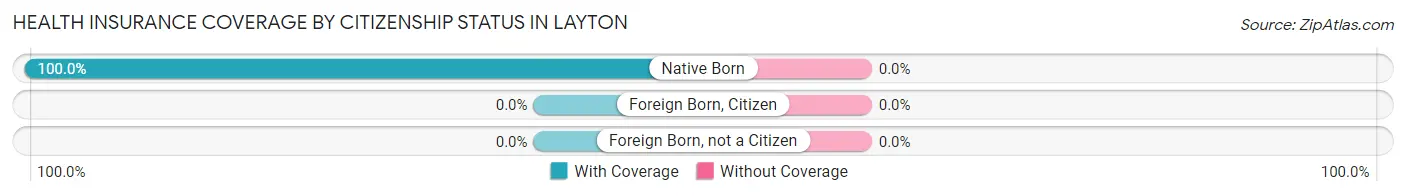
| Citizenship Status | With Coverage | Without Coverage |
| Native Born | 8 (100.0%) | 0 (0.0%) |
| Foreign Born, Citizen | 0 (0.0%) | 0 (0.0%) |
| Foreign Born, not a Citizen | 0 (0.0%) | 0 (0.0%) |
Health Insurance Coverage by Household Income in Layton
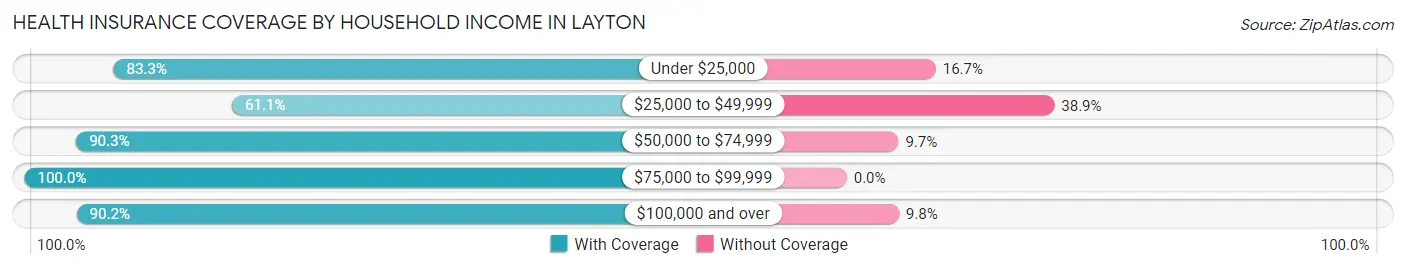
| Household Income | With Coverage | Without Coverage |
| Under $25,000 | 10 (83.3%) | 2 (16.7%) |
| $25,000 to $49,999 | 11 (61.1%) | 7 (38.9%) |
| $50,000 to $74,999 | 56 (90.3%) | 6 (9.7%) |
| $75,000 to $99,999 | 11 (100.0%) | 0 (0.0%) |
| $100,000 and over | 37 (90.2%) | 4 (9.8%) |
Public vs Private Health Insurance Coverage by Age in Layton
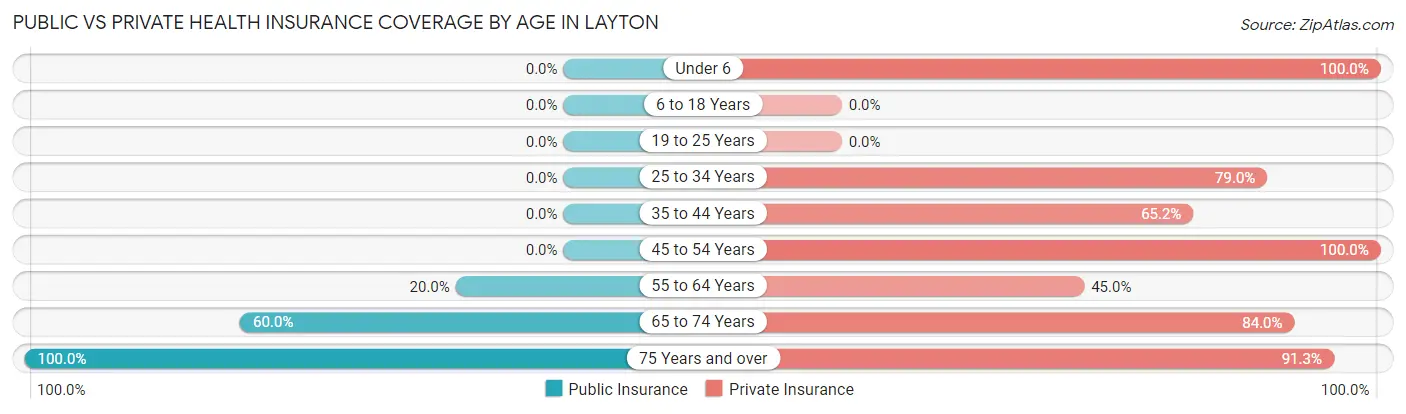
| Age Bracket | Public Insurance | Private Insurance |
| Under 6 | 0 (0.0%) | 8 (100.0%) |
| 6 to 18 Years | 0 (0.0%) | 0 (0.0%) |
| 19 to 25 Years | 0 (0.0%) | 0 (0.0%) |
| 25 to 34 Years | 0 (0.0%) | 15 (78.9%) |
| 35 to 44 Years | 0 (0.0%) | 15 (65.2%) |
| 45 to 54 Years | 0 (0.0%) | 26 (100.0%) |
| 55 to 64 Years | 4 (20.0%) | 9 (45.0%) |
| 65 to 74 Years | 15 (60.0%) | 21 (84.0%) |
| 75 Years and over | 23 (100.0%) | 21 (91.3%) |
| Total | 42 (29.2%) | 115 (79.9%) |
Disability Status by Sex by Age in Layton
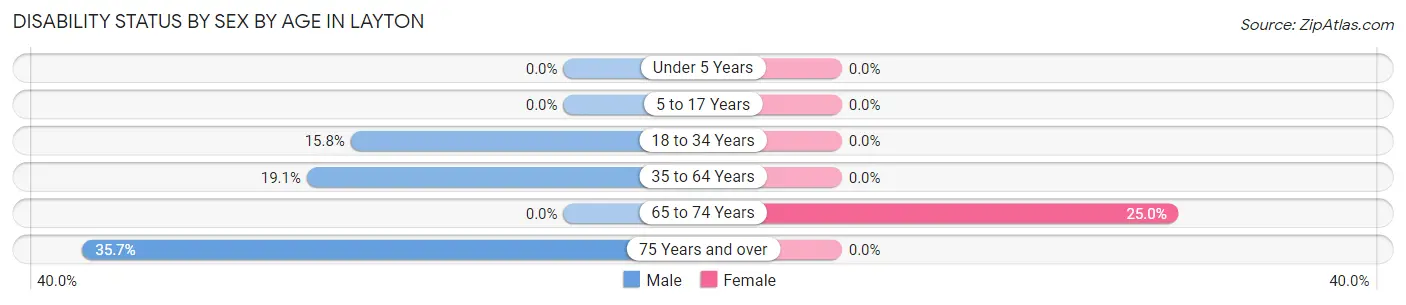
| Age Bracket | Male | Female |
| Under 5 Years | 0 (0.0%) | 0 (0.0%) |
| 5 to 17 Years | 0 (0.0%) | 0 (0.0%) |
| 18 to 34 Years | 3 (15.8%) | 0 (0.0%) |
| 35 to 64 Years | 4 (19.1%) | 0 (0.0%) |
| 65 to 74 Years | 0 (0.0%) | 2 (25.0%) |
| 75 Years and over | 5 (35.7%) | 0 (0.0%) |
Disability Class by Sex by Age in Layton
Disability Class: Hearing Difficulty
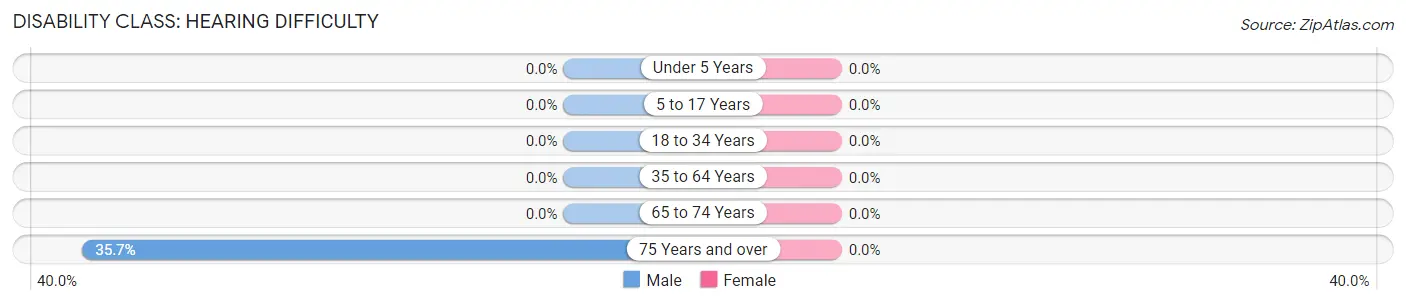
| Age Bracket | Male | Female |
| Under 5 Years | 0 (0.0%) | 0 (0.0%) |
| 5 to 17 Years | 0 (0.0%) | 0 (0.0%) |
| 18 to 34 Years | 0 (0.0%) | 0 (0.0%) |
| 35 to 64 Years | 0 (0.0%) | 0 (0.0%) |
| 65 to 74 Years | 0 (0.0%) | 0 (0.0%) |
| 75 Years and over | 5 (35.7%) | 0 (0.0%) |
Disability Class: Vision Difficulty
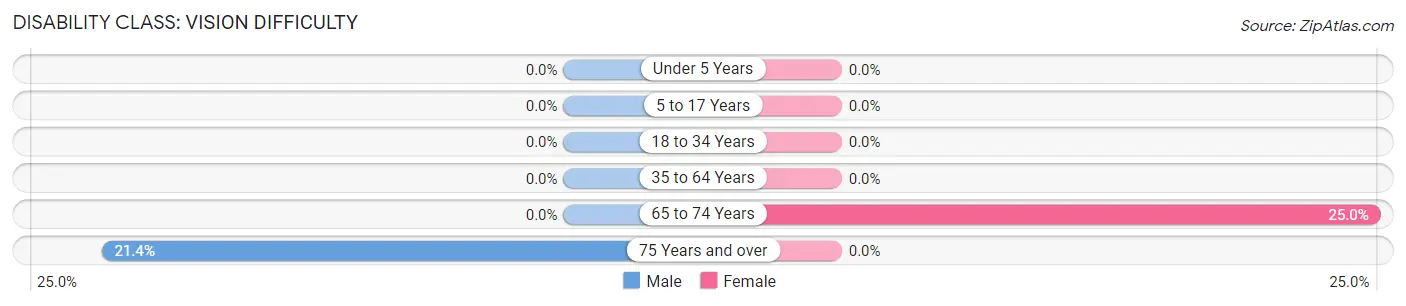
| Age Bracket | Male | Female |
| Under 5 Years | 0 (0.0%) | 0 (0.0%) |
| 5 to 17 Years | 0 (0.0%) | 0 (0.0%) |
| 18 to 34 Years | 0 (0.0%) | 0 (0.0%) |
| 35 to 64 Years | 0 (0.0%) | 0 (0.0%) |
| 65 to 74 Years | 0 (0.0%) | 2 (25.0%) |
| 75 Years and over | 3 (21.4%) | 0 (0.0%) |
Disability Class: Cognitive Difficulty
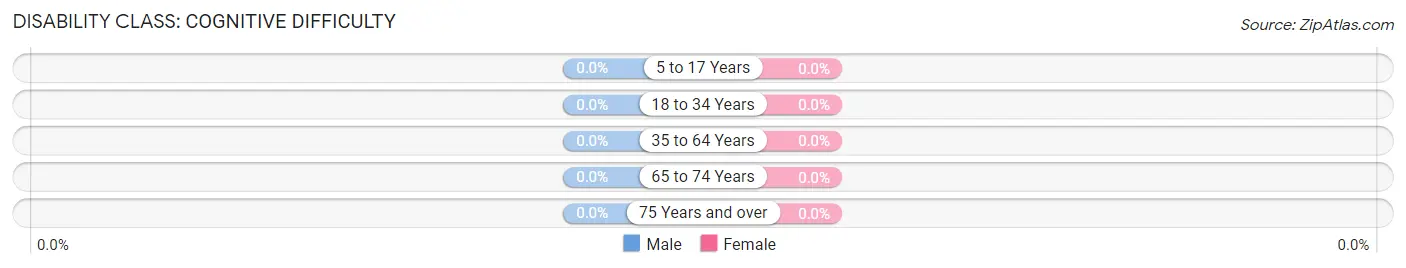
| Age Bracket | Male | Female |
| 5 to 17 Years | 0 (0.0%) | 0 (0.0%) |
| 18 to 34 Years | 0 (0.0%) | 0 (0.0%) |
| 35 to 64 Years | 0 (0.0%) | 0 (0.0%) |
| 65 to 74 Years | 0 (0.0%) | 0 (0.0%) |
| 75 Years and over | 0 (0.0%) | 0 (0.0%) |
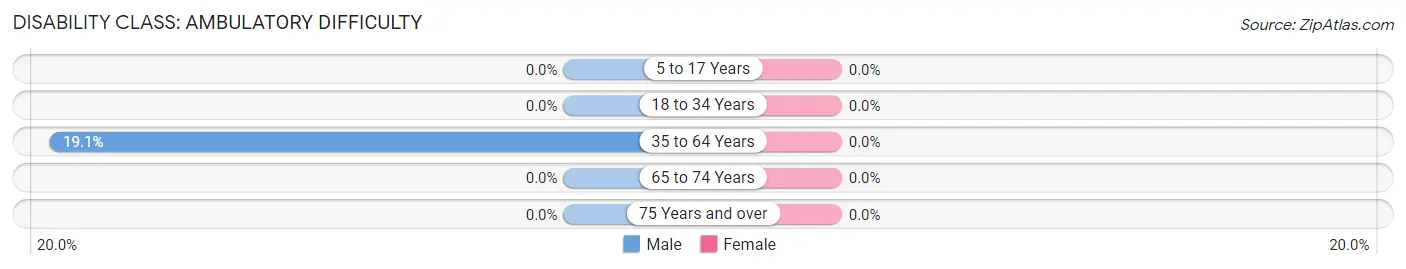
Disability Class: Ambulatory Difficulty
| Age Bracket | Male | Female |
| 5 to 17 Years | 0 (0.0%) | 0 (0.0%) |
| 18 to 34 Years | 0 (0.0%) | 0 (0.0%) |
| 35 to 64 Years | 4 (19.1%) | 0 (0.0%) |
| 65 to 74 Years | 0 (0.0%) | 0 (0.0%) |
| 75 Years and over | 0 (0.0%) | 0 (0.0%) |
Disability Class: Self-Care Difficulty
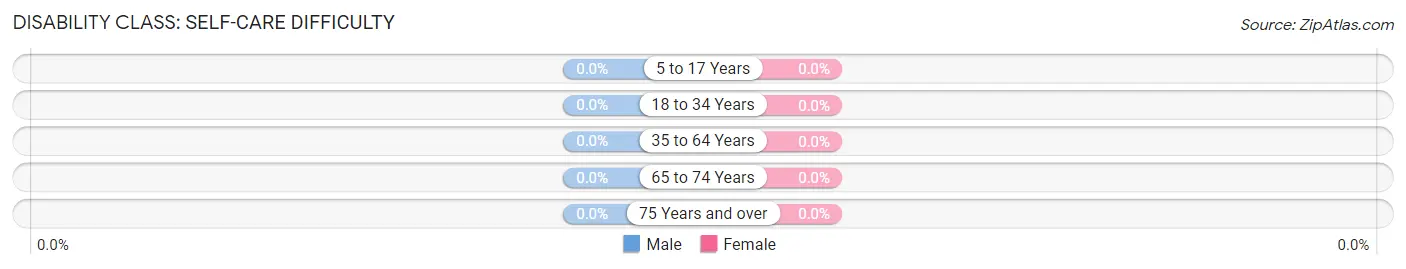
| Age Bracket | Male | Female |
| 5 to 17 Years | 0 (0.0%) | 0 (0.0%) |
| 18 to 34 Years | 0 (0.0%) | 0 (0.0%) |
| 35 to 64 Years | 0 (0.0%) | 0 (0.0%) |
| 65 to 74 Years | 0 (0.0%) | 0 (0.0%) |
| 75 Years and over | 0 (0.0%) | 0 (0.0%) |
Technology Access in Layton
Computing Device Access in Layton
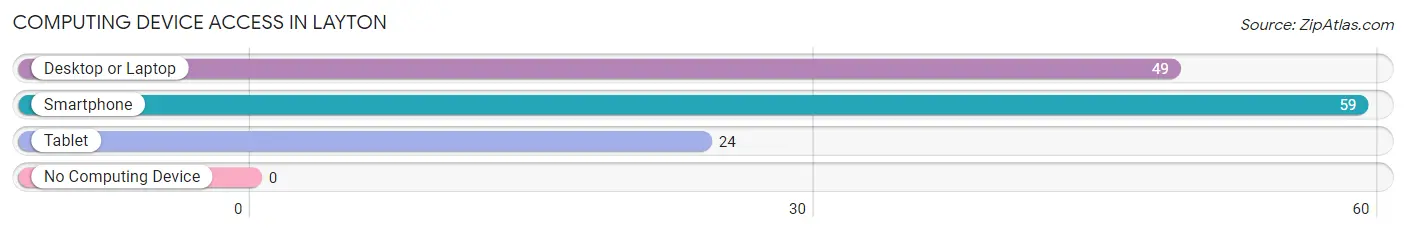
| Device Type | # Households | % Households |
| Desktop or Laptop | 49 | 83.1% |
| Smartphone | 59 | 100.0% |
| Tablet | 24 | 40.7% |
| No Computing Device | 0 | 0.0% |
| Total | 59 | 100.0% |
Internet Access in Layton
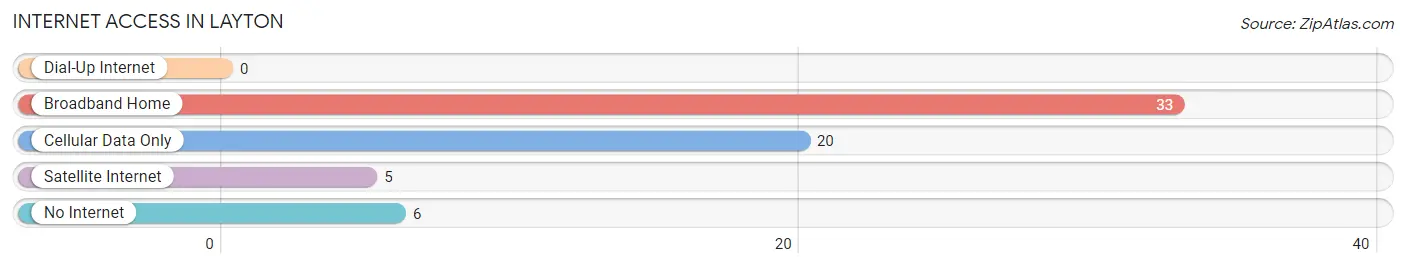
| Internet Type | # Households | % Households |
| Dial-Up Internet | 0 | 0.0% |
| Broadband Home | 33 | 55.9% |
| Cellular Data Only | 20 | 33.9% |
| Satellite Internet | 5 | 8.5% |
| No Internet | 6 | 10.2% |
| Total | 59 | 100.0% |
Layton Summary
History
Layton is a small unincorporated community located in Franklin County, Florida. It is situated on the Apalachicola River, approximately 20 miles south of Apalachicola. The area was first settled in the early 1800s by settlers from Georgia and Alabama. The town was named after the Layton family, who were among the first settlers in the area.
The town was originally a farming community, with cotton and corn being the main crops. In the late 1800s, the town began to grow as a commercial center, with a sawmill, gristmill, and general store. The town also had a post office, which opened in 1883.
In the early 1900s, the town began to decline as the timber industry moved away from the area. The town was also affected by the Great Depression, and many of the businesses closed. In the 1940s, the town began to revive as a fishing and shrimping center. The town also became a popular tourist destination, with many people coming to fish and hunt in the area.
Geography
Layton is located in Franklin County, Florida, on the Apalachicola River. The town is situated on the eastern side of the river, approximately 20 miles south of Apalachicola. The town is surrounded by wetlands and swamps, and is home to a variety of wildlife, including alligators, turtles, and birds.
The town is located in a humid subtropical climate, with hot, humid summers and mild winters. The average temperature in the summer is around 90 degrees Fahrenheit, and the average temperature in the winter is around 60 degrees Fahrenheit.
Economy
The economy of Layton is largely based on fishing and tourism. The town is home to several seafood restaurants, which serve fresh seafood caught in the area. The town is also a popular destination for fishing and hunting, and there are several charter fishing companies in the area.
The town is also home to several small businesses, including a general store, a gas station, and a few other shops. The town is also home to a few bed and breakfasts, which cater to tourists visiting the area.
Demographics
As of the 2010 census, the population of Layton was 1,093. The population is predominantly white, with African Americans making up the second largest racial group. The median household income in the town is $37,500, and the median age is 44.
The town is home to a variety of religious denominations, including Baptist, Methodist, and Catholic. The town is also home to a few churches, including the Layton United Methodist Church and the Layton Baptist Church.
Common Questions
What is Per Capita Income in Layton?
Per Capita income in Layton is $33,964.
What is the Median Family Income in Layton?
Median Family Income in Layton is $68,250.
What is the Median Household income in Layton?
Median Household Income in Layton is $63,542.
What is Income or Wage Gap in Layton?
Income or Wage Gap in Layton is 11.8%.
Women in Layton earn 88.2 cents for every dollar earned by a man.
What is Inequality or Gini Index in Layton?
Inequality or Gini Index in Layton is 0.44.
What is the Total Population of Layton?
Total Population of Layton is 144.
What is the Total Male Population of Layton?
Total Male Population of Layton is 79.
What is the Total Female Population of Layton?
Total Female Population of Layton is 65.
What is the Ratio of Males per 100 Females in Layton?
There are 121.54 Males per 100 Females in Layton.
What is the Ratio of Females per 100 Males in Layton?
There are 82.28 Females per 100 Males in Layton.
What is the Median Population Age in Layton?
Median Population Age in Layton is 52.2 Years.
What is the Average Family Size in Layton
Average Family Size in Layton is 3.4 People.
What is the Average Household Size in Layton
Average Household Size in Layton is 2.4 People.
How Large is the Labor Force in Layton?
There are 73 People in the Labor Forcein in Layton.
What is the Percentage of People in the Labor Force in Layton?
53.7% of People are in the Labor Force in Layton.