Ona, FL Map & Demographics
Ona Map
Ona Overview
$24,764
PER CAPITA INCOME
0.43
INEQUALITY / GINI INDEX
435
TOTAL POPULATION
209
MALE POPULATION
226
FEMALE POPULATION
92.48
MALES / 100 FEMALES
108.13
FEMALES / 100 MALES
34.3
MEDIAN AGE
5.7
AVG FAMILY SIZE
5.1
AVG HOUSEHOLD SIZE
236
LABOR FORCE [ PEOPLE ]
68.4%
PERCENT IN LABOR FORCE
Ona Zip Codes
Ona Area Codes
Income in Ona
Income Overview in Ona
| Characteristic | Number | Measure |
| Per Capita Income | 435 | $24,764 |
| Median Family Income | 73 | $0 |
| Mean Family Income | 73 | $129,289 |
| Median Household Income | 84 | $0 |
| Mean Household Income | 84 | $115,856 |
| Income Deficit | 73 | $0 |
| Wage / Income Gap (%) | 435 | 0.00% |
| Wage / Income Gap ($) | 435 | 100.00¢ per $1 |
| Gini / Inequality Index | 435 | 0.43 |
Earnings by Sex in Ona
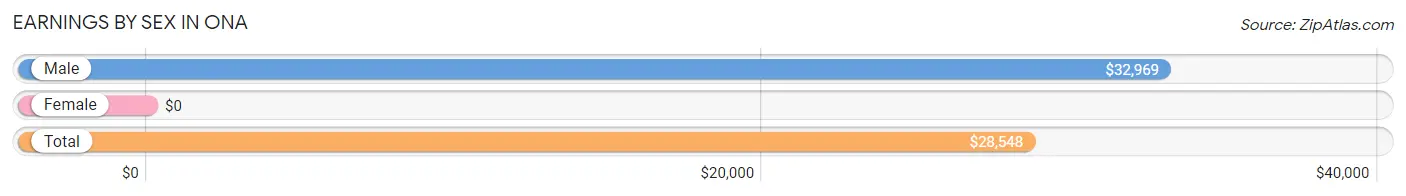
| Sex | Number | Average Earnings |
| Male | 129 (54.7%) | $32,969 |
| Female | 107 (45.3%) | $0 |
| Total | 236 (100.0%) | $28,548 |
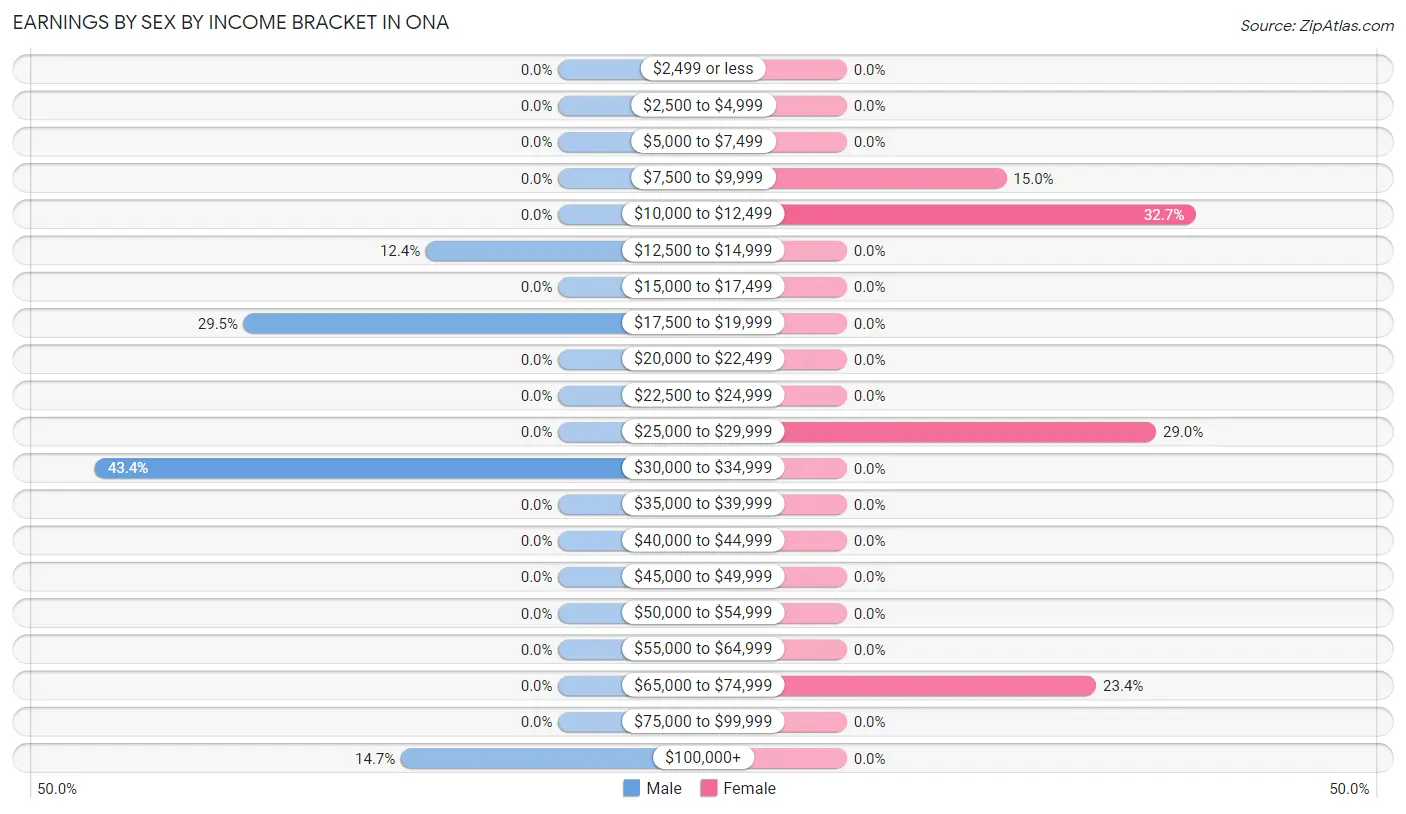
Earnings by Sex by Income Bracket in Ona
The most common earnings brackets in Ona are $30,000 to $34,999 for men (56 | 43.4%) and $10,000 to $12,499 for women (35 | 32.7%).
| Income | Male | Female |
| $2,499 or less | 0 (0.0%) | 0 (0.0%) |
| $2,500 to $4,999 | 0 (0.0%) | 0 (0.0%) |
| $5,000 to $7,499 | 0 (0.0%) | 0 (0.0%) |
| $7,500 to $9,999 | 0 (0.0%) | 16 (14.9%) |
| $10,000 to $12,499 | 0 (0.0%) | 35 (32.7%) |
| $12,500 to $14,999 | 16 (12.4%) | 0 (0.0%) |
| $15,000 to $17,499 | 0 (0.0%) | 0 (0.0%) |
| $17,500 to $19,999 | 38 (29.5%) | 0 (0.0%) |
| $20,000 to $22,499 | 0 (0.0%) | 0 (0.0%) |
| $22,500 to $24,999 | 0 (0.0%) | 0 (0.0%) |
| $25,000 to $29,999 | 0 (0.0%) | 31 (29.0%) |
| $30,000 to $34,999 | 56 (43.4%) | 0 (0.0%) |
| $35,000 to $39,999 | 0 (0.0%) | 0 (0.0%) |
| $40,000 to $44,999 | 0 (0.0%) | 0 (0.0%) |
| $45,000 to $49,999 | 0 (0.0%) | 0 (0.0%) |
| $50,000 to $54,999 | 0 (0.0%) | 0 (0.0%) |
| $55,000 to $64,999 | 0 (0.0%) | 0 (0.0%) |
| $65,000 to $74,999 | 0 (0.0%) | 25 (23.4%) |
| $75,000 to $99,999 | 0 (0.0%) | 0 (0.0%) |
| $100,000+ | 19 (14.7%) | 0 (0.0%) |
| Total | 129 (100.0%) | 107 (100.0%) |
Earnings by Sex by Educational Attainment in Ona
| Educational Attainment | Male Income | Female Income |
| Less than High School | - | - |
| High School Diploma | - | - |
| College or Associate's Degree | - | - |
| Bachelor's Degree | - | - |
| Graduate Degree | - | - |
| Total | $32,969 | $0 |
Family Income in Ona
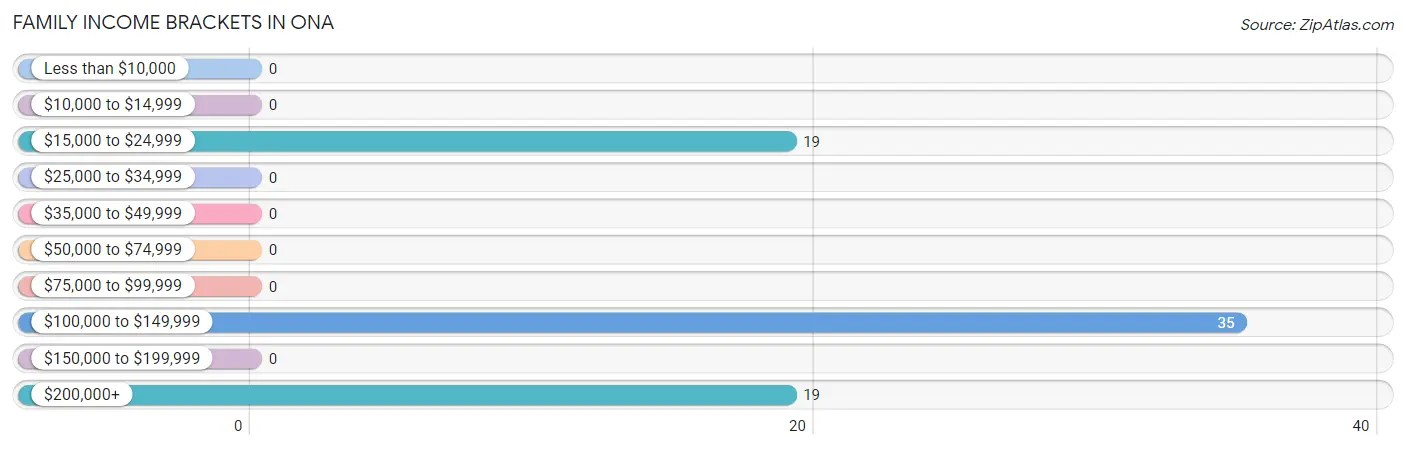
Family Income Brackets in Ona
According to the Ona family income data, there are 35 families falling into the $100,000 to $149,999 income range, which is the most common income bracket and makes up 47.9% of all families.
| Income Bracket | # Families | % Families |
| Less than $10,000 | 0 | 0.0% |
| $10,000 to $14,999 | 0 | 0.0% |
| $15,000 to $24,999 | 19 | 26.0% |
| $25,000 to $34,999 | 0 | 0.0% |
| $35,000 to $49,999 | 0 | 0.0% |
| $50,000 to $74,999 | 0 | 0.0% |
| $75,000 to $99,999 | 0 | 0.0% |
| $100,000 to $149,999 | 35 | 47.9% |
| $150,000 to $199,999 | 0 | 0.0% |
| $200,000+ | 19 | 26.0% |
Family Income by Famaliy Size in Ona
| Income Bracket | # Families | Median Income |
| 2-Person Families | 22 (30.1%) | $0 |
| 3-Person Families | 0 (0.0%) | $0 |
| 4-Person Families | 0 (0.0%) | $0 |
| 5-Person Families | 0 (0.0%) | $0 |
| 6-Person Families | 35 (47.9%) | $0 |
| 7+ Person Families | 16 (21.9%) | $0 |
| Total | 73 (100.0%) | $0 |
Family Income by Number of Earners in Ona
| Number of Earners | # Families | Median Income |
| No Earners | 3 (4.1%) | $0 |
| 1 Earner | 0 (0.0%) | $0 |
| 2 Earners | 35 (47.9%) | $0 |
| 3+ Earners | 35 (47.9%) | $0 |
| Total | 73 (100.0%) | $0 |
Household Income in Ona
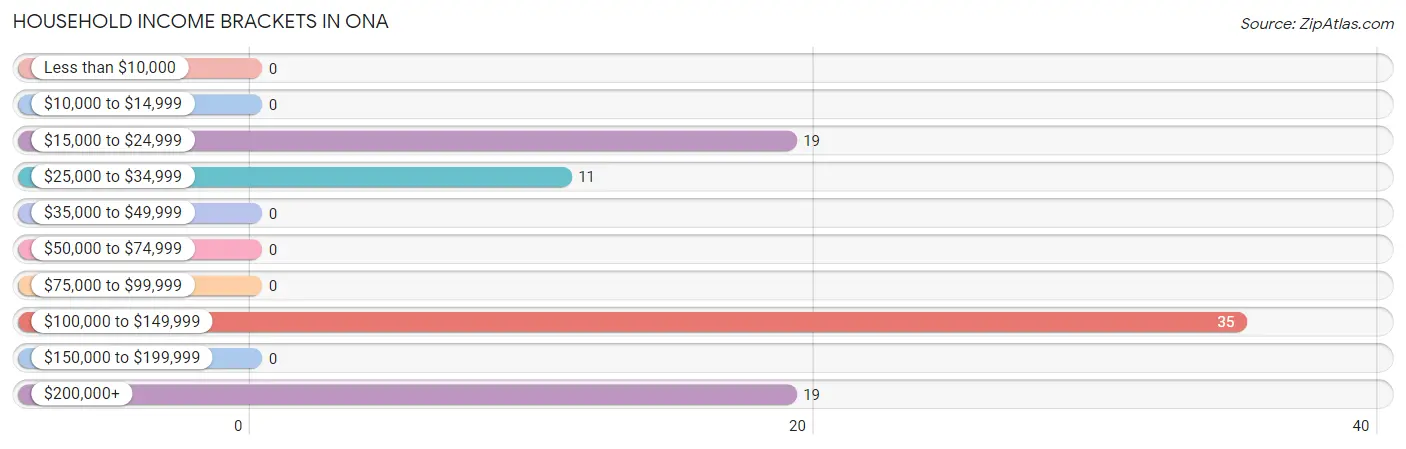
Household Income Brackets in Ona
With 35 households falling in the category, the $100,000 to $149,999 income range is the most frequent in Ona, accounting for 41.7% of all households.
| Income Bracket | # Households | % Households |
| Less than $10,000 | 0 | 0.0% |
| $10,000 to $14,999 | 0 | 0.0% |
| $15,000 to $24,999 | 19 | 22.6% |
| $25,000 to $34,999 | 11 | 13.1% |
| $35,000 to $49,999 | 0 | 0.0% |
| $50,000 to $74,999 | 0 | 0.0% |
| $75,000 to $99,999 | 0 | 0.0% |
| $100,000 to $149,999 | 35 | 41.7% |
| $150,000 to $199,999 | 0 | 0.0% |
| $200,000+ | 19 | 22.6% |
Household Income by Householder Age in Ona
| Income Bracket | # Households | Median Income |
| 15 to 24 Years | 0 (0.0%) | $0 |
| 25 to 44 Years | 0 (0.0%) | $0 |
| 45 to 64 Years | 70 (83.3%) | $0 |
| 65+ Years | 14 (16.7%) | $0 |
| Total | 84 (100.0%) | $0 |
Poverty in Ona
Income Below Poverty by Sex and Age in Ona
With 39.2% poverty level for males and 31.4% for females among the residents of Ona, 6 to 11 year old males and 6 to 11 year old females are the most vulnerable to poverty, with 17 males (100.0%) and 22 females (100.0%) in their respective age groups living below the poverty level.
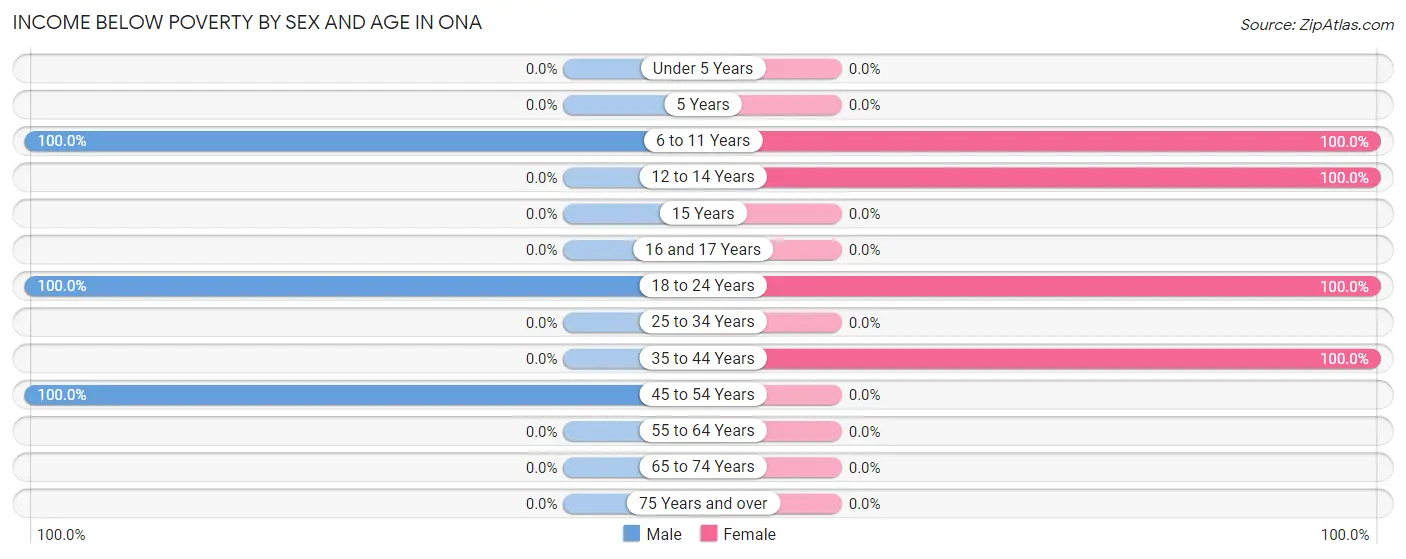
| Age Bracket | Male | Female |
| Under 5 Years | 0 (0.0%) | 0 (0.0%) |
| 5 Years | 0 (0.0%) | 0 (0.0%) |
| 6 to 11 Years | 17 (100.0%) | 22 (100.0%) |
| 12 to 14 Years | 0 (0.0%) | 22 (100.0%) |
| 15 Years | 0 (0.0%) | 0 (0.0%) |
| 16 and 17 Years | 0 (0.0%) | 0 (0.0%) |
| 18 to 24 Years | 42 (100.0%) | 11 (100.0%) |
| 25 to 34 Years | 0 (0.0%) | 0 (0.0%) |
| 35 to 44 Years | 0 (0.0%) | 16 (100.0%) |
| 45 to 54 Years | 23 (100.0%) | 0 (0.0%) |
| 55 to 64 Years | 0 (0.0%) | 0 (0.0%) |
| 65 to 74 Years | 0 (0.0%) | 0 (0.0%) |
| 75 Years and over | 0 (0.0%) | 0 (0.0%) |
| Total | 82 (39.2%) | 71 (31.4%) |
Income Above Poverty by Sex and Age in Ona
According to the poverty statistics in Ona, males aged 25 to 34 years and females aged 15 years are the age groups that are most secure financially, with 100.0% of males and 100.0% of females in these age groups living above the poverty line.
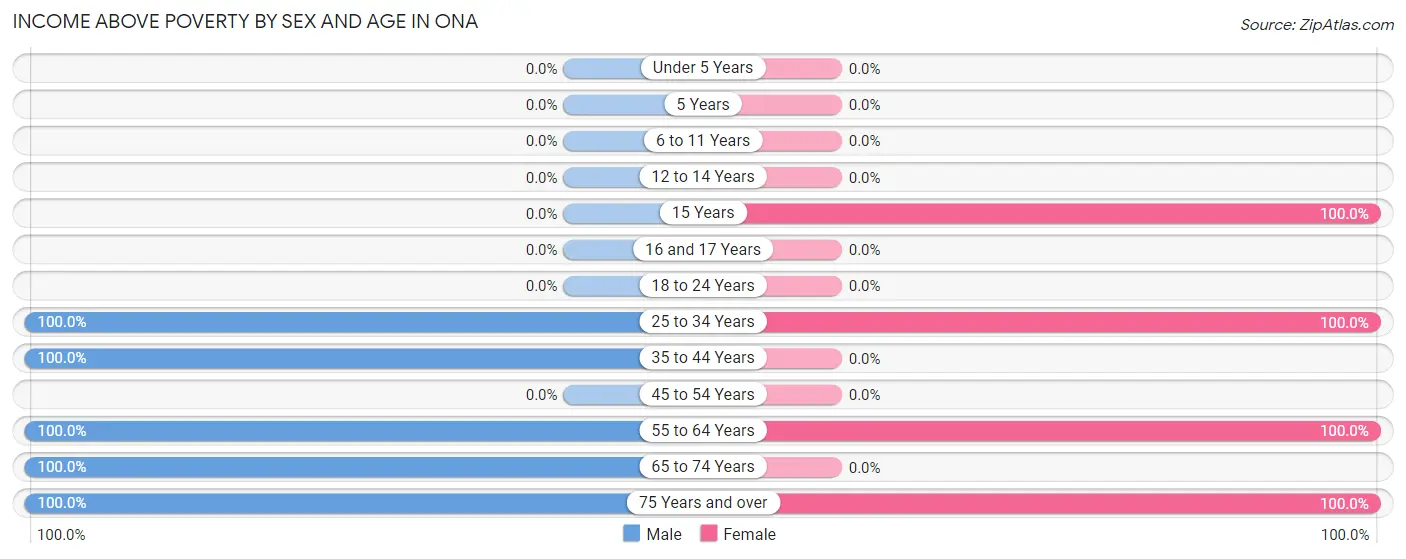
| Age Bracket | Male | Female |
| Under 5 Years | 0 (0.0%) | 0 (0.0%) |
| 5 Years | 0 (0.0%) | 0 (0.0%) |
| 6 to 11 Years | 0 (0.0%) | 0 (0.0%) |
| 12 to 14 Years | 0 (0.0%) | 0 (0.0%) |
| 15 Years | 0 (0.0%) | 29 (100.0%) |
| 16 and 17 Years | 0 (0.0%) | 0 (0.0%) |
| 18 to 24 Years | 0 (0.0%) | 0 (0.0%) |
| 25 to 34 Years | 38 (100.0%) | 63 (100.0%) |
| 35 to 44 Years | 56 (100.0%) | 0 (0.0%) |
| 45 to 54 Years | 0 (0.0%) | 0 (0.0%) |
| 55 to 64 Years | 19 (100.0%) | 60 (100.0%) |
| 65 to 74 Years | 11 (100.0%) | 0 (0.0%) |
| 75 Years and over | 3 (100.0%) | 3 (100.0%) |
| Total | 127 (60.8%) | 155 (68.6%) |
Income Below Poverty Among Married-Couple Families in Ona
The poverty statistics for married-couple families in Ona show that 42.1% or 16 of the total 38 families live below the poverty line. Families with 3 or 4 children have the highest poverty rate of 100.0%, comprising of 16 families. On the other hand, families with no children have the lowest poverty rate of 0.0%, which includes 0 families.
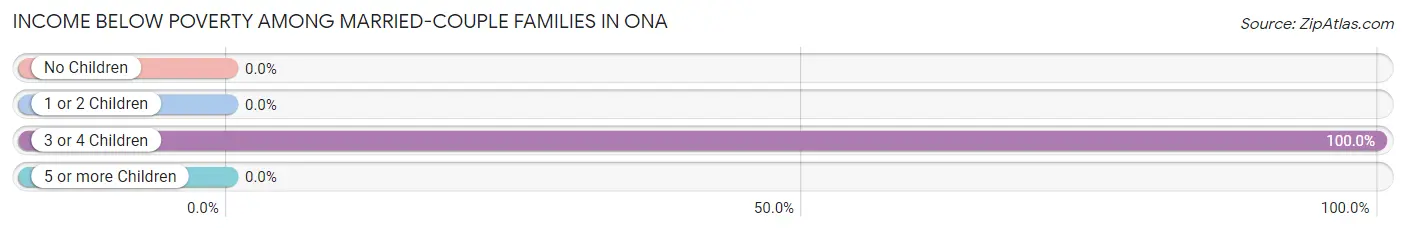
| Children | Above Poverty | Below Poverty |
| No Children | 22 (100.0%) | 0 (0.0%) |
| 1 or 2 Children | 0 (0.0%) | 0 (0.0%) |
| 3 or 4 Children | 0 (0.0%) | 16 (100.0%) |
| 5 or more Children | 0 (0.0%) | 0 (0.0%) |
| Total | 22 (57.9%) | 16 (42.1%) |
Income Below Poverty Among Single-Parent Households in Ona
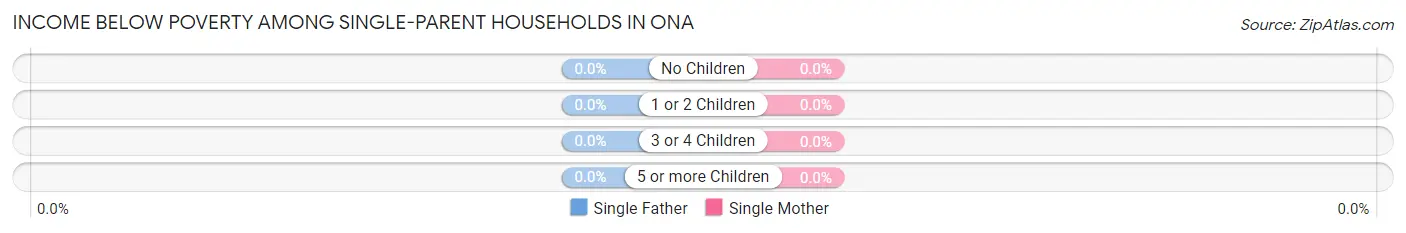
| Children | Single Father | Single Mother |
| No Children | 0 (0.0%) | 0 (0.0%) |
| 1 or 2 Children | 0 (0.0%) | 0 (0.0%) |
| 3 or 4 Children | 0 (0.0%) | 0 (0.0%) |
| 5 or more Children | 0 (0.0%) | 0 (0.0%) |
| Total | 0 (0.0%) | 0 (0.0%) |
Income Below Poverty Among Married-Couple vs Single-Parent Households in Ona
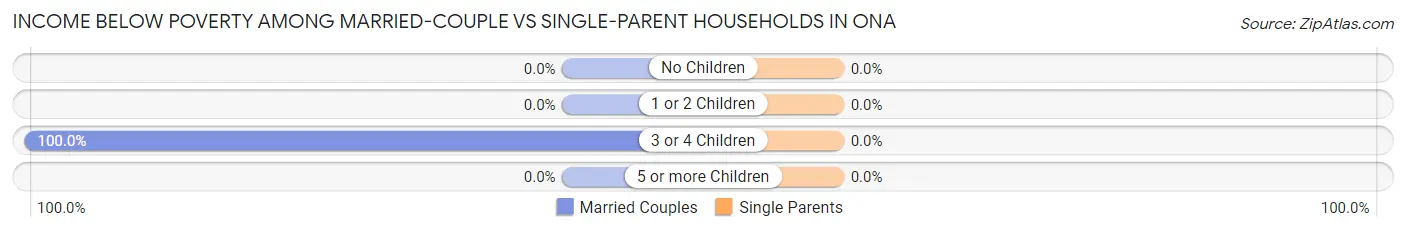
| Children | Married-Couple Families | Single-Parent Households |
| No Children | 0 (0.0%) | 0 (0.0%) |
| 1 or 2 Children | 0 (0.0%) | 0 (0.0%) |
| 3 or 4 Children | 16 (100.0%) | 0 (0.0%) |
| 5 or more Children | 0 (0.0%) | 0 (0.0%) |
| Total | 16 (42.1%) | 0 (0.0%) |
Race in Ona
The most populous races in Ona are White / Caucasian (428 | 98.4%), Hispanic or Latino (367 | 84.4%), and Black / African American (7 | 1.6%).
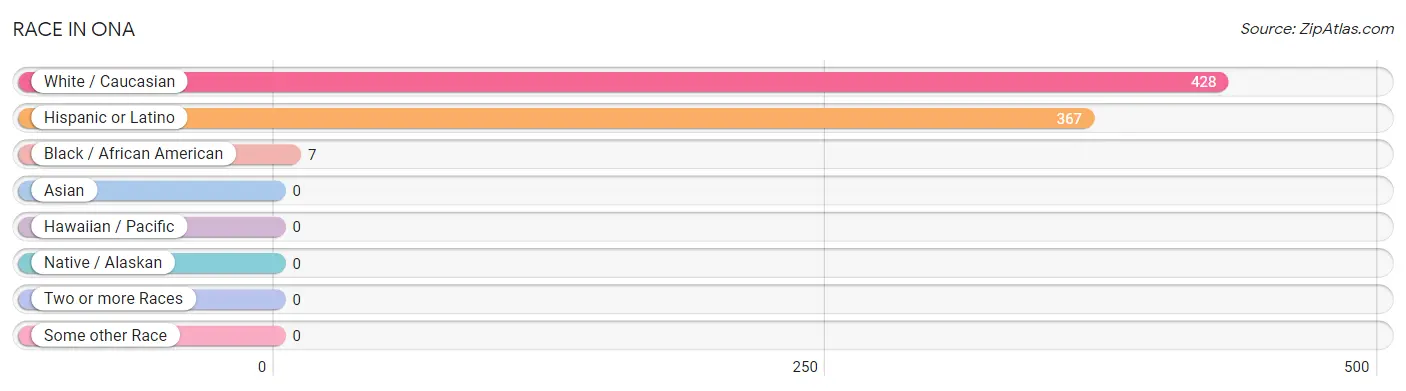
| Race | # Population | % Population |
| Asian | 0 | 0.0% |
| Black / African American | 7 | 1.6% |
| Hawaiian / Pacific | 0 | 0.0% |
| Hispanic or Latino | 367 | 84.4% |
| Native / Alaskan | 0 | 0.0% |
| White / Caucasian | 428 | 98.4% |
| Two or more Races | 0 | 0.0% |
| Some other Race | 0 | 0.0% |
| Total | 435 | 100.0% |
Ancestry in Ona
The most populous ancestries reported in Ona are Mexican (367 | 84.4%), and American (44 | 10.1%), together accounting for 94.5% of all Ona residents.
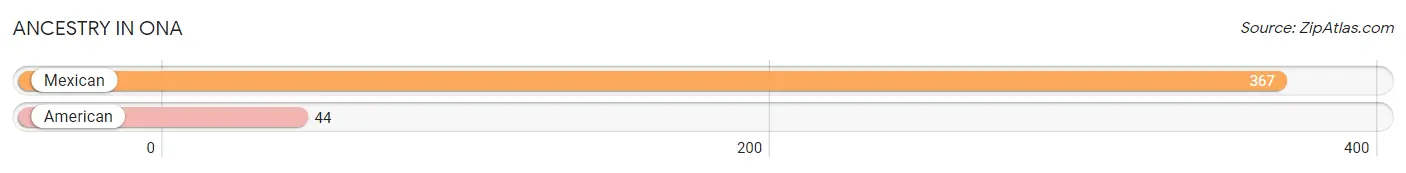
| Ancestry | # Population | % Population |
| American | 44 | 10.1% |
| Mexican | 367 | 84.4% | View All 2 Rows |
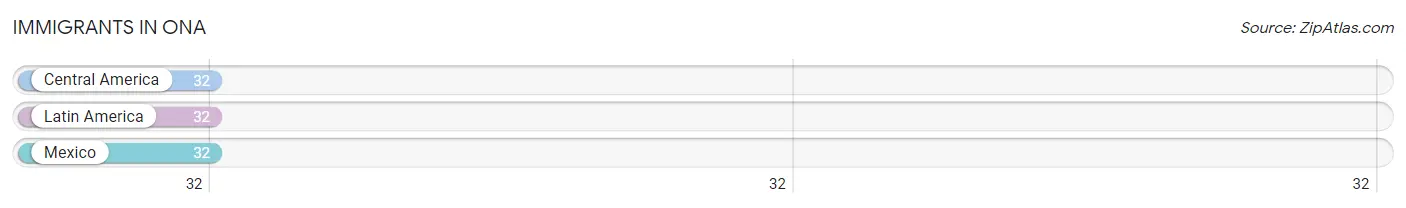
Immigrants in Ona
The most numerous immigrant groups reported in Ona came from Central America (32 | 7.4%), Latin America (32 | 7.4%), and Mexico (32 | 7.4%), together accounting for 22.1% of all Ona residents.
| Immigration Origin | # Population | % Population |
| Central America | 32 | 7.4% |
| Latin America | 32 | 7.4% |
| Mexico | 32 | 7.4% | View All 3 Rows |
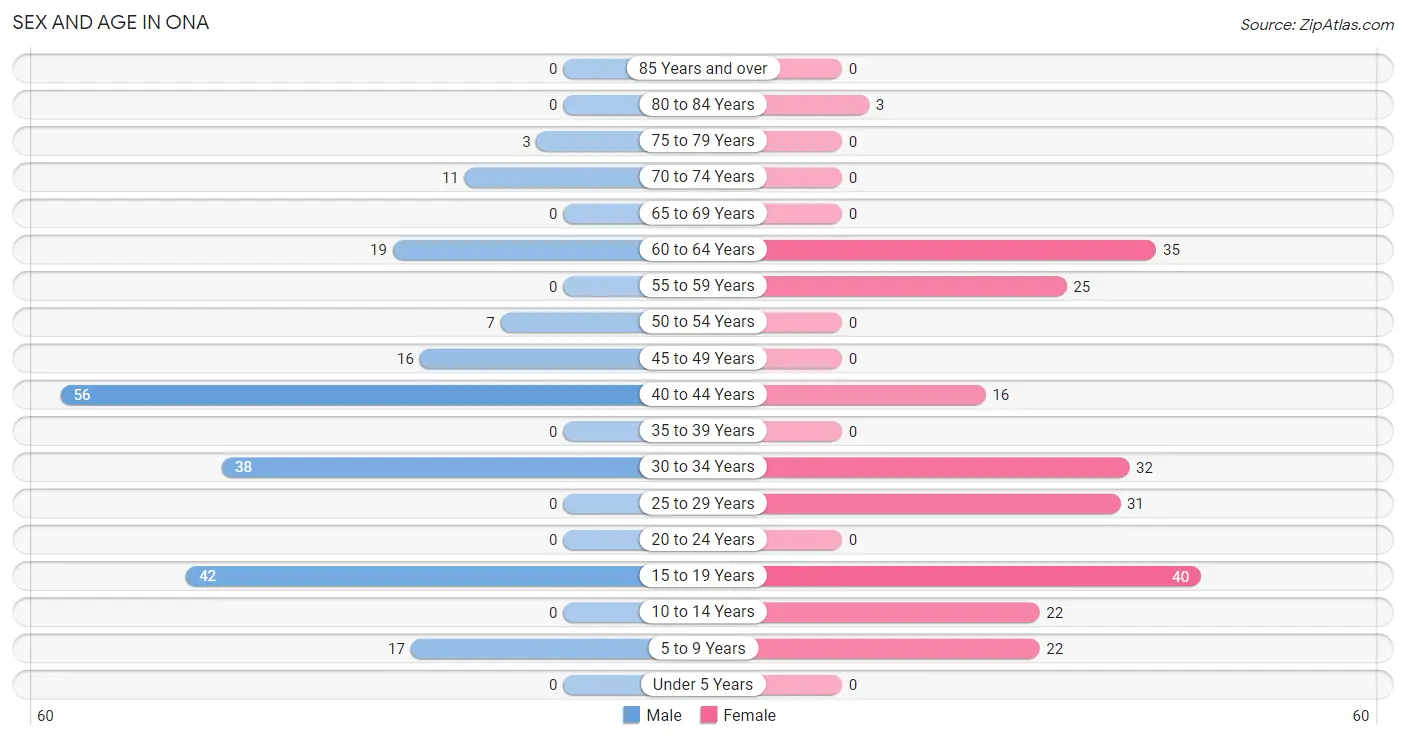
Sex and Age in Ona
Sex and Age in Ona
The most populous age groups in Ona are 40 to 44 Years (56 | 26.8%) for men and 15 to 19 Years (40 | 17.7%) for women.
| Age Bracket | Male | Female |
| Under 5 Years | 0 (0.0%) | 0 (0.0%) |
| 5 to 9 Years | 17 (8.1%) | 22 (9.7%) |
| 10 to 14 Years | 0 (0.0%) | 22 (9.7%) |
| 15 to 19 Years | 42 (20.1%) | 40 (17.7%) |
| 20 to 24 Years | 0 (0.0%) | 0 (0.0%) |
| 25 to 29 Years | 0 (0.0%) | 31 (13.7%) |
| 30 to 34 Years | 38 (18.2%) | 32 (14.2%) |
| 35 to 39 Years | 0 (0.0%) | 0 (0.0%) |
| 40 to 44 Years | 56 (26.8%) | 16 (7.1%) |
| 45 to 49 Years | 16 (7.7%) | 0 (0.0%) |
| 50 to 54 Years | 7 (3.4%) | 0 (0.0%) |
| 55 to 59 Years | 0 (0.0%) | 25 (11.1%) |
| 60 to 64 Years | 19 (9.1%) | 35 (15.5%) |
| 65 to 69 Years | 0 (0.0%) | 0 (0.0%) |
| 70 to 74 Years | 11 (5.3%) | 0 (0.0%) |
| 75 to 79 Years | 3 (1.4%) | 0 (0.0%) |
| 80 to 84 Years | 0 (0.0%) | 3 (1.3%) |
| 85 Years and over | 0 (0.0%) | 0 (0.0%) |
| Total | 209 (100.0%) | 226 (100.0%) |
Families and Households in Ona
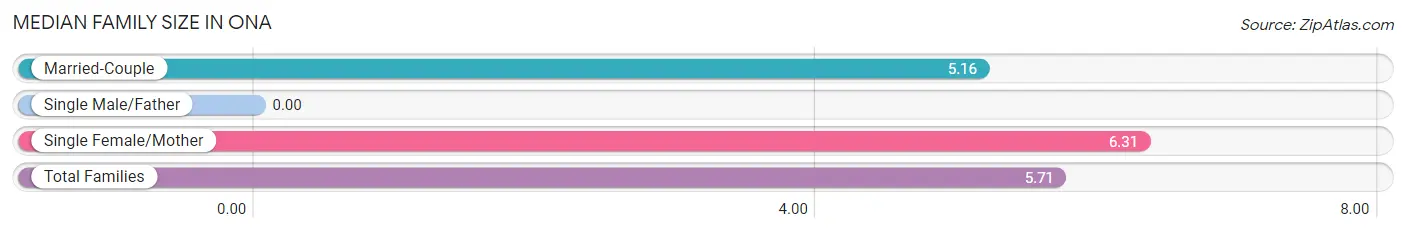
Median Family Size in Ona
| Family Type | # Families | Family Size |
| Married-Couple | 38 (52.0%) | 5.16 |
| Single Male/Father | 0 (0.0%) | - |
| Single Female/Mother | 35 (47.9%) | 6.31 |
| Total Families | 73 (100.0%) | 5.71 |
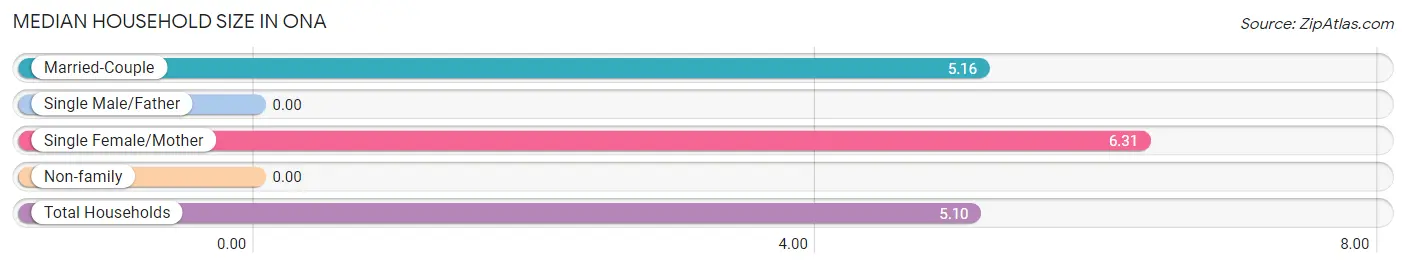
Median Household Size in Ona
| Household Type | # Households | Household Size |
| Married-Couple | 38 (45.2%) | 5.16 |
| Single Male/Father | 0 (0.0%) | - |
| Single Female/Mother | 35 (41.7%) | 6.31 |
| Non-family | 11 (13.1%) | - |
| Total Households | 84 (100.0%) | 5.10 |
Household Size by Marriage Status in Ona
Out of a total of 84 households in Ona, 73 (86.9%) are family households, while 11 (13.1%) are nonfamily households. The most numerous type of family households are 6-person households, comprising 35, and the most common type of nonfamily households are 1-person households, comprising 11.
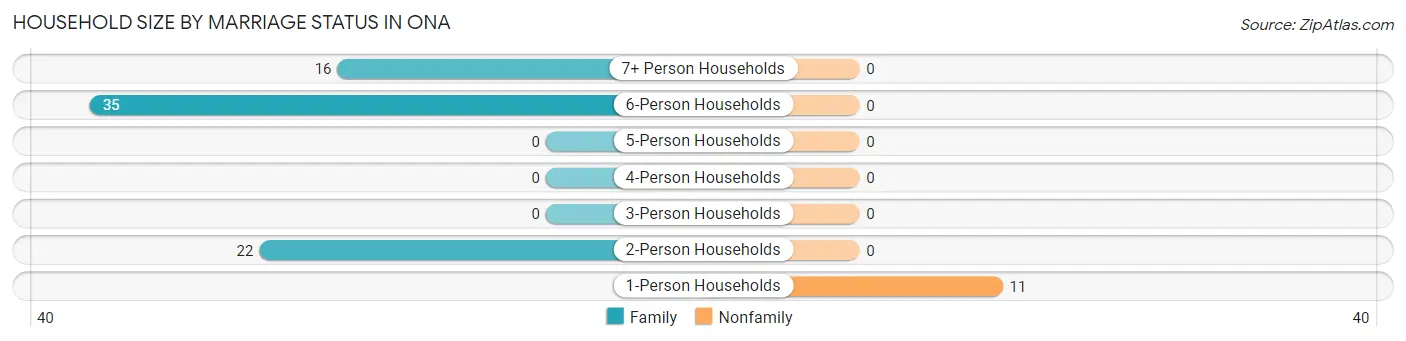
| Household Size | Family Households | Nonfamily Households |
| 1-Person Households | - | 11 (13.1%) |
| 2-Person Households | 22 (26.2%) | 0 (0.0%) |
| 3-Person Households | 0 (0.0%) | 0 (0.0%) |
| 4-Person Households | 0 (0.0%) | 0 (0.0%) |
| 5-Person Households | 0 (0.0%) | 0 (0.0%) |
| 6-Person Households | 35 (41.7%) | 0 (0.0%) |
| 7+ Person Households | 16 (19.1%) | 0 (0.0%) |
| Total | 73 (86.9%) | 11 (13.1%) |
Female Fertility in Ona
Fertility by Age in Ona
| Age Bracket | Women with Births | Births / 1,000 Women |
| 15 to 19 years | 0 (0.0%) | 0.0 |
| 20 to 34 years | 0 (0.0%) | 0.0 |
| 35 to 50 years | 0 (0.0%) | 0.0 |
| Total | 0 (0.0%) | 0.0 |
Fertility by Age by Marriage Status in Ona
| Age Bracket | Married | Unmarried |
| 15 to 19 years | 0 (0.0%) | 0 (0.0%) |
| 20 to 34 years | 0 (0.0%) | 0 (0.0%) |
| 35 to 50 years | 0 (0.0%) | 0 (0.0%) |
| Total | 0 (0.0%) | 0 (0.0%) |
Fertility by Education in Ona
| Educational Attainment | Women with Births | Births / 1,000 Women |
| Less than High School | 0 (0.0%) | 0.0 |
| High School Diploma | 0 (0.0%) | 0.0 |
| College or Associate's Degree | 0 (0.0%) | 0.0 |
| Bachelor's Degree | 0 (0.0%) | 0.0 |
| Graduate Degree | 0 (0.0%) | 0.0 |
| Total | 0 (0.0%) | 0.0 |
Fertility by Education by Marriage Status in Ona
| Educational Attainment | Married | Unmarried |
| Less than High School | 0 (0.0%) | 0 (0.0%) |
| High School Diploma | 0 (0.0%) | 0 (0.0%) |
| College or Associate's Degree | 0 (0.0%) | 0 (0.0%) |
| Bachelor's Degree | 0 (0.0%) | 0 (0.0%) |
| Graduate Degree | 0 (0.0%) | 0 (0.0%) |
| Total | 0 (0.0%) | 0 (0.0%) |
Employment Characteristics in Ona
Employment by Class of Employer in Ona
Among the 236 employed individuals in Ona, private company employees (82 | 34.7%), local government employees (60 | 25.4%), and self-employed (not incorporated) (56 | 23.7%) make up the most common classes of employment.
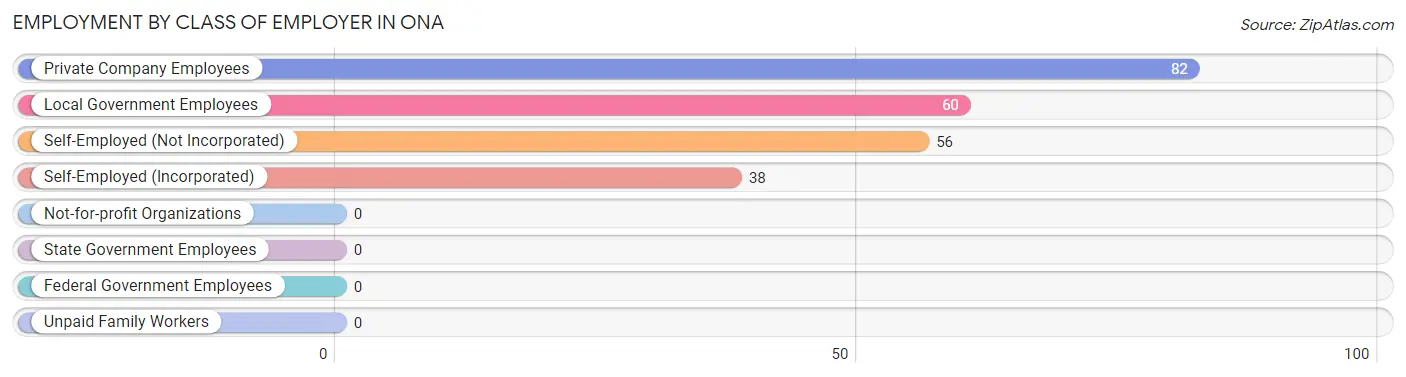
| Employer Class | # Employees | % Employees |
| Private Company Employees | 82 | 34.7% |
| Self-Employed (Incorporated) | 38 | 16.1% |
| Self-Employed (Not Incorporated) | 56 | 23.7% |
| Not-for-profit Organizations | 0 | 0.0% |
| Local Government Employees | 60 | 25.4% |
| State Government Employees | 0 | 0.0% |
| Federal Government Employees | 0 | 0.0% |
| Unpaid Family Workers | 0 | 0.0% |
| Total | 236 | 100.0% |
Employment Status by Age in Ona
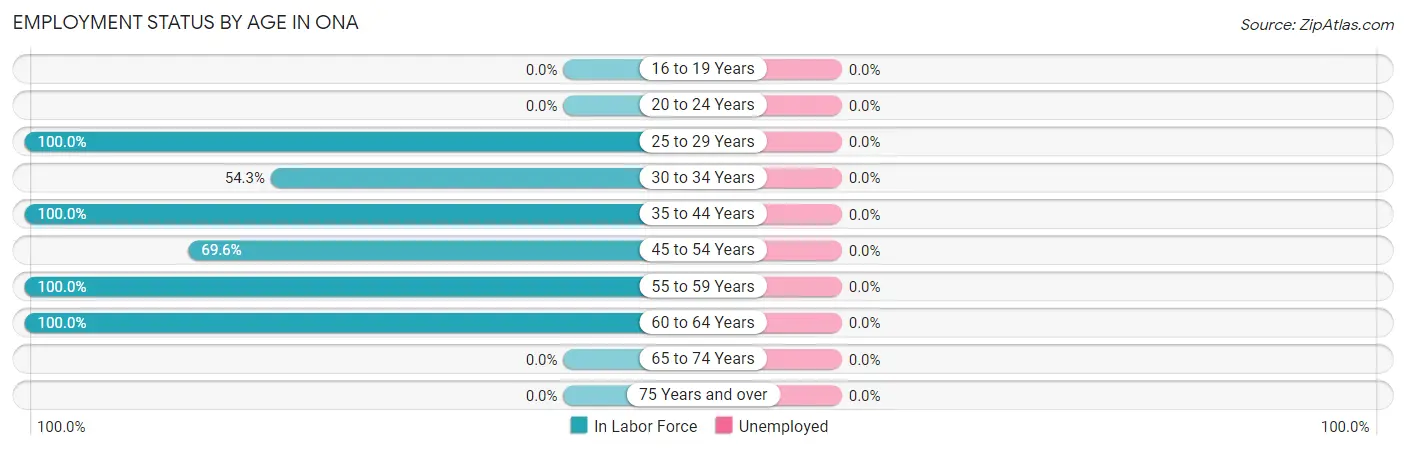
| Age Bracket | In Labor Force | Unemployed |
| 16 to 19 Years | 0 (0.0%) | 0 (0.0%) |
| 20 to 24 Years | 0 (0.0%) | 0 (0.0%) |
| 25 to 29 Years | 31 (100.0%) | 0 (0.0%) |
| 30 to 34 Years | 38 (54.3%) | 0 (0.0%) |
| 35 to 44 Years | 72 (100.0%) | 0 (0.0%) |
| 45 to 54 Years | 16 (69.6%) | 0 (0.0%) |
| 55 to 59 Years | 25 (100.0%) | 0 (0.0%) |
| 60 to 64 Years | 54 (100.0%) | 0 (0.0%) |
| 65 to 74 Years | 0 (0.0%) | 0 (0.0%) |
| 75 Years and over | 0 (0.0%) | 0 (0.0%) |
| Total | 236 (68.4%) | 0 (0.0%) |
Employment Status by Educational Attainment in Ona
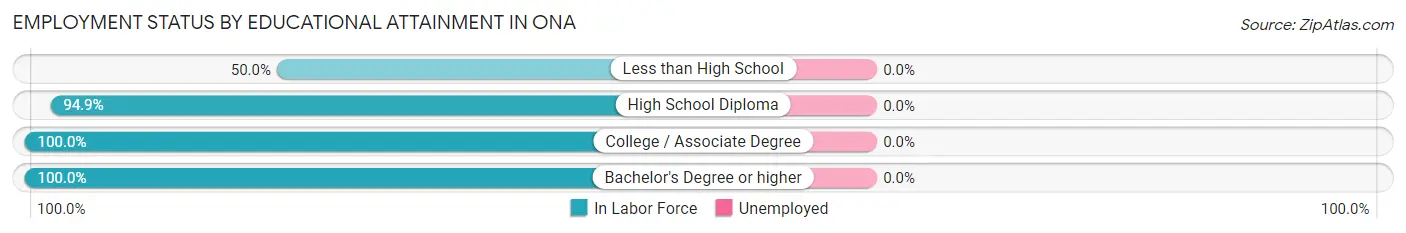
| Educational Attainment | In Labor Force | Unemployed |
| Less than High School | 32 (50.0%) | 0 (0.0%) |
| High School Diploma | 129 (94.9%) | 0 (0.0%) |
| College / Associate Degree | 31 (100.0%) | 0 (0.0%) |
| Bachelor's Degree or higher | 44 (100.0%) | 0 (0.0%) |
| Total | 236 (85.8%) | 0 (0.0%) |
Employment Occupations by Sex in Ona
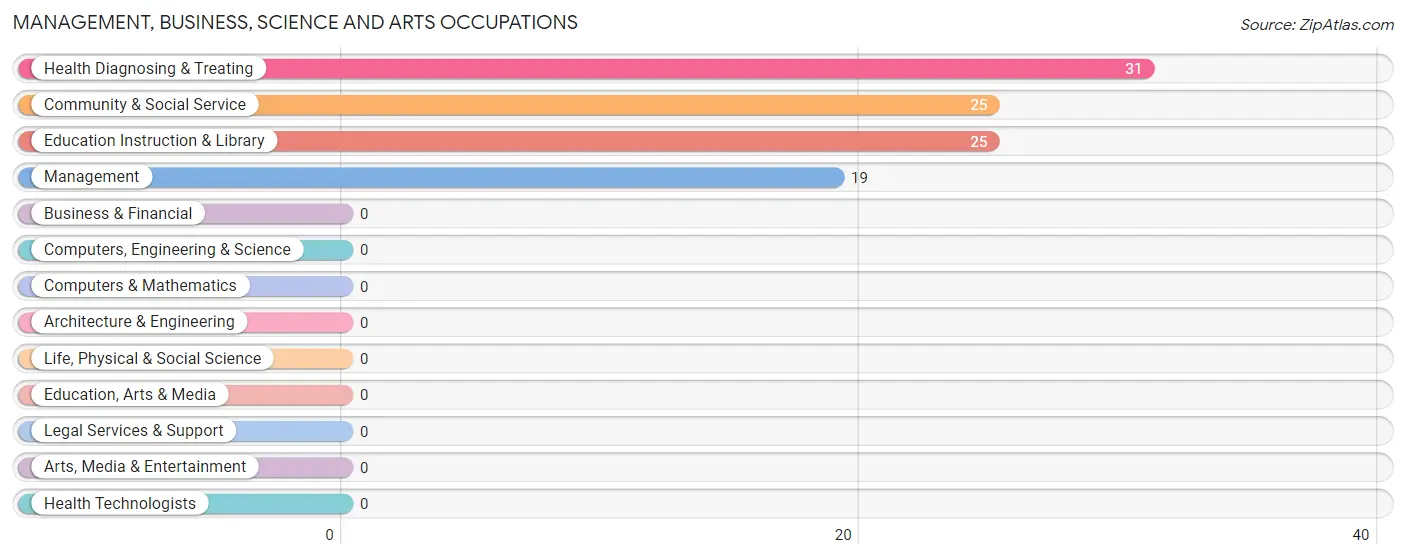
Management, Business, Science and Arts Occupations
The most common Management, Business, Science and Arts occupations in Ona are Health Diagnosing & Treating (31 | 13.1%), Community & Social Service (25 | 10.6%), Education Instruction & Library (25 | 10.6%), and Management (19 | 8.1%).
Management, Business, Science and Arts Occupations by Sex
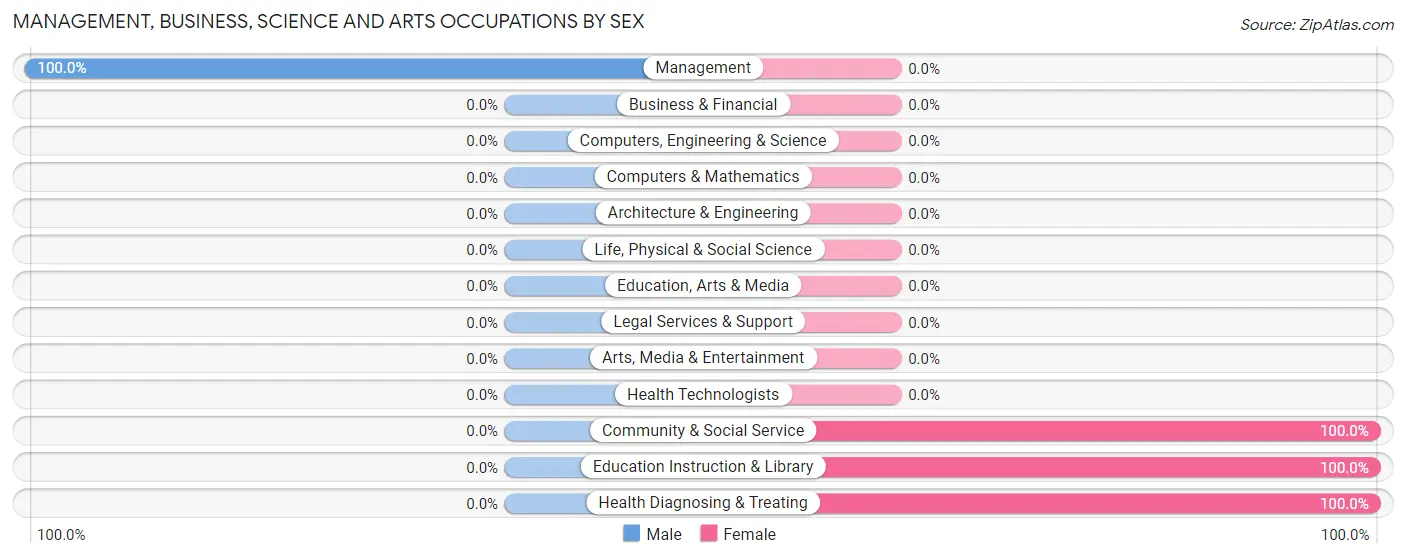
| Occupation | Male | Female |
| Management | 19 (100.0%) | 0 (0.0%) |
| Business & Financial | 0 (0.0%) | 0 (0.0%) |
| Computers, Engineering & Science | 0 (0.0%) | 0 (0.0%) |
| Computers & Mathematics | 0 (0.0%) | 0 (0.0%) |
| Architecture & Engineering | 0 (0.0%) | 0 (0.0%) |
| Life, Physical & Social Science | 0 (0.0%) | 0 (0.0%) |
| Community & Social Service | 0 (0.0%) | 25 (100.0%) |
| Education, Arts & Media | 0 (0.0%) | 0 (0.0%) |
| Legal Services & Support | 0 (0.0%) | 0 (0.0%) |
| Education Instruction & Library | 0 (0.0%) | 25 (100.0%) |
| Arts, Media & Entertainment | 0 (0.0%) | 0 (0.0%) |
| Health Diagnosing & Treating | 0 (0.0%) | 31 (100.0%) |
| Health Technologists | 0 (0.0%) | 0 (0.0%) |
| Total (Category) | 19 (25.3%) | 56 (74.7%) |
| Total (Overall) | 129 (54.7%) | 107 (45.3%) |
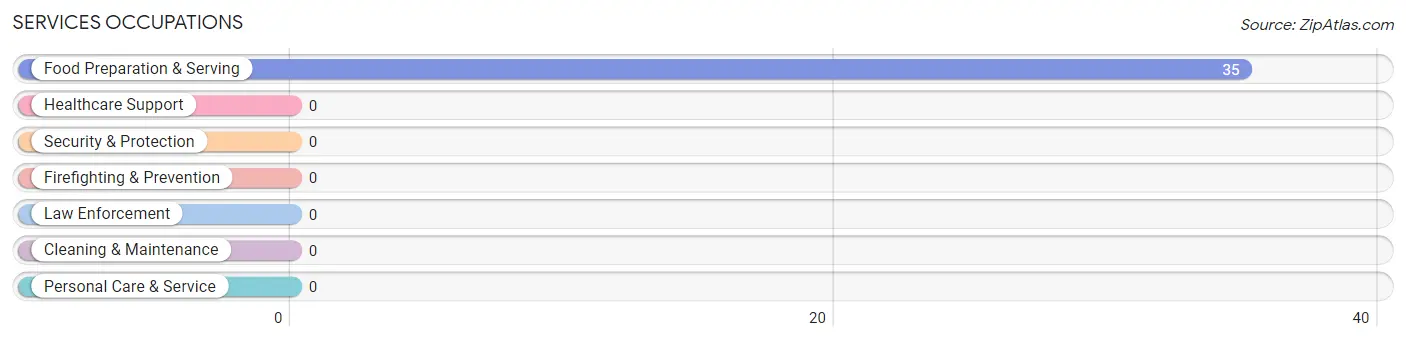
Services Occupations
The most common Services occupations in Ona are , and Food Preparation & Serving (35 | 14.8%).
Services Occupations by Sex
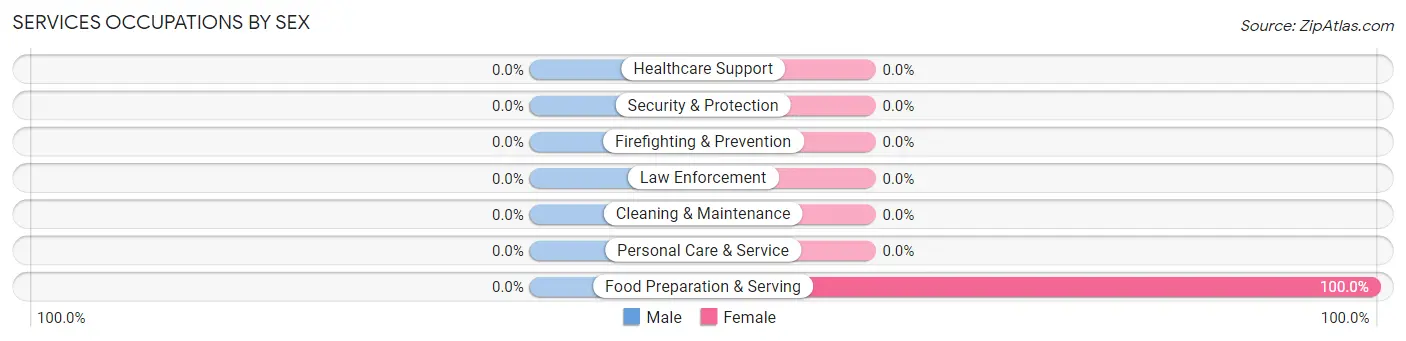
| Occupation | Male | Female |
| Healthcare Support | 0 (0.0%) | 0 (0.0%) |
| Security & Protection | 0 (0.0%) | 0 (0.0%) |
| Firefighting & Prevention | 0 (0.0%) | 0 (0.0%) |
| Law Enforcement | 0 (0.0%) | 0 (0.0%) |
| Food Preparation & Serving | 0 (0.0%) | 35 (100.0%) |
| Cleaning & Maintenance | 0 (0.0%) | 0 (0.0%) |
| Personal Care & Service | 0 (0.0%) | 0 (0.0%) |
| Total (Category) | 0 (0.0%) | 35 (100.0%) |
| Total (Overall) | 129 (54.7%) | 107 (45.3%) |
Sales and Office Occupations
The most common Sales and Office occupations in Ona are , and Sales & Related (56 | 23.7%).
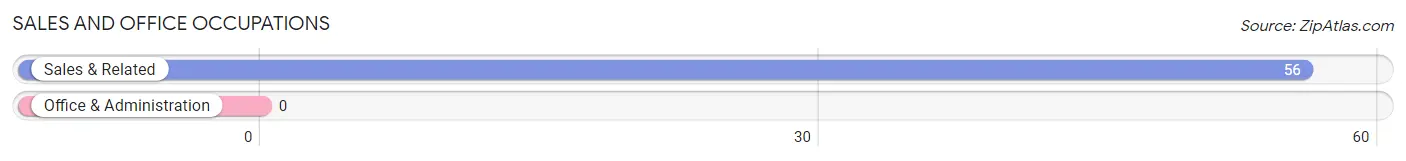
Sales and Office Occupations by Sex

| Occupation | Male | Female |
| Sales & Related | 56 (100.0%) | 0 (0.0%) |
| Office & Administration | 0 (0.0%) | 0 (0.0%) |
| Total (Category) | 56 (100.0%) | 0 (0.0%) |
| Total (Overall) | 129 (54.7%) | 107 (45.3%) |
Natural Resources, Construction and Maintenance Occupations
The most common Natural Resources, Construction and Maintenance occupations in Ona are , and Farming, Fishing & Forestry (32 | 13.6%).
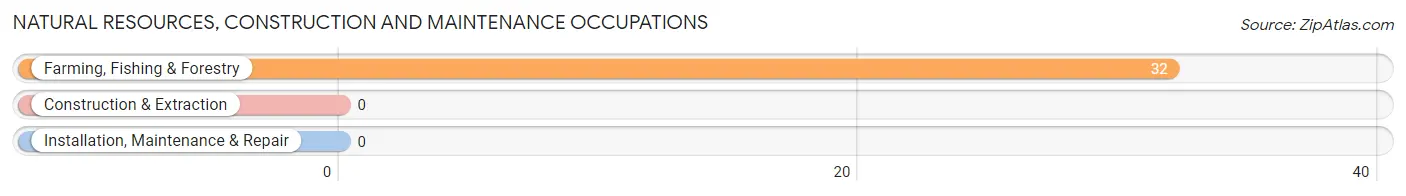
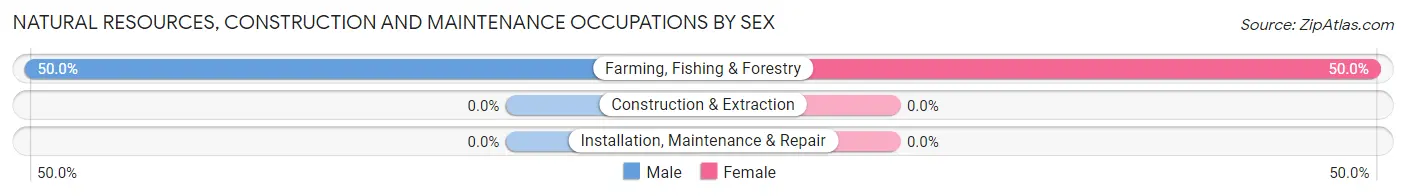
Natural Resources, Construction and Maintenance Occupations by Sex
| Occupation | Male | Female |
| Farming, Fishing & Forestry | 16 (50.0%) | 16 (50.0%) |
| Construction & Extraction | 0 (0.0%) | 0 (0.0%) |
| Installation, Maintenance & Repair | 0 (0.0%) | 0 (0.0%) |
| Total (Category) | 16 (50.0%) | 16 (50.0%) |
| Total (Overall) | 129 (54.7%) | 107 (45.3%) |
Production, Transportation and Moving Occupations
The most common Production, Transportation and Moving occupations in Ona are , and Production (38 | 16.1%).
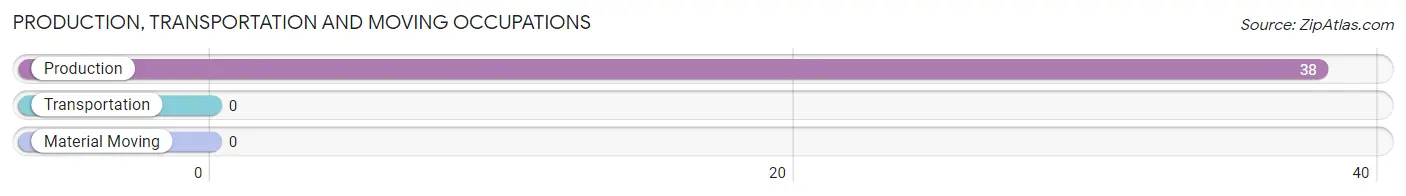
Production, Transportation and Moving Occupations by Sex
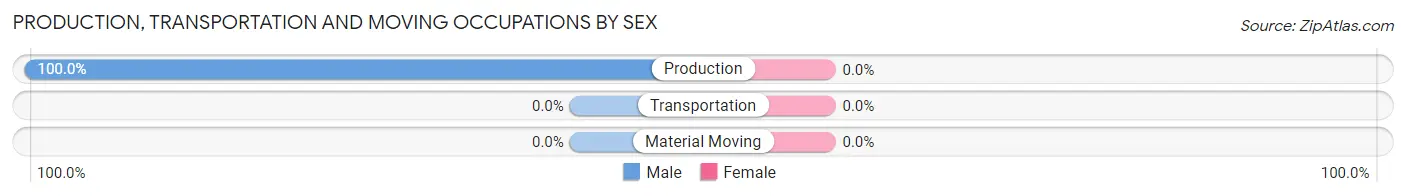
| Occupation | Male | Female |
| Production | 38 (100.0%) | 0 (0.0%) |
| Transportation | 0 (0.0%) | 0 (0.0%) |
| Material Moving | 0 (0.0%) | 0 (0.0%) |
| Total (Category) | 38 (100.0%) | 0 (0.0%) |
| Total (Overall) | 129 (54.7%) | 107 (45.3%) |
Employment Industries by Sex in Ona
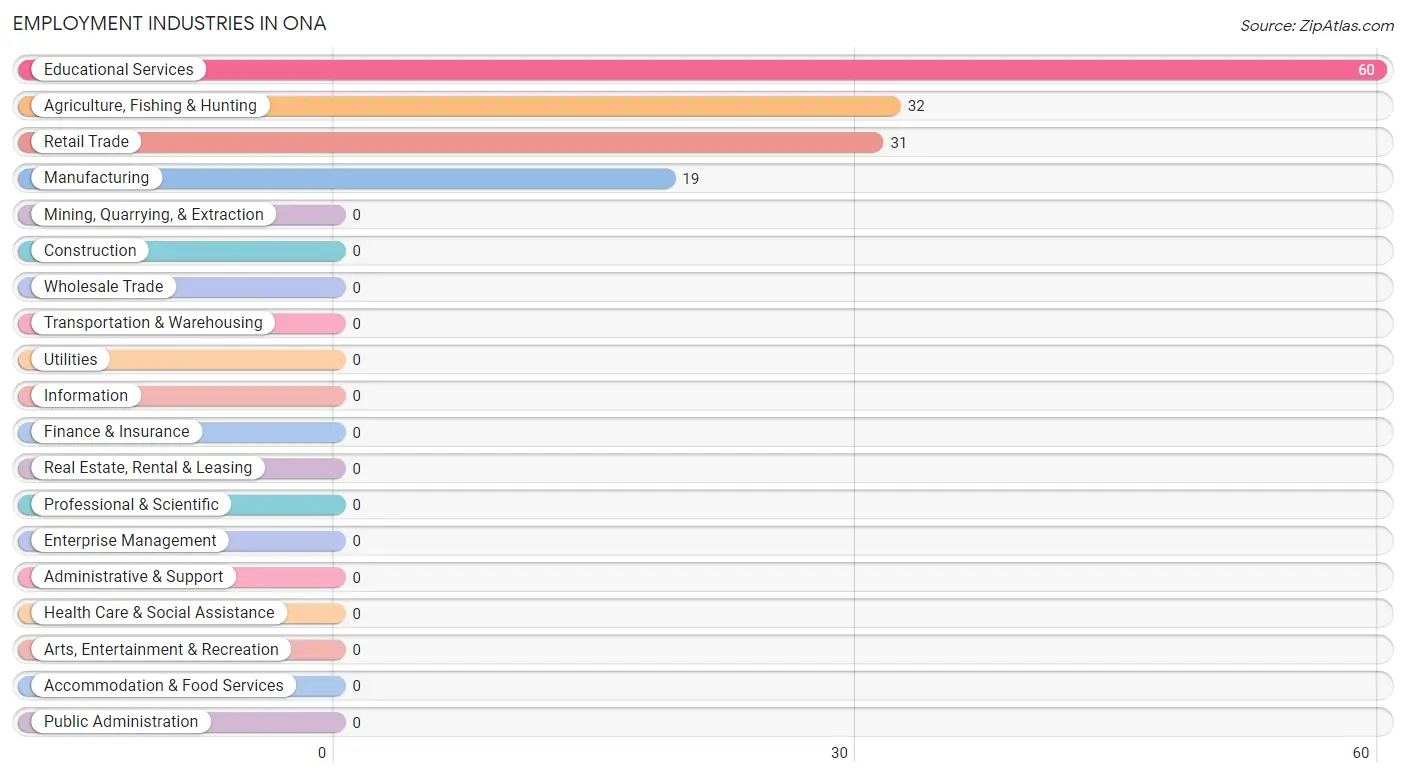
Employment Industries in Ona
The major employment industries in Ona include Educational Services (60 | 25.4%), Agriculture, Fishing & Hunting (32 | 13.6%), Retail Trade (31 | 13.1%), and Manufacturing (19 | 8.1%).
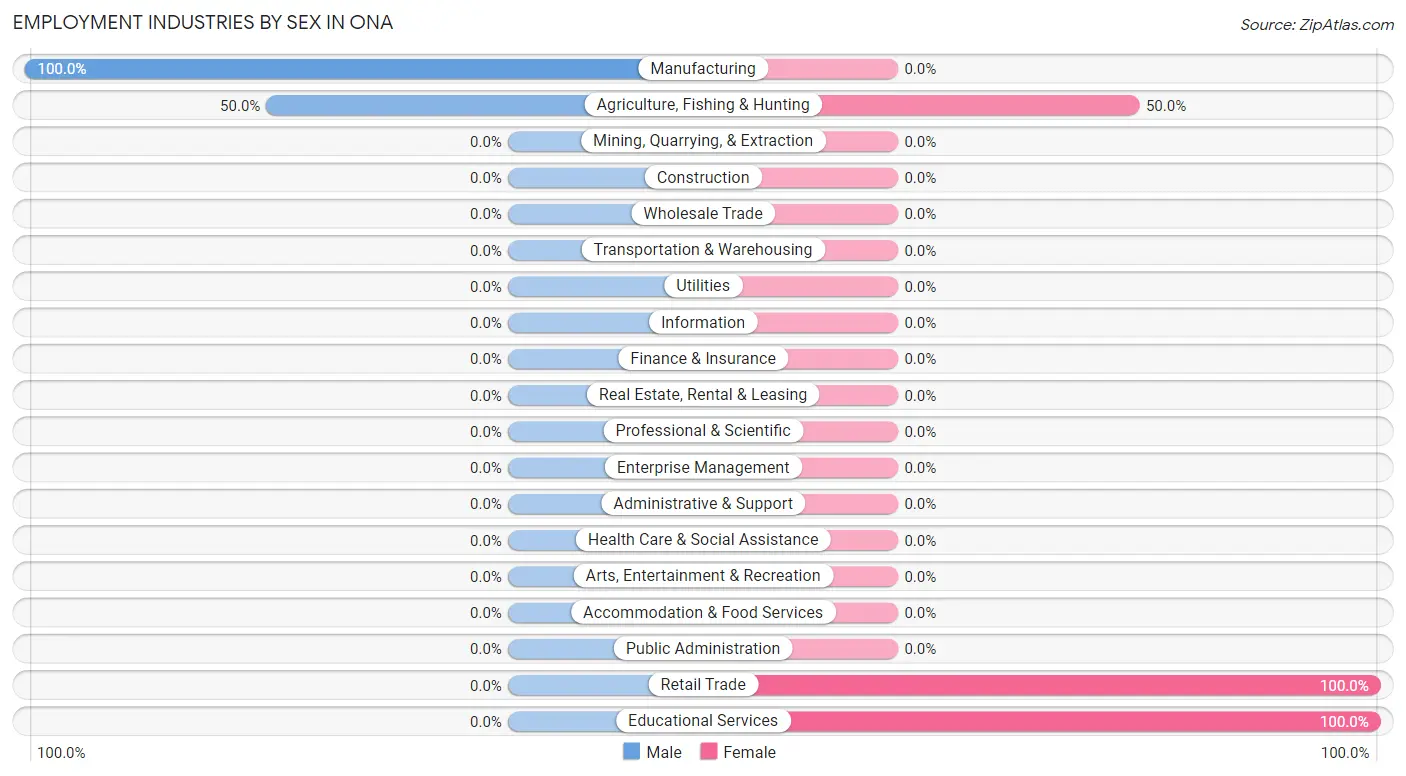
Employment Industries by Sex in Ona
The Ona industries that see more men than women are Manufacturing (100.0%), and Agriculture, Fishing & Hunting (50.0%), whereas the industries that tend to have a higher number of women are Retail Trade (100.0%), Educational Services (100.0%), and Agriculture, Fishing & Hunting (50.0%).
| Industry | Male | Female |
| Agriculture, Fishing & Hunting | 16 (50.0%) | 16 (50.0%) |
| Mining, Quarrying, & Extraction | 0 (0.0%) | 0 (0.0%) |
| Construction | 0 (0.0%) | 0 (0.0%) |
| Manufacturing | 19 (100.0%) | 0 (0.0%) |
| Wholesale Trade | 0 (0.0%) | 0 (0.0%) |
| Retail Trade | 0 (0.0%) | 31 (100.0%) |
| Transportation & Warehousing | 0 (0.0%) | 0 (0.0%) |
| Utilities | 0 (0.0%) | 0 (0.0%) |
| Information | 0 (0.0%) | 0 (0.0%) |
| Finance & Insurance | 0 (0.0%) | 0 (0.0%) |
| Real Estate, Rental & Leasing | 0 (0.0%) | 0 (0.0%) |
| Professional & Scientific | 0 (0.0%) | 0 (0.0%) |
| Enterprise Management | 0 (0.0%) | 0 (0.0%) |
| Administrative & Support | 0 (0.0%) | 0 (0.0%) |
| Educational Services | 0 (0.0%) | 60 (100.0%) |
| Health Care & Social Assistance | 0 (0.0%) | 0 (0.0%) |
| Arts, Entertainment & Recreation | 0 (0.0%) | 0 (0.0%) |
| Accommodation & Food Services | 0 (0.0%) | 0 (0.0%) |
| Public Administration | 0 (0.0%) | 0 (0.0%) |
| Total | 129 (54.7%) | 107 (45.3%) |
Education in Ona
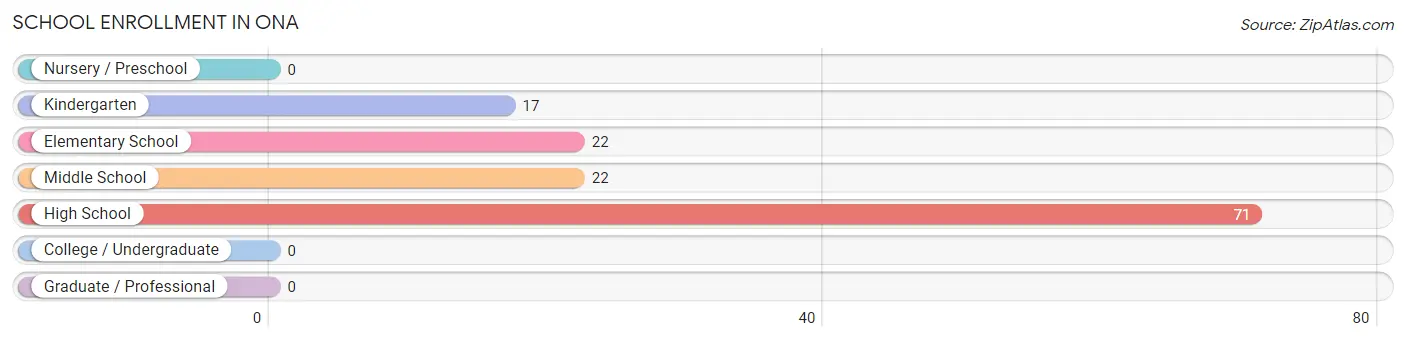
School Enrollment in Ona
The most common levels of schooling among the 132 students in Ona are high school (71 | 53.8%), elementary school (22 | 16.7%), and middle school (22 | 16.7%).
| School Level | # Students | % Students |
| Nursery / Preschool | 0 | 0.0% |
| Kindergarten | 17 | 12.9% |
| Elementary School | 22 | 16.7% |
| Middle School | 22 | 16.7% |
| High School | 71 | 53.8% |
| College / Undergraduate | 0 | 0.0% |
| Graduate / Professional | 0 | 0.0% |
| Total | 132 | 100.0% |
School Enrollment by Age by Funding Source in Ona
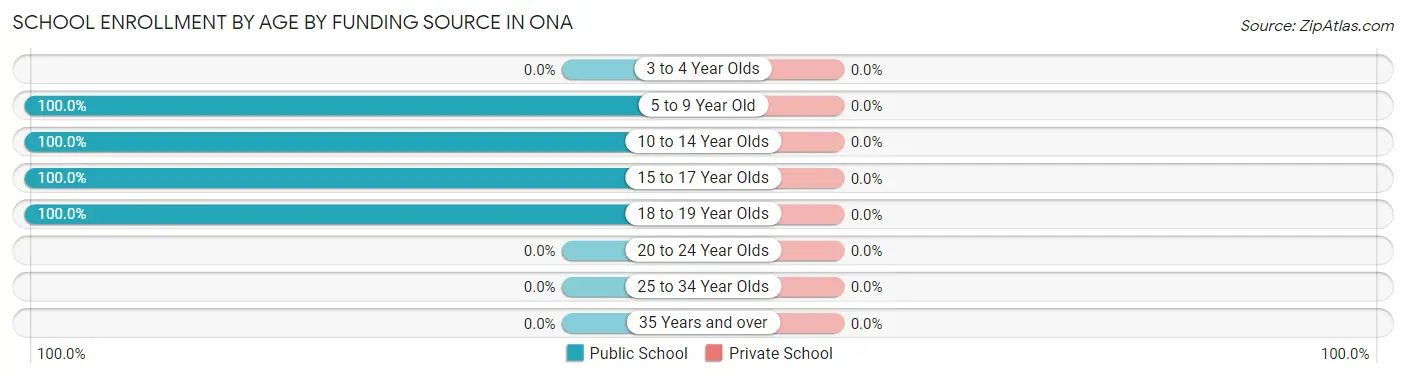
| Age Bracket | Public School | Private School |
| 3 to 4 Year Olds | 0 (0.0%) | 0 (0.0%) |
| 5 to 9 Year Old | 39 (100.0%) | 0 (0.0%) |
| 10 to 14 Year Olds | 22 (100.0%) | 0 (0.0%) |
| 15 to 17 Year Olds | 29 (100.0%) | 0 (0.0%) |
| 18 to 19 Year Olds | 42 (100.0%) | 0 (0.0%) |
| 20 to 24 Year Olds | 0 (0.0%) | 0 (0.0%) |
| 25 to 34 Year Olds | 0 (0.0%) | 0 (0.0%) |
| 35 Years and over | 0 (0.0%) | 0 (0.0%) |
| Total | 132 (100.0%) | 0 (0.0%) |
Educational Attainment by Field of Study in Ona
Education (25 | 56.8%), and bio, nature & agricultural (19 | 43.2%) are the most common fields of study among 44 individuals in Ona who have obtained a bachelor's degree or higher.
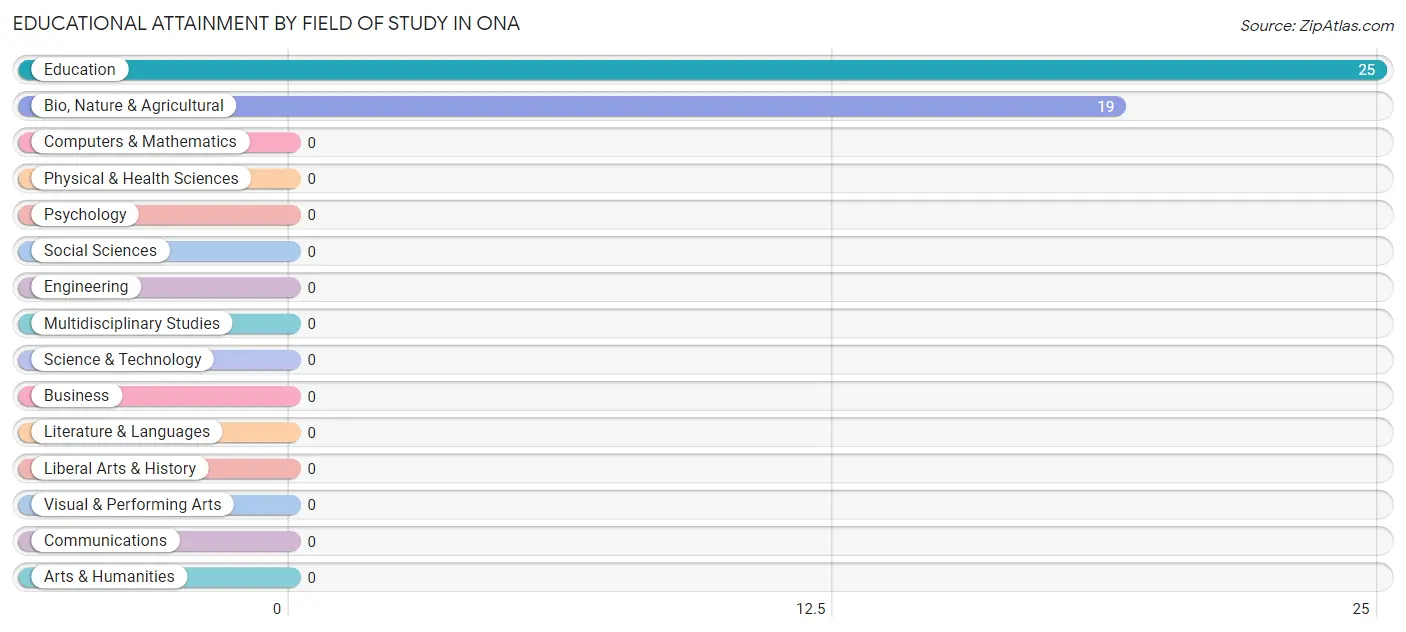
| Field of Study | # Graduates | % Graduates |
| Computers & Mathematics | 0 | 0.0% |
| Bio, Nature & Agricultural | 19 | 43.2% |
| Physical & Health Sciences | 0 | 0.0% |
| Psychology | 0 | 0.0% |
| Social Sciences | 0 | 0.0% |
| Engineering | 0 | 0.0% |
| Multidisciplinary Studies | 0 | 0.0% |
| Science & Technology | 0 | 0.0% |
| Business | 0 | 0.0% |
| Education | 25 | 56.8% |
| Literature & Languages | 0 | 0.0% |
| Liberal Arts & History | 0 | 0.0% |
| Visual & Performing Arts | 0 | 0.0% |
| Communications | 0 | 0.0% |
| Arts & Humanities | 0 | 0.0% |
| Total | 44 | 100.0% |
Transportation & Commute in Ona
Vehicle Availability by Sex in Ona
The most prevalent vehicle ownership categories in Ona are males with 4 vehicles (94, accounting for 72.9%) and females with 4 vehicles (66, making up 87.8%).
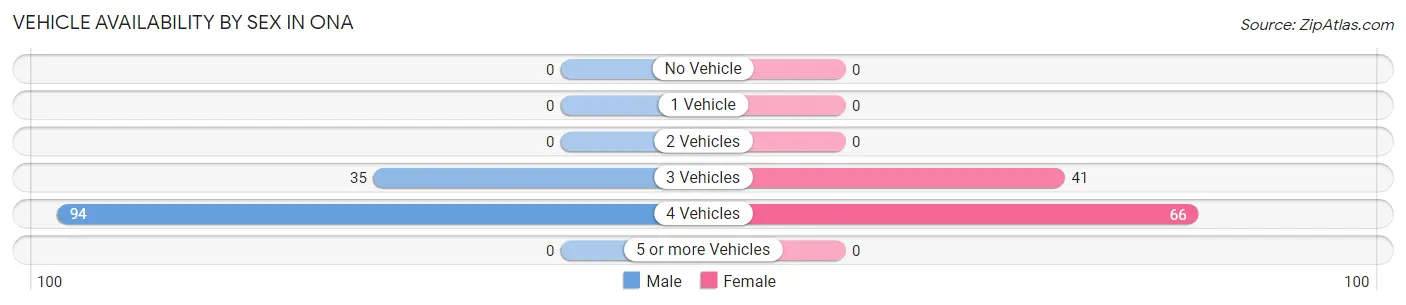
| Vehicles Available | Male | Female |
| No Vehicle | 0 (0.0%) | 0 (0.0%) |
| 1 Vehicle | 0 (0.0%) | 0 (0.0%) |
| 2 Vehicles | 0 (0.0%) | 0 (0.0%) |
| 3 Vehicles | 35 (27.1%) | 41 (38.3%) |
| 4 Vehicles | 94 (72.9%) | 66 (61.7%) |
| 5 or more Vehicles | 0 (0.0%) | 0 (0.0%) |
| Total | 129 (100.0%) | 107 (100.0%) |
Commute Time in Ona
The most frequently occuring commute durations in Ona are 15 to 19 minutes (91 commuters, 64.1%), 30 to 34 minutes (32 commuters, 22.5%), and 60 to 89 minutes (19 commuters, 13.4%).
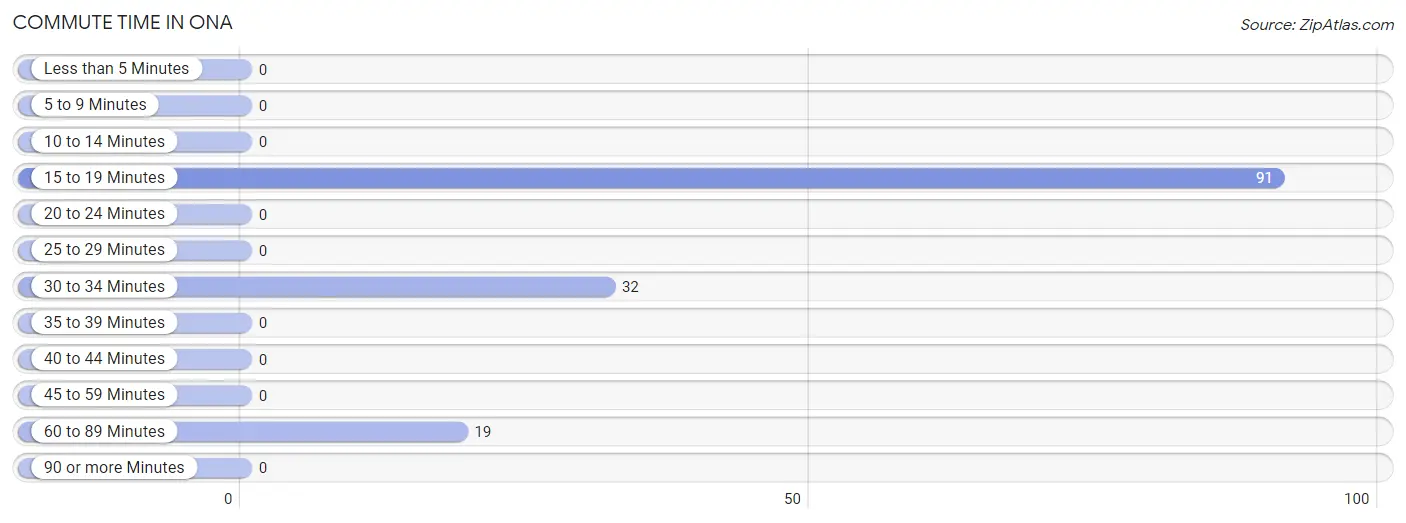
| Commute Time | # Commuters | % Commuters |
| Less than 5 Minutes | 0 | 0.0% |
| 5 to 9 Minutes | 0 | 0.0% |
| 10 to 14 Minutes | 0 | 0.0% |
| 15 to 19 Minutes | 91 | 64.1% |
| 20 to 24 Minutes | 0 | 0.0% |
| 25 to 29 Minutes | 0 | 0.0% |
| 30 to 34 Minutes | 32 | 22.5% |
| 35 to 39 Minutes | 0 | 0.0% |
| 40 to 44 Minutes | 0 | 0.0% |
| 45 to 59 Minutes | 0 | 0.0% |
| 60 to 89 Minutes | 19 | 13.4% |
| 90 or more Minutes | 0 | 0.0% |
Commute Time by Sex in Ona
The most common commute times in Ona are 60 to 89 minutes (19 commuters, 54.3%) for males and 15 to 19 minutes (91 commuters, 85.1%) for females.
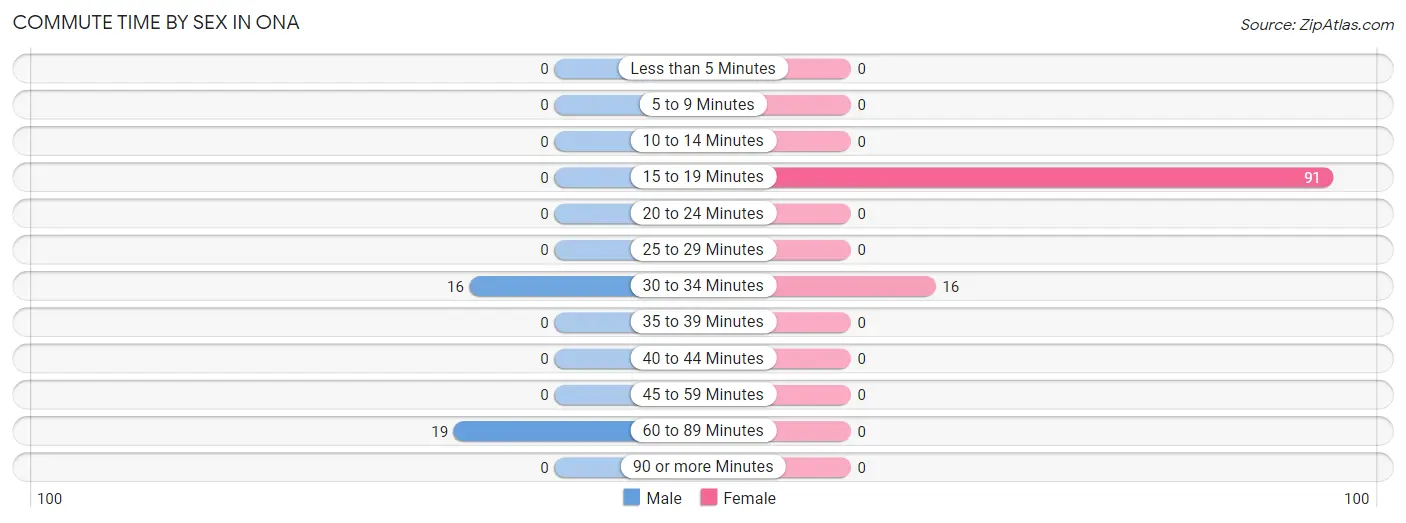
| Commute Time | Male | Female |
| Less than 5 Minutes | 0 (0.0%) | 0 (0.0%) |
| 5 to 9 Minutes | 0 (0.0%) | 0 (0.0%) |
| 10 to 14 Minutes | 0 (0.0%) | 0 (0.0%) |
| 15 to 19 Minutes | 0 (0.0%) | 91 (85.1%) |
| 20 to 24 Minutes | 0 (0.0%) | 0 (0.0%) |
| 25 to 29 Minutes | 0 (0.0%) | 0 (0.0%) |
| 30 to 34 Minutes | 16 (45.7%) | 16 (14.9%) |
| 35 to 39 Minutes | 0 (0.0%) | 0 (0.0%) |
| 40 to 44 Minutes | 0 (0.0%) | 0 (0.0%) |
| 45 to 59 Minutes | 0 (0.0%) | 0 (0.0%) |
| 60 to 89 Minutes | 19 (54.3%) | 0 (0.0%) |
| 90 or more Minutes | 0 (0.0%) | 0 (0.0%) |
Time of Departure to Work by Sex in Ona
The most frequent times of departure to work in Ona are 6:00 AM to 6:29 AM (19, 54.3%) for males and 5:30 AM to 5:59 AM (35, 32.7%) for females.
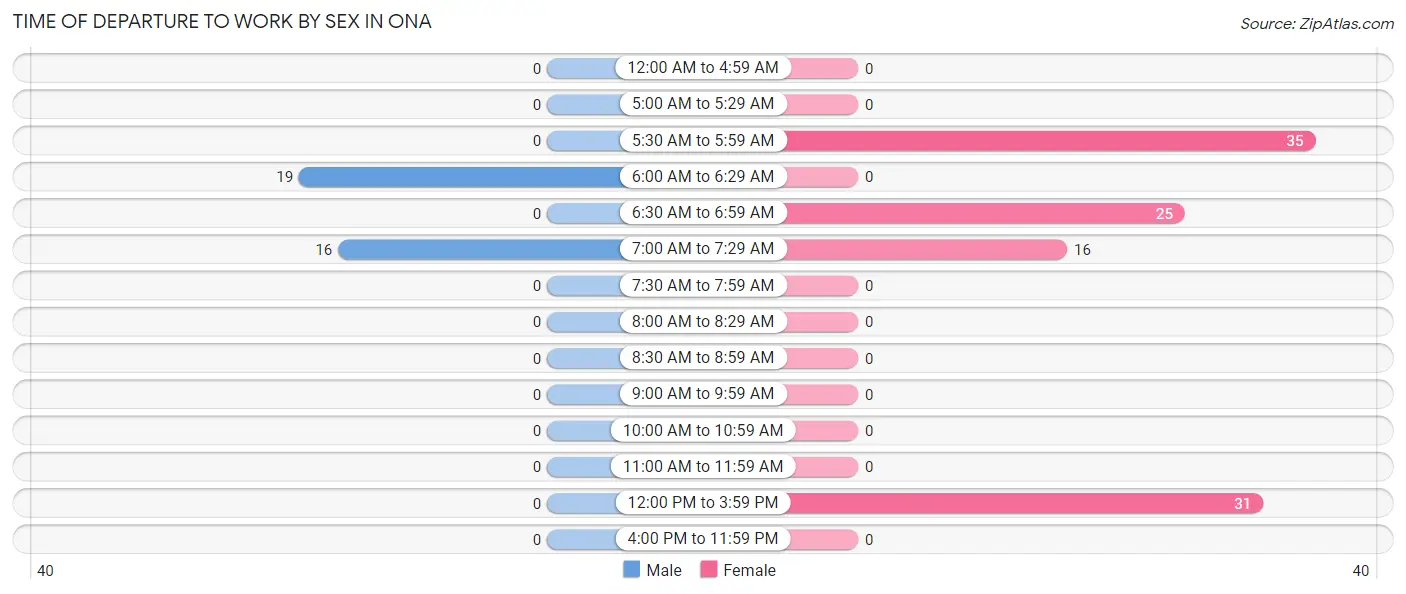
| Time of Departure | Male | Female |
| 12:00 AM to 4:59 AM | 0 (0.0%) | 0 (0.0%) |
| 5:00 AM to 5:29 AM | 0 (0.0%) | 0 (0.0%) |
| 5:30 AM to 5:59 AM | 0 (0.0%) | 35 (32.7%) |
| 6:00 AM to 6:29 AM | 19 (54.3%) | 0 (0.0%) |
| 6:30 AM to 6:59 AM | 0 (0.0%) | 25 (23.4%) |
| 7:00 AM to 7:29 AM | 16 (45.7%) | 16 (14.9%) |
| 7:30 AM to 7:59 AM | 0 (0.0%) | 0 (0.0%) |
| 8:00 AM to 8:29 AM | 0 (0.0%) | 0 (0.0%) |
| 8:30 AM to 8:59 AM | 0 (0.0%) | 0 (0.0%) |
| 9:00 AM to 9:59 AM | 0 (0.0%) | 0 (0.0%) |
| 10:00 AM to 10:59 AM | 0 (0.0%) | 0 (0.0%) |
| 11:00 AM to 11:59 AM | 0 (0.0%) | 0 (0.0%) |
| 12:00 PM to 3:59 PM | 0 (0.0%) | 31 (29.0%) |
| 4:00 PM to 11:59 PM | 0 (0.0%) | 0 (0.0%) |
| Total | 35 (100.0%) | 107 (100.0%) |
Housing Occupancy in Ona
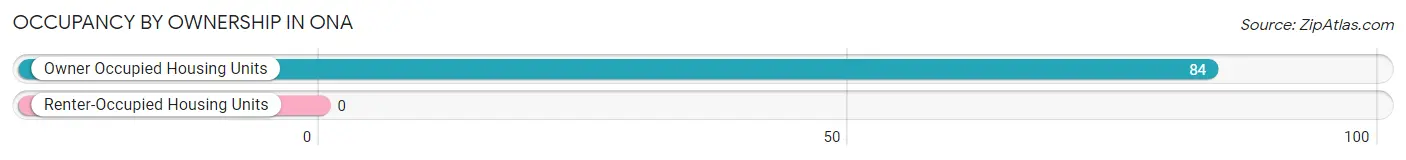
Occupancy by Ownership in Ona
Of the total 84 dwellings in Ona, owner-occupied units account for 84 (100.0%), while renter-occupied units make up 0 (0.0%).
| Occupancy | # Housing Units | % Housing Units |
| Owner Occupied Housing Units | 84 | 100.0% |
| Renter-Occupied Housing Units | 0 | 0.0% |
| Total Occupied Housing Units | 84 | 100.0% |
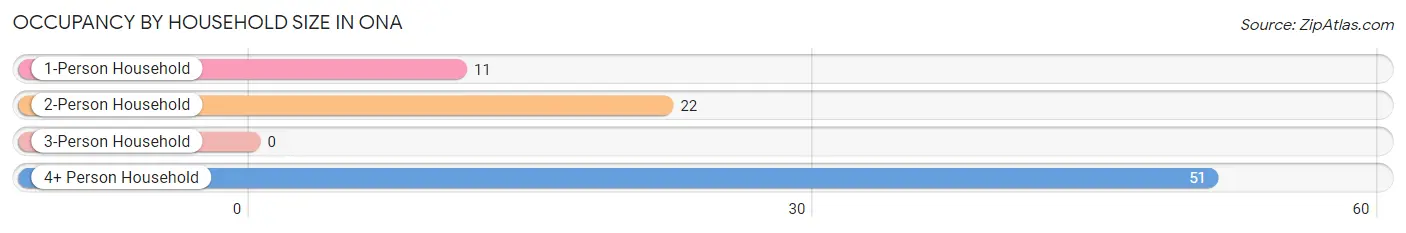
Occupancy by Household Size in Ona
| Household Size | # Housing Units | % Housing Units |
| 1-Person Household | 11 | 13.1% |
| 2-Person Household | 22 | 26.2% |
| 3-Person Household | 0 | 0.0% |
| 4+ Person Household | 51 | 60.7% |
| Total Housing Units | 84 | 100.0% |
Occupancy by Ownership by Household Size in Ona
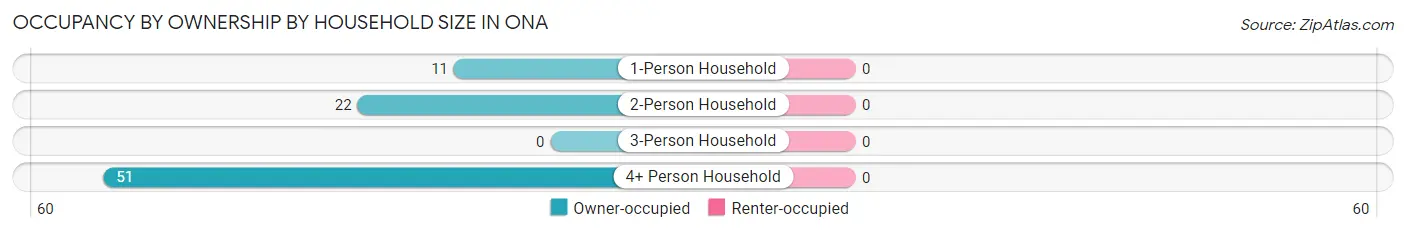
| Household Size | Owner-occupied | Renter-occupied |
| 1-Person Household | 11 (100.0%) | 0 (0.0%) |
| 2-Person Household | 22 (100.0%) | 0 (0.0%) |
| 3-Person Household | 0 (0.0%) | 0 (0.0%) |
| 4+ Person Household | 51 (100.0%) | 0 (0.0%) |
| Total Housing Units | 84 (100.0%) | 0 (0.0%) |
Occupancy by Educational Attainment in Ona
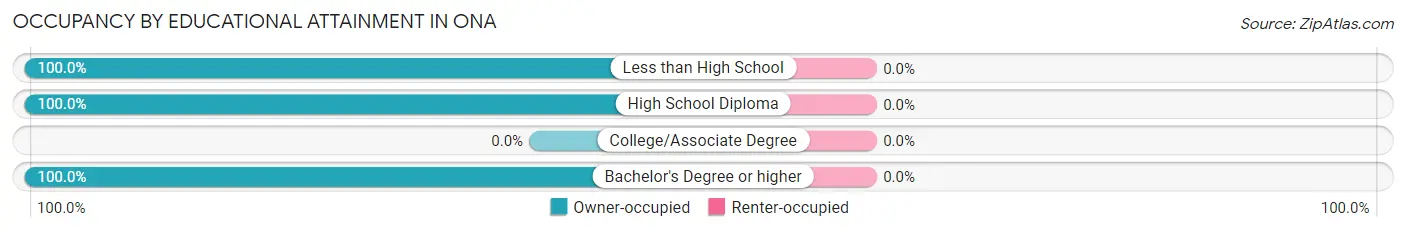
| Household Size | Owner-occupied | Renter-occupied |
| Less than High School | 16 (100.0%) | 0 (0.0%) |
| High School Diploma | 49 (100.0%) | 0 (0.0%) |
| College/Associate Degree | 0 (0.0%) | 0 (0.0%) |
| Bachelor's Degree or higher | 19 (100.0%) | 0 (0.0%) |
Occupancy by Age of Householder in Ona
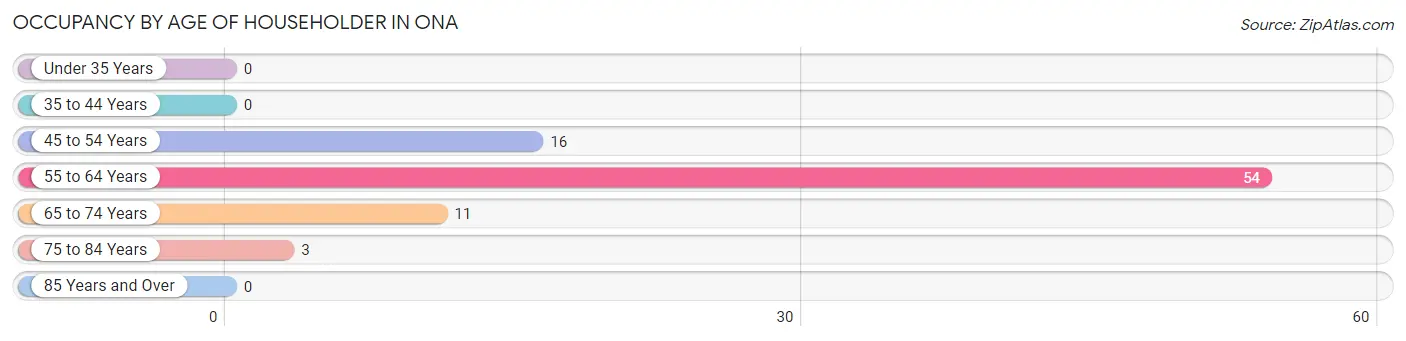
| Age Bracket | # Households | % Households |
| Under 35 Years | 0 | 0.0% |
| 35 to 44 Years | 0 | 0.0% |
| 45 to 54 Years | 16 | 19.1% |
| 55 to 64 Years | 54 | 64.3% |
| 65 to 74 Years | 11 | 13.1% |
| 75 to 84 Years | 3 | 3.6% |
| 85 Years and Over | 0 | 0.0% |
| Total | 84 | 100.0% |
Housing Finances in Ona
Median Income by Occupancy in Ona
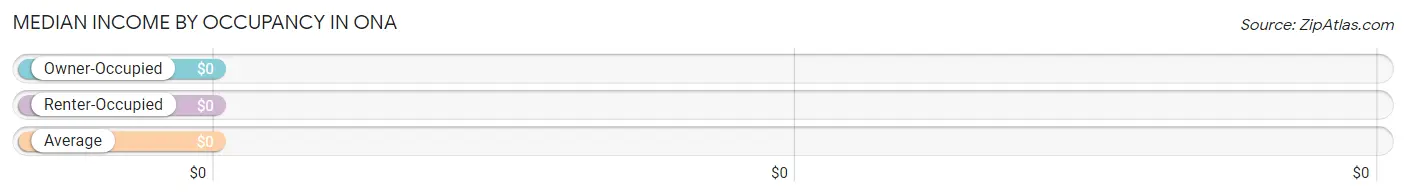
| Occupancy Type | # Households | Median Income |
| Owner-Occupied | 84 (100.0%) | $0 |
| Renter-Occupied | 0 (0.0%) | $0 |
| Average | 84 (100.0%) | $0 |
Occupancy by Householder Income Bracket in Ona
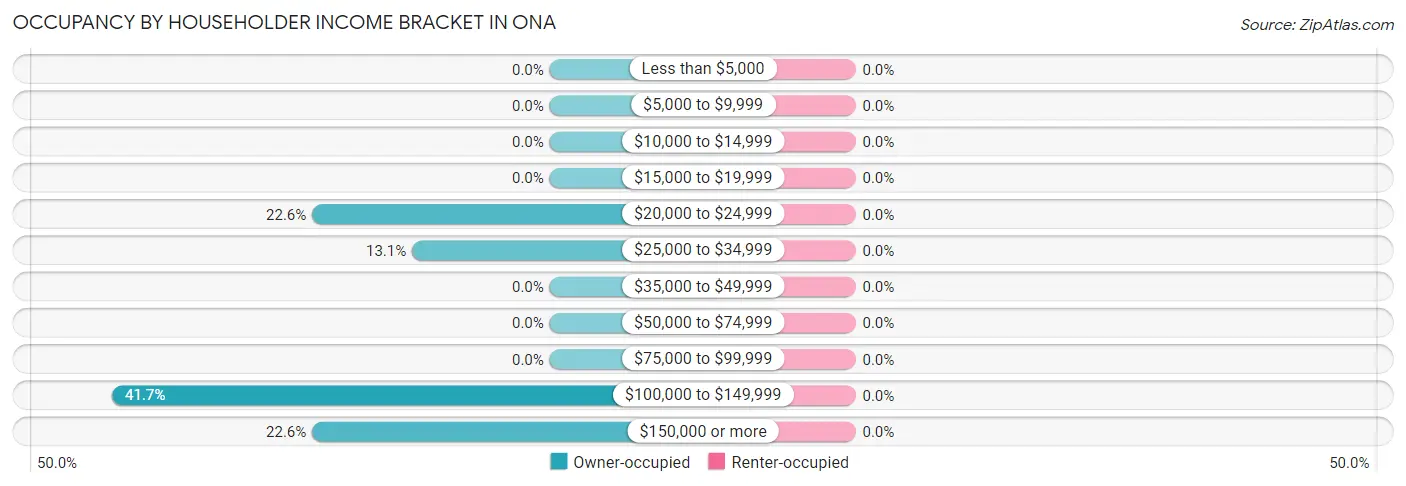
| Income Bracket | Owner-occupied | Renter-occupied |
| Less than $5,000 | 0 (0.0%) | 0 (0.0%) |
| $5,000 to $9,999 | 0 (0.0%) | 0 (0.0%) |
| $10,000 to $14,999 | 0 (0.0%) | 0 (0.0%) |
| $15,000 to $19,999 | 0 (0.0%) | 0 (0.0%) |
| $20,000 to $24,999 | 19 (22.6%) | 0 (0.0%) |
| $25,000 to $34,999 | 11 (13.1%) | 0 (0.0%) |
| $35,000 to $49,999 | 0 (0.0%) | 0 (0.0%) |
| $50,000 to $74,999 | 0 (0.0%) | 0 (0.0%) |
| $75,000 to $99,999 | 0 (0.0%) | 0 (0.0%) |
| $100,000 to $149,999 | 35 (41.7%) | 0 (0.0%) |
| $150,000 or more | 19 (22.6%) | 0 (0.0%) |
| Total | 84 (100.0%) | 0 (0.0%) |
Monthly Housing Cost Tiers in Ona
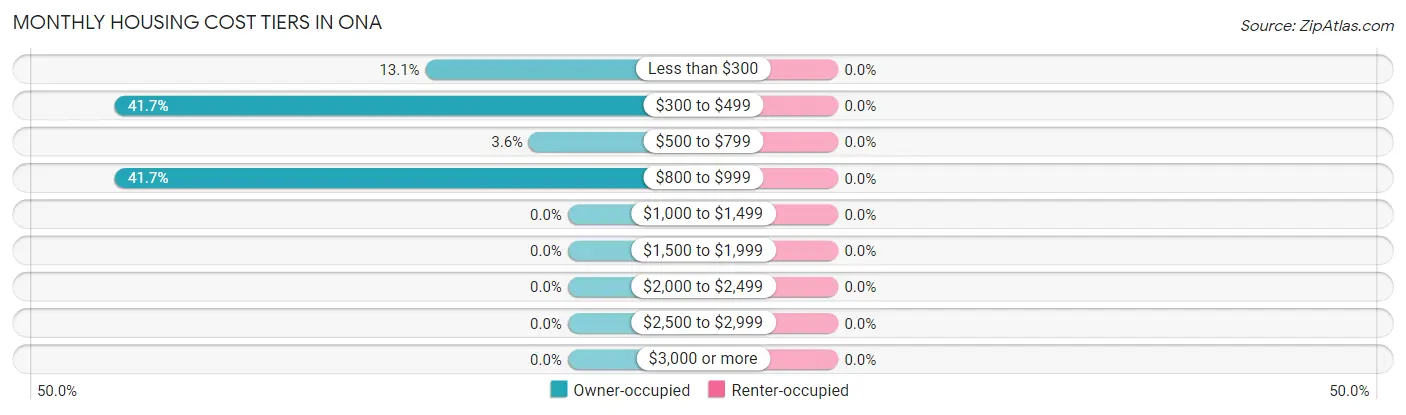
| Monthly Cost | Owner-occupied | Renter-occupied |
| Less than $300 | 11 (13.1%) | 0 (0.0%) |
| $300 to $499 | 35 (41.7%) | 0 (0.0%) |
| $500 to $799 | 3 (3.6%) | 0 (0.0%) |
| $800 to $999 | 35 (41.7%) | 0 (0.0%) |
| $1,000 to $1,499 | 0 (0.0%) | 0 (0.0%) |
| $1,500 to $1,999 | 0 (0.0%) | 0 (0.0%) |
| $2,000 to $2,499 | 0 (0.0%) | 0 (0.0%) |
| $2,500 to $2,999 | 0 (0.0%) | 0 (0.0%) |
| $3,000 or more | 0 (0.0%) | 0 (0.0%) |
| Total | 84 (100.0%) | 0 (0.0%) |
Physical Housing Characteristics in Ona
Housing Structures in Ona
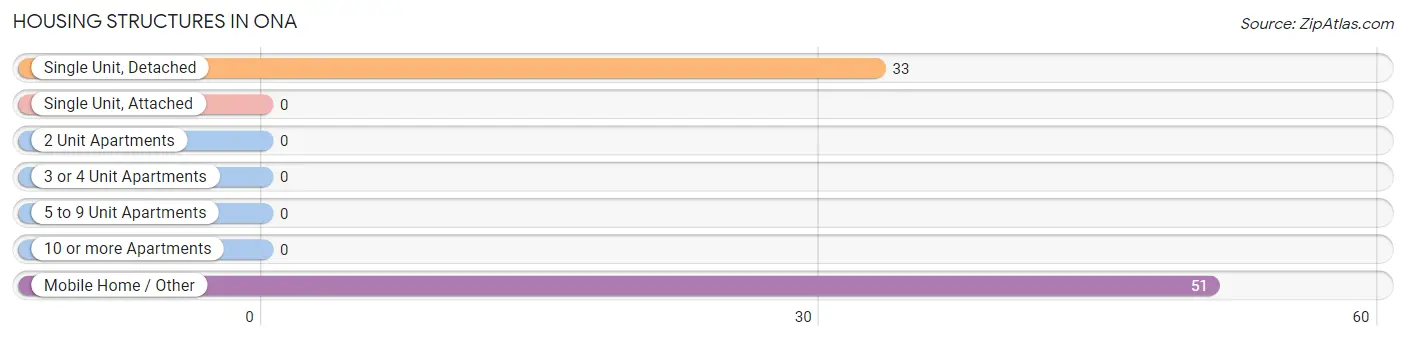
| Structure Type | # Housing Units | % Housing Units |
| Single Unit, Detached | 33 | 39.3% |
| Single Unit, Attached | 0 | 0.0% |
| 2 Unit Apartments | 0 | 0.0% |
| 3 or 4 Unit Apartments | 0 | 0.0% |
| 5 to 9 Unit Apartments | 0 | 0.0% |
| 10 or more Apartments | 0 | 0.0% |
| Mobile Home / Other | 51 | 60.7% |
| Total | 84 | 100.0% |
Housing Structures by Occupancy in Ona
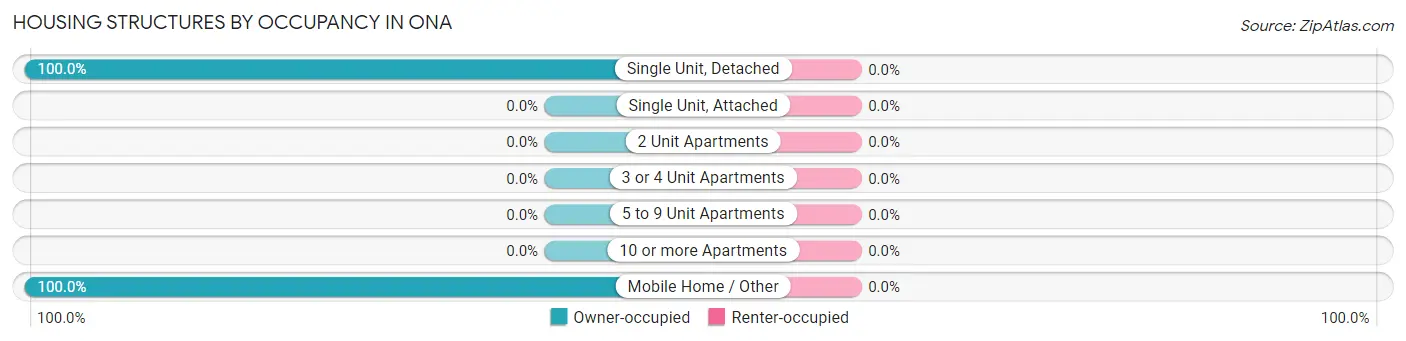
| Structure Type | Owner-occupied | Renter-occupied |
| Single Unit, Detached | 33 (100.0%) | 0 (0.0%) |
| Single Unit, Attached | 0 (0.0%) | 0 (0.0%) |
| 2 Unit Apartments | 0 (0.0%) | 0 (0.0%) |
| 3 or 4 Unit Apartments | 0 (0.0%) | 0 (0.0%) |
| 5 to 9 Unit Apartments | 0 (0.0%) | 0 (0.0%) |
| 10 or more Apartments | 0 (0.0%) | 0 (0.0%) |
| Mobile Home / Other | 51 (100.0%) | 0 (0.0%) |
| Total | 84 (100.0%) | 0 (0.0%) |
Housing Structures by Number of Rooms in Ona
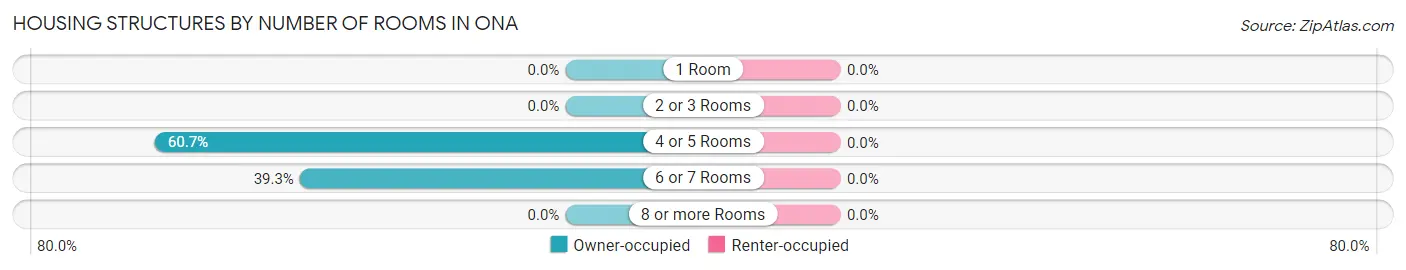
| Number of Rooms | Owner-occupied | Renter-occupied |
| 1 Room | 0 (0.0%) | 0 (0.0%) |
| 2 or 3 Rooms | 0 (0.0%) | 0 (0.0%) |
| 4 or 5 Rooms | 51 (60.7%) | 0 (0.0%) |
| 6 or 7 Rooms | 33 (39.3%) | 0 (0.0%) |
| 8 or more Rooms | 0 (0.0%) | 0 (0.0%) |
| Total | 84 (100.0%) | 0 (0.0%) |
Housing Structure by Heating Type in Ona
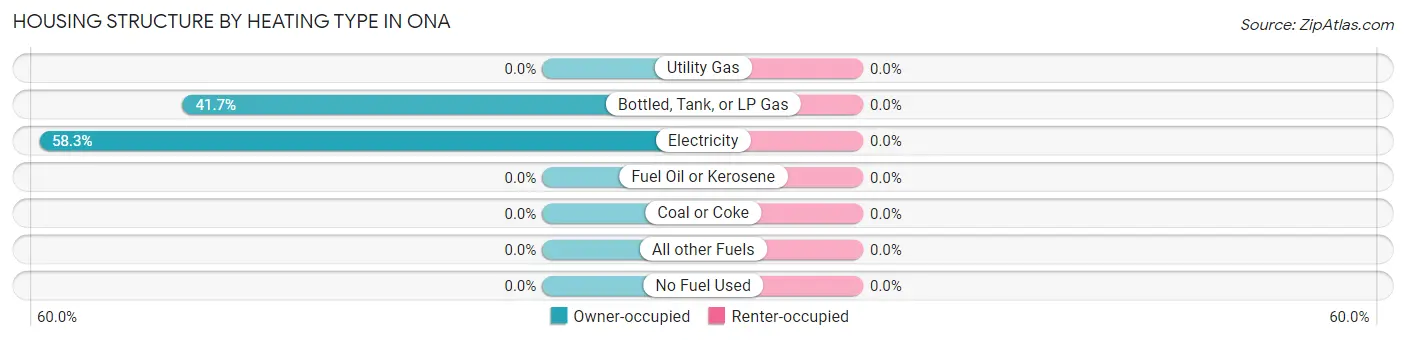
| Heating Type | Owner-occupied | Renter-occupied |
| Utility Gas | 0 (0.0%) | 0 (0.0%) |
| Bottled, Tank, or LP Gas | 35 (41.7%) | 0 (0.0%) |
| Electricity | 49 (58.3%) | 0 (0.0%) |
| Fuel Oil or Kerosene | 0 (0.0%) | 0 (0.0%) |
| Coal or Coke | 0 (0.0%) | 0 (0.0%) |
| All other Fuels | 0 (0.0%) | 0 (0.0%) |
| No Fuel Used | 0 (0.0%) | 0 (0.0%) |
| Total | 84 (100.0%) | 0 (0.0%) |
Household Vehicle Usage in Ona
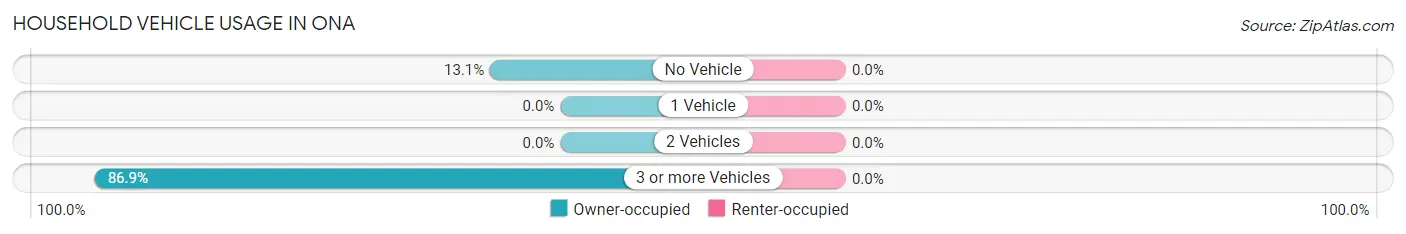
| Vehicles per Household | Owner-occupied | Renter-occupied |
| No Vehicle | 11 (13.1%) | 0 (0.0%) |
| 1 Vehicle | 0 (0.0%) | 0 (0.0%) |
| 2 Vehicles | 0 (0.0%) | 0 (0.0%) |
| 3 or more Vehicles | 73 (86.9%) | 0 (0.0%) |
| Total | 84 (100.0%) | 0 (0.0%) |
Real Estate & Mortgages in Ona
Real Estate and Mortgage Overview in Ona
| Characteristic | Without Mortgage | With Mortgage |
| Housing Units | 84 | 0 |
| Median Property Value | - | - |
| Median Household Income | - | - |
| Monthly Housing Costs | - | - |
| Real Estate Taxes | - | - |
Property Value by Mortgage Status in Ona
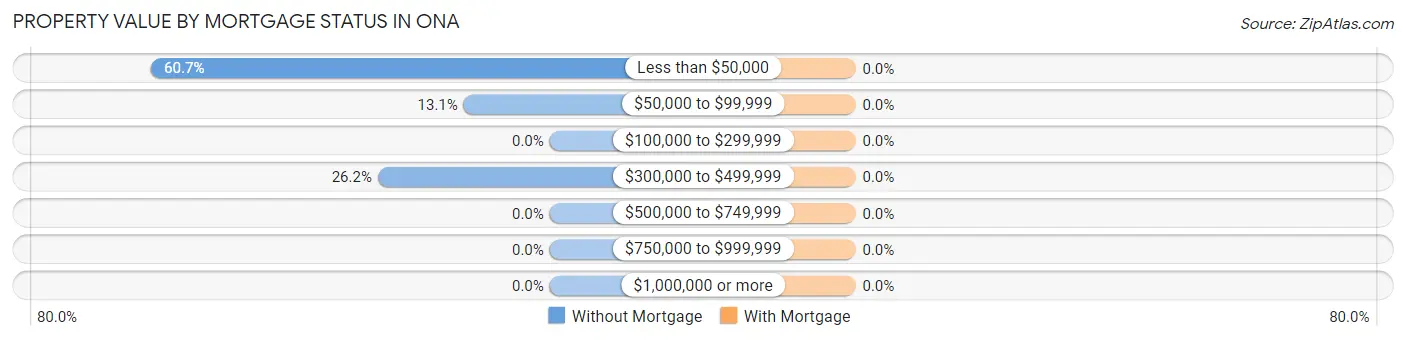
| Property Value | Without Mortgage | With Mortgage |
| Less than $50,000 | 51 (60.7%) | 0 (0.0%) |
| $50,000 to $99,999 | 11 (13.1%) | 0 (0.0%) |
| $100,000 to $299,999 | 0 (0.0%) | 0 (0.0%) |
| $300,000 to $499,999 | 22 (26.2%) | 0 (0.0%) |
| $500,000 to $749,999 | 0 (0.0%) | 0 (0.0%) |
| $750,000 to $999,999 | 0 (0.0%) | 0 (0.0%) |
| $1,000,000 or more | 0 (0.0%) | 0 (0.0%) |
| Total | 84 (100.0%) | 0 (0.0%) |
Household Income by Mortgage Status in Ona
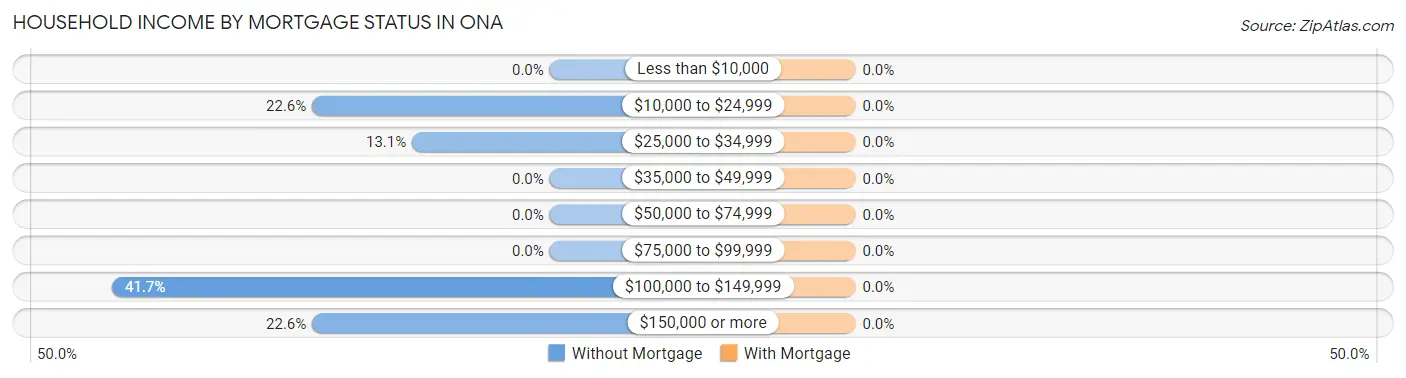
| Household Income | Without Mortgage | With Mortgage |
| Less than $10,000 | 0 (0.0%) | 0 (0.0%) |
| $10,000 to $24,999 | 19 (22.6%) | 0 (0.0%) |
| $25,000 to $34,999 | 11 (13.1%) | 0 (0.0%) |
| $35,000 to $49,999 | 0 (0.0%) | 0 (0.0%) |
| $50,000 to $74,999 | 0 (0.0%) | 0 (0.0%) |
| $75,000 to $99,999 | 0 (0.0%) | 0 (0.0%) |
| $100,000 to $149,999 | 35 (41.7%) | 0 (0.0%) |
| $150,000 or more | 19 (22.6%) | 0 (0.0%) |
| Total | 84 (100.0%) | 0 (0.0%) |
Property Value to Household Income Ratio in Ona
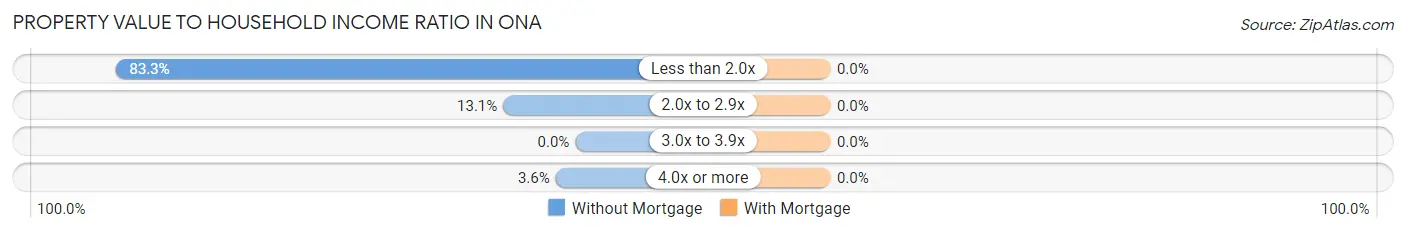
| Value-to-Income Ratio | Without Mortgage | With Mortgage |
| Less than 2.0x | 70 (83.3%) | 0 (0.0%) |
| 2.0x to 2.9x | 11 (13.1%) | 0 (0.0%) |
| 3.0x to 3.9x | 0 (0.0%) | 0 (0.0%) |
| 4.0x or more | 3 (3.6%) | 0 (0.0%) |
| Total | 84 (100.0%) | 0 (0.0%) |
Real Estate Taxes by Mortgage Status in Ona
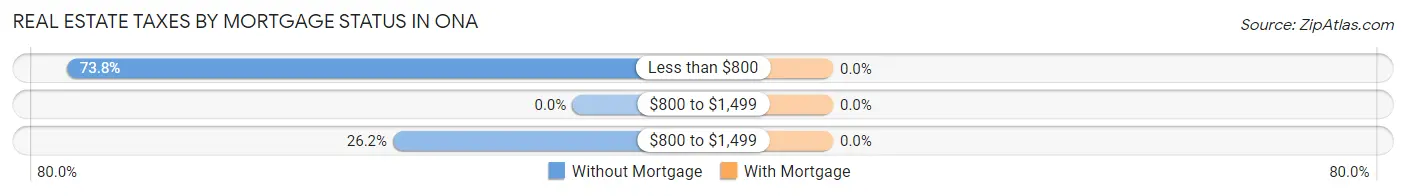
| Property Taxes | Without Mortgage | With Mortgage |
| Less than $800 | 62 (73.8%) | 0 (0.0%) |
| $800 to $1,499 | 0 (0.0%) | 0 (0.0%) |
| $800 to $1,499 | 22 (26.2%) | 0 (0.0%) |
| Total | 84 (100.0%) | 0 (0.0%) |
Health & Disability in Ona
Health Insurance Coverage by Age in Ona
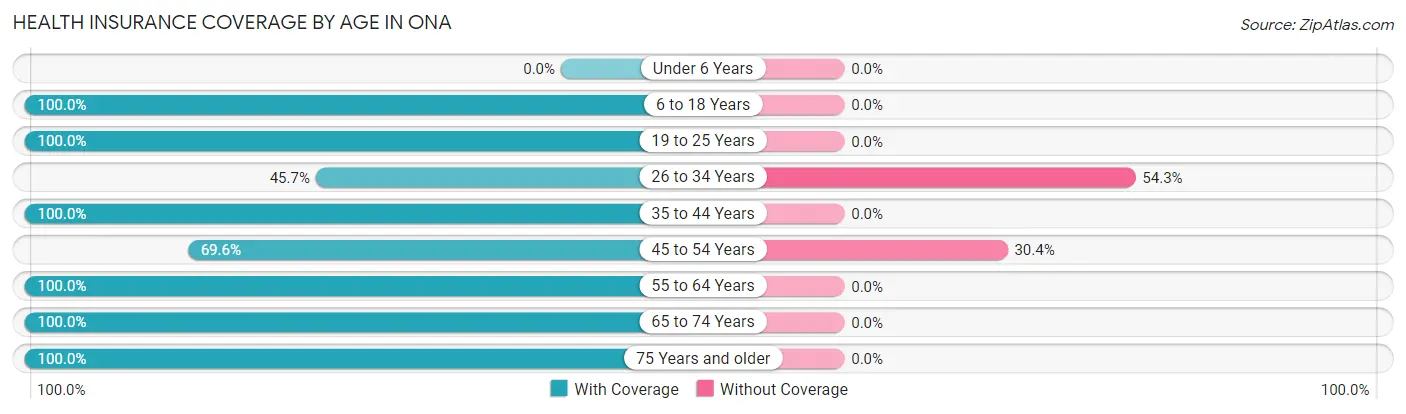
| Age Bracket | With Coverage | Without Coverage |
| Under 6 Years | 0 (0.0%) | 0 (0.0%) |
| 6 to 18 Years | 132 (100.0%) | 0 (0.0%) |
| 19 to 25 Years | 42 (100.0%) | 0 (0.0%) |
| 26 to 34 Years | 32 (45.7%) | 38 (54.3%) |
| 35 to 44 Years | 72 (100.0%) | 0 (0.0%) |
| 45 to 54 Years | 16 (69.6%) | 7 (30.4%) |
| 55 to 64 Years | 79 (100.0%) | 0 (0.0%) |
| 65 to 74 Years | 11 (100.0%) | 0 (0.0%) |
| 75 Years and older | 6 (100.0%) | 0 (0.0%) |
| Total | 390 (89.7%) | 45 (10.3%) |
Health Insurance Coverage by Citizenship Status in Ona
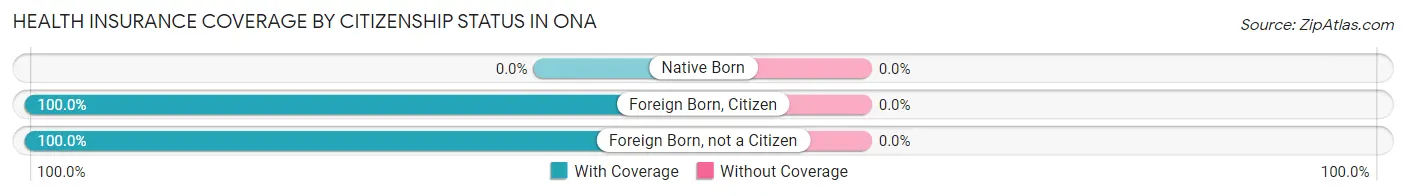
| Citizenship Status | With Coverage | Without Coverage |
| Native Born | 0 (0.0%) | 0 (0.0%) |
| Foreign Born, Citizen | 132 (100.0%) | 0 (0.0%) |
| Foreign Born, not a Citizen | 42 (100.0%) | 0 (0.0%) |
Health Insurance Coverage by Household Income in Ona
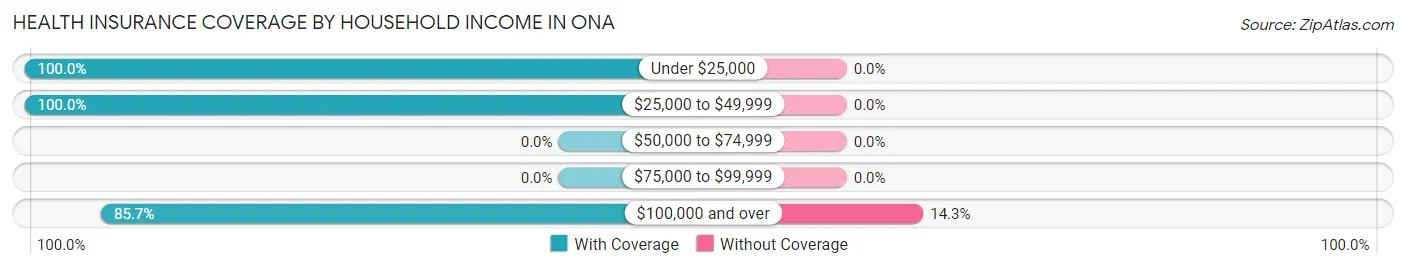
| Household Income | With Coverage | Without Coverage |
| Under $25,000 | 152 (100.0%) | 0 (0.0%) |
| $25,000 to $49,999 | 11 (100.0%) | 0 (0.0%) |
| $50,000 to $74,999 | 0 (0.0%) | 0 (0.0%) |
| $75,000 to $99,999 | 0 (0.0%) | 0 (0.0%) |
| $100,000 and over | 227 (85.7%) | 38 (14.3%) |
Public vs Private Health Insurance Coverage by Age in Ona
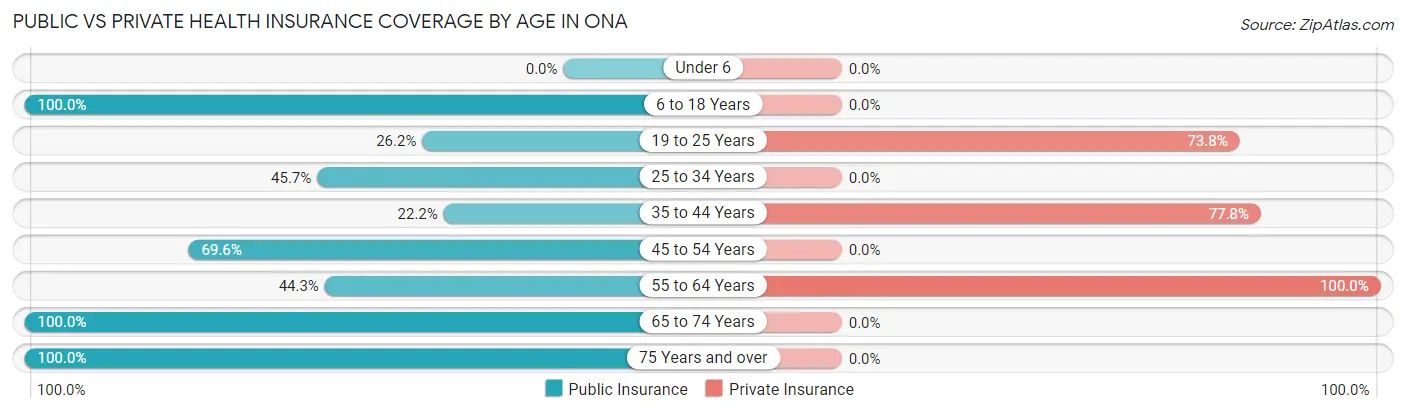
| Age Bracket | Public Insurance | Private Insurance |
| Under 6 | 0 (0.0%) | 0 (0.0%) |
| 6 to 18 Years | 132 (100.0%) | 0 (0.0%) |
| 19 to 25 Years | 11 (26.2%) | 31 (73.8%) |
| 25 to 34 Years | 32 (45.7%) | 0 (0.0%) |
| 35 to 44 Years | 16 (22.2%) | 56 (77.8%) |
| 45 to 54 Years | 16 (69.6%) | 0 (0.0%) |
| 55 to 64 Years | 35 (44.3%) | 79 (100.0%) |
| 65 to 74 Years | 11 (100.0%) | 0 (0.0%) |
| 75 Years and over | 6 (100.0%) | 0 (0.0%) |
| Total | 259 (59.5%) | 166 (38.2%) |
Disability Status by Sex by Age in Ona
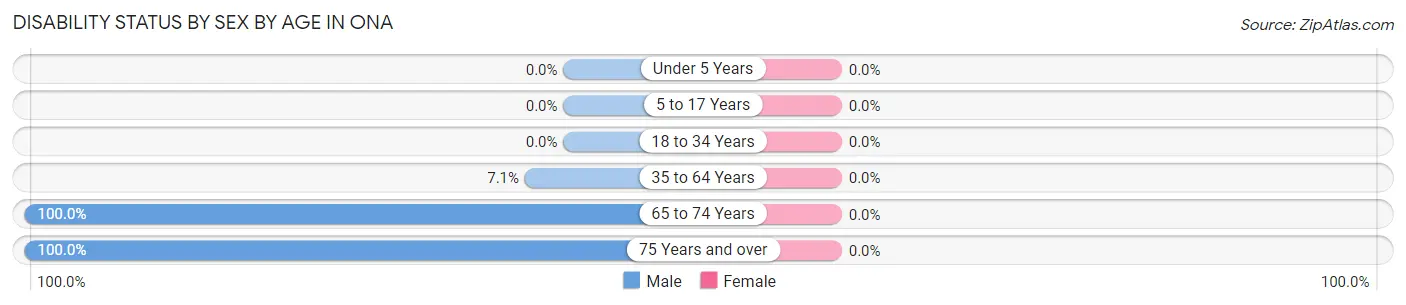
| Age Bracket | Male | Female |
| Under 5 Years | 0 (0.0%) | 0 (0.0%) |
| 5 to 17 Years | 0 (0.0%) | 0 (0.0%) |
| 18 to 34 Years | 0 (0.0%) | 0 (0.0%) |
| 35 to 64 Years | 7 (7.1%) | 0 (0.0%) |
| 65 to 74 Years | 11 (100.0%) | 0 (0.0%) |
| 75 Years and over | 3 (100.0%) | 0 (0.0%) |
Disability Class by Sex by Age in Ona
Disability Class: Hearing Difficulty
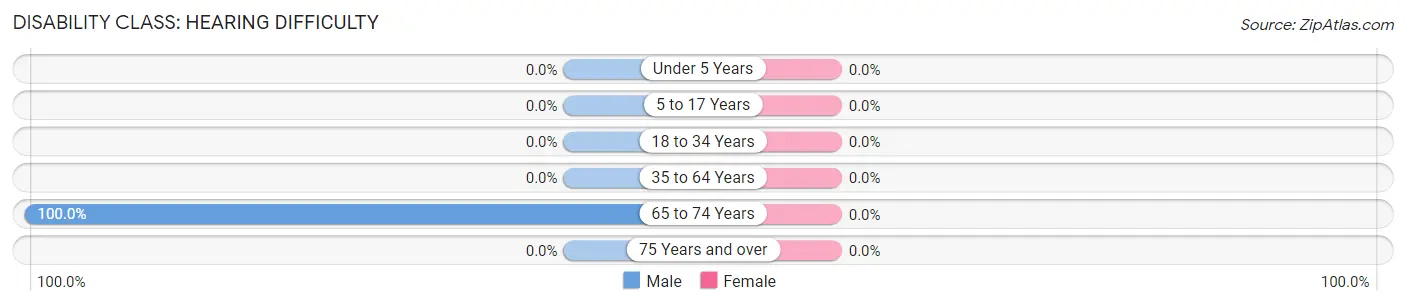
| Age Bracket | Male | Female |
| Under 5 Years | 0 (0.0%) | 0 (0.0%) |
| 5 to 17 Years | 0 (0.0%) | 0 (0.0%) |
| 18 to 34 Years | 0 (0.0%) | 0 (0.0%) |
| 35 to 64 Years | 0 (0.0%) | 0 (0.0%) |
| 65 to 74 Years | 11 (100.0%) | 0 (0.0%) |
| 75 Years and over | 0 (0.0%) | 0 (0.0%) |
Disability Class: Vision Difficulty
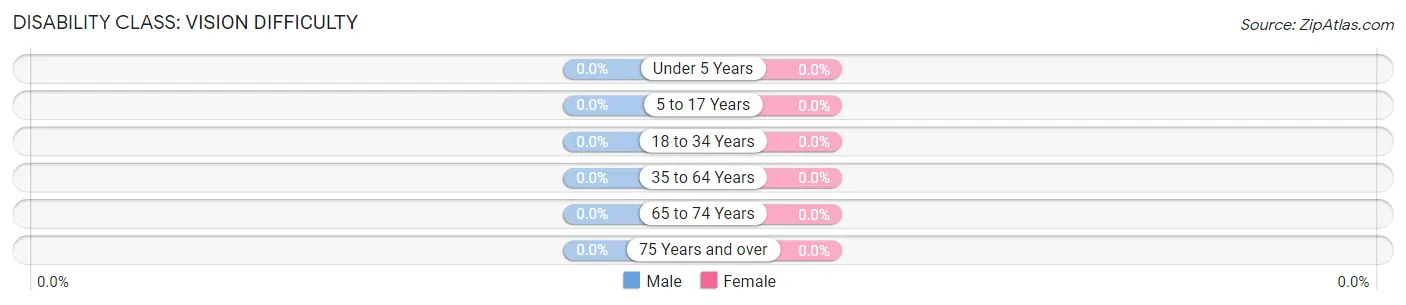
| Age Bracket | Male | Female |
| Under 5 Years | 0 (0.0%) | 0 (0.0%) |
| 5 to 17 Years | 0 (0.0%) | 0 (0.0%) |
| 18 to 34 Years | 0 (0.0%) | 0 (0.0%) |
| 35 to 64 Years | 0 (0.0%) | 0 (0.0%) |
| 65 to 74 Years | 0 (0.0%) | 0 (0.0%) |
| 75 Years and over | 0 (0.0%) | 0 (0.0%) |
Disability Class: Cognitive Difficulty
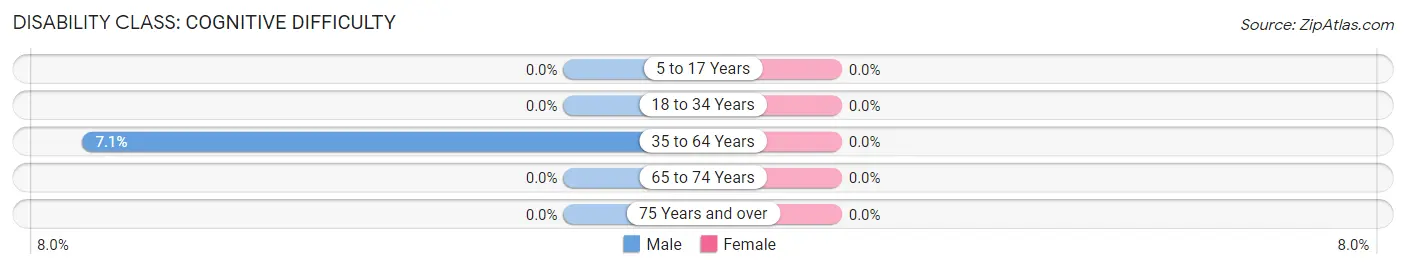
| Age Bracket | Male | Female |
| 5 to 17 Years | 0 (0.0%) | 0 (0.0%) |
| 18 to 34 Years | 0 (0.0%) | 0 (0.0%) |
| 35 to 64 Years | 7 (7.1%) | 0 (0.0%) |
| 65 to 74 Years | 0 (0.0%) | 0 (0.0%) |
| 75 Years and over | 0 (0.0%) | 0 (0.0%) |
Disability Class: Ambulatory Difficulty
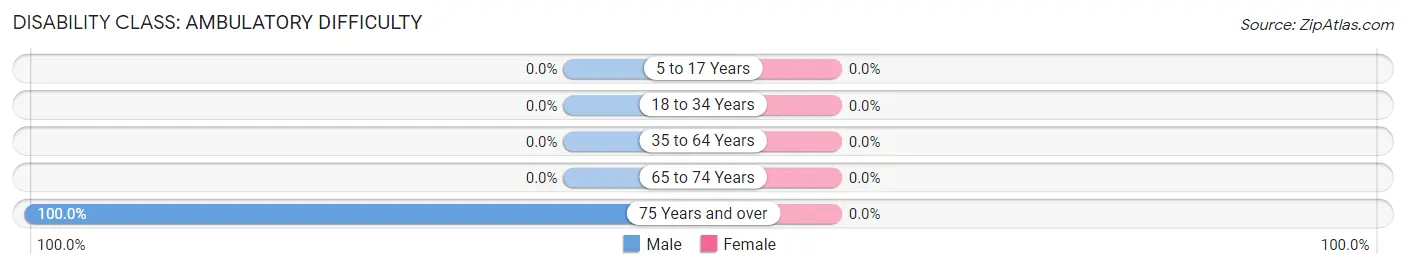
| Age Bracket | Male | Female |
| 5 to 17 Years | 0 (0.0%) | 0 (0.0%) |
| 18 to 34 Years | 0 (0.0%) | 0 (0.0%) |
| 35 to 64 Years | 0 (0.0%) | 0 (0.0%) |
| 65 to 74 Years | 0 (0.0%) | 0 (0.0%) |
| 75 Years and over | 3 (100.0%) | 0 (0.0%) |
Disability Class: Self-Care Difficulty
| Age Bracket | Male | Female |
| 5 to 17 Years | 0 (0.0%) | 0 (0.0%) |
| 18 to 34 Years | 0 (0.0%) | 0 (0.0%) |
| 35 to 64 Years | 0 (0.0%) | 0 (0.0%) |
| 65 to 74 Years | 0 (0.0%) | 0 (0.0%) |
| 75 Years and over | 0 (0.0%) | 0 (0.0%) |
Technology Access in Ona
Computing Device Access in Ona
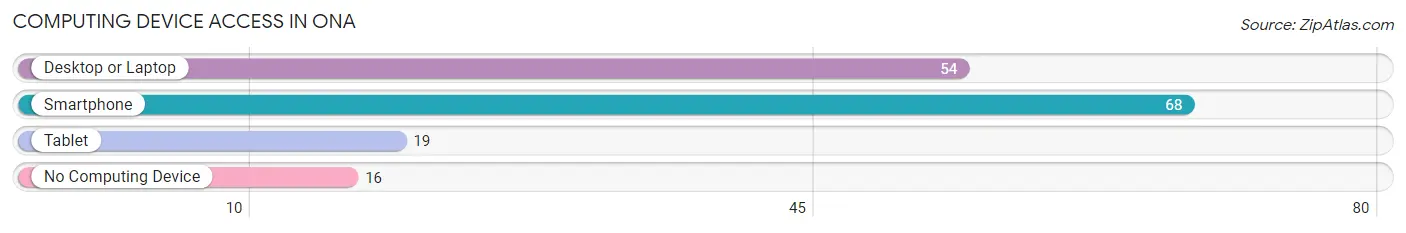
| Device Type | # Households | % Households |
| Desktop or Laptop | 54 | 64.3% |
| Smartphone | 68 | 80.9% |
| Tablet | 19 | 22.6% |
| No Computing Device | 16 | 19.1% |
| Total | 84 | 100.0% |
Internet Access in Ona
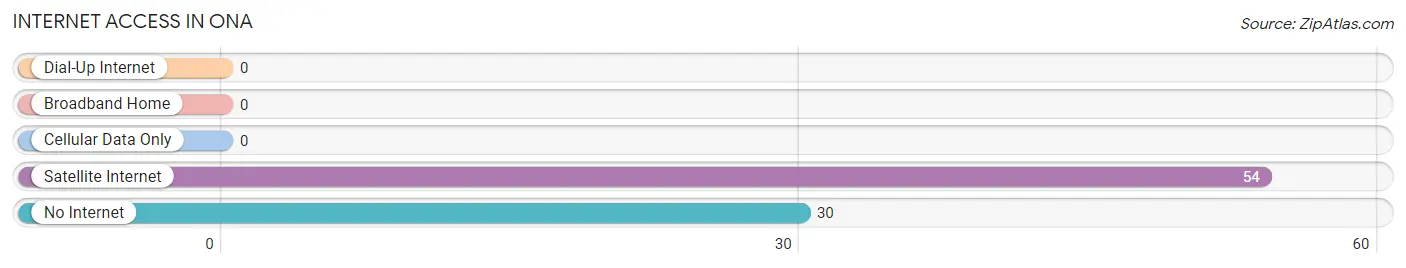
| Internet Type | # Households | % Households |
| Dial-Up Internet | 0 | 0.0% |
| Broadband Home | 0 | 0.0% |
| Cellular Data Only | 0 | 0.0% |
| Satellite Internet | 54 | 64.3% |
| No Internet | 30 | 35.7% |
| Total | 84 | 100.0% |
Ona Summary
Ona is an unincorporated community located in Hardee County, Florida, United States. It is located on the Peace River, approximately 10 miles (16 km) east of Wauchula. Ona is part of the Bradenton–Sarasota–Venice Metropolitan Statistical Area.
Geography
Ona is located at 27°45'25" North, 81°50'45" West (27.756944, -81.845556). The elevation is 40 feet (12 m).
Ona is located in Hardee County, Florida, approximately 10 miles (16 km) east of Wauchula. It is part of the Bradenton–Sarasota–Venice Metropolitan Statistical Area. The Peace River runs through the area, and the community is located on the banks of the river.
History
Ona was first settled in the late 1800s by settlers from the nearby town of Wauchula. The town was named after the daughter of one of the settlers, Ona May. The town was officially established in 1891.
In the early 1900s, Ona was a thriving agricultural community, with citrus groves, vegetable farms, and cattle ranches. The town also had a sawmill, a grist mill, and a turpentine still.
In the 1920s, the town began to decline as the citrus industry in the area began to suffer from freezes and disease. The Great Depression also had a negative impact on the town.
In the 1940s, the town began to revive as the citrus industry recovered and the population began to grow. The town also became a popular tourist destination, with visitors coming to fish and hunt in the area.
Economy
Ona’s economy is largely based on agriculture. The town is home to several citrus groves, vegetable farms, and cattle ranches. The town also has a sawmill, a grist mill, and a turpentine still.
In addition to agriculture, Ona is home to several small businesses, including a gas station, a convenience store, and a restaurant.
Demographics
As of the 2010 census, Ona had a population of 1,093. The racial makeup of the town was 94.3% White, 2.2% African American, 0.7% Native American, 0.3% Asian, 0.1% Pacific Islander, 0.9% from other races, and 1.5% from two or more races. Hispanic or Latino of any race were 4.2% of the population.
The median household income in Ona was $37,917, and the median family income was $45,313. The per capita income was $17,945. About 11.3% of families and 14.2% of the population were below the poverty line, including 18.2% of those under age 18 and 8.3% of those age 65 or over.
Common Questions
What is Per Capita Income in Ona?
Per Capita income in Ona is $24,764.
What is Inequality or Gini Index in Ona?
Inequality or Gini Index in Ona is 0.43.
What is the Total Population of Ona?
Total Population of Ona is 435.
What is the Total Male Population of Ona?
Total Male Population of Ona is 209.
What is the Total Female Population of Ona?
Total Female Population of Ona is 226.
What is the Ratio of Males per 100 Females in Ona?
There are 92.48 Males per 100 Females in Ona.
What is the Ratio of Females per 100 Males in Ona?
There are 108.13 Females per 100 Males in Ona.
What is the Median Population Age in Ona?
Median Population Age in Ona is 34.3 Years.
What is the Average Family Size in Ona
Average Family Size in Ona is 5.7 People.
What is the Average Household Size in Ona
Average Household Size in Ona is 5.1 People.
How Large is the Labor Force in Ona?
There are 236 People in the Labor Forcein in Ona.
What is the Percentage of People in the Labor Force in Ona?
68.4% of People are in the Labor Force in Ona.