Zip Codes with the Highest Percentage of Population Employed in Food Preparation & Serving in Boynton Beach, FL
RELATED REPORTS & OPTIONS
Food Preparation & Serving
Boynton Beach
Compare Zip Codes
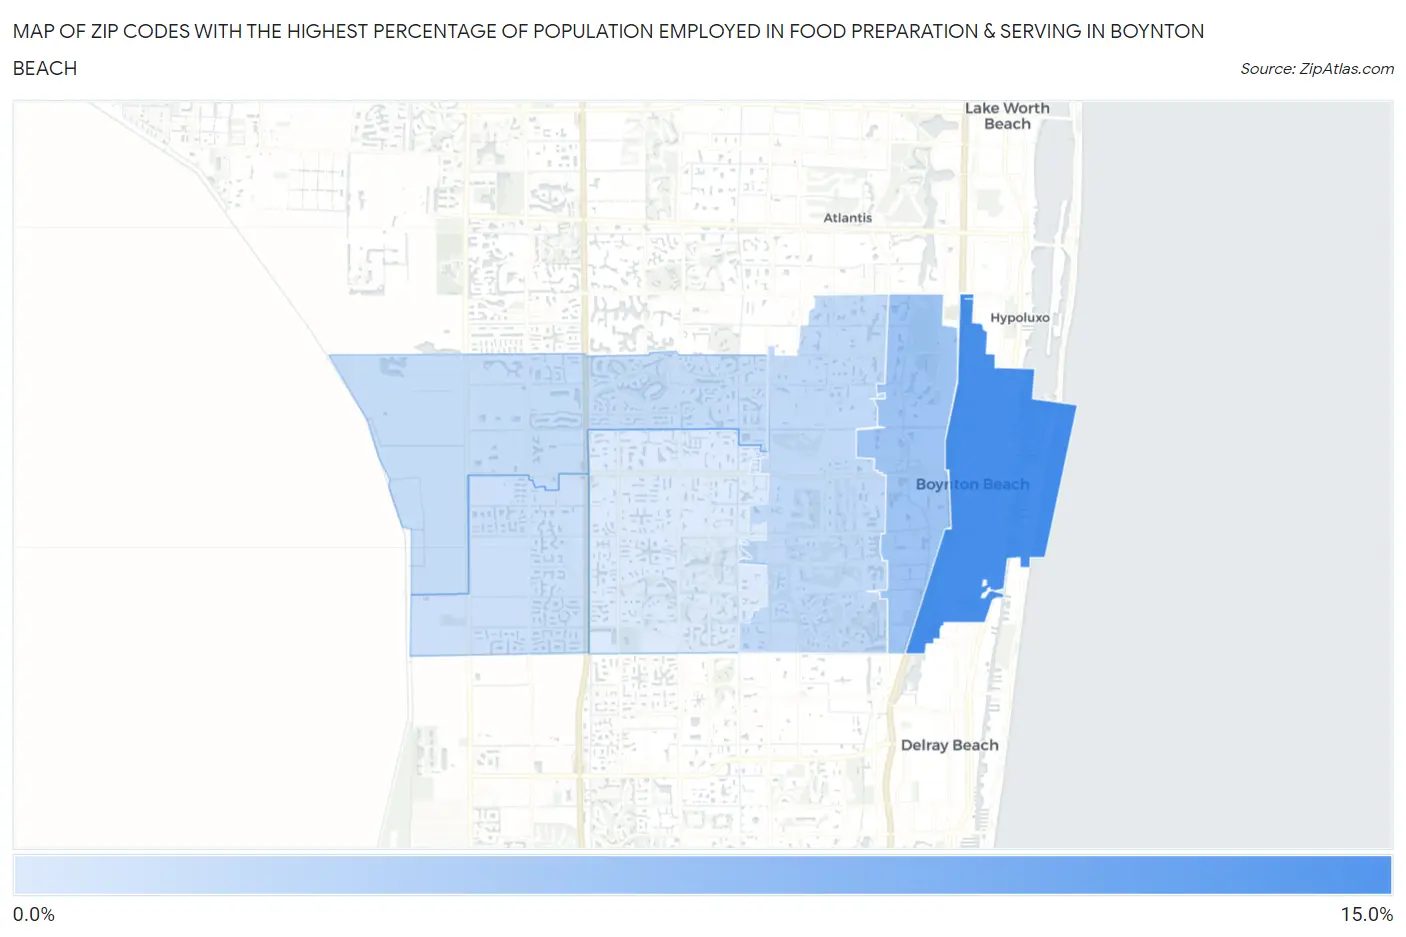
Map of Zip Codes with the Highest Percentage of Population Employed in Food Preparation & Serving in Boynton Beach
2.9%
14.7%
Zip Codes with the Highest Percentage of Population Employed in Food Preparation & Serving in Boynton Beach, FL
| Zip Code | % Employed | vs State | vs National | |
| 1. | 33435 | 14.7% | 6.1%(+8.61)#22 | 5.3%(+9.41)#1,031 |
| 2. | 33426 | 7.6% | 6.1%(+1.53)#241 | 5.3%(+2.33)#5,352 |
| 3. | 33436 | 5.1% | 6.1%(-1.04)#593 | 5.3%(-0.235)#12,739 |
| 4. | 33472 | 4.7% | 6.1%(-1.41)#646 | 5.3%(-0.601)#14,222 |
| 5. | 33473 | 4.2% | 6.1%(-1.88)#696 | 5.3%(-1.08)#16,294 |
| 6. | 33437 | 2.9% | 6.1%(-3.15)#824 | 5.3%(-2.34)#21,467 |
1
Common Questions
What are the Top 5 Zip Codes with the Highest Percentage of Population Employed in Food Preparation & Serving in Boynton Beach, FL?
Top 5 Zip Codes with the Highest Percentage of Population Employed in Food Preparation & Serving in Boynton Beach, FL are:
What zip code has the Highest Percentage of Population Employed in Food Preparation & Serving in Boynton Beach, FL?
33435 has the Highest Percentage of Population Employed in Food Preparation & Serving in Boynton Beach, FL with 14.7%.
What is the Percentage of Population Employed in Food Preparation & Serving in Boynton Beach, FL?
Percentage of Population Employed in Food Preparation & Serving in Boynton Beach is 9.9%.
What is the Percentage of Population Employed in Food Preparation & Serving in Florida?
Percentage of Population Employed in Food Preparation & Serving in Florida is 6.1%.
What is the Percentage of Population Employed in Food Preparation & Serving in the United States?
Percentage of Population Employed in Food Preparation & Serving in the United States is 5.3%.