Zip Codes with the Highest Percentage of Population Employed in Food Preparation & Serving in Clermont, FL
RELATED REPORTS & OPTIONS
Food Preparation & Serving
Clermont
Compare Zip Codes
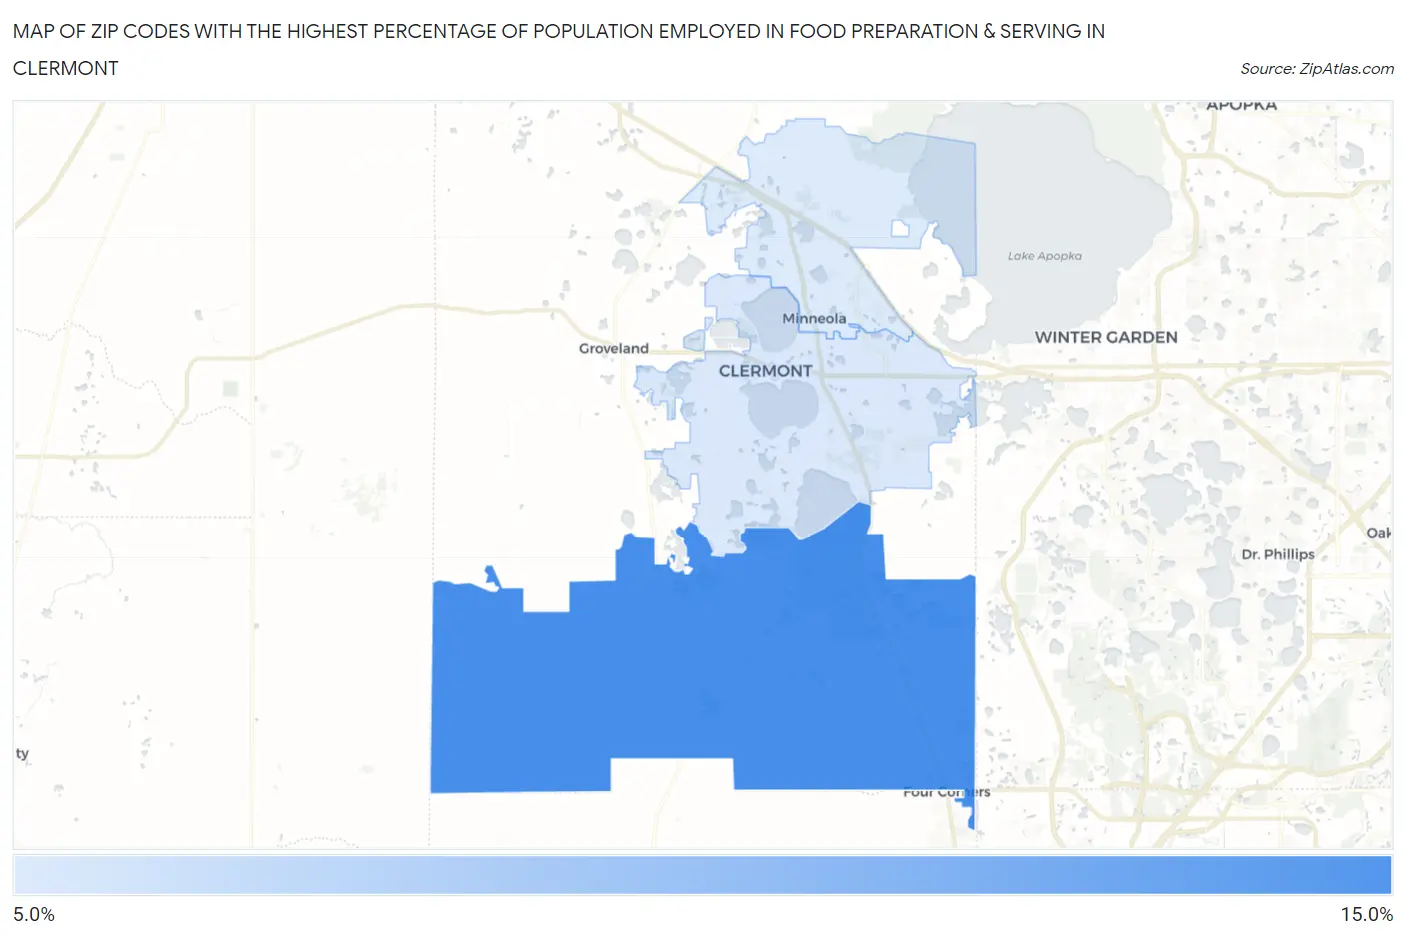
Map of Zip Codes with the Highest Percentage of Population Employed in Food Preparation & Serving in Clermont
5.8%
13.0%
Zip Codes with the Highest Percentage of Population Employed in Food Preparation & Serving in Clermont, FL
| Zip Code | % Employed | vs State | vs National | |
| 1. | 34714 | 13.0% | 6.1%(+6.93)#32 | 5.3%(+7.73)#1,389 |
| 2. | 34711 | 5.9% | 6.1%(-0.220)#479 | 5.3%(+0.585)#9,780 |
| 3. | 34715 | 5.8% | 6.1%(-0.282)#487 | 5.3%(+0.523)#10,006 |
1
Common Questions
What are the Top Zip Codes with the Highest Percentage of Population Employed in Food Preparation & Serving in Clermont, FL?
Top Zip Codes with the Highest Percentage of Population Employed in Food Preparation & Serving in Clermont, FL are:
What zip code has the Highest Percentage of Population Employed in Food Preparation & Serving in Clermont, FL?
34714 has the Highest Percentage of Population Employed in Food Preparation & Serving in Clermont, FL with 13.0%.
What is the Percentage of Population Employed in Food Preparation & Serving in Clermont, FL?
Percentage of Population Employed in Food Preparation & Serving in Clermont is 5.1%.
What is the Percentage of Population Employed in Food Preparation & Serving in Florida?
Percentage of Population Employed in Food Preparation & Serving in Florida is 6.1%.
What is the Percentage of Population Employed in Food Preparation & Serving in the United States?
Percentage of Population Employed in Food Preparation & Serving in the United States is 5.3%.