Zip Codes with the Highest Percentage of Population Employed in Food Preparation & Serving in Merritt Island, FL
RELATED REPORTS & OPTIONS
Food Preparation & Serving
Merritt Island
Compare Zip Codes
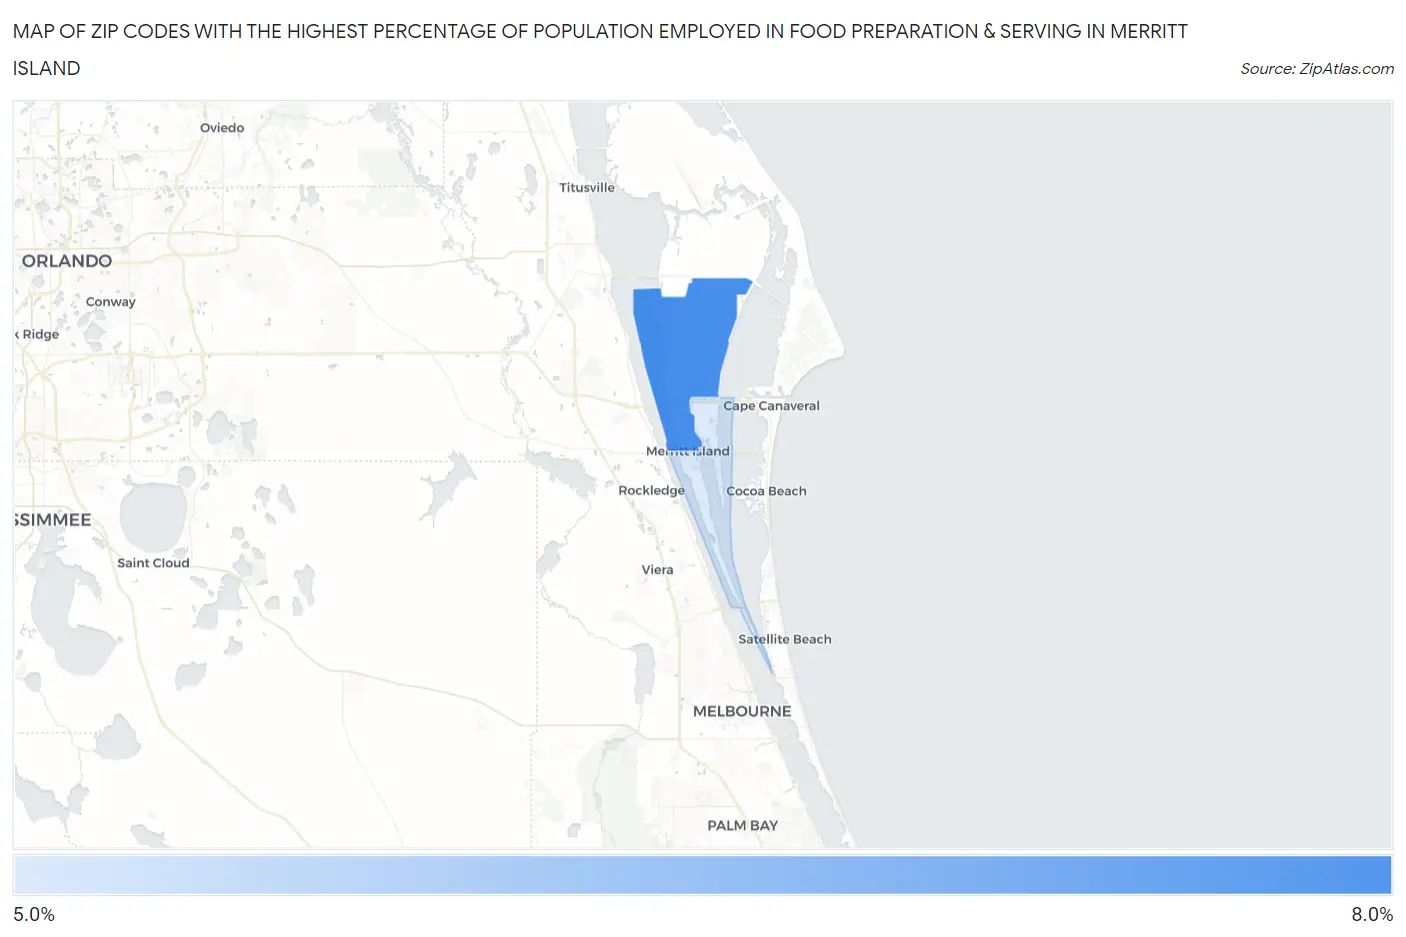
Map of Zip Codes with the Highest Percentage of Population Employed in Food Preparation & Serving in Merritt Island
5.3%
6.9%
Zip Codes with the Highest Percentage of Population Employed in Food Preparation & Serving in Merritt Island, FL
| Zip Code | % Employed | vs State | vs National | |
| 1. | 32953 | 6.9% | 6.1%(+0.815)#327 | 5.3%(+1.62)#6,800 |
| 2. | 32952 | 5.3% | 6.1%(-0.789)#552 | 5.3%(+0.015)#11,759 |
1
Common Questions
What are the Top Zip Codes with the Highest Percentage of Population Employed in Food Preparation & Serving in Merritt Island, FL?
Top Zip Codes with the Highest Percentage of Population Employed in Food Preparation & Serving in Merritt Island, FL are:
What zip code has the Highest Percentage of Population Employed in Food Preparation & Serving in Merritt Island, FL?
32953 has the Highest Percentage of Population Employed in Food Preparation & Serving in Merritt Island, FL with 6.9%.
What is the Percentage of Population Employed in Food Preparation & Serving in Merritt Island, FL?
Percentage of Population Employed in Food Preparation & Serving in Merritt Island is 6.1%.
What is the Percentage of Population Employed in Food Preparation & Serving in Florida?
Percentage of Population Employed in Food Preparation & Serving in Florida is 6.1%.
What is the Percentage of Population Employed in Food Preparation & Serving in the United States?
Percentage of Population Employed in Food Preparation & Serving in the United States is 5.3%.